
Abstract
This study reports the energy specific air emissions from a diesel-cycle high pressure injection dual fuel engine for operation on liquefied natural gas and heavy fuel oil. An experiment at sea was performed onboard a bulk carrier during commercial voyages, to measure the efficiency of the engine and to measure air emissions relevant to air pollution and climate impact for operation on both fuels. The measurements showed that the energy conversion efficiency of the engine was higher for operation on liquefied natural gas because its lower NOx emissions permitted the use of a higher effective compression ratio whilst meeting the same NOx emissions level. The results showed that the climate impact for operation on heavy fuel oil was 2.1–2.3 times higher than for liquefied natural gas at 50% load, if considering only the emissions occurring at the engine. Analysis of the air emissions for their individual contributions to climate impacts suggested that black carbon had the strongest climate impact of all air emissions in the case of operation on heavy fuel oil. For operation on liquefied natural gas, CO2 had the strongest individual climate impact amongst the air emissions from the engine.
Keywords
Introduction
The United Nations Framework Convention on Climate Change has set the aim of limiting global average temperature to 1.5°C above pre-industrial levels under the Paris Agreement. 1 To align itself with this goal, the International Maritime Organization (IMO) has developed an initial strategy for phasing out Green House Gas (GHG) emissions from international shipping before the end of the 21st century. 2 As part of this strategy, technical, and operational measures are being put in place to reduce the carbon intensity of international shipping in terms of GHG emissions per transport work. A mid-term target for reducing the carbon intensity of shipping by 40% has been set at for the year 2030, and a long-term target for reducing carbon intensity by 70% reduction has been set for 2050. 2
According to the IMO Fourth GHG Study, GHG emissions of total shipping have increased from 977 million tonnes in 2012 to 1076 million tonnes in 2018 (9.6% increase). 3 There is a significant range of technical solutions to achieve a reduction of GHG emissions in short-sea shipping, which are mostly dominated by high-speed engines and electrification. In deep-sea shipping, the IMO GHG reduction goals for 2030 and 2050 require the integration of both operational efficiency and technical energy efficiency with various systems involving engines, waste heat recovery systems, fuel cells, batteries, and renewables (solar, wind). Wind propulsion may have the potential to make a major impact on reducing emissions, 4 but for applications that need to maintain a certain speed and schedule, the Internal Combustion Engine (ICE) is likely to remain as the major prime mover in future maritime propulsion systems as well as the major source of electricity onboard the ship. Thus, the transition to fuels with a low or zero carbon footprint is essential. The use of potential net carbon zero fuels from renewable energy sources are promising for future ship propulsion. Given the current perspective of the-state-of-the-art technology, hydrogen, ammonia, or sustainable biofuels with a (net) zero carbon footprint is the desirable goal product for the main future fuels in shipping. However, the practical use of these fuels still requires coping with substantial technical challenges and economic development, thus paving the way for intermediate fuels such as Liquefied Natural Gas (LNG). LNG requires the ICE to be further developed for fuel flexibility. 5 LNG can be regarded as a potentially renewable fuel, if produced from renewable sources.6,7 Power to Gas benefits from no sulfur content and emits less air pollutants such as nitrogen oxides (NOx) and particulate matter (PM) during combustion than other fossil fuels. LNG is known to potentially produce higher overall thermal efficiency and contains negligible amount of sulfur. This avoids the chemical reaction that Sulfur Oxides (SOx) has in ship’s emission, which is formed when a fuel containing sulfur is burnt in the presence of oxygen during combustion. 8 This provides higher flexibility and freedom to use exhaust gas energy, utilizing exhaust gas boiler and Organic Rankine cycle.
Large two-stroke ICEs are the dominating power source for shipping. LNG is a stable and reliable fuel besides the fact that it requires cryogenic fluid dynamics and special storage. However, respective technologies are well developed and broadly available. The combustion of LNG as a marine fuel for large two-stroke ICE is still a challenge in terms of how to optimize the combustion. Low pressure dual fuel (LPDF) engines aspiring pre-mixed natural gas with air, based on Otto cycle combustion, can be a technologically simple solution in terms of combustion and relatively simple to comply with Tier III NOx emissions levels due to lower formation of NOx in lean premixed combustion mode. However, LPDF engines produce a methane slip during the overlap process of pre-mixture of gas and air during intake and exhaust process. A high pressure dual fuel (HPDF) engine would be a better solution in terms of methane slip, since the fuel is burned under near stoichiometric conditions under mixing-controlled conditions directly ensuing injection, thereby having a higher combustion efficiency according to the respective studies. 9 Jang et al. showed that when considering extraction, pipeline supply of LNG, dispensing and use on-board a vessel, high pressure dual fuel (HPDF) engines are the only ones having a lower climate impact than engines fueled with conventional diesel fuel. 10 However, HPDF engines cause the formation of higher amounts of NOx as the result of mixing-controlled combustion used in the Diesel cycle. ICEs powered by LNG must be further developed, in order to achieve the highest efficiency with minimum methane slip and minimum NOx emission. A number of modeling studies have been published on LNG applications in marine two-stroke engines. 11 However, it appears that currently there exist no studies measuring the performance and emissions of LNG fueled two-stroke marine HPDF engines sailing at sea in real conditions – commercial voyages for deep sea shipping, in particular those including Unburned Hydro-Carbon (UHC) and PM measurements have been published.12,13 This is an essential piece of information in measuring the energy efficiency of HPDF engine technology especially when assessing the life-cycle impact of energy production on climate. The lack of real engine measurement data available for low-speed HPDF engines, is highlighted by the study of Jang et al., using emissions factors from the engine designers 10 to study their life-cycle climate impact. This study aims to provide experimentally measured data for a HPDF engine as propulsion system that is, engine with shafting and propeller on actual ship, contributing with independent real operational data at sea condition with propulsion system behaviors. Engine running at sea in real life is dynamic owing to the resistance on hull and propeller depending on the sea and weather condition often result as discrepancy of measurements between engine operation at shop test and one at sea condition. It is a challenge how to close the gap to the reference based on shop test despite of different layout of equipment which impact on performance parameters as well as methane slip, NOx, PM, leakage coming from injector tips etc. It is important to have measurements through different ways, independently and to validate measurements.
This study reports air pollutant and greenhouse gas measurements of a HPDF engine sailing on a bulk carrier. Specifically, it analyzes the performance of LNG in terms of efficiency, air pollutants and GHG emissions. Measurements are compared with those of the engine operating in conventional heavy fuel oil (HFO) mode versus LNG fuel on the commercial voyage. The measurements include UHC, CO, CO2, NOx and PM and aim to provide a better understanding of the engine efficiency and actual GHG emissions to help in developing strategies for reducing GHG emissions. It includes the estimation of climate impact from black carbon soot aerosol emissions, which is often neglected in previous studies considering the climate impact of LNG from engines, considering only CO2, CH4, and N2O impacts. 14 This study provides an original contribution by reporting for the first time air pollutant and greenhouse gas emissions from a large 2-stroke HPDF diesel engine operating at sea on HFO and LNG and calculates the energy efficiency and energy-specific climate impact from the individual air-emissions components.
Materials and methods
Ship and engine description
The vessel used for this experiment was the MV “Ilshin Green Iris,” a 50,655dwt bulk carrier built to transport limestone cargoes in the coastal trade as shown on Figure 1. A single 2-stroke engine (MAN B&W 6G50ME-GI) powers the vessel, which has been verified to be in compliance with the International Gas Fuel (IGF) Code by Lloyds Register and Korean Register as the first application of this code (HMD, POSCO and ILSHIN LOGISTICS Collaborate, 2016). The engine featured a state-of-the-art HPDF engine capable to be operated on both HFO and LNG. High manganese (High-Mn) steel, the new type of cryogenic steel 15 developed by POSCO was used for the type “C” fuel tank of 500 m3 LNG on the mooring deck aft as shown on Figure 2. On the voyage during which the measurements were taken, the MV Ilshin Green Iris was chartered to sail between the two ports that is, Dong-Hae port (37°31′N/129°06′E) for loading limestone to Gwang-Yang port (34°56′N/127°42′E) for discharging cargo for steel mill.
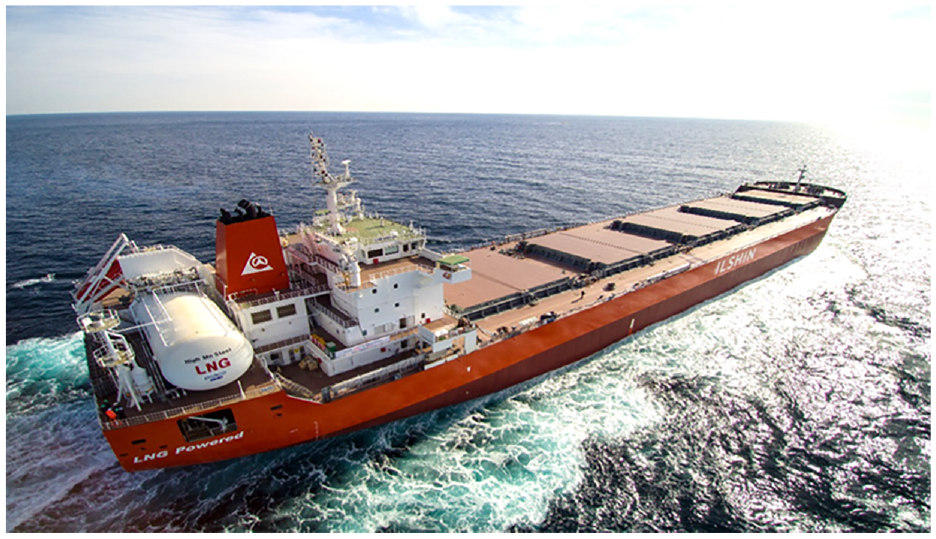
MV “Ilshin Green Iris,” 50,655 DWT Limestone Carrier, the World’s first IGF Code LNG fueled ship (Ilshin Logistics & Shipping).
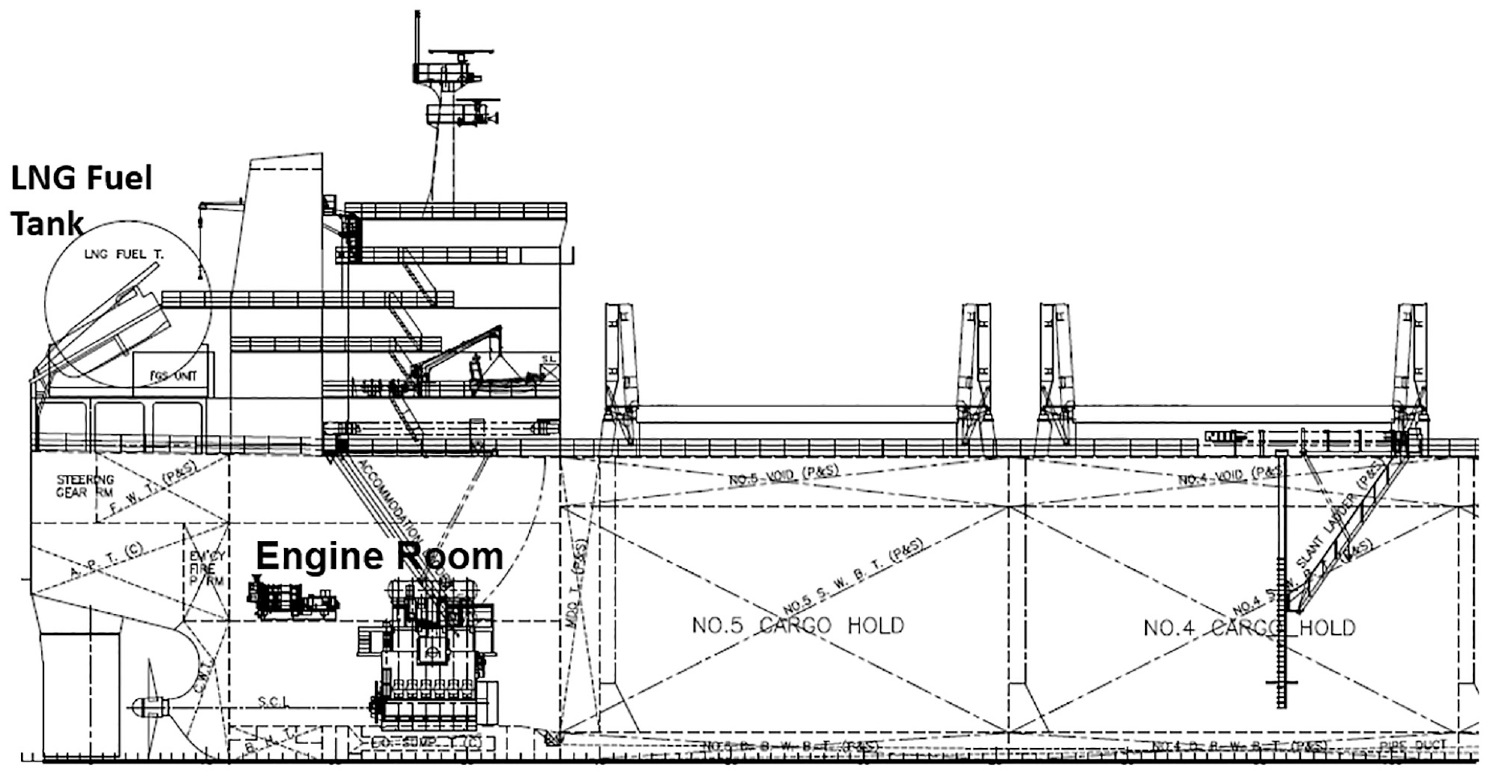
MV “Ilshin Green Iris,” Ship and Engine Room Layout.
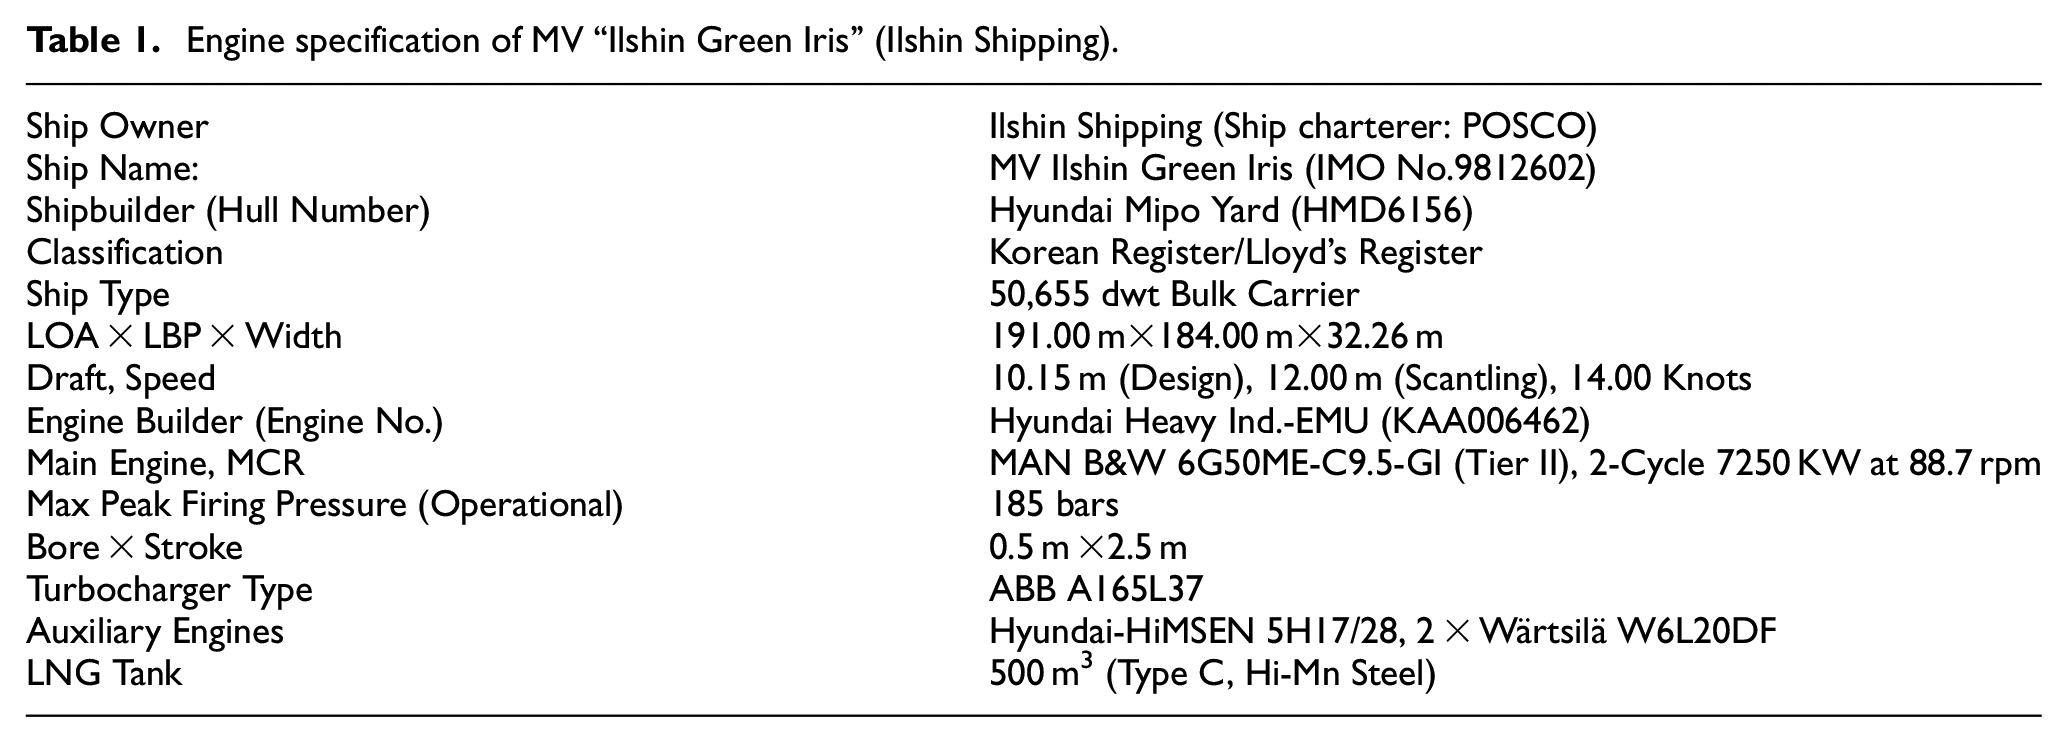
The vessel used for this investigation was equipped with a HPDF single 2-stroke engine (MAN B&W 6G50ME-GI type) and LPDF 4-stroke auxiliary engines described principal particular of the ship and engine specification as shown in Table 1.
Engine specification of MV “Ilshin Green Iris” (Ilshin Shipping).
Data acquisition
The ship, MV “Ilshin Green Iris” has extensive possibilities to gather data, which was used in order to determine vessel behavior as well as engine performance further to examine potential ship operation optimization. This architecture as shown on Figure 3 and their data were used for this study to achieve specified research targets.
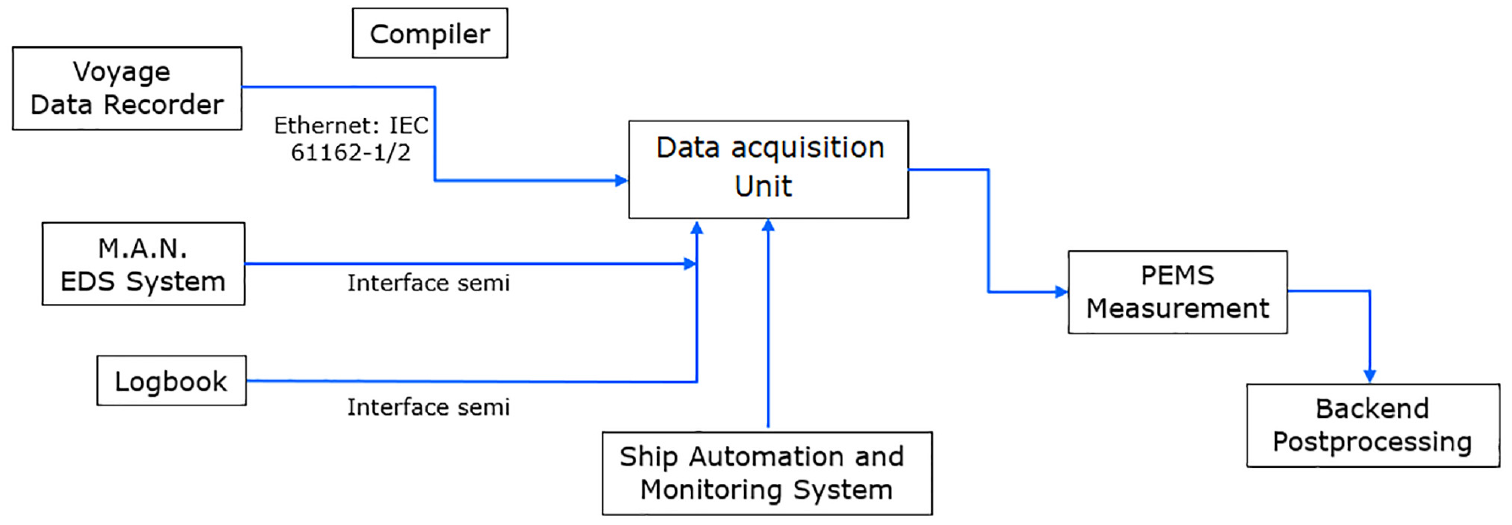
Layout of data acquisition for variable data source and PEM (AVL List GmbH and Ilshin Shipping).
Scope of work
This study examined the performance behavior and compared emission data of the main engine while powered by LNG fuel and liquid fuel that is, HFO. Therefore, data from trial test results of the 2-stroke main engine as well as available auto-log data of MV “Ilshin Green Iris” voyage between Dong-Hae port and Gwang-Yang port were examined. An overview of the scope of work is provided as follows:
Measurements of engine power
Measurements and analysis of emission data
Setup of energy/mass balanced emission model of main engine
(Hyundai MAN B&W 6G50ME-C9.5-GI)
Quantification of the “Tank-to-Wake” GHG and pollutant emission from a Diesel-Cycle LNG powered vessel during practical (Commercial) voyage operation.
Measuring apparatus and installation
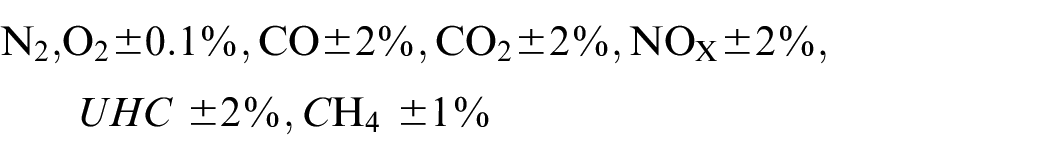
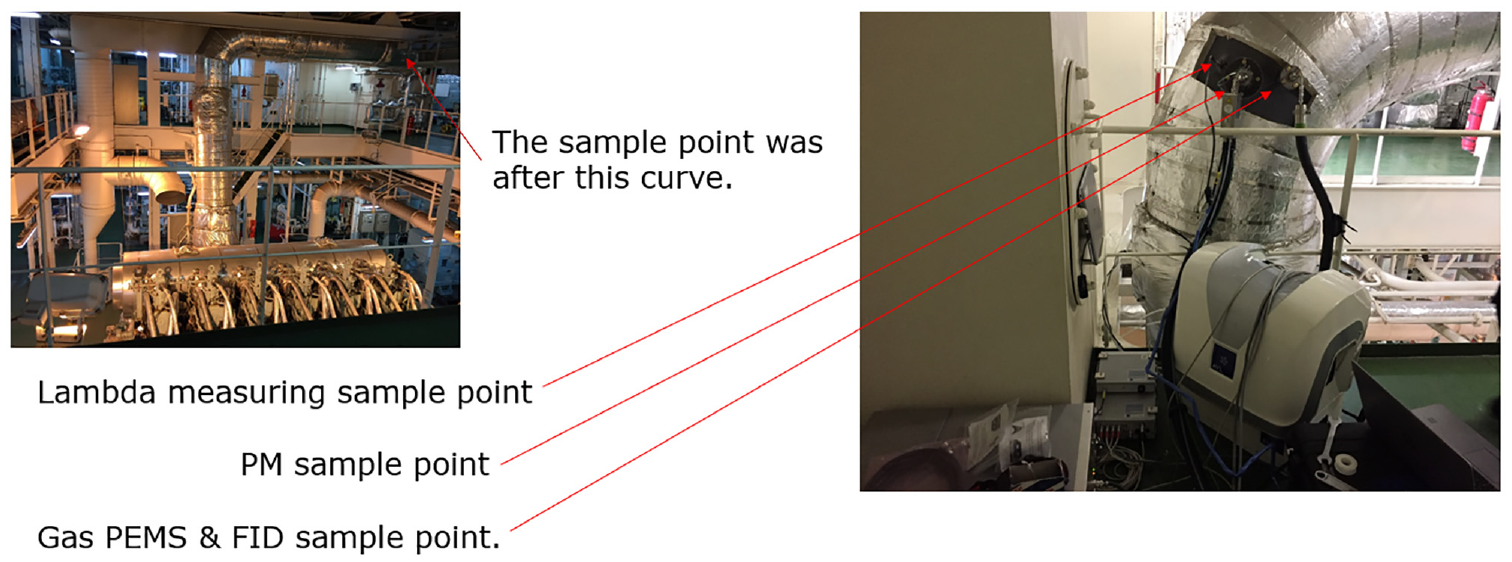
Three measuring instruments as shown on Figure 4 were installed at the main engine exhaust immediately after the turbocharger outlet pipe for the measurement of emission and particle mass at HFO and LNG mode in addition to engine performance. These instrumentations measured the following parameters with the stated accuracy:
Gaseous emission measurement.
Emission measuring apparatus (AVL List GmbH and Ilshin Shipping).
Sensors and placement
Engine performance data was taken based on apparatus installed on board. (Please refer to Supplemental Data for the accuracy of sensors.) Lambda measurement and emission measurements were taken at the outlet of the turbocharger. In order to maximize the accuracy of measurements taken, three sample positions were established on the exhaust gas pipe after the turbocharger and installed permanent sampling pipes allowed for the installation of emissions measuring apparatus as shown on Figure 4.
An overview and the brief specification of the sensors can be found in the Supplemental Data.
Fuel properties
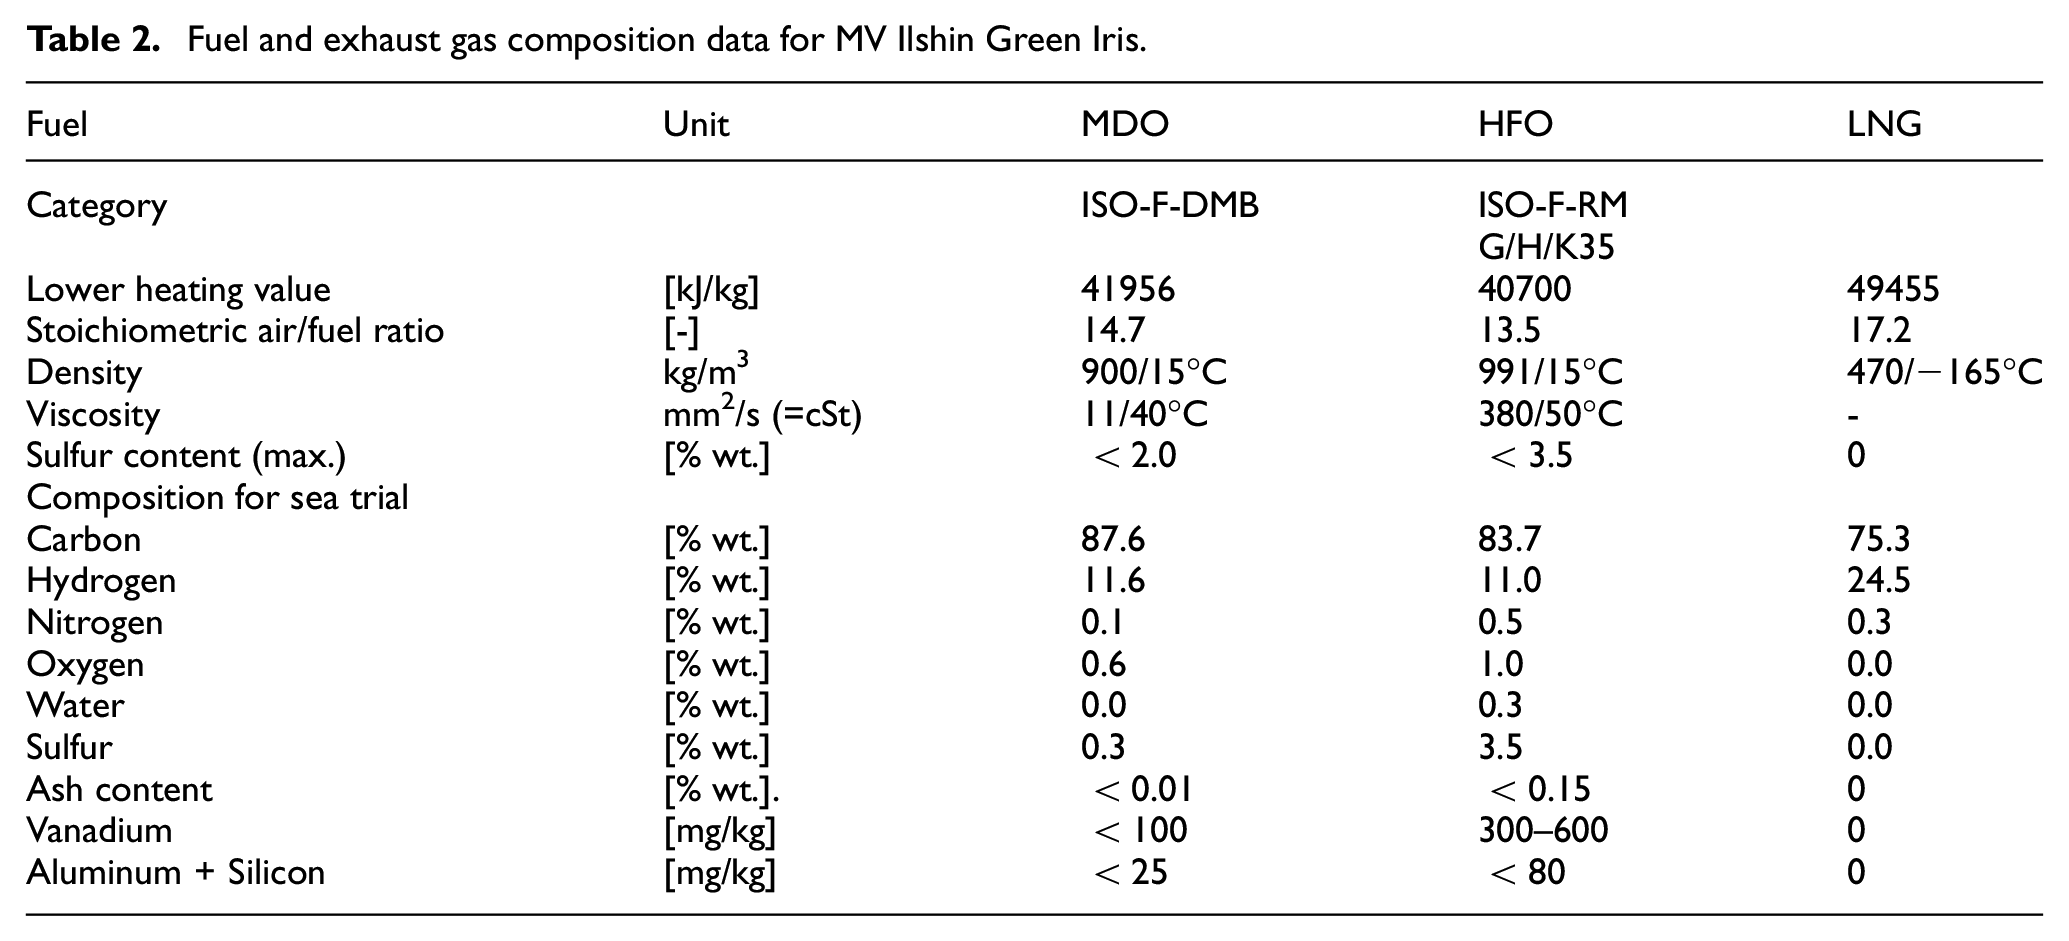
The ship used Marine Diesel Oil (MDO) for harbor maneuvering for the sake of engine load change without failure requested by shipowner and port authority in the port area until dual fuel operation will be proven for its reliable operation. Thus, switching to HFO or to LNG was only permitted for long voyage sailing. Fuel compositions for MDO, HFO, and LNG for the measurement are shown in Table 2.16,17
Fuel and exhaust gas composition data for MV Ilshin Green Iris.
There have been a several studies regarding future fuels for the deep-sea shipping. These studies examine possible alternatives, challenges and opportunities, production issues and under what circumstances marine fuels would become net carbon zero and cost-competitive in order to meet the GHG2050 target.18,19
LNG is Liquefied Natural Gas which is a fossil fuel and can be others like Biogas. 7 It is a naturally occurring hydrocarbon gas mixture consisting primarily of methane with a boiling temperature of −162°C. While natural gas can be viewed as a relatively clean burning fuel since it contains negligible amount of sulfur and creates fewer air pollutants such as sulfur oxides and particulate matter, natural gas itself has a global warming potential over 100 years of GWP100 = 28. 20 Hence the impact on the climate from LNG strongly depends on its leakage during extraction, processing, distribution, and use. 21 LNG as marine fuel offers significant emission advantages and its use is increasing in the marine transport sector according to the recent reports. 22
Measurement methods
Measurement onboard
For the sake of the accuracy and reliability of measurements, power measurement based on Pressure Measurement Instrument (PMI) system was set at four load points to be essentially stable prior to emission measurement. Two independent PMI systems were installed having data every 2 min in parallel with data logging from ship monitoring system. The run-time of engine was set for 30 min at four load points however varied in real measurement due to the sea condition in the range of 30–60 min in order to have engine load stable for measurements. For recording of measurements, it was set for 900 s equally for all load points picking up the most stable engine performance and the air emissions were sampled during the period. Air emissions were then average over the measured time, as was engine load, to yield the average energy-specific emissions over time. Emission measurements and Lamda measuring devices were installed as shown on Figure 4. For the sake of accuracy, measurements reference to load points have been compared to PMI as well as ship monitoring system independently installed. The thermodynamic system with transient in- and outflows can be represented by mass and energy balances. 23 The engine power and emissions measurements allowed the work-specific air emissions to be calculated. This was performed in order to compare measurements from different fuels (MDO, HFO, and LNG). The calculations were then used to evaluate the respective air pollution and GHG impact.
Engine trial test results and auto-log data of the ship MV “Ilshin Green Iris” including 2-stroke main engine were taken on the voyage between Dong-Hae port to the Gwang-Yang port. During the voyage, engine performance measurements, and emission measurements were recorded. Engine power on this experiment was taken from PMI system.
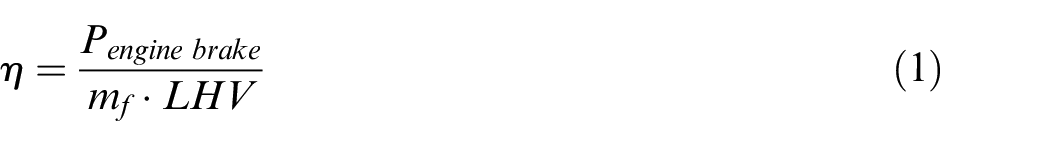
For this experiment, the brake thermal efficiency of the engine was measured using equation (1).
Power measurements at sea trial and ship in service are generally regarded to be difficult because it is dependent to hull/propeller and sea condition. The engine power measured at shop test is usually regarded as the most precise as it is measure by hydraulic dynamometer in the most stable and controlled condition at engine test shop. Thus, operating points of the engine shop test corresponding to the standard n3-propeller line are provided for comparison to performance parameters at sea in Figure 6.
Voyage
Experiments were performed during the ships sailing between Dong-Hae port to Gwang-Yang port in South Korea. Measurements of engine performance and emission in Diesel mode and gas mode were restricted to certain extent of the vessel operation according to the voyage plan and environmental conditions and sea state. Measurements were taken also within the limitations of safety precautions. The engine load profile and LNG fuel and MDO/HFO compositions were dependent on the fuels obtained according to the voyage plan. Figure 5 illustrates the sailing route during the experiment.
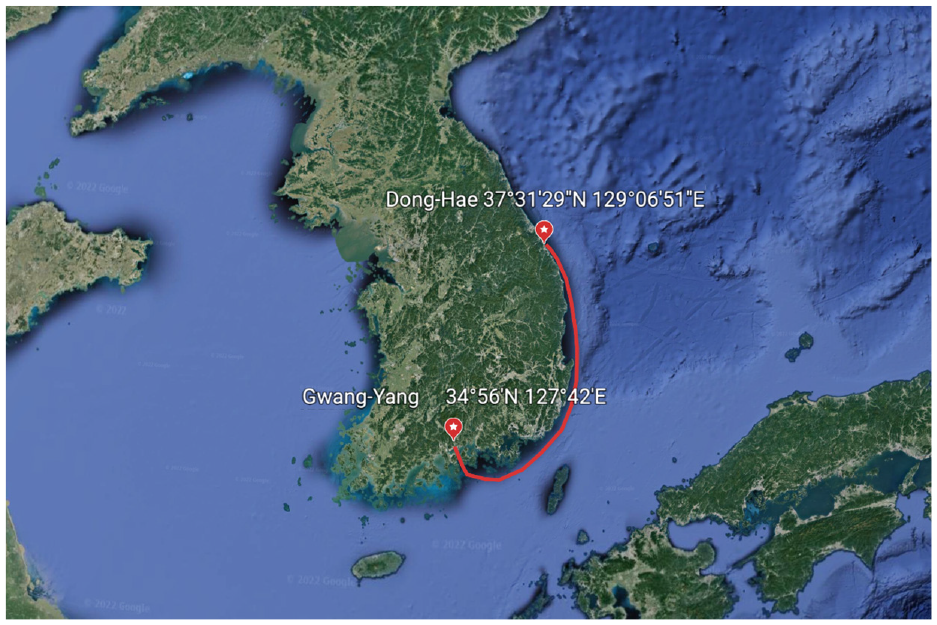
Voyage from Dong-Hae port to Gwang-Yang port.
The measurement and data collection were performed on the 9th October 2019 on the route from Dong-Hae to Gwang-Yang, South Korea, covering a distance of approximately 493 Kilo-meters (260 nautical miles). The voyage duration was 23.2 h and the average speed was 12.16 knots. The sea condition during the measurements was calm as wave level 3 from North-West/North direction and wind force level 3 from South/North direction under the ambient pressure of 1035 mbar during the measurements. The sea condition of wave and wind force for both measurements in diesel mode and in gas mode were the same (both consistently at level 3) except wind direction, allowing reasonable comparison and evaluation of emission measurements during voyage. (Please refer to Supplemental Data copied from navigation log.)
Climate impact calculation
Decarbonization
Carbon intensity refers to the CO2 emission relative to the transport work (Deadweight Tonnage × distance). Carbon intensity is currently regulated through the Energy Efficiency Design Index (EEDI) and studies to improve EEDI followed on innovative design aspects to optimize engine-to-propeller utilizing technology excellence such as shaft generator and waste heat recovery system etc.23,26
With the EEDI phase 3 decarbonization measures going into effect, a 30%–50% improvement in design performance for newbuilds is becoming mandatory in 2022 and 2025 depending on ship types and size. SEEMP must be introduced for all currently operating ships above 400 GT and fuel oil consumption Data Collection System (DCS) mandating annual reporting of CO2 emissions are required. 23
Energy Efficiency Existing Ship Index (EEXI)
The EEXI considers all CO2 emissions emitted for the entire ship operation (main and auxiliary engines) for the transport. The CO2 emissions are related to the transportation work which is measured by the deadweight tonnage and its transportation distance (CO2/ton-n.mile) and calculation is defined in IMO resolution MEPC.333(76) as equation (2).
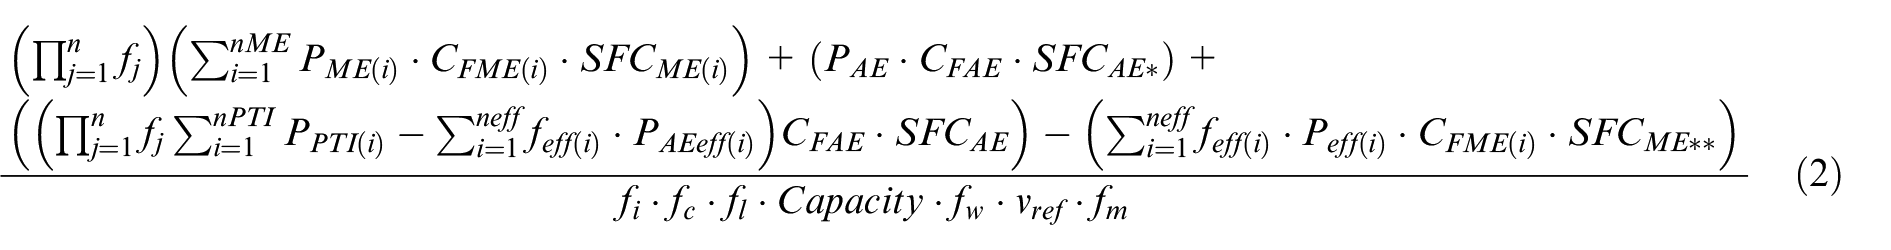
The DCS is reporting absolute CO2 emissions upon the basis of deadweight tonnage for example, carbon intensity harmonizes with EU Monitoring/Reporting/Verification (MRV). 27 The simplicity of the IMO DCS global reporting system allows the collection of data of all currently operating vessels for future control, whereas the EU MRV records data which is more restricted to the EU. The challenge of carbon intensity only applies to “tank-to-propeller” and not for “well-to-propeller” emissions. The currently applied approach of MEPC is to set the resolutions as EEDI. 28 At present, all existing IMO instruments only consider “tank to wake/propeller” emissions. This means that current regulation only considers the CO2 emissions generated on board the vessel, but not those generated for the production of the fuel. The CO2 emissions produced during the production of a fuel are typically referred to as “well-to-tank” CO2 emissions. A more holistic and preferred action by the shipping industry would be to consider “well-to-wake” approach which takes CO2 emissions in the upstream chain of the fuel production process into account. 29 Such regulation that may address “well-to-wake” emissions are currently under discussion at the IMO. A study claims that dual fuel Diesel engines powered by LNG can reduce GHG by 9%–15% for the “well-to-wake” chain. 30 However, it would be a huge challenge to quantify in the full degree of the fairness and to have the consent with the stakeholders due to the complexity on the process at “well-to-tank” more than the process at “tank-to-propeller.”
Consideration of greenhouse gas
According to Varela, international shipping carries, by volume around 80% of global trade and produces between 1.6% and 3.7% of the total GHG emission. However, projections indicate that in 2050 GHG emissions produced by the shipping industry will account for 12% to 18% of total GHG emissions. 31
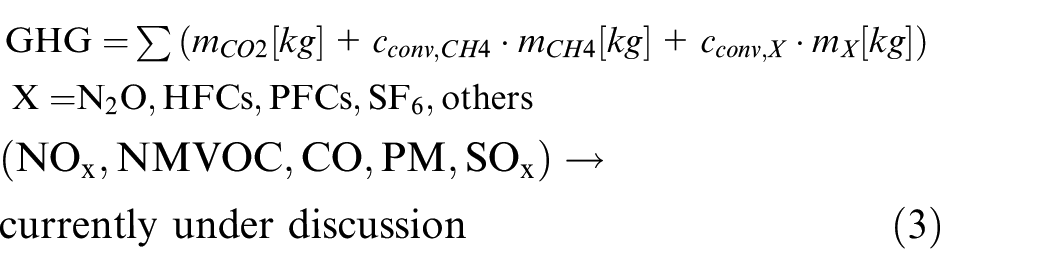
GHG emissions consists of the total emissions of CO2 and CO2 equivalent emissions from other GHGs, like methane as defined in equation (3).
A successful tracking of the GHG emission from the worldwide operating fleet is most likely possible via Automatic Identification System (AIS) and extended DCS. However, this would have to be introduced as a mandatory control measure. Measuring GHG emissions within the shipping industry was mandated by the MEPC. However, the following challenges must be resolved.
How to define GHG and to study all the influencing parameters further with their correlation?
How can the total GHG emissions from the entire shipping business be effectively measured?
How to deal with methane slip from CO2-neutral source which remains GHG.
The focus of this study is on the tank-to-wake emissions, in order to highlight the effects of engine technology in practical use, and in order to keep the results generally valid for various sources of LNG, both fossil and renewable. Hence this work chose to assess the climate impact of the vessels voyage using engine emission results but places the upstream emissions from LNG production outside the scope of this work.
In these experiments, the CO2 measurements were all repeated to investigate the repeatability of the measurements. The measured difference between the tests for LNG operation were 3% for 75% load and 2% for 50% load and 3% for 33% load. For operation on HFO the differences measured were 2% at 75% and 50% load, and 3% at 33% load.
LNG and methane slip
The study GHG and NOx emissions from gas fueled engines shows that the usage of LNG reduces CO2 emission by 20% to 28%, compared to MGO. 9 However, the study did not account for methane slip from “well-to-tank,” despite being a large-scale influencing factor of GHG in upstream fuel supply. At the engine, a methane slip of ∼2.5% has been described produced by Low Pressure Spark Ignited (LPSI) engines, a ∼3.0%–3.5% methane slip for LPDF engines and an almost negligible amount of methane slip for HPDF engines. 32 However, this strongly depends on used hardware according to the respective study. 9 Complimentary to technological development, the recent method of chilled EGR reduced methane slip significantly on LPDF engines. 33 Latest studies showed a much-reduced methane slip value of 4.1gCH4 /kWh for LPSI engines, 2.5 gCH4/kWh methane slip for LPDF 2-stroke engines and 0.2 gCH4 /kWh methane slip for HPDF engines. 13
To put these values into context, one can use the IMO carbon factors for HFO (3.114 gco2/gFuel) and LNG (2.750 gco2/gfuel) to calculate the amount of methane slip which eliminates the CO2 advantage of LNG over HFO, if all other emissions are ignored.

Based on this simplified assessment at the engine: around 1.3% methane slip eliminates the CO2 advantage of LNG over HFO. Assuming a specific fuel oil consumption (SFOC) of 140 g/kWh of methane (LNG), this corresponds to a methane slip of 1.82 g/kWh, for which the CO2 advantage of LNG over HFO would be neutralized, assuming that only CO2 and CH4 emissions are considered.
The hydrocarbon emissions measurements were repeated over 6 times at each load to achieve reliable value of the measurements. The measured difference between the tests for LNG operation was 2% for 50% load and 4% for 33% load. For operation on HFO the differences measured were 1% at 50% load, and 26% at 33% load.
Black carbon soot
A synthesis report from the Intergovernmental Panel on Climate Change (IPCC) depicts the uncertainty surrounding black carbons impact.
As part of MARPOL, Annex VI, new regulations for particles and Black Carbon (BC) were prepared after it was demonstrated that the new low-sulfur HFO fuels increased black carbon emissions. The particulate mass emissions were measured as 1.34 g/KWh for diesel mode, and 0.42 g/kWh for LNG gas operation mode. The black carbon fraction was estimated from measured PM mass using the assumption that BC = 0.65 .PM mass, as measured by Zhou et al. 34
This is equivalent to around 41% of the climate impact of the CO2 released from HFO assuming the carbon factor of (3.114 gco2/gFuel), and thus represents a significant part of its climate impact.
Synthesis of climate impact effects from the engine
The methodology for calculating the climate impact of LNG and HFO from a marine HPDF engine used in this work, was thus chosen to take into account the effects of methane slip and black carbon, as well as any other potentially relevant greenhouse gases such as non-methane hydrocarbons (NMHC), carbon monoxide (CO), CO2, and NOx. This was done using Equation 3.
Result (experiment)
Engine operating conditions
The operating points of the emission measurement on the MV “Ilshin Green Iris” were taken at the light propeller curve while it was measuring up to approximately 50% and 75% load. The emissions measurements were recorded during steady state sailing in open waters at 50% load.
Figure 6 shows the operating points of emission measurements (12 experimental measurement points) compared to shop test which corresponds to the standard n3-propeller line.
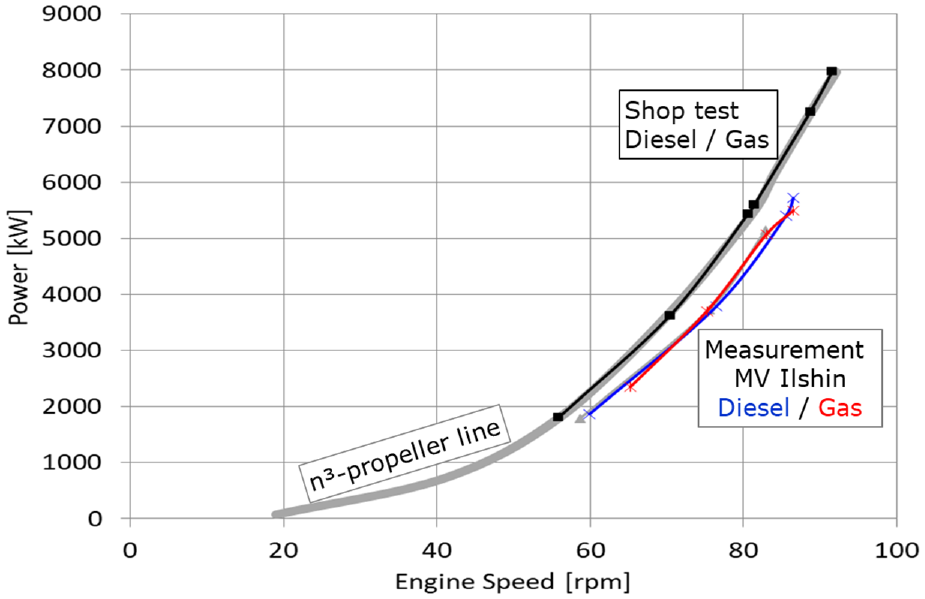
The operating points at during the voyage between Gwang-Yang port – Dong-Hae port.
Repeatability of measurements
For the enhancement of the accuracy, the measurement was repeated for the round trip that is, the voyage from Dong-Hae to Gwang-Yang and return voyage Gwang-Yang to Dong-Hae.
Measurement at each engine load point, three methods were used. One was ship monitoring system for the quick commencement and the efficient execution of measurements. PMI system permanently installed on engine was used to compare with the measured values from independently installed PMI system and emission measurement devices (Please refer to Supplemental Data for specification). Each measurement for this study was average value of 6 times measurements of independent PMI system and emission measurement device to achieve the stable and constant values.
The measurement during the voyage from Dong-Hae to Gwang-Yang was performed on both HFO and LNG mode. On the return voyage that is, Gwang-Yang to Dong-Hae, the measurement was performed in HFO mode because LNG mode was limited due to adverse weather conditions in which the ship was sailing. Thus, measurement on LNG mode on the return voyage was not included in this study. NOx measurements on the voyage that is, Dong-Hae port to Gwang-Yang port as shown on Figure 7 were compared to those from an official shop test in LNG mode to verify the accuracy. Figure 8 shows NOx measurement for both voyages in HFO mode.
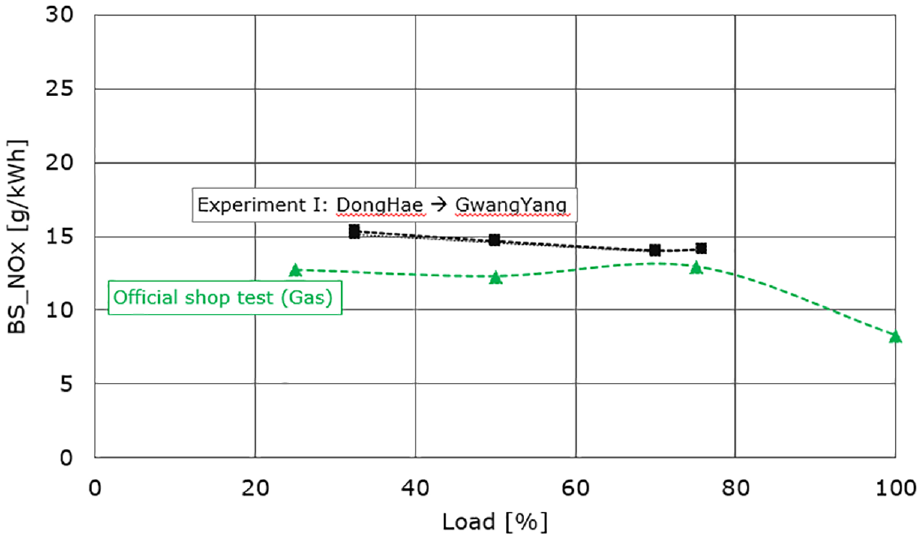
Comparison of NOx measurements in LNG mode of voyage Dong-Hae port to Gwang-Yang port and official shop test.
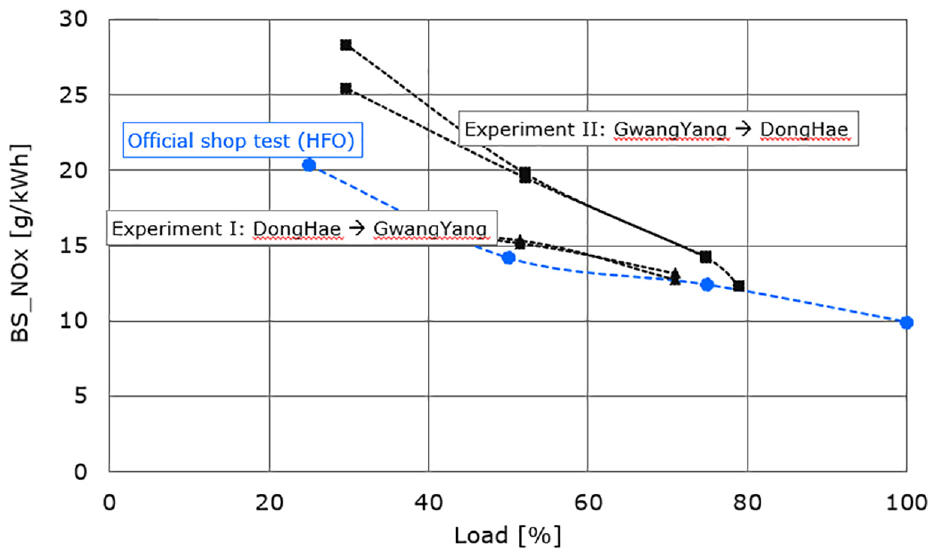
Comparison of two NOx measurements in HFO mode for voyage Dong-Hae port to Gwang-Yang port and voyage Gwang-Yang port to Dong-Hae port.
Despite different voyages with different loading and weather conditions, NOx measurements showed a similar trend over the loads and rather good consistency between the two measurements especially approximately at 75% load, shown at Figures 7 and 8.
In Figures 7 and 8 the shop tests results indicated a reduction in specific NOx emissions for engine loads above 90%. In practice the sailing conditions on the two voyages led the ships not to operate at such higher loads, but due to practical reasons related to the voyage and ship operation ran at loads between 20% and 80%.
Measurements of emissions in HFO/MDO versus LNG mode
During this experiment, engine performance and emission measurements showed that operation at 50% (3600 KW) and 75% load (5400 kW) resulted stable and almost constant. This holds true for LNG and HFO mode. Figure 9 shows the average compression pressure and Peak Firing Pressure (PFP) level for all six cylinders at 75% load. To obtain this data, measurements from LNG and HFO fuel were viewed in the range of −20 crank angle degrees before top-dead-center (TDC) to 40 crank-angle degrees after TDC. This shows the differences between the cylinder pressure behavior when operating on the two fuels. Due to the lower adiabatic flame temperature of LNG compared with HFO, the NOx emissions for LNG operation under the same conditions are known to be lower than for operation on HFO. It is known that if the global temperature and pressure history of the cycle is identical fuels of lower adiabatic flame temperature will emit lower amounts of NOx emissions. 35 This allows a higher compression ratio to be run with fuel efficiency benefit for LNG operation, while keeping NOx emissions levels lower than for HFO mode. In LNG operation, this higher effective compression ratio is achieved using an earlier Exhaust Valve Closing (EVC) timing which is possible due to an electronically controlled exhaust valve of the 6G50ME-C9.5-GI engine. This allowed to improve the thermal efficiency on the engine design, especially at lower loads, as shown in Figure 11. Finally, the effective compression ratio was controlled for both fuels to meet the IMO NOx (Tier II) emissions limits. The specific NOx emissions were lower for LNG despite the higher effective compression ratio due to the lower adiabatic flame temperature of LNG. In the HPDF engine concept used in this engine, pilot Diesel fuel was used to ignite the LNG fuel jet, due to the low autoignition propensity of LNG. 36 In LNG operation the amount of pilot fuel used was equivalent to ∼3% of the total fuel in mass.
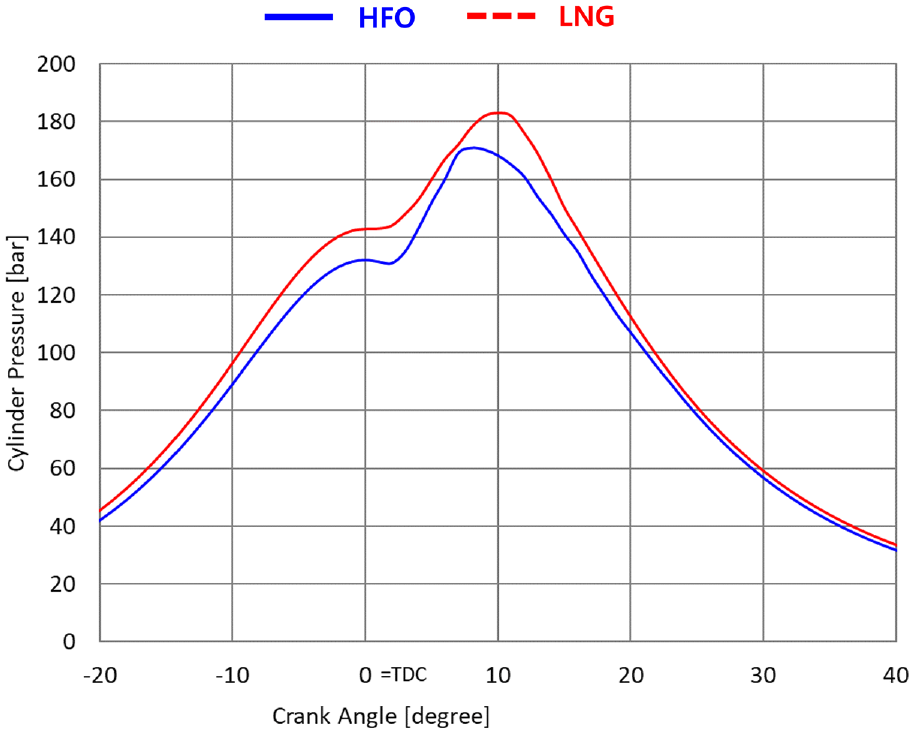
Measured Cylinder Pressure Curve from PMI of MV Ilshin Green Iris.
For 75% load, scavenging pressure (Psc) = 1.73 bar for LNG was about 100 mbar lower than Psc = 1.82 bar for HFO operation. With a HPDF system, LNG fuel is burned directly ensuring its injection under near stoichiometric conditions, thus achieving a high combustion efficiency. 37 A higher combustion efficiency and reduced methane slip can be expected compared to LPDF engines. However, the LPDF system has the benefit of a simpler configuration due to lower injection pressures and offers the ability of complying with IMO Tier III NOx regulations, due to the Otto cycle premixed combustion, which allows lower flame temperature through dilution with air under lean conditions. 33
Figure 10 shows the measured cylinder pressures obtained by PMI for the PFP as a result of compression/Psc and the adjustment of EVC timing over the engine load for LNG mode versus HFO mode. Practical readiness of fuel switching to LNG was happened in between engine running at 60 and 65 rpm thus measurement with LNG fuel commenced at 65 rpm. The effective compression ratio was an optimization parameter in order to find the best operation point in terms of engine efficiency and NOx trade-off. Figure 10 also shows the relationship amongst other parameters for both HFO and LNG mode. Optimization of EVC timing to Psc and PFP was used to create the best possible trade-off between engine efficiency and NOx trade-off.
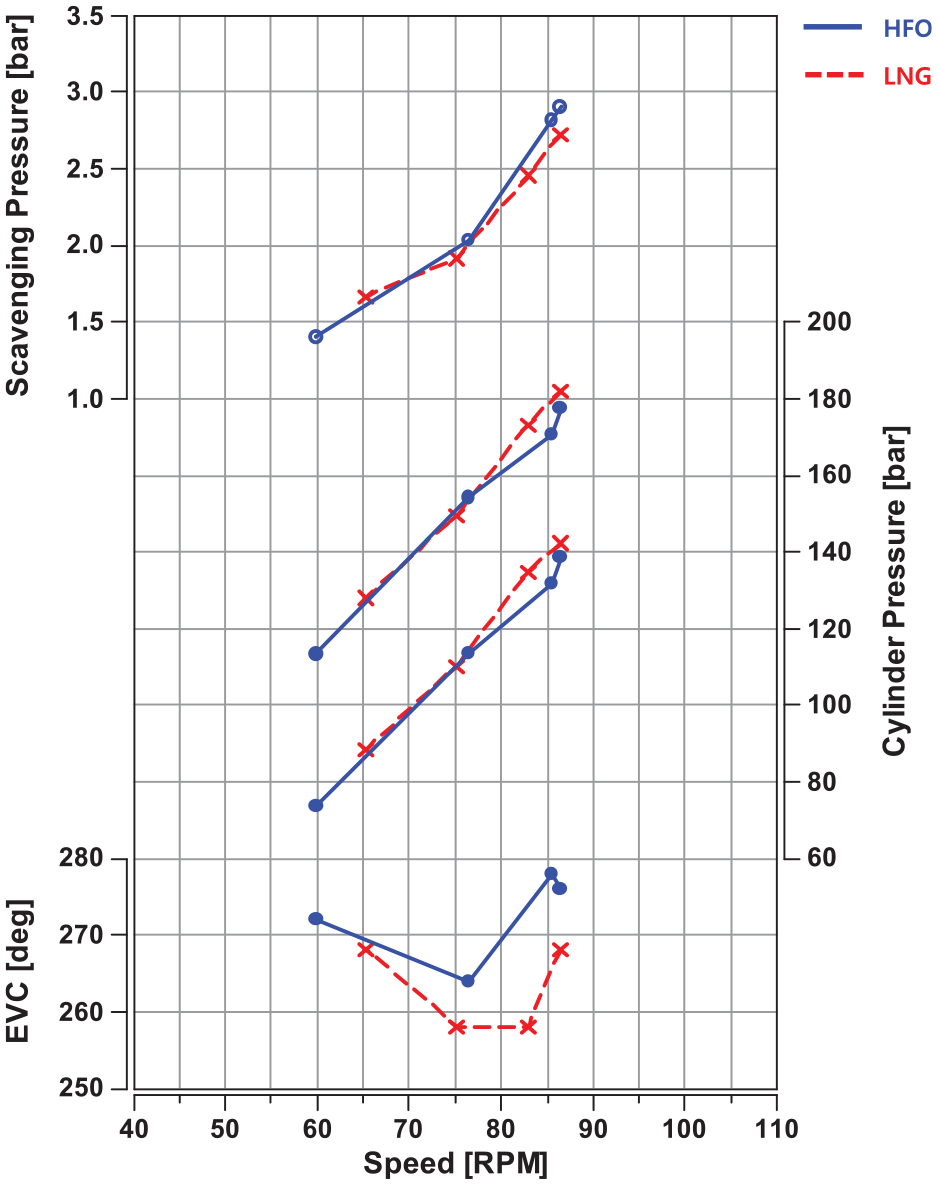
Correlation of EVC timing versus Psc, and PFP of MV Ilshin Green Iris.
The curves in Figures 11 and 12 display the engine performance under heavy running operation and are the summaries of overall measurements converted to ISO condition as the result of the best possible trade-off between engine efficiency and NOx emissions, to meet the NOx emission compliance level. The engine was calibrated for the best engine efficiency with optimum NOx trade-off in order to meet the given boundary conditions, for HFO as well as for LNG mode. This required verification of the measurements by correlating engine torque, pressure and temperature data in the engine’s intake, and EVC timing. Psc, PFP, and brake thermal efficiency (BTE) were calibrated to provide a suitable balance of performance and emissions.
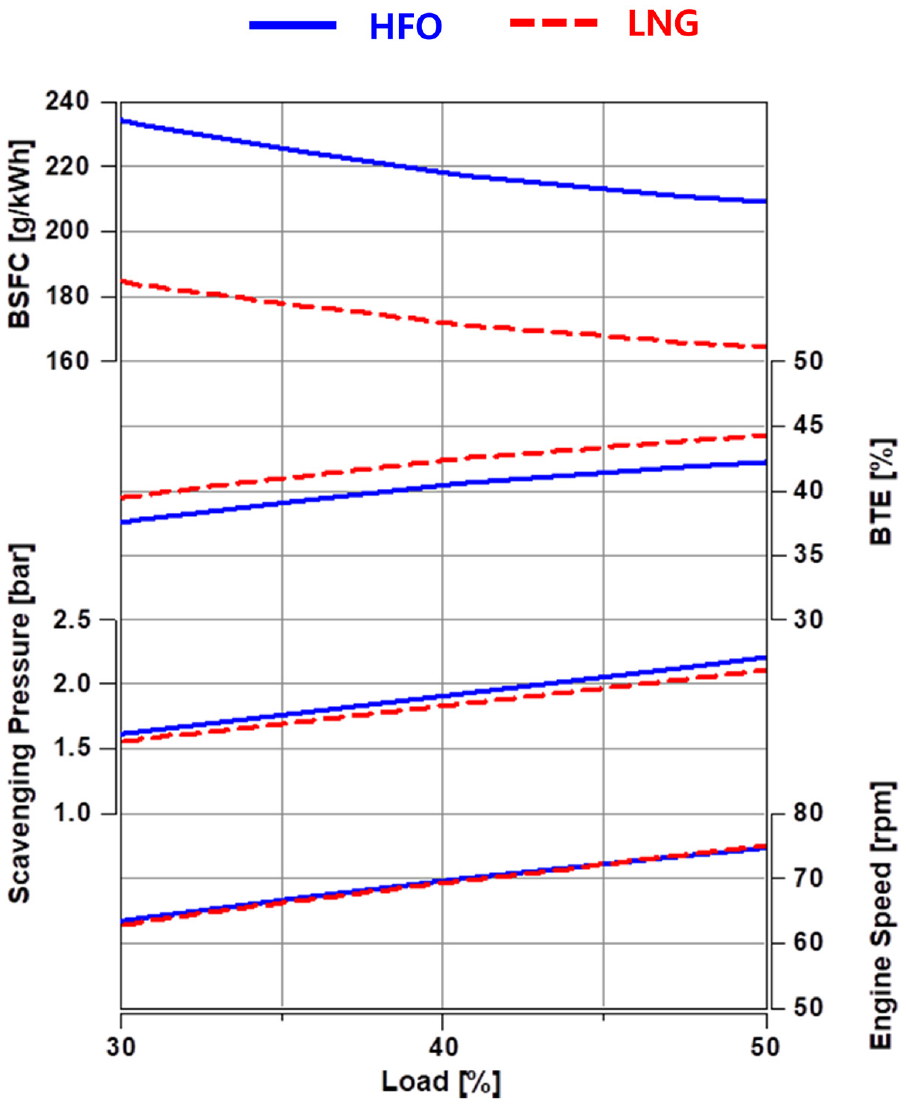
Break thermal efficiency, break specific fuel consumption, scavenging pressure and engine speed measurements of Voyage Dong-Hae to Gwang-Yang.
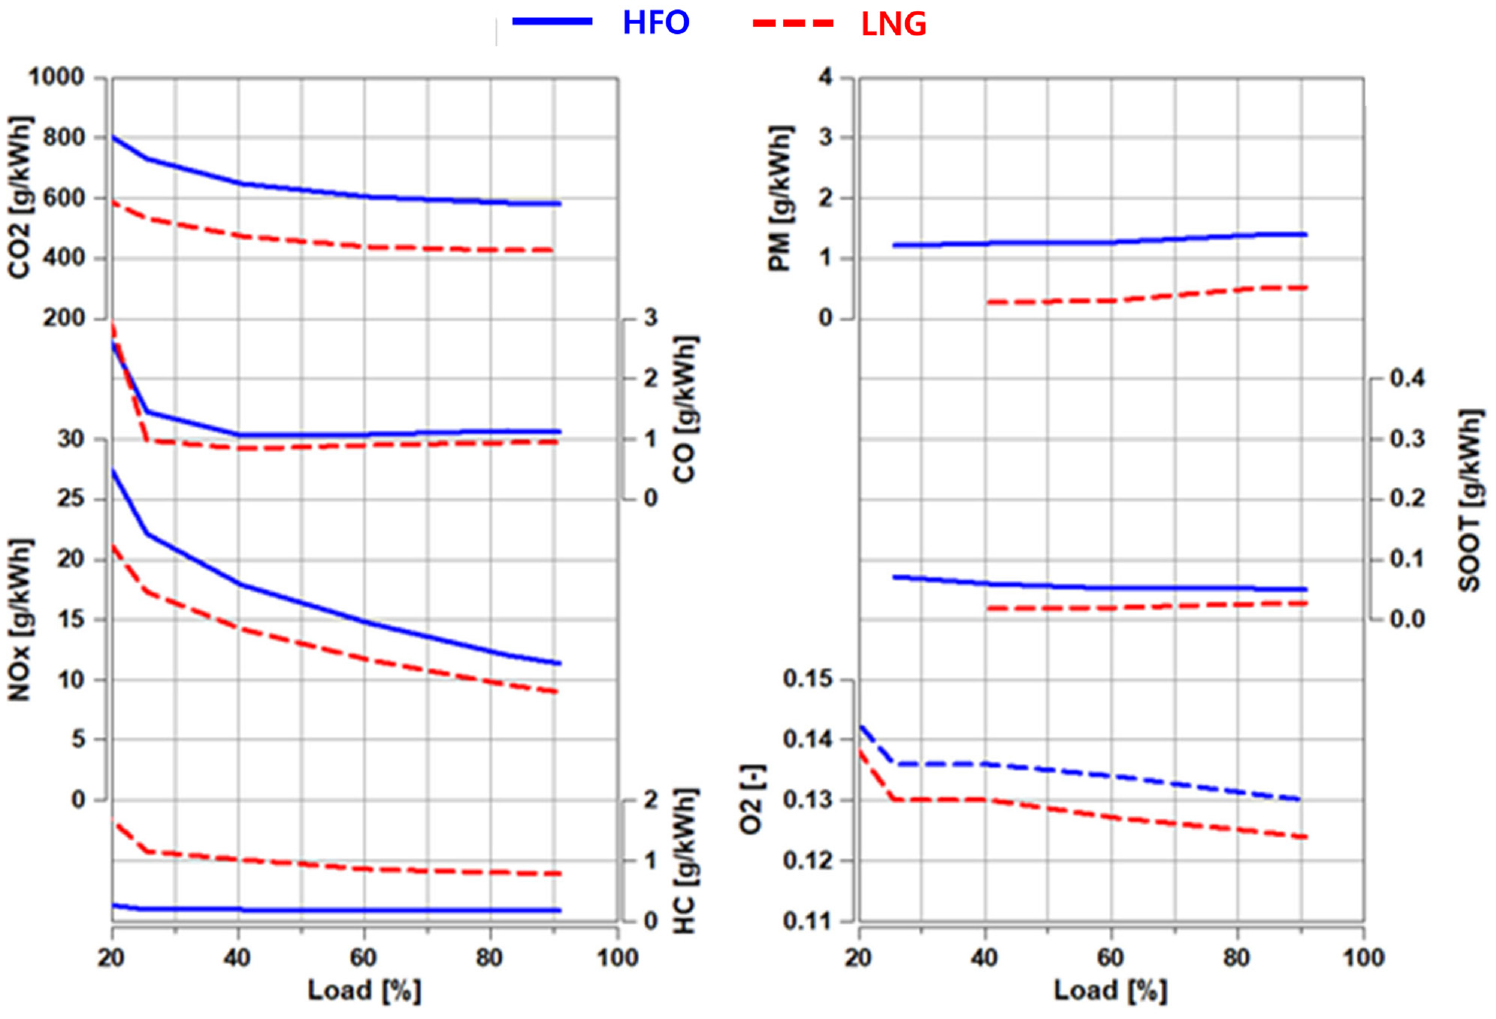
Energy-specific air emission measurements of Voyage Dong-Hae to Gwang-Yang.
To highlight the benefit of LNG, Figure 11 shows a comparison between HFO and LNG mode for Psc, BTE, and brake specific fuel consumption (BSFC). At higher engine loads, better BTE, and thus better fuel consumption was achieved. This holds true for both LNG and HFO mode. The engine operating with LNG shows an approximate 2%-points better BTE over almost the entire load range during the voyage. This could be attributed to the higher effective compression ratio of the engine, when operating with LNG. A maximum BTE of 48% was achieved for operation on LNG and a maximum BTE of 46% was achieved for MDO operation, which could be attributed to the higher effective compression ratio during LNG operation. The difference in BSFC is also partly explained by the higher specific calorific heating value of LNG, since the mass of LNG necessary to supply the same amount of heat is lower for LNG than for HFO. This is consistent with other studies researching the benefit of LNG as marine fuel in terms of emission and efficiency as well as its economic benefit. 38
Emissions measurements while running in Diesel mode (HFO) versus LNG mode during the voyage between Dong-Hae to Gwang-Yang were taken. The results are summarized in Figure 12.
The exhaust gas emission measurement of the main propulsion engine during LNG operation shows an approximate decrease of CO2 emissions by 28%. This can mainly be attributed to the fact that the carbon content of LNG is lower than for HFO. The emission of CO is also lower for LNG at all operating conditions except the lowest load. Furthermore, the LNG fueled engine has significantly lower NOx emission, as well as lower particulate matter (PM) and soot emissions. The measured HC emissions were Total Hydro-Carbon (THC) emission (as unburned HC). The methane fraction was approximately 50% methane of total HC emission at 75% load. The methane slip was measured and compared to the engine shop test measurement. Measurement during the voyage showed an approximate 10%-points higher CH4 slip at low loads. Engine was optimized for the ship mostly sailing at nominal service rating which is 5597 KW at 81.4 rpm. This means that valve timing is set for higher engine load point to achieve higher thermal efficiency. As the result, scavenging rate becomes more sensitive on pressure and less efficient at low load and assumed more leakage of methane. Correlation to verify the quantified value of CH4 slip to EVC versus Psc, and other engine parameters is to be thoroughly investigated however it is not the focus of this study.
NOx measurements and discussion
Figure 13 shows the correlation between measurement results for HFO and LNG mode for NOx emissions with corresponding O2 measurement as reference at different loads during the voyage from Dong-Hae port to Gwang-Yang port. The shop test operation corresponds with the standard propeller operating line and the sea trial was at light running conditions which is comparable to the experiment. When comparing the measurement data shown in the dotted line from the shop test versus the solid line for the measurements on the sea voyage, it can be seen that NOx emissions showed the same trend as those from the shop test. The absolute NOx emissions from the shop test were over 20% lower compared to measurements taken during the sea voyage. It must be mentioned that the measurement equipment and test position during the shop test was of laboratory standard. However, during the sea voyages portable equipment had to be used. It was difficult to take exhaust gases homogeneously from exhaust gas line onboard ship, as photos for their location and installation show in Figure 4. Additionally, there were differences in fuel characteristics during the shop test and during the sea voyage, given the practical difficulty of bunkering exactly the same LNG quality in both locations. Furthermore, the air-fuel-ratio in terms of O2-concentration has varied and could have influenced results at various engine loads. It is clear that NOx emissions at LNG mode are significantly lower than those in HFO mode, verifying the inherent NOx benefit for LNG which is widely accepted. 38
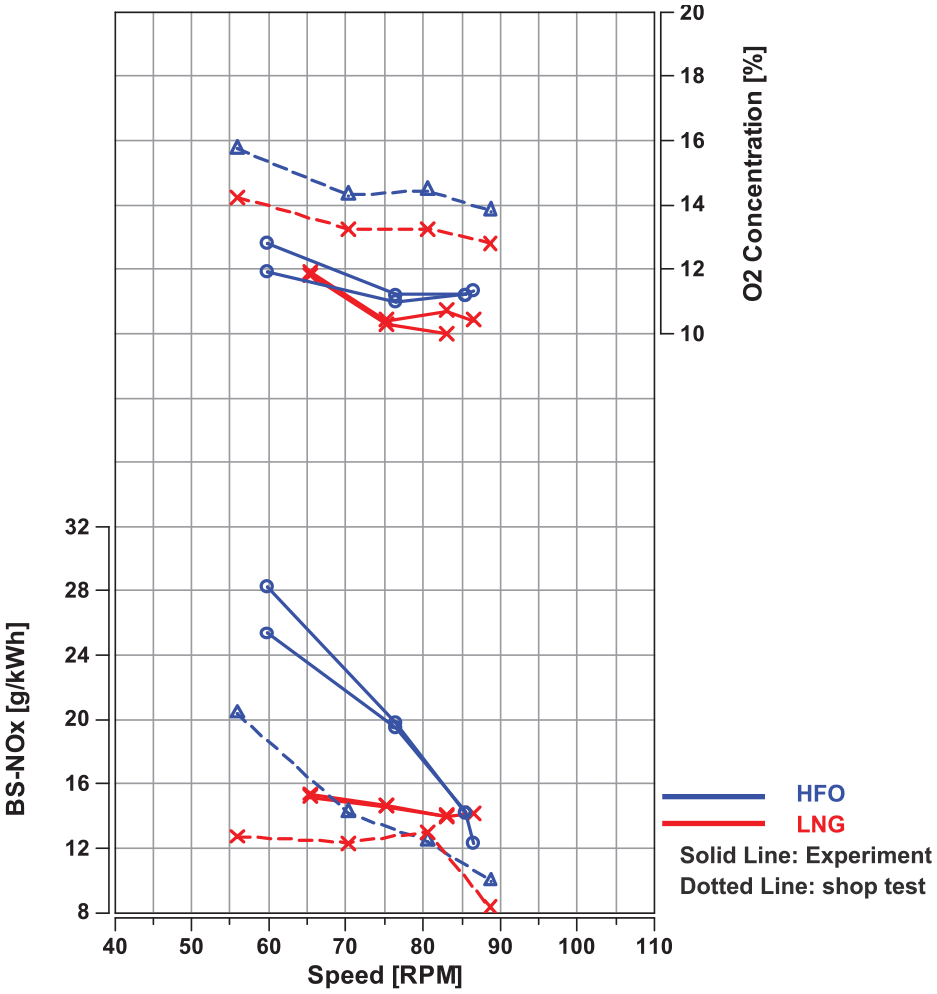
Correlation between measurements (HFO vs LNG mode at 75% Load).
Climate impact
Climate change is largely caused by the widespread emission of CO2 resulting from industrial development. Most of this CO2 is being emitted due to the use of fossil fuels. For the shipping industry, energy management is a key priority for the sustainable future of the environmental maritime industry which is strongly related to energy efficient design starting from propeller and operation of ships, as well as other emerging maritime energy-related areas of study. 39
The primary effort to reduce CO2 in the shipping industry stems from the Energy Efficiency Existing Ship Index (EEXI). It is a fundamental denominator deciding the energy efficiency of ships’ operation, which ultimately influences the amount of emitted CO2. Thus, EEXI is to be implemented from the design of the ship while Energy-Efficiency Operational Indicator (EEOI) is used during ship operation. EEXI is energy efficiency design index = amount of CO2 released per transport of cargo.
In this study, the effect of LNG fuel on the EEXI and thereby the effect on the total GHG emission components were evaluated using their GWP.
The EEXI for existing ships is the most important technical measurement and aims at promoting the use of more energy efficient (less polluting) equipment and engines. The required EEXI was calculated using the EEDI
Using the EEXI formula given in IMO resolution MEPC.333(76) and in this text as equation (2), this yields the EEXI values provided below:


In summary, MV Ilshin Green Iris meets the IMO Resolution MEPC.333(76), EEXI for operation on LNG but not on operation on HFO.
Consideration of global warming potential (GWP)
This study analyzed the impact of LNG comparing to HFO, “The Global Warming Potential GWP) was developed to allow comparisons of the global warming impacts of different gases”. 40 CO2 referenced GWP needs to be further studied to fully understand the impact of various GHGs from marine engines on global warming. LNG is often debated in the context of its GWP values. Table 3 shows a report from IPCC which depicts the two most GWP values commonly used timeframe. 20
GWP100 of Methane Slip over recent IPCC studies.
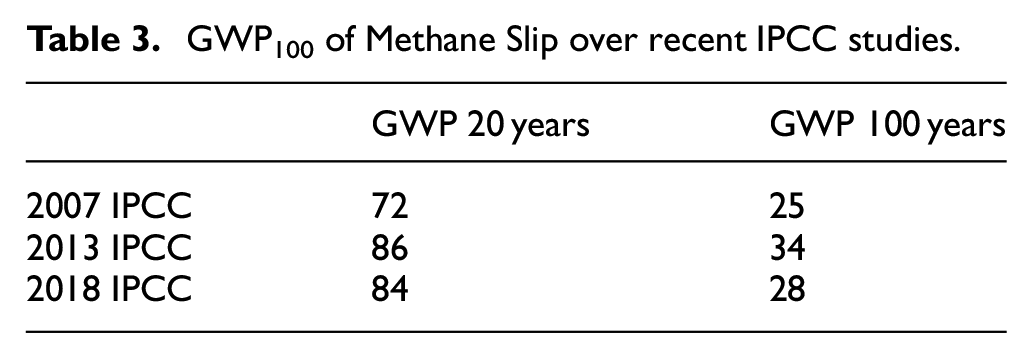
Table 3. GWP in CO2 equivalence values from the latest two IPCC reports and for the two most commonly used timeframes.
Greenhouse gas
GHG is defined as all gases that influence the greenhouse effect. PM and BC emission developed by ICCT has been applied also on IMO strategy and GHG emission factors were described.43
Measurements of engine power and exhaust gas emissions of climate active species (CO2, CH4, PM, etc.) were conducted and compared with a computational model of the vessel behavior line. Cumulative emission measurements were GWPs for all species: (CO2, CO, UHC, NOx, PM).
Table 4 shows the total GHG impact depending on measured elements based on GHG/Transport work*dwt that means GHG per kWh for the scenario of GWP 100 years. Total Hydrocarbon (THC) was used as GWP to be consistent with ICCT’s calculation method of total GHG.
Total GHG measured at 50% Load (GWP 100 years).
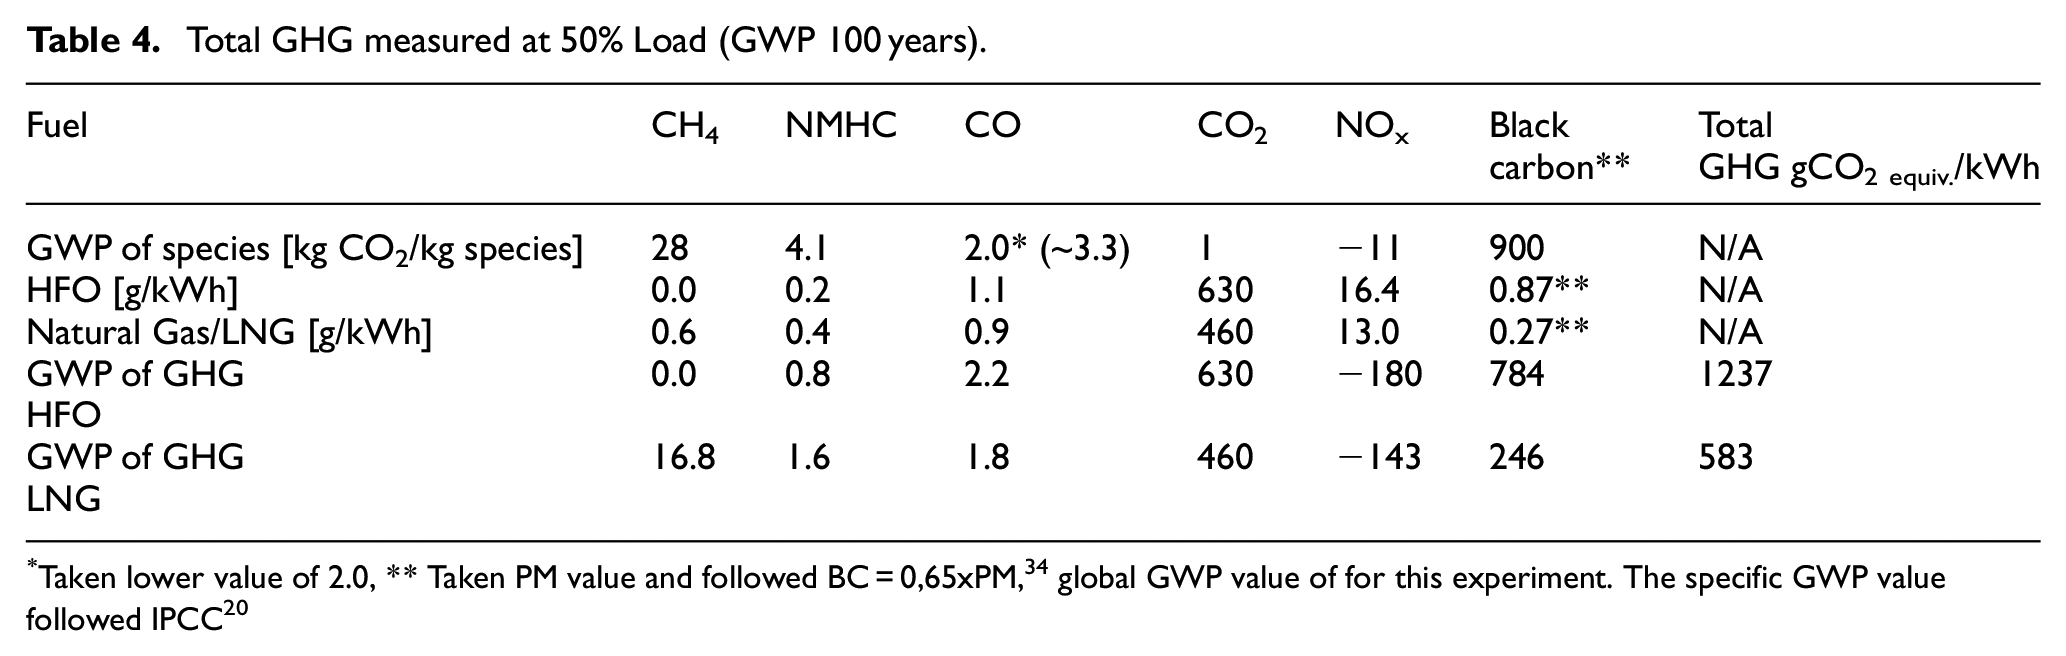
The experiment was performed for N2, O2, CO2, CO, H2O, CH4, NMHC, NOX, and PM measurement. Since this study was to construct a comparison analysis between HFO and LNG fuel and their climate impact, PM mass measurements were used as a proxy which the reference followed IMO BC* Study “Air Pollution and Energy Efficiency Studies.” 37 In this experiment, PM measurement results were not analyzed for particle size, and non-Volatile Organic Compound (VOC). PM measurement results are used to estimate black carbon (BC) and thus BC was limited to the PM measurement.
THC for this experiment was measured as methane (CH4) and NMHC and regards UHC as the parameter that develops the impact on the climate. This hypothesizes that UHC = NMHC + methane (CH4). Methane-slip is only relevant to LNG. Table 4 shows that total GHG is constructed by the multiple of each measured emission element [Methane (CH4), NMHC, CO, CO2, NOx, PM] × specific GWP and composes as total GHG per kWh. The GWP used for this calculation was 28 in reference to relevant literature 20 over 100 years. The power-specific emission of 0.6 g/kWh yielded a total climate impact from methane of 16.8 gCO2equiv./kWh. It was interesting to see that the emission of methane from the HPDF engine was higher than the total emission of unburned hydrocarbons from the operation on MDO, despite the higher effective compression ratio. This higher emission is expected to be due to the lower ignition quality of the LNG, which despite its ignition with a pilot flame, may escape ignition in some areas in the periphery of the LNG spray. Methane emissions from the HPDF engine are significantly lower than those from LPDF engines, which are typically around 2.5 gCH4 /kWh methane slip for LPDF 2-stroke engines. 13
Table 5. shows the total GHG impact depending on measured elements based on GHG/Transport work*dwt that means GHG per kWh for the scenario of GWP 20 years. And it is well consensus with the tendency of Table 4 which benefit of LNG in total GHG is even greater.
Total GHG measured at 50% Load (GWP 20 years).
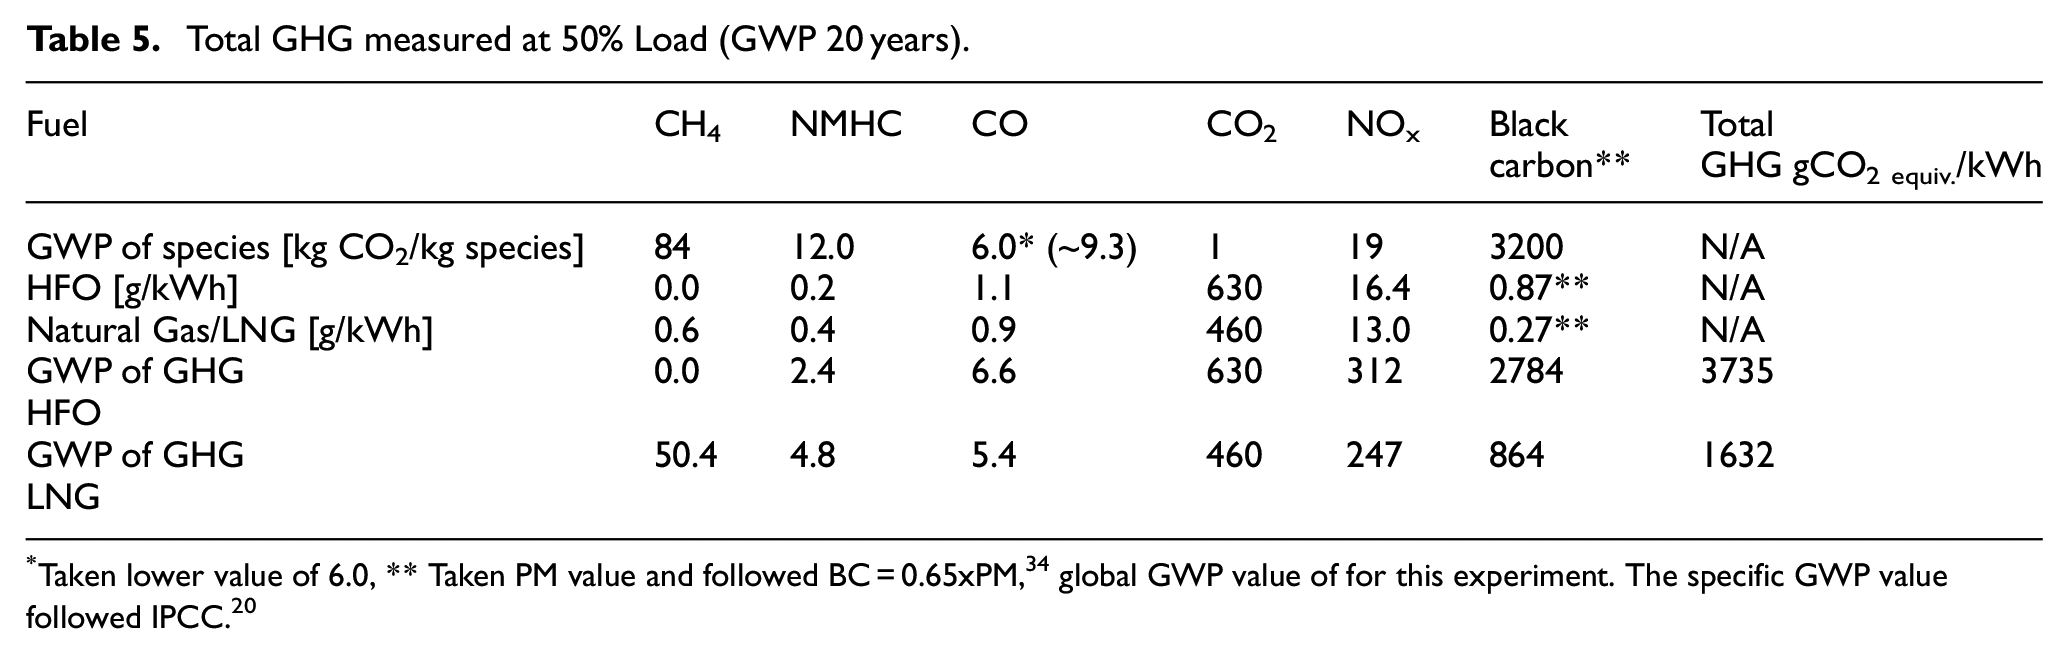
Contribution to the final GHG value strongly depends on the specific GWP value and each measured parameter. Figure 14 depicts each specific GHG value for the scenario of GWP 100 years. For example, the climate impact of BC needs to be considered due to its wide range of specific GWP (100–1700 kg CO2/kgspecies). And the total value for GHG of HFO is 1237 gCO2equiv./kWh versus 583 gCO2equiv./kWh of LNG using GWP100 values, which is an impact for HFO that corresponds to 2.12 times that of LNG. The total GHG for LNG was significantly lower compared to HFO, despite taking methane slip into account. This is possible due to the notable gap in BC. For the scenario of GWP 20 the value for HFO is 3735 gCO2equiv./kWh versus 1632 gCO2equiv./kWh of LNG, which corresponds to a slightly higher ratio of 2.29. This higher impact is mainly owed to the higher short-term impact of BC emissions. However, BC is only a part of the measured PM and is a partial quantity (assumed to be a fraction of 0.65). This fraction depends on parameters such as characteristics of fuel, combustion system and boundaries, status of the engine, etc.
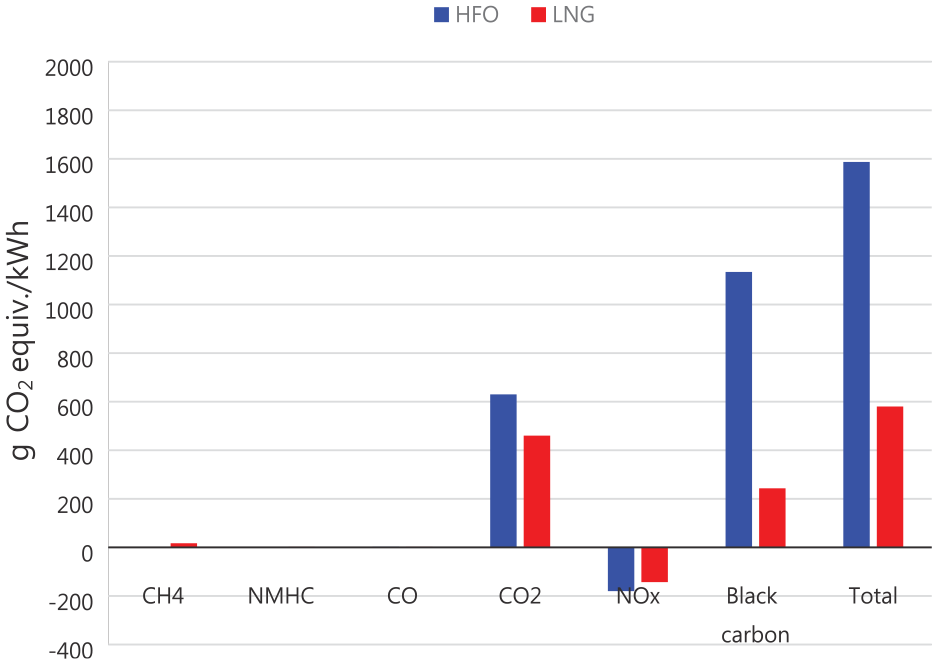
GHG contribution by emission parameters and total GHG at 50% load (GWP 100 years).
This experiment generates that although there is an issue of methane slip for LNG fuel, overall GWP values were better compared to HFO mode. A major factor is the dominant GWP factor of BC. This is consistent with outcomes that BC of HPDF is more beneficial than the case of HFO with scrubber which was calculated on the basis of measured fuel data. 42
Discussion of sensitivity
As some parameters differ strongly in the regard to their specific GWP value, further consideration is required. Considering GWP100 value varies for CO in the range of 2.0–3.3 kg CO2/kgspecies and for BC in the range of 100–1700 kgCO2/kgspecies, the impact by UHC measured at 50% load was made in considerably broad range that varied from 87 gCO2equiv./kWh as lowest to 1481 gCO2equiv./kWh as highest GWP for BC(HFO). Then total GHG of HFO develops in the range of 540–1934 gCO2equiv./kWh versus 363–795 gCO2equiv./kWh for LNG which is approximately 1.5–2.4 times more beneficial than HFO at 50% load. For the same time horizon, GWP values are dependent on the region and further require correlation amongst studies and reports. This study followed the Fifth Assessment Report (2013) of the IPCC Working Group I. GWP for CO for a time horizon of 100 years followed the global value of 2.0–3.3 kgCO2/kgspecies but were presumed at the lower end to be more conservative. This also holds true for NOx where the global value of specific GWP −11 was taken.
BC differs by region. The total GHG differs to a great extent, due to a greater specific GWP value. For this study, an average value of 900 kgCO2/kgspecies had been taken, however further consideration needs to be taken prior, since the significance of the GHG benefit of LNG fuel could be developed dominant, especially in the Arctic region.
These results make the importance of a holistic view in regard to methane slip. Methane slip in the Upstream and Downstream area needs to be considered. 13 Some literature assessing the climate impact of LNG has suggested that its use has a more negative impact on climate than the use of HFO. In view of the present results, this creates a large extent of question. Some literature 13 hypothesized the climate impact of LNG on the basis of the GWP20 rather than GWP100 which is most commonly used, considering ships’ actual lifetime of 20 years in the practical world. As this literature had a significant impact on the shipping industry, shipowners were confused regarding the selection of fuels and propulsion systems, due to the different methane slip amongst those with HPDF and LPDF or all other 4-stroke DF engines. An intensive debate about the GWP value throughout the industry followed.
Summary and conclusion
The measurement of engine performance and emission on a Diesel-cycle HPDF LNG engine of the analyzed ship during the 2400 nautical miles during voyage for this experiment generated the climate impact from tank-to-wake for the scenario of GWP 100 years and can be summarized as follows:
Total GHG of HFO (1237 gCO2equiv./kWh) was measured as approximately 2.12 times higher than Total GHG of LNG (583 gCO2equiv./kWh) at 50% load, using the GWP100 values.
NMHC(UHC) measurement showed GHG Impact of 0.2 gCO2equiv./kWh for HFO versus 4.4 gCO2equiv./kWh of LNG at 50% load.
Methane slip measured as 0.6 gCH4/kWh for LNG fuel which results in an impact to GHG impact of 16.8 gCO2equiv./kWh at 50% load.
Good correlation between experiments at sea and the prediction based on engine workshop test data for emissions.
For the scenario of GWP 20 years, the benefit of LNG fuel is remained because total GHG of HFO (3735 gCO2equiv./kWh) was measured as approximately 2.29 times higher than total GHG of LNG (1632 gCO2equiv./kWh) at 50% load. This was due to the higher GWP of BC emissions for the 20-year period with respect to the 100-year period.
The outcome of the experiment regarding total Greenhouse Gas impact on climate can be concluded as follows:
Engine efficiency of HPDF technology measured at sea with engine efficiency higher on LNG mode versus HFO mode.
Black Carbon (Particulate Matter) has the biggest influence on climate.
Methane slip for a high pressure dual fuel engine is not a major contributor to total Greenhouse Gas.
Impact by Unburnt Hydrocarbon was considerably less than Black Carbon.
Emissions and fuel economy can be predicted for ship routes and voyages. Potential for the development of methodology to develop emission identification and to use for emission reduction.
In conclusion, despite Liquefied Natural Gas being based on fossil fuel and having a strong contribution from fossil CO2 released at the engine, it has less climate impact than heavy fuel oil.
Outlook
Considering carbon neutral fuel can be produced in different ways that consume intensive energy during the overall production cycle (upstream), the life cycle assessment needs to be studied more. The “well-to-wake” approach allows a platform to be built to assess potential fuels and to create a fair evaluation measure. Additionally, it makes possible an economic assessment throughout the life cycle of different fuels.
Since PM consists not only of black carbon, it only accounts for a fraction of PM. Further measurements, analysis and study of black carbon are to be thoroughly made. THC, UHC and NMHC must be defined and agreed on by the scientific community. The respective GWPs are to be specified through further studies and experiments including the inter-relationship amongst parameters.
More efforts are to be taken to research the production technology of blue LNG and SLNG economically so that LNG makes up a significant share of all used maritime fuel up to 2050.
Based on both theoretical review and experimental works, cases of different vessel types for bulkers, container ships and tankers will have to be composed for further studies. Furthermore, different scenarios for the newbuilding and retrofit must be developed and examined throughout energy life cycle in order to find the most efficient way that allow us to comply with IMO GHG2030 and IMO GHG2050 strategy.
Supplemental Material
sj-docx-1-pim-10.1177_14750902231166442 – Supplemental material for Energy-specific greenhouse gas emissions measurements from 2-stroke marine diesel engine using liquefied natural gas
Supplemental material, sj-docx-1-pim-10.1177_14750902231166442 for Energy-specific greenhouse gas emissions measurements from 2-stroke marine diesel engine using liquefied natural gas by Kang-Ki Lee, Wilfried Hochegger and Alessandro Schönborn in Proceedings of the Institution of Mechanical Engineers, Part M: Journal of Engineering for the Maritime Environment
Footnotes
Appendix
Acknowledgements
The experiment was performed on the ship MV “Ilshin Green Iris” during a loaded voyage (Dong-Hae port to Gwang-Yang port) and ballast voyage (Gwang-Yang port to Dong-Hae port). Engine performance and emissions were measured in Oct. 2019. Technical information was provided by the ship owner and thankfully permitted for its use for this experiment and study. It included information that was officially submitted by the engine builder and designer. This study has been performed with only the technical research purpose in mind. The utmost effort has been made in order to disclose the origin of data without raising legal, commercial and/or unintended risks to the source.
Declaration of conflicting interests
The author(s) declared no potential conflicts of interest with respect to the research, authorship, and/or publication of this article.
Funding
The author(s) received no financial support for the research, authorship, and/or publication of this article.
Supplemental material
Supplemental material for this article is available online.
References
Supplementary Material
Please find the following supplemental material available below.
For Open Access articles published under a Creative Commons License, all supplemental material carries the same license as the article it is associated with.
For non-Open Access articles published, all supplemental material carries a non-exclusive license, and permission requests for re-use of supplemental material or any part of supplemental material shall be sent directly to the copyright owner as specified in the copyright notice associated with the article.