
Abstract
The stochastic environmental conditions together with craft design and operational characteristics make it difficult to predict the vibration environments aboard high-performance marine craft, particularly the risk of impact acceleration events and the shock component of the exposure often being associated with structural failure and human injuries. The different timescales and the magnitudes involved complicate the real-time analysis of vibration and shock conditions aboard these craft. The article introduces a new measure, severity index, indicating the risk of severe impact acceleration, and proposes a method for real-time feedback on the severity of impact exposure together with accumulated vibration exposure. The method analyzes the immediate 60 s of vibration exposure history and computes the severity of impact exposure as for the present state based on severity index. The severity index probes the characteristic of the present acceleration stochastic process, that is, the risk of an upcoming heavy impact, and serves as an alert to the crew. The accumulated vibration exposure, important for mapping and logging the crew exposure, is determined by the ISO 2631:1997 vibration dose value. The severity due to the impact and accumulated vibration exposure is communicated to the crew every second as a color-coded indicator: green, yellow and red, representing low, medium and high, based on defined impact and dose limits. The severity index and feedback method are developed and validated by a data set of 27 three-hour simulations of a planning craft in irregular waves and verified for its feasibility in real-world applications by full-scale acceleration data recorded aboard high-speed planing craft in operation.
Introduction
Several attempts to characterize ride comfort and human exposure to vibration and shocks have been made over the years, for instance, dynamic response index (DRI), 1 impact ride quality index (IRQI), 2 vibration ride quality index (VRQI), 2 vibration dose value (VDV) 3 and daily equivalent static compression dose (Sed). 4 Health and safety aspects have been in focus besides the related issue, performance of the man–machine system. The topic has been complicated by the different timescales involved with the exposure–effect relationships. The adverse health effects due to whole-body vibration (WBV) are expected to follow from months and years of exposure while psychophysical fatigue presumably influencing work performance in a time frame of hours. The shock loads, typical for high-performance marine craft (HPMC), might cause acute injuries at the first wave encounter. Work at sea has partly been excluded from the regulations valid for other occupational environments containing vibration. 5 Moreover, the relationship is unclear, between the measures used to characterize human exposure to vibration containing shocks and the risk of adverse health and performance effects. The complex exposure and its uncertain effects have led the legislations into doubts and researchers seeking for measurement-based real-time monitoring systems and potential measures for the evaluation of working conditions aboard HPMC.
The exposure of personnel aboard HPMC is caused by the loads on the hull structure. The impact loads on the hull inherit the structure design loads and are traditionally related to the largest acceleration peak value occurring within the craft’s lifetime or on a very low level of probability during the planned lifetime. To identify this acceleration level by first principal computation or experiments, the design conditions have to be defined, usually by choosing a design speed and a design sea state, and thereafter by exposing the craft to several hundreds of wave encounters in order to determine the stochastic process of the impact acceleration. 6 In principle, this long exposure could also be used to assess the working conditions aboard in terms of statistical maxima and VDVs. If the relationship between exposure and risk of adverse consequences, in the long and short term, was known, then the conditions could be evaluated from the humans’ point of view. This might be an effective approach during HPMC design as sketched in the work by Olausson and Garme, 7 which requires constant exposure conditions for a significantly long duration to enable computation of the stochastic process, in the order of 20–40 min as indicated by Razola et al. 6 Although investigation of sufficiently long simulations with constant conditions is applicable in HPMC design, 8 the method is unrealistic for analyzing the real-time operational conditions. When the target is to indicate the severity of the momentary operational state, a measure is needed that supports the crew in their judgment of the vibration exposure which could characterize the situation by a short time series. The timescale is assumed to be in the order of tens of seconds to a few minutes, that is, of the timescale of constant conditions during HPMC operation.
In real-time analysis, the severity of the present exposure state needs instantly to be determined and the risk of hazardous consequences needs frequently to be communicated to the crew, on a simple scale. Still, from a monitoring point of view, it is important to realize that to date the risks of adverse human health and performance effects are unknown in relation to measurable quantities of vibration, such as magnitude, axis of occurrence, duration and frequency of exposure. The risks related to the transient and accumulated exposures still need to be explored through epidemiological and experimental studies. Nevertheless, the exposure needs to be characterized. This article develops a new measure, severity index (SI), probing the risk of high-impact acceleration exposure, and suggests a method for measurement-based real-time onboard conditions monitoring system analyzing the exposure to vibration containing multiple shocks and for communicating the level of severity to the crew, based on SI for impact exposure and VDV for accumulated vibration exposure. The monitoring and feedback method can later be linked to risk of adverse health and performance effects due to high-impact events and the accumulated vibration when research progresses the understanding of the exposure-to-risk relationship.
Method for real-time feedback
A method is developed in order to indicate the severity of vibration and shock exposure aboard HPMC, at a given point in time, during real-time operations. The exposure conditions during regular HPMC operations are characterized by random and transient vibrations causing WBV and repeated shock (RS). Therefore, it is crucial to select measures that are capable of capturing this dual characteristic of exposure within a short period of time, considering the short timescale of constant conditions during high-speed operations, and are low in real-time computational complexity.
In this method, the crew vibration exposure conditions are assessed in terms of vertical (z-axis) accelerations as defined in ISO 2631-1:1997. 3 Two methods are used to analyze the input acceleration signals since the association of vibration exposure with health and performance impairments is time dependent. 9 One method addresses risk of acute injuries due to instantaneous impact exposure, while the other deals with risk of adverse effects due to accumulated vibration exposure. Different measures are used to analyze and evaluate vibration environments aboard HPMC. The measures are computed and updated every second and the severity levels are communicated to the crew by means of three color codes green, yellow and red representing the intensities low, medium and high, respectively. The feedback mechanism is shown in Figure 1.
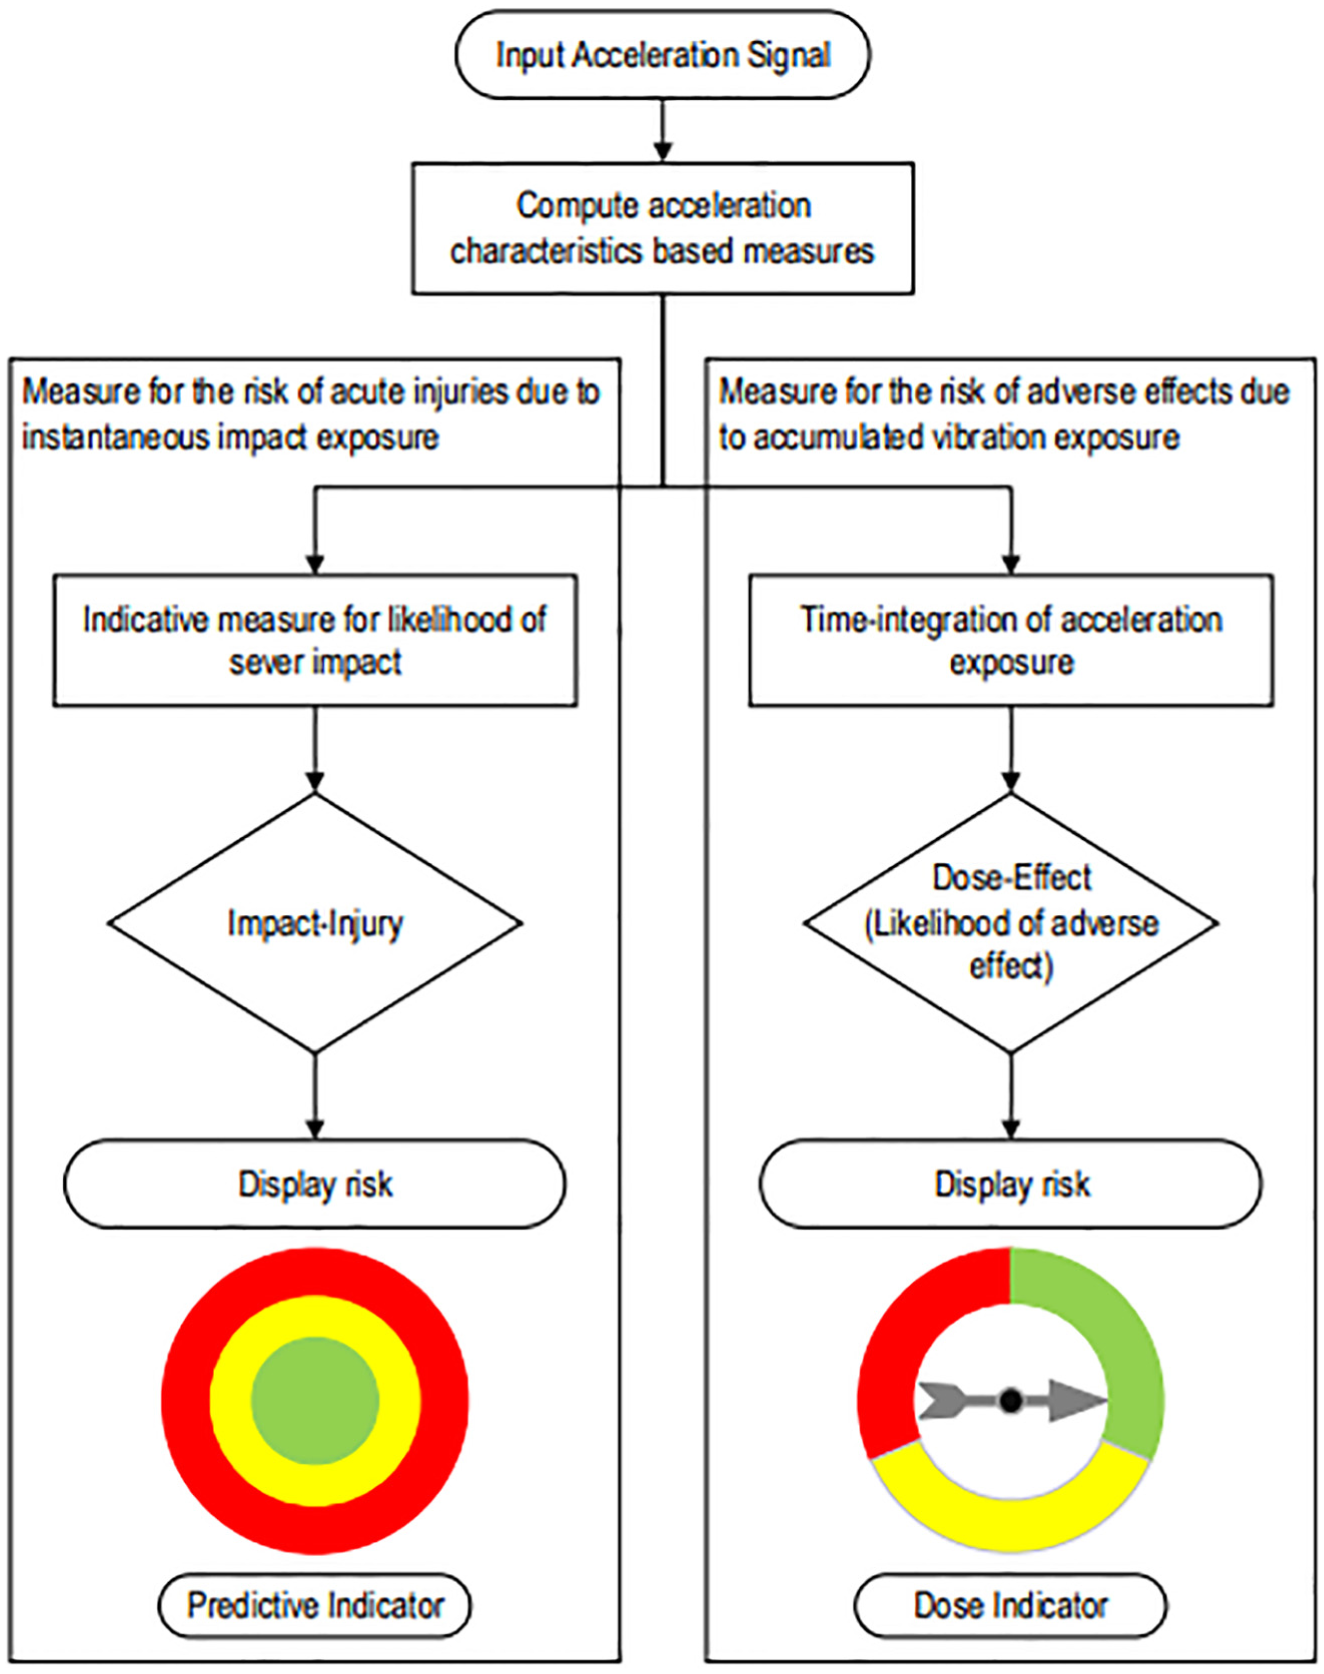
Feedback mechanism and an illustration of onboard risk display. Risk of acute injury is displayed by blinking a light and the accumulated risk by a dose meter.
Exposure conditions
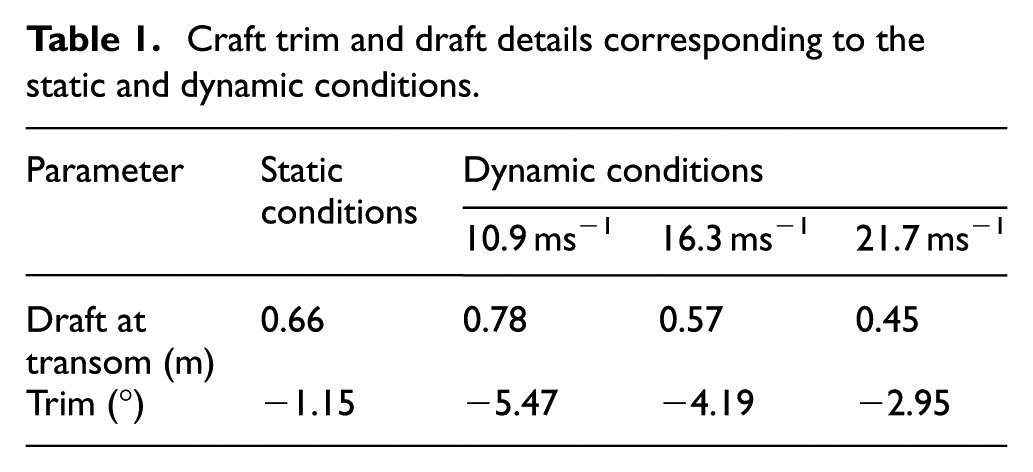
In this study, the exposure conditions are represented by a set of 27 three-hour acceleration time histories numerically simulated for a high-speed craft (HSC) in nine different sea conditions at three speeds. 6 The craft is 10.5 m in length with a beam of 2.5 m, a mass of 6500 kg and a deadrise angle of 22° at the transom stern. The craft dynamics have been simulated using a nonlinear strip method, 10 where heave and pitch responses have been modeled at constant speed in head seas. The equations formulated from Newton’s second law have been iteratively solved in the time domain with 0.005 s time steps, that is, 200 Hz. The trim and draft details of the craft corresponding to the static and dynamic conditions are given in Table 1.
Craft trim and draft details corresponding to the static and dynamic conditions.
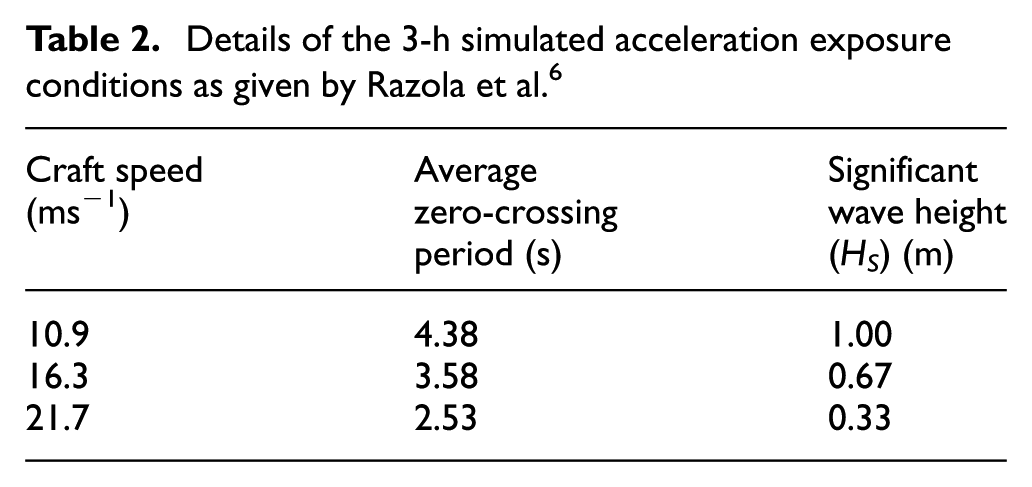
The irregular sea states have been modeled by the superposition of 301 linear regular wave components having the amplitude distribution based on three-parameter JONSWAP spectrum. The acceleration responses of the craft have been simulated for 3 hours at three speeds in three sea states modeled with three average zero-crossing periods covering a large range of exposure conditions that can be seen in Table 2. The wave components have been uniformly distributed in the period domain, resulting in a wave sequence periodicity far longer than the 3-h simulation time, even for the limited number of wave components. 6
Details of the 3-h simulated acceleration exposure conditions as given by Razola et al. 6
Development of the feedback method
A simulation-based offline analysis is used to develop the feedback method. The 27 acceleration time histories are analyzed for acceleration characteristics–based basic measures, such as root mean square (RMS), maximum transient vibration value (MTVV) 3 and root mean quad (RMQ).
An indicator is derived using the basic measures, RMS and MTVV, in order to indicate the severity of the instantaneous impact exposure. The indicator is predictive, which means that it has the ability to foresee the order of magnitude of the latent acceleration peaks inherited in the stochastic process of the analyzed acceleration signal, and is thus called predictive indicator. The RMS of an acceleration signal indicates the amount of energy transmitted to the human body and MTVV adds up information about impacts. The predictive indicator is computed every second using immediate 60 s of vibration exposure history. The accumulated vibration exposure, that is, dose, is computed by the time integration of RMQ, which is the VDV. 3 The severity levels of instantaneous impact and accumulated exposures are then communicated to the crew using two separate display units, as illustrated in Figure 1, having low, medium and high resolutions.
Derivation of predictive indicator
The 27 simulations represent different stochastic acceleration processes, where more than 40 min of sampling is required to catch the process and its extreme value distribution. 6 In reality, the conditions change in the order of minutes and the exposure is represented by a particular process only for a short while. Thus, the attempt is to find a measure that is capable of probing the characteristic of the stochastic process in a sight of what is needed for achieving convergence in the extreme value analysis. The measure should thus be able to correctly identify the process characteristics, although only about a minute snapshot of the process is available for analysis, and then determine the severity at the present state. The measure should be capable of sorting the acceleration processes by the severity. Here, the 3-h Most Probable Extreme Acceleration Peak (MPEAP) is used to rank the acceleration time histories according to their severity order. The MPEAP can be interpreted as the largest acceleration peak being the most probable to occur during a 3-h realization of the process. The severity order of the 27 acceleration time histories is the target for the predictive indicator, that is, to follow the ascending order of the MPEAP values determined by Razola et al. 6 The 3-h MPEAP values have low probability level, are among the candidates for design conditions in HPMC design and considered as an appropriate parameter for the severity reference. In the work by Razola et al., 6 MPEAP values have been computed using the method described by Ochi 11 under approximate estimation of extreme responses, by fitting the simulated acceleration peaks into Weibull probability distribution and is expressed as follows

where a is the scale parameter, b is the shape parameter and n is the number of events.
The MPEAP values are sorted in the ascending order and the time histories are indexed from 1 to 27 as can be seen in Table 3. From here onward, in this article, the acceleration time histories are identified by their sorted indices, that is, from Sim-1 to Sim-27. The objective is to find a short time measure, which can be used to sort the acceleration time histories in the same severity order illustrated in Figure 2(a).
Simulated 3-h acceleration time histories sorted in ascending order based on MPEAP values computed by Razola et al. 6
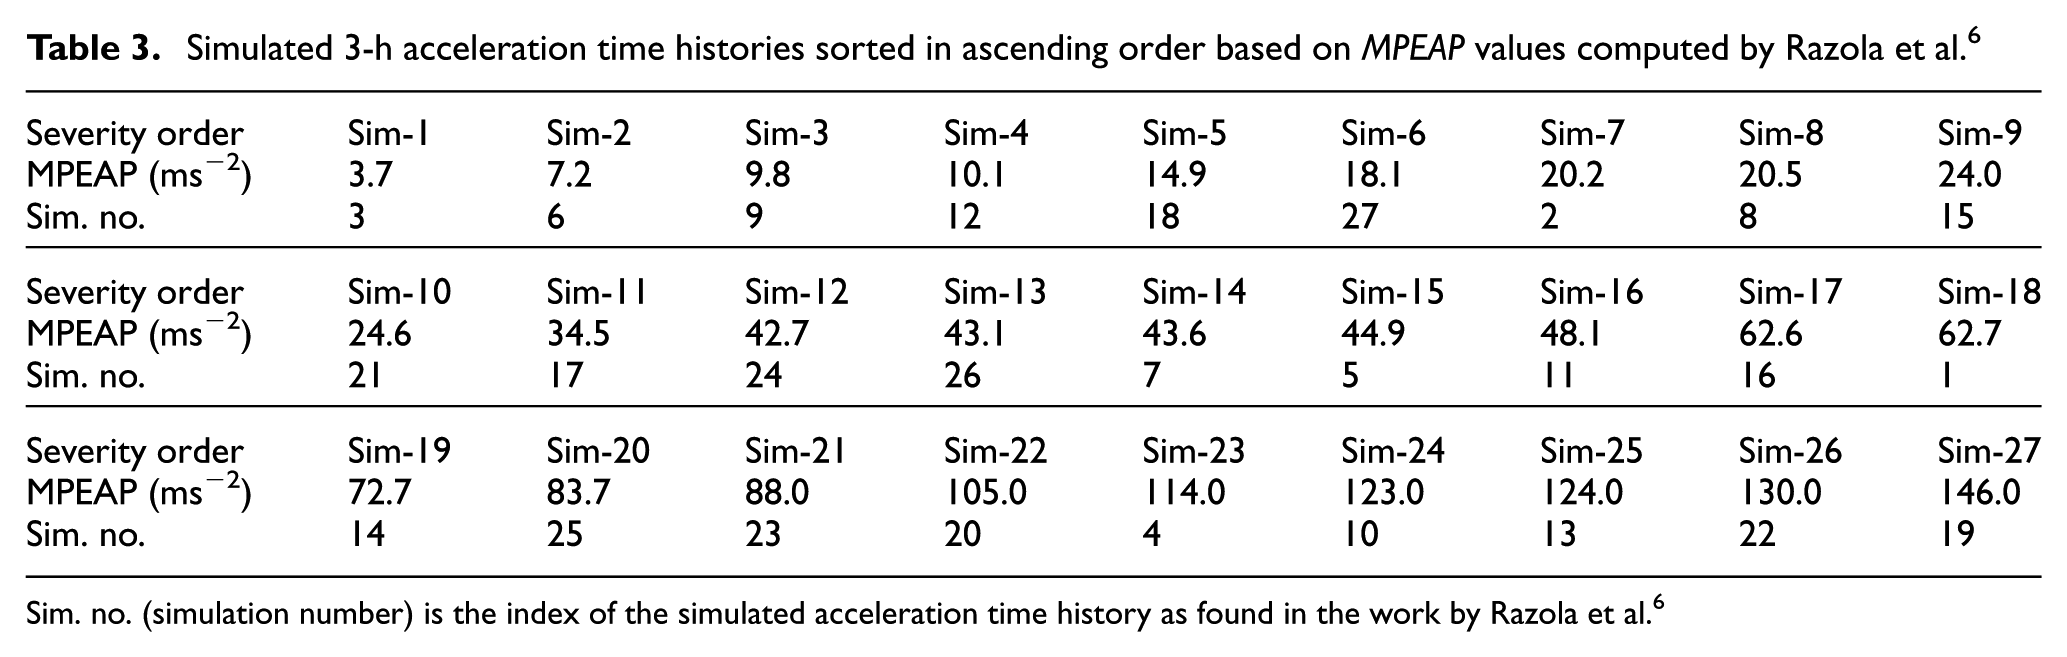
Sim. no. (simulation number) is the index of the simulated acceleration time history as found in the work by Razola et al. 6
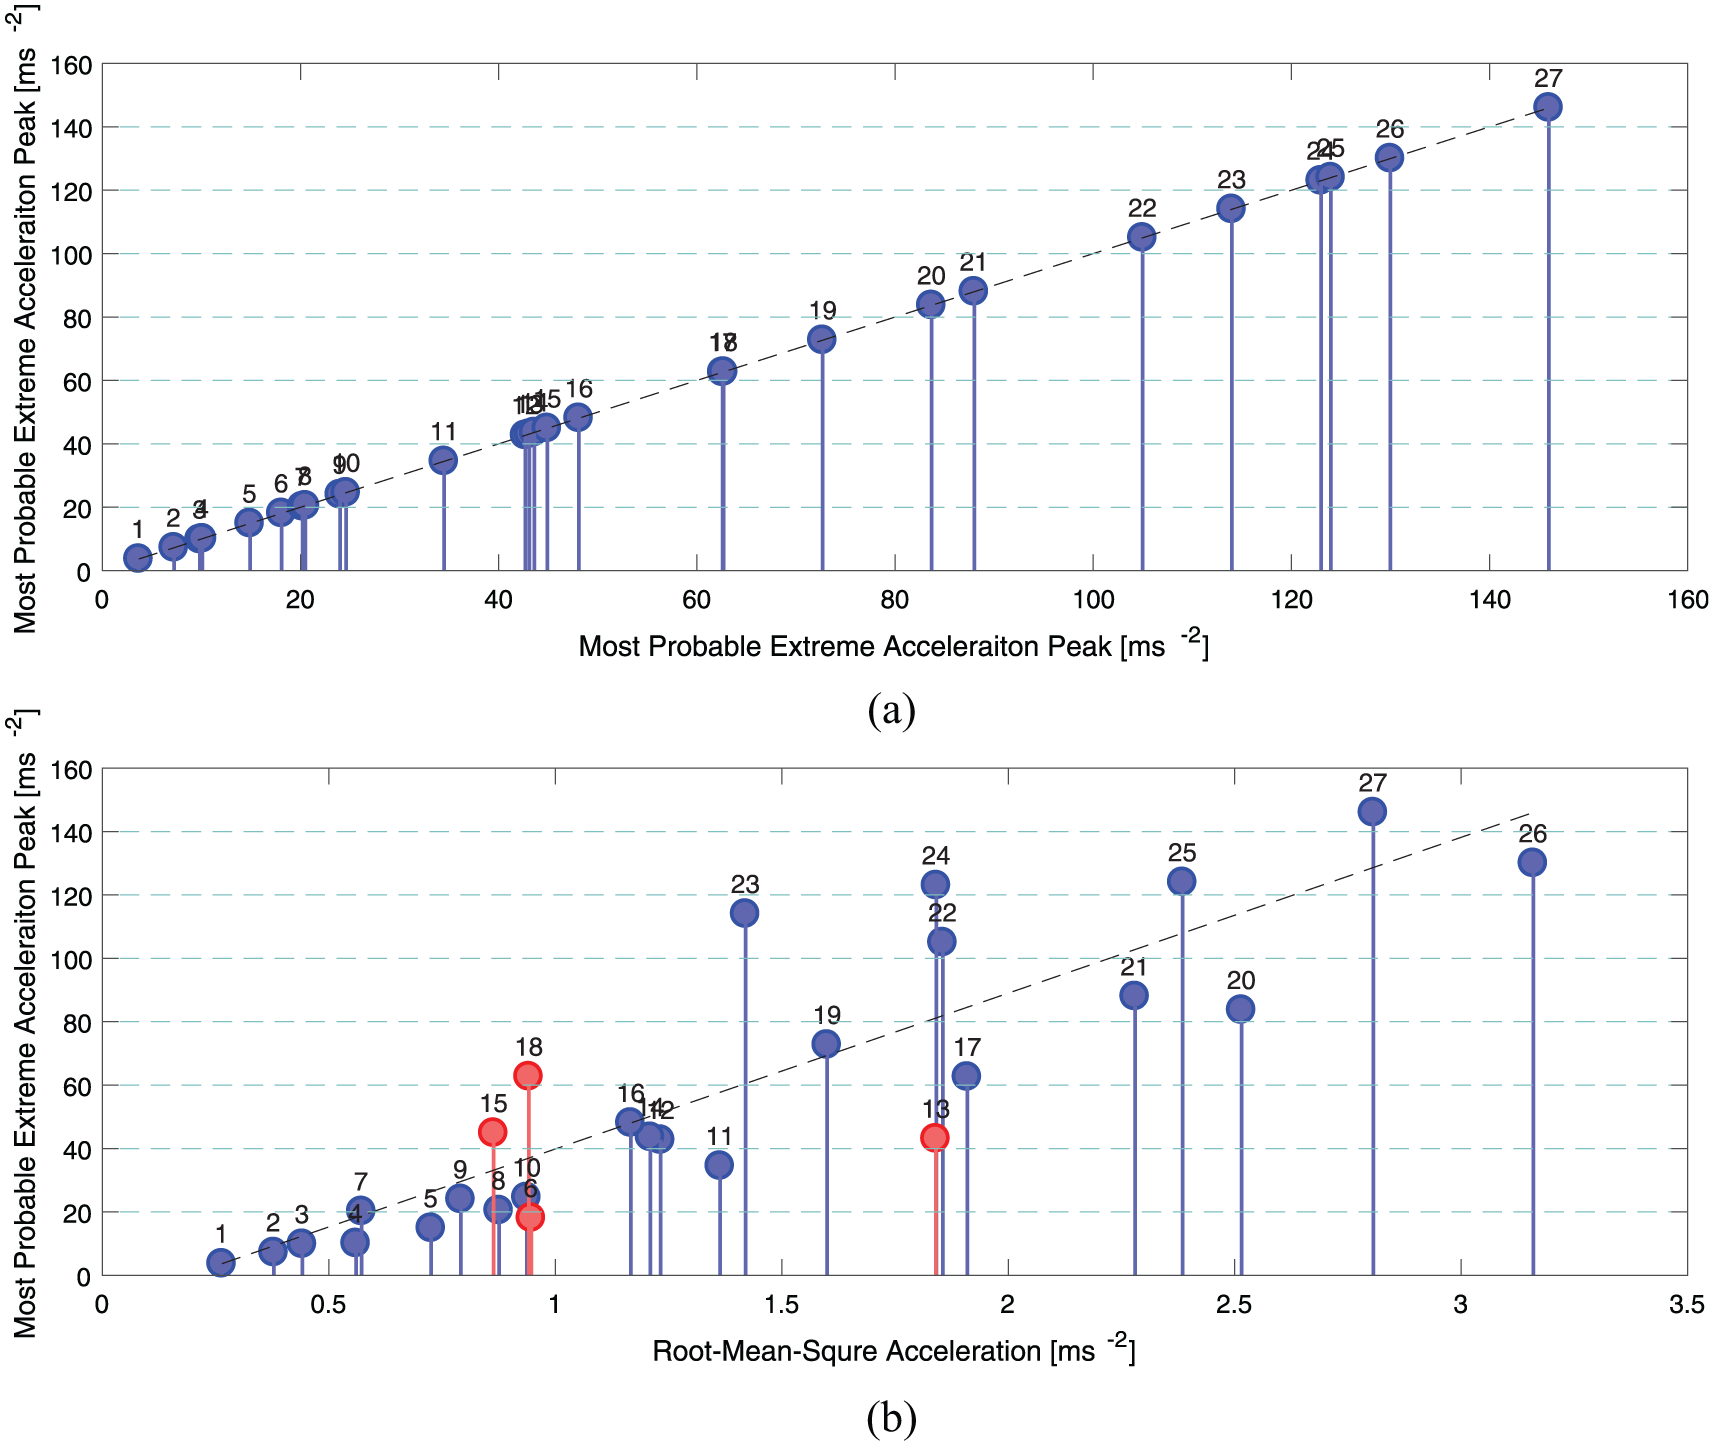
Exposure severity of the acceleration time histories (a) in ascending order and (b) in ascending order sorted according to the average RMS acceleration computed for 10,741 windows of 60 s.
Table 4 rearranges the MPEAP values and corresponding severity order against the simulation parameters: speed, significant wave height and average zero-crossing period. From Table 4, it can be seen that primarily the severity level is directly proportional to craft speed and significant wave height.
MPEAP and the simulation severity order data with the corresponding craft speed, significant wave height and average zero-crossing period.
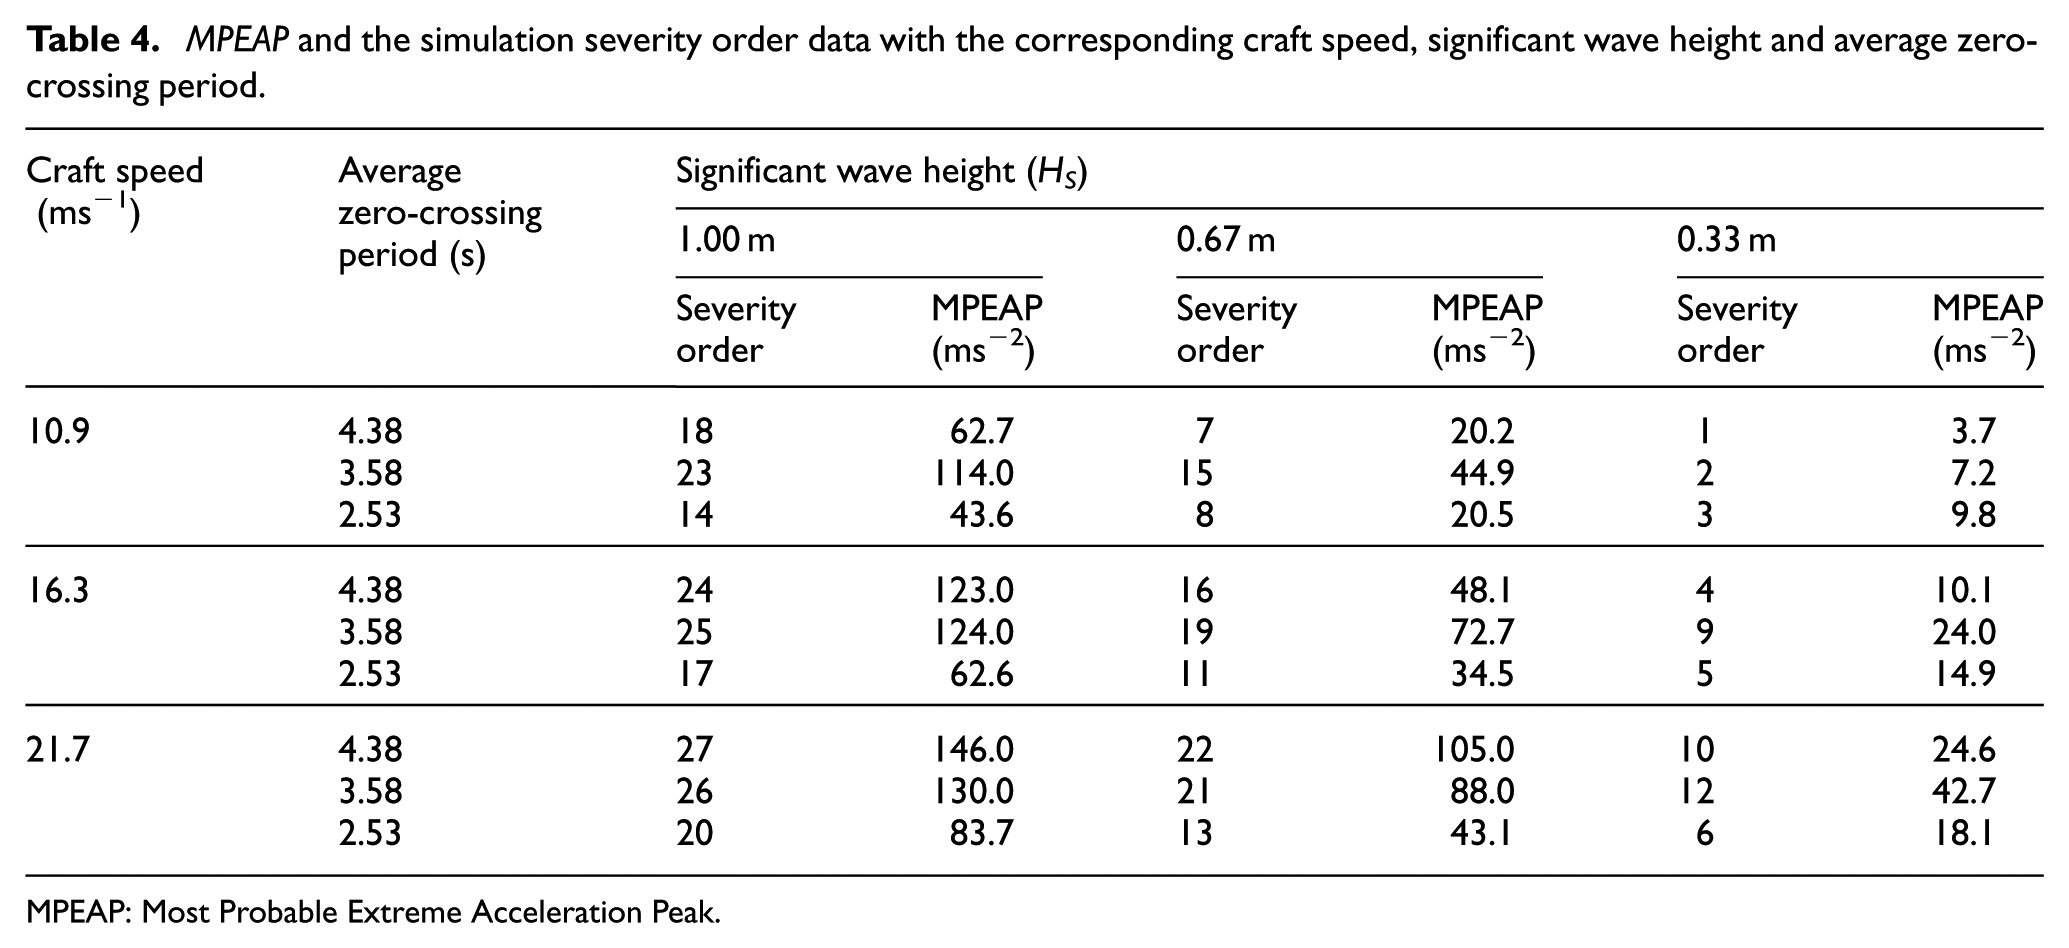
MPEAP: Most Probable Extreme Acceleration Peak.
It is assumed that the maximum timescale of constant conditions during high-speed operations is 60 s. Therefore, the predictive indicator for exposure severity, in terms of MPEAP, during the 3-h ride with constant conditions is computed using a 60-s time window. The update frequency to the crew is selected as 1 s and the idea is to move this 60-s window forward by 1-s time steps along the time history, determine the severity level and give feedback to the crew at each time step. Each acceleration time history is analyzed for the basic measures, RMS, MTVV and RMQ, using 60-s time window moving at 1 Hz. Although vibration signals are recommended to be filtered using a low-pass filter having a cutoff frequency of about 1.5 times the highest frequency of interest in order to maximize the signal to noise ratio in ISO 2631-1:1997, 3 in this work, considering the negligible level of noise in the simulated signals, it is presumed that no pre-filtration is required. The phase characteristics of the signals are linear. Since the effect of vibration on human body is dependent on its frequency content, the frequency weighting for z-direction (Wk) related to health, comfort and perception is used as recommended in ISO 2631-1:1997. 3 This frequency weighting has been designed including band-limiting filters of 0.4 Hz high-pass and 100 Hz low-pass.
First, average RMS values of 10,741 time windows are used to sort the acceleration time histories as shown in Figure 2(b). The figure shows that RMS catches the principal pattern but fails to sort the exposure severity of the acceleration time histories in the correct order. In certain circumstances, RMS overrates and underrates the exposure severity where the former restricts the operational demands, while the latter hazards the crew safety; for example, in Sim-6 and Sim-13, the RMS overrates the exposure severity (in the order of 100%), whereas in Sim-15 and Sim-18, the RMS underrates (by almost 50%) the severity as illustrated in red color (Figure 2(b)).
The corresponding craft speed in Sim-6 and Sim-13 is 21.7 ms−1 and the significant wave heights are 0.33 m and 0.67 m, respectively. Ranking the severity based on RMS moves those cases to nos 12 and 19, respectively. The pattern is opposite for Sim-15 and Sim-18 with lower corresponding craft speed, 10.9 ms−1, and significant wave heights, 0.67 m and 1.0 m, respectively. RMS ranking degrades these two conditions to places 8 and 11.
It seems that in those examples, the RMS does not correlate with the extreme values well, that is, the RMS magnitude fails to indicate the effect of the underlying process of impact events.
This evokes the requirement of a measure that is capable of capturing the influence of the impact events in such vibration exposure. Therefore, the ratio between MTVV and RMS, used in ISO 2631-1:1997 3 to indicate the content of shocks in a vibration signal, is selected as a potential measure for capturing this impact phenomena, here named as transient factor (TF), expressed as follows

where

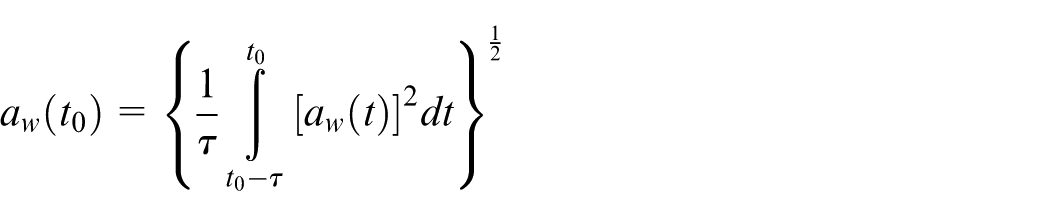
where aw(t) is the instantaneous frequency-weighted acceleration, τ is the integration time for running averaging, t is the time (integration variable) and t0 is the time of observation (instantaneous time).
Figure 3 shows TF computed using RMS and MTVV, for the two overrating and underrating example cases.
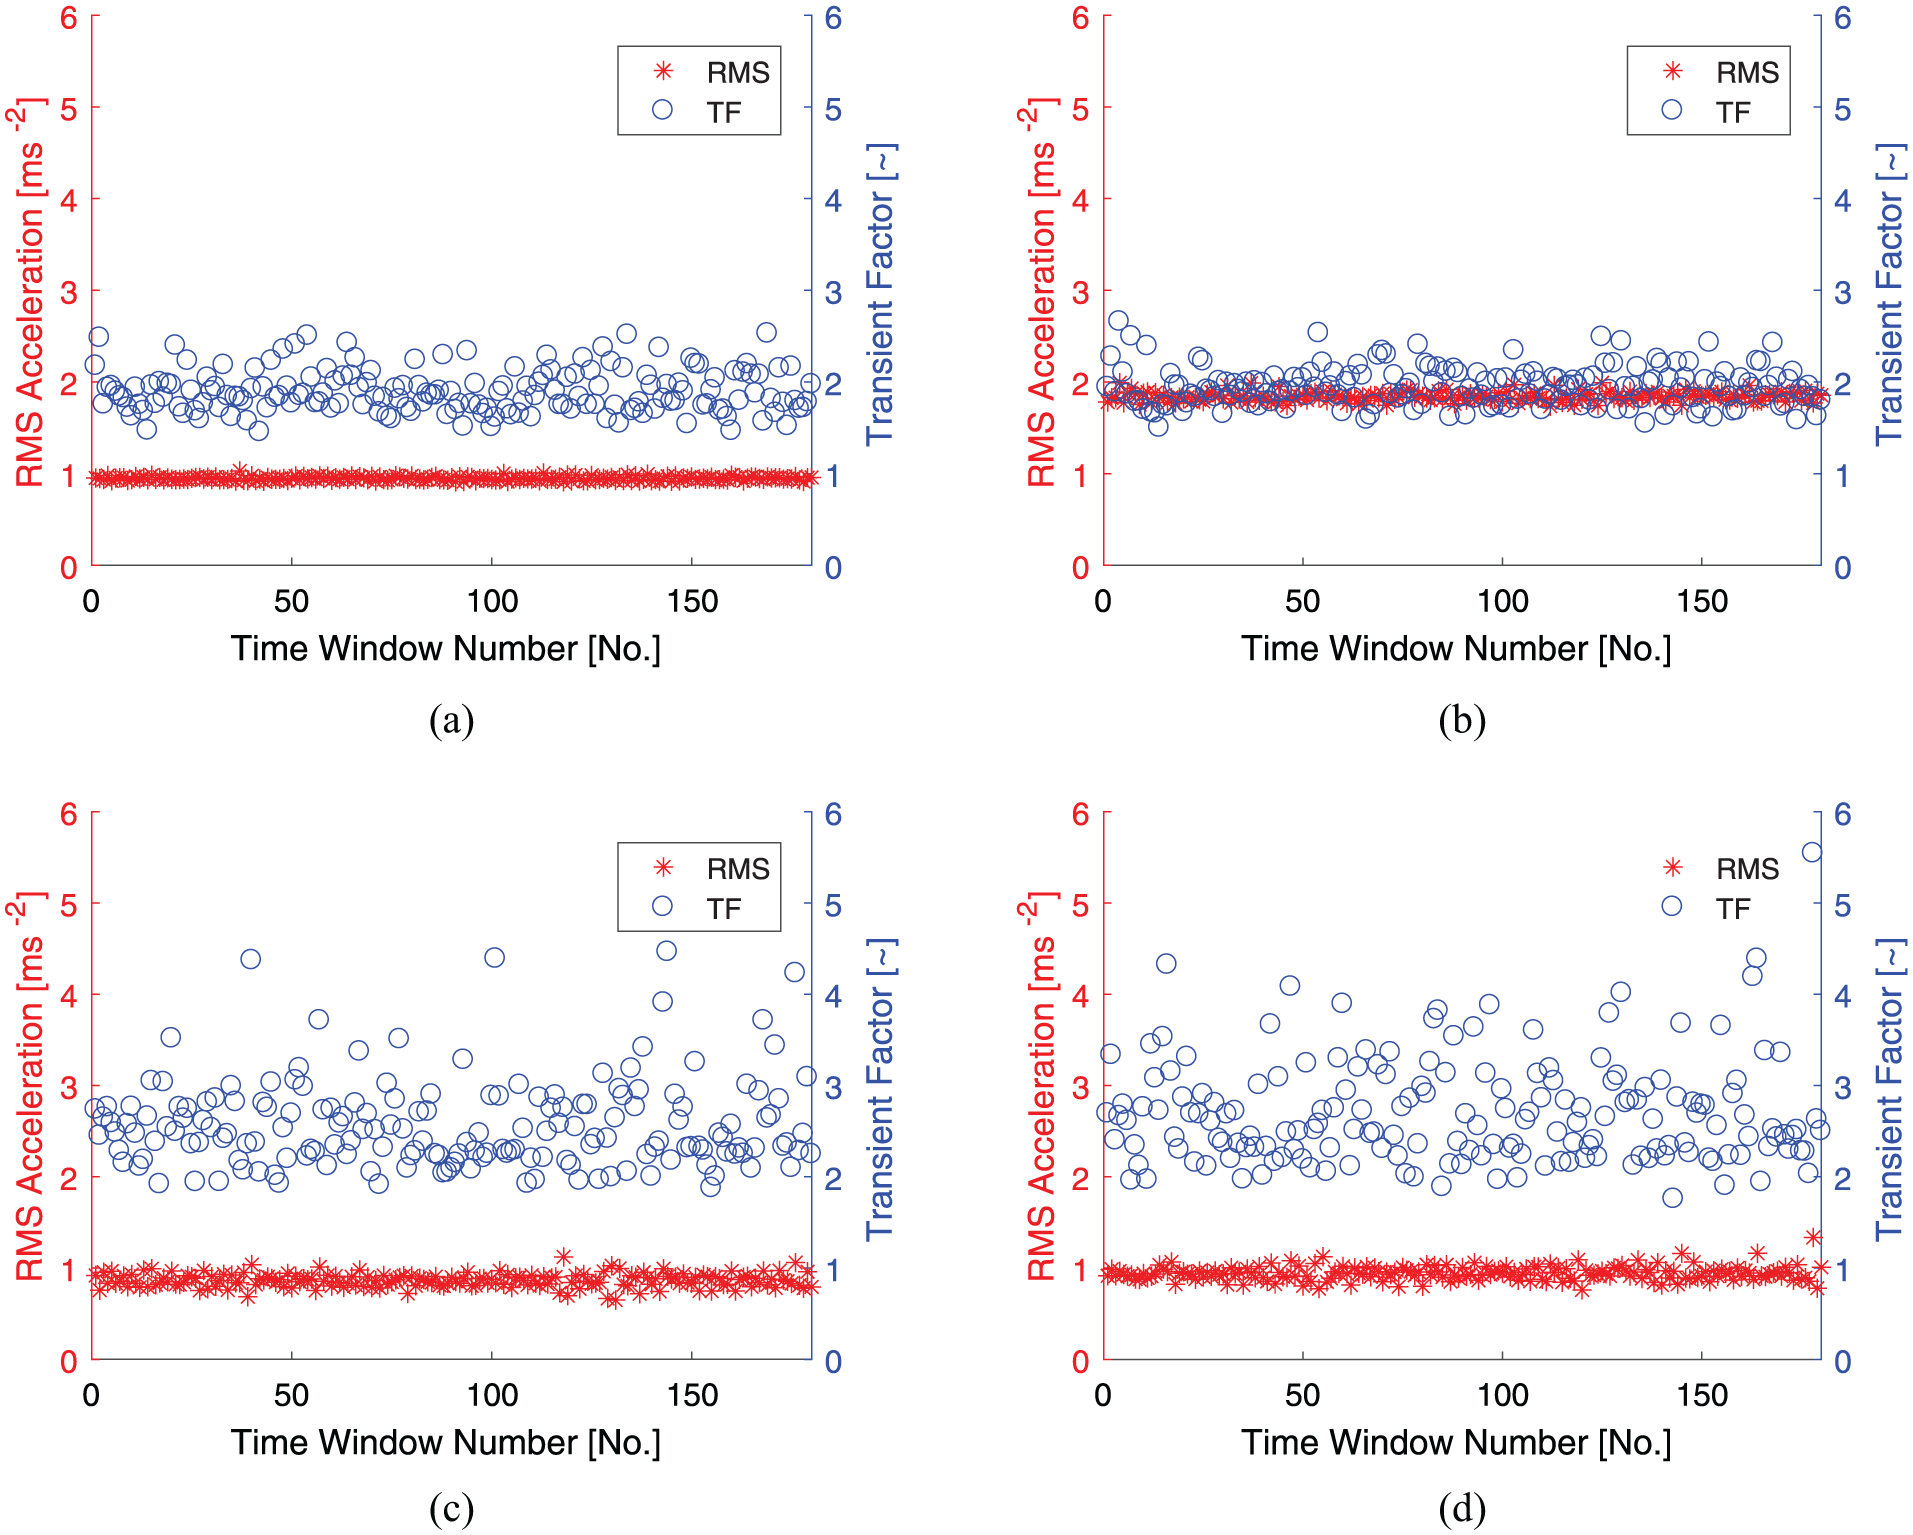
Transient factor computed using RMS and MTVV for (a) Sim-6, (b) Sim-13, (c) Sim-15 and (d) Sim-18. RMS and TF have been computed for 60-s window moving over acceleration time history in 60-s time steps resulting in 180 windows for clarity. Integration time for MTVV, τ = 1 s.
The TF spread of the cases, Sim-6 and Sim-13, severity overrated by RMS, as depicted in Figure 3, is small compared with the underrated cases, Sim-15 and Sim-18. This indicates that the influence of impact phenomena can be captured by TF.
Although RMS is a useful measure representing the energy content and being quite stable over the 3-h sequence as can be seen in Figure 3, in categorization of exposure severity, it fails to capture the influence of the impact events in the process, hence the correct exposure severity. Therefore, in order to incorporate the involvement of impact events and improve the calculated severity order, RMS is modified by introducing another factor derived from TF. This new factor grasps the deviation or “unpredictability” of the TF noticed in Figure 3 and is called unpredictability factor (UF) and expressed as follows
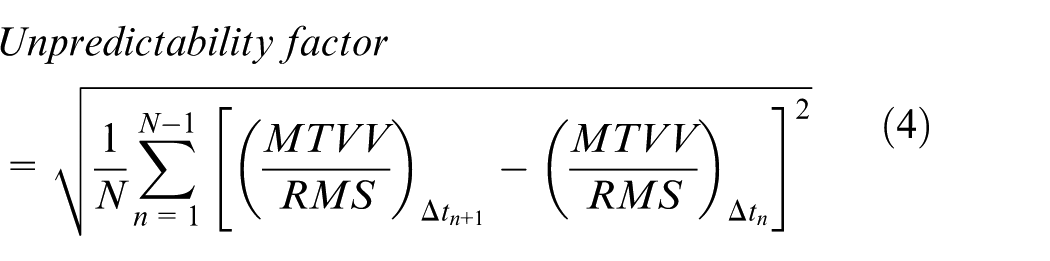
where Δt is the size of micro time window, N is the number of micro time windows and n is the micro time window number.
This measure levels the scattered TF as can be seen in Figure 4. In order to compute UF, each 60-s time window is further segmented into micro windows of time Δt and the ratio between MTVV and RMS for each micro window is computed.
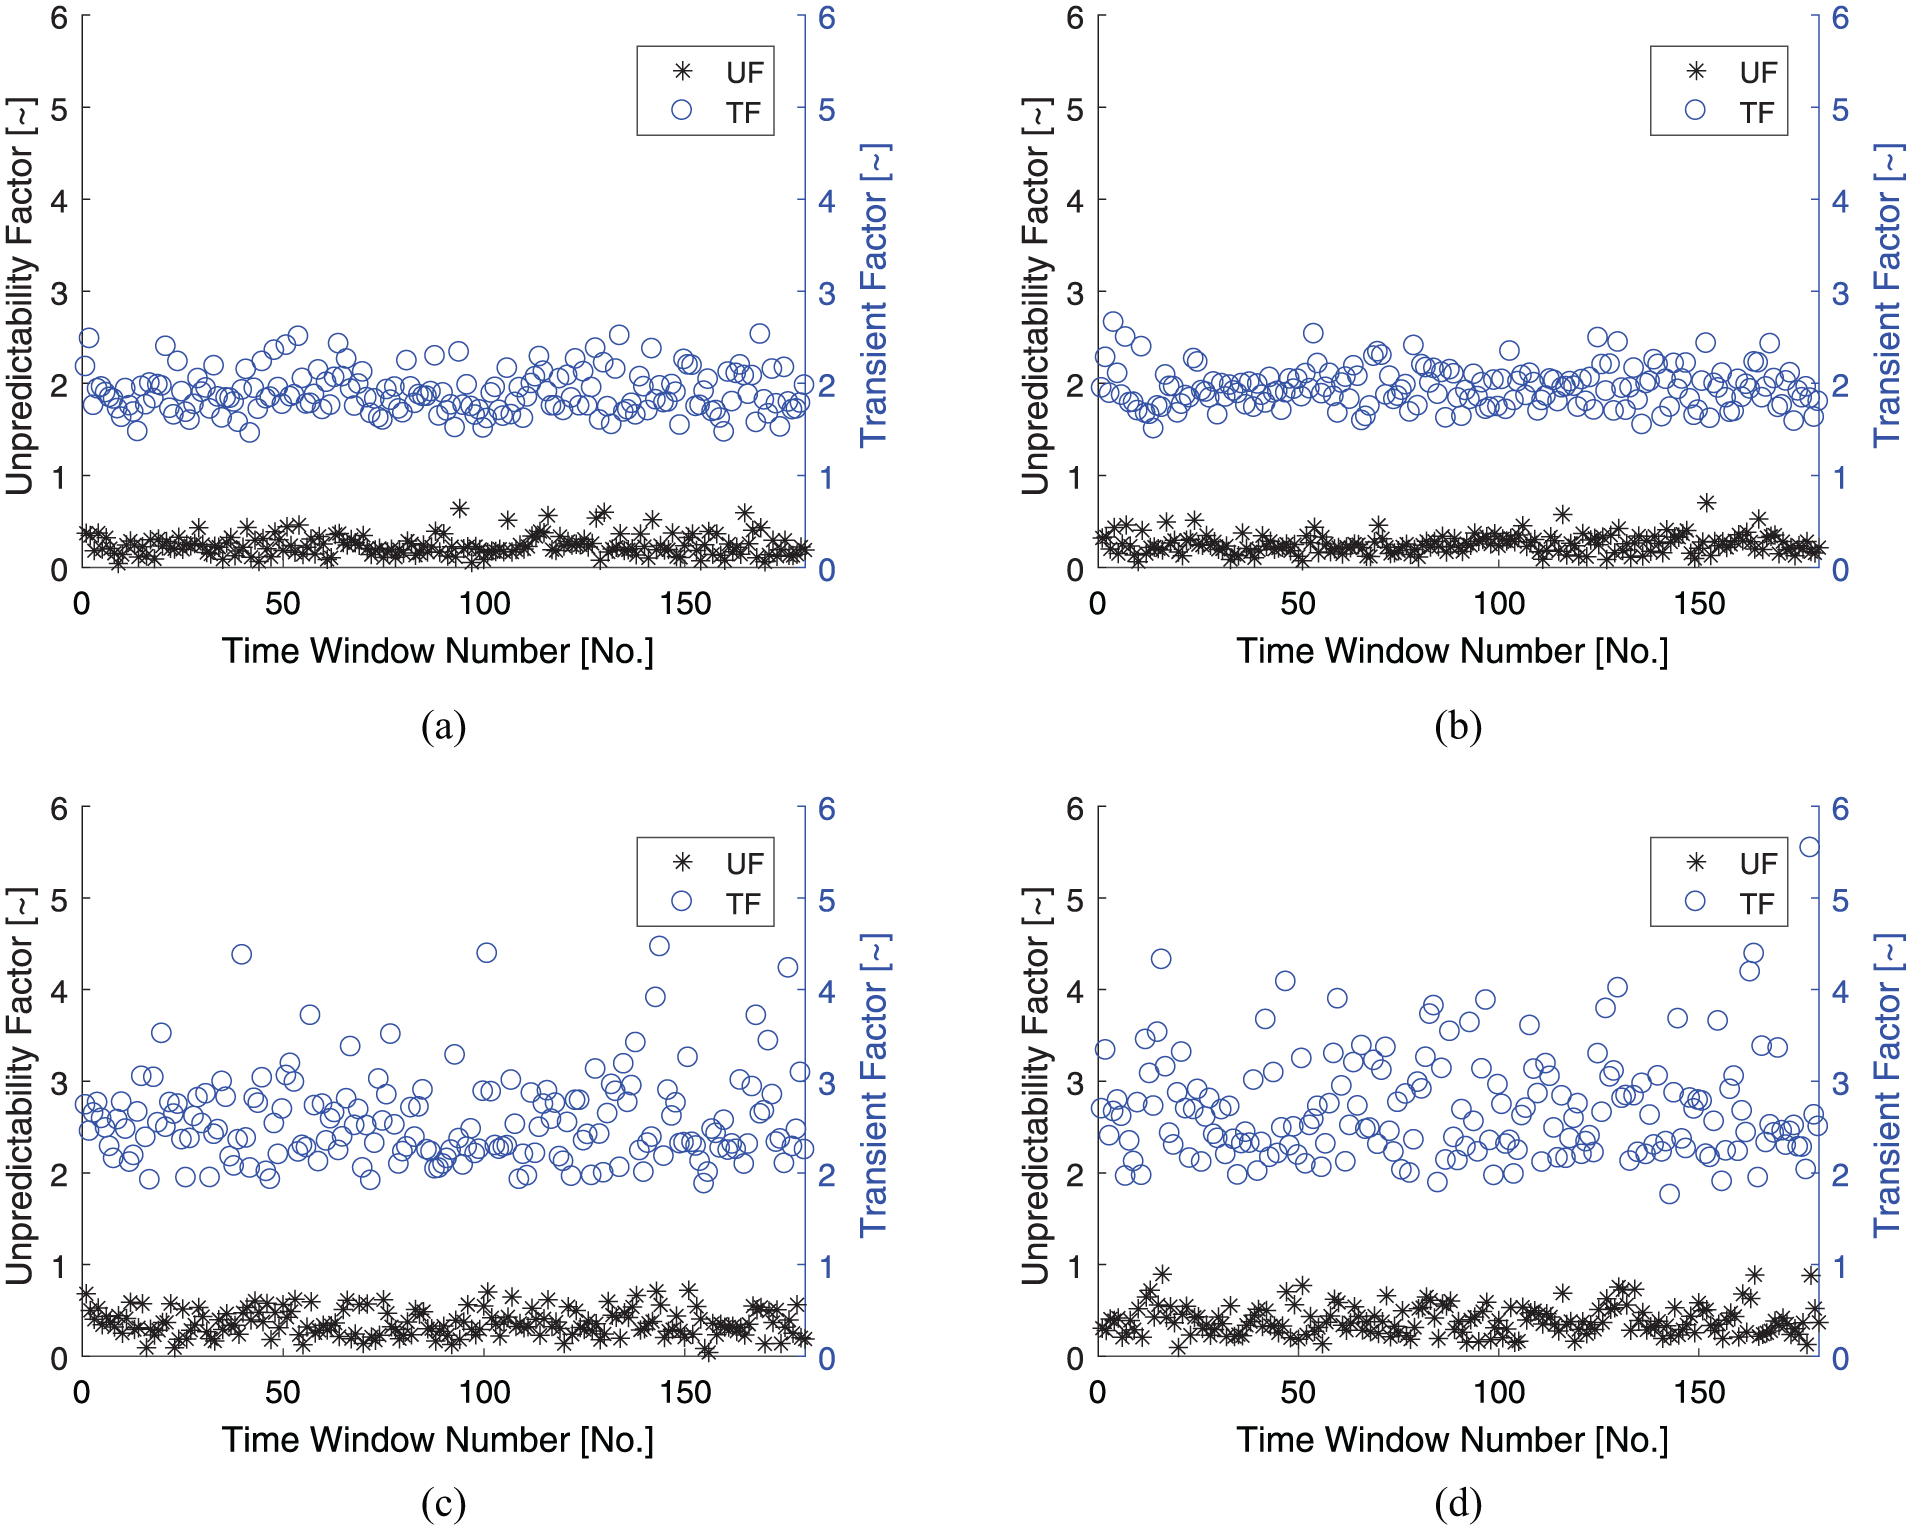
Unpredictability factor computed for (a) Sim-6, (b) Sim-13, (c) Sim-15 and (d) Sim-18. UF and TF have been computed for 60-s window moving over acceleration time history in 60 s time steps resulting in 180 windows for clarity. Integration time for MTVV, τ = 1 s. For UF, Δt = 10 s and N = 6.
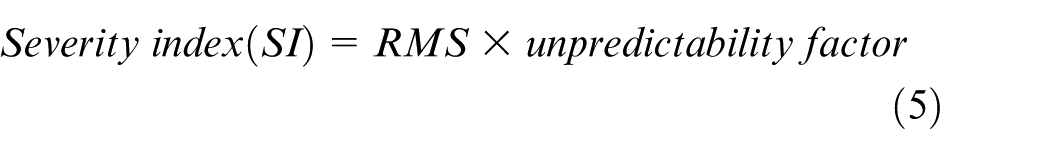
Scaling the RMS by the UF improves the ability to reproduce the severity order of the data set. The scaled measure is called severity index (SI)
The acceleration time histories sorted by SI compared with the time histories sorted by RMS are shown in Figure 5.
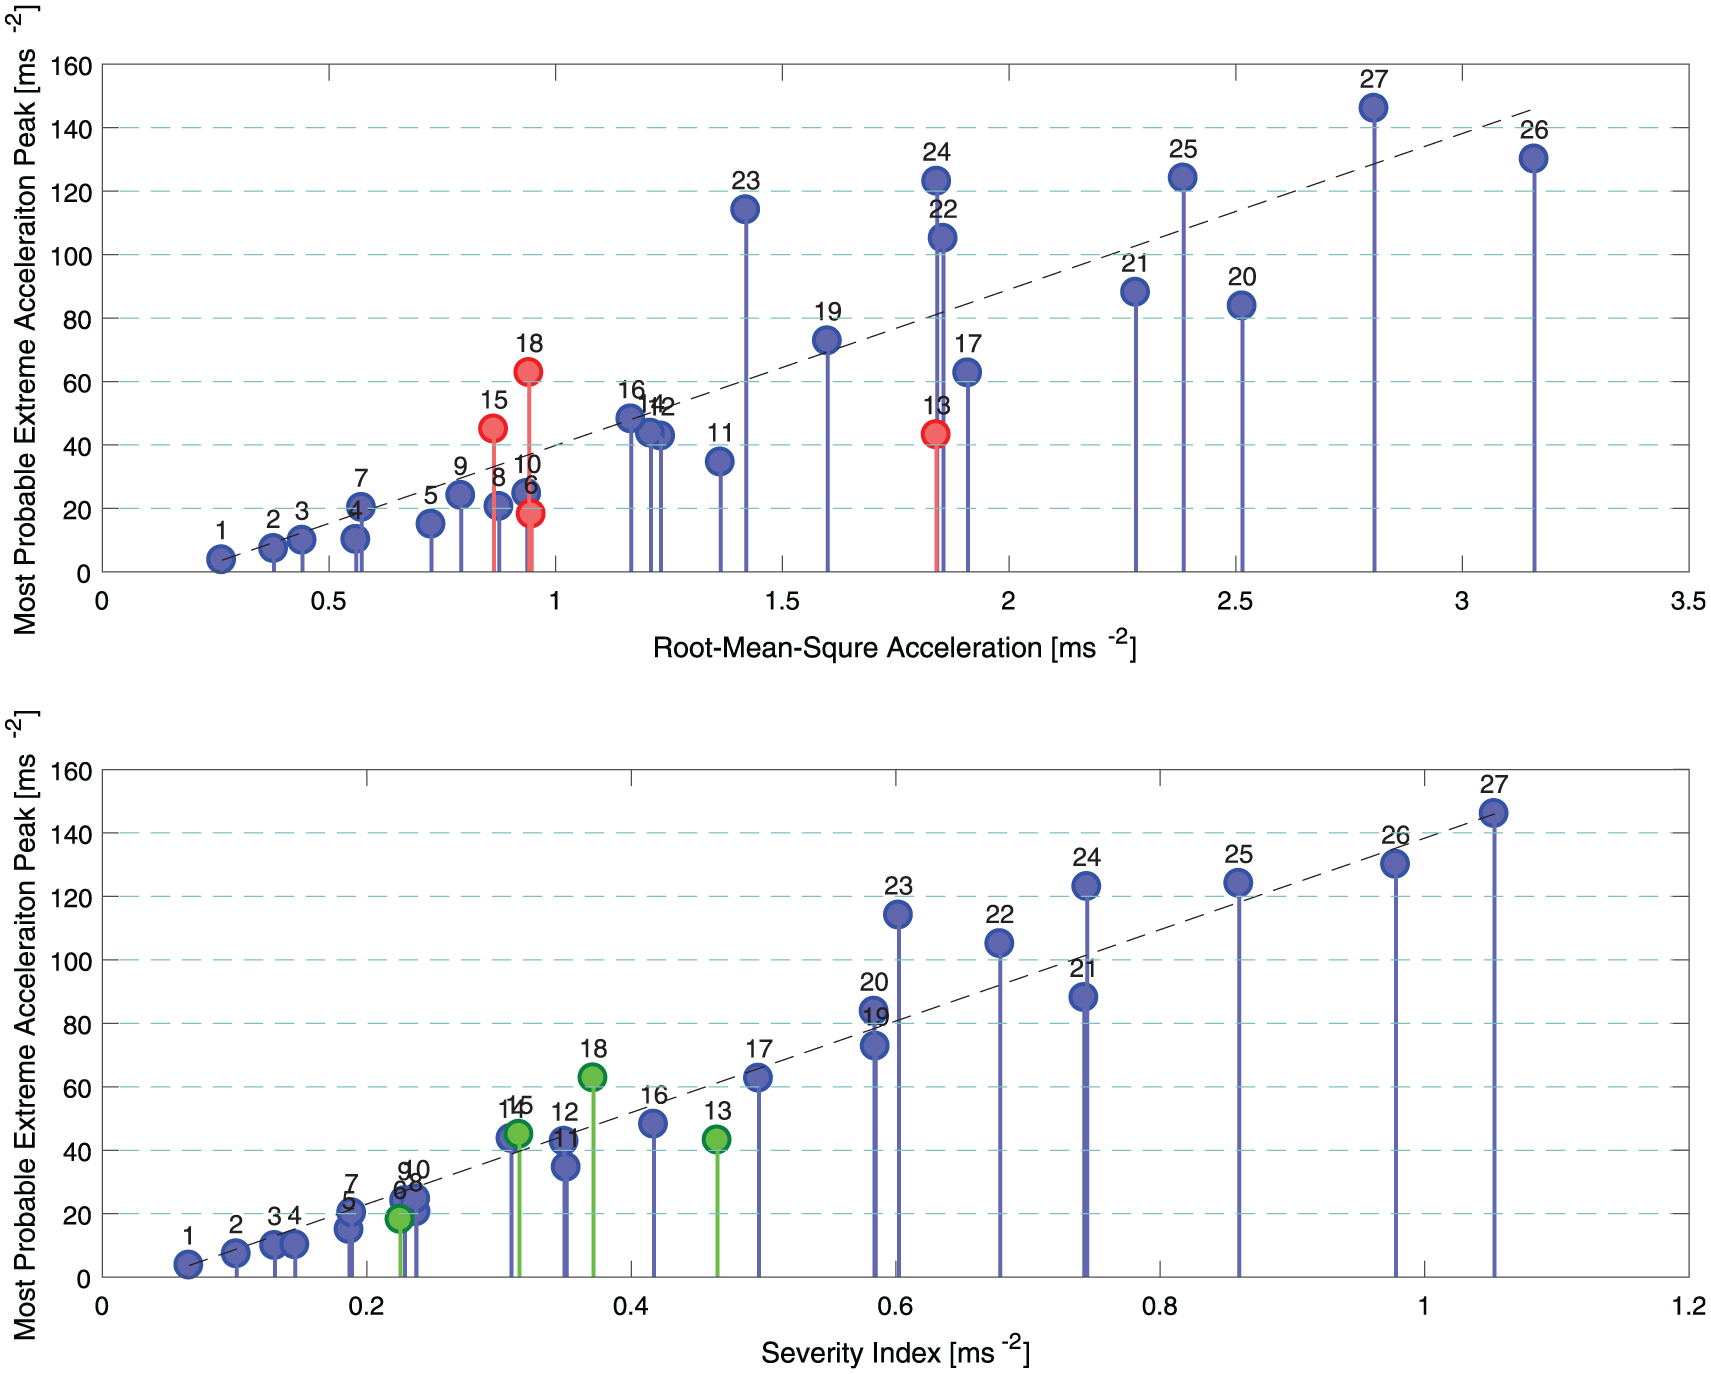
Exposure severity of the acceleration time histories in ascending order sorted according to the average RMS and average SI computed for 10,741 windows of 60 s moving at 1 Hz.
From Figure 5, it can be seen that Sim-6 and Sim-13 have been moved to the left by SI, while Sim-15 and Sim-18 have been moved to the right. Not only the discussed cases but also almost all the simulations show relative movements to the correct direction of their corresponding MPEAP severity.
SI-MPEAP correlation
The severity reference scale, that is, the MPEAPs sorted in the ascending order, is divided into three severity levels and color coded as green, yellow and red to indicate the intensities low, medium and high, respectively. The predictive indicator is the color code showing the order of magnitude of the expected impacts determined based on SI-MPEAP relationship.
For that, a relation between SI and MPEAP for the data set has been determined by fitting the data into a function of the form y = Axb. Here, y = MPEAP and x = SI and the coefficients of the function are numerically determined by least-squares fitting procedure resulting in
where
A = 163.42 and b = 1.3639.
Accumulated vibration exposure
Accumulation of vibration exposure is computed using an established measure, that is, VDV. 3 It is the time average of the fourth power of the acceleration time history defined as follows
where aw(t) is the instantaneous frequency-weighted acceleration and T is the duration of the measurement.
Validation
Functionality of SI is validated using the acceleration time histories of the 27 simulations. They are analyzed by 60 s, 1 Hz moving time window. UF is determined for 60-s window at each time step using six numbers of 10-s micro time windows, that is, Δt = 10 s and N = 6. MTVV is computed with 1-s integration time (τ = 1 s). SI is computed for the moving window every second and the predictive indicator is determined based on SI-MPEAP correlation. Predictive indicator is computed for each acceleration time history as described above. The fraction of the 10,741 computed SIs, ending up as green, yellow and red, computed for different selections of lower and upper MPEAP levels, is computed as follows

where i is the acceleration time history index (1–27), n(i) is the number of occasions that the predictive indicator displayed a particular severity level (green, yellow or red) in the ith acceleration time history and N(i) is the total number of time steps in the ith acceleration time history.
Four lower and upper MPEAP limit combinations are arbitrarily selected for the validation. Severity percentages computed for the 27 acceleration time histories as expressed in equation (8) for four different lower and upper limit combinations are shown in Figure 6.
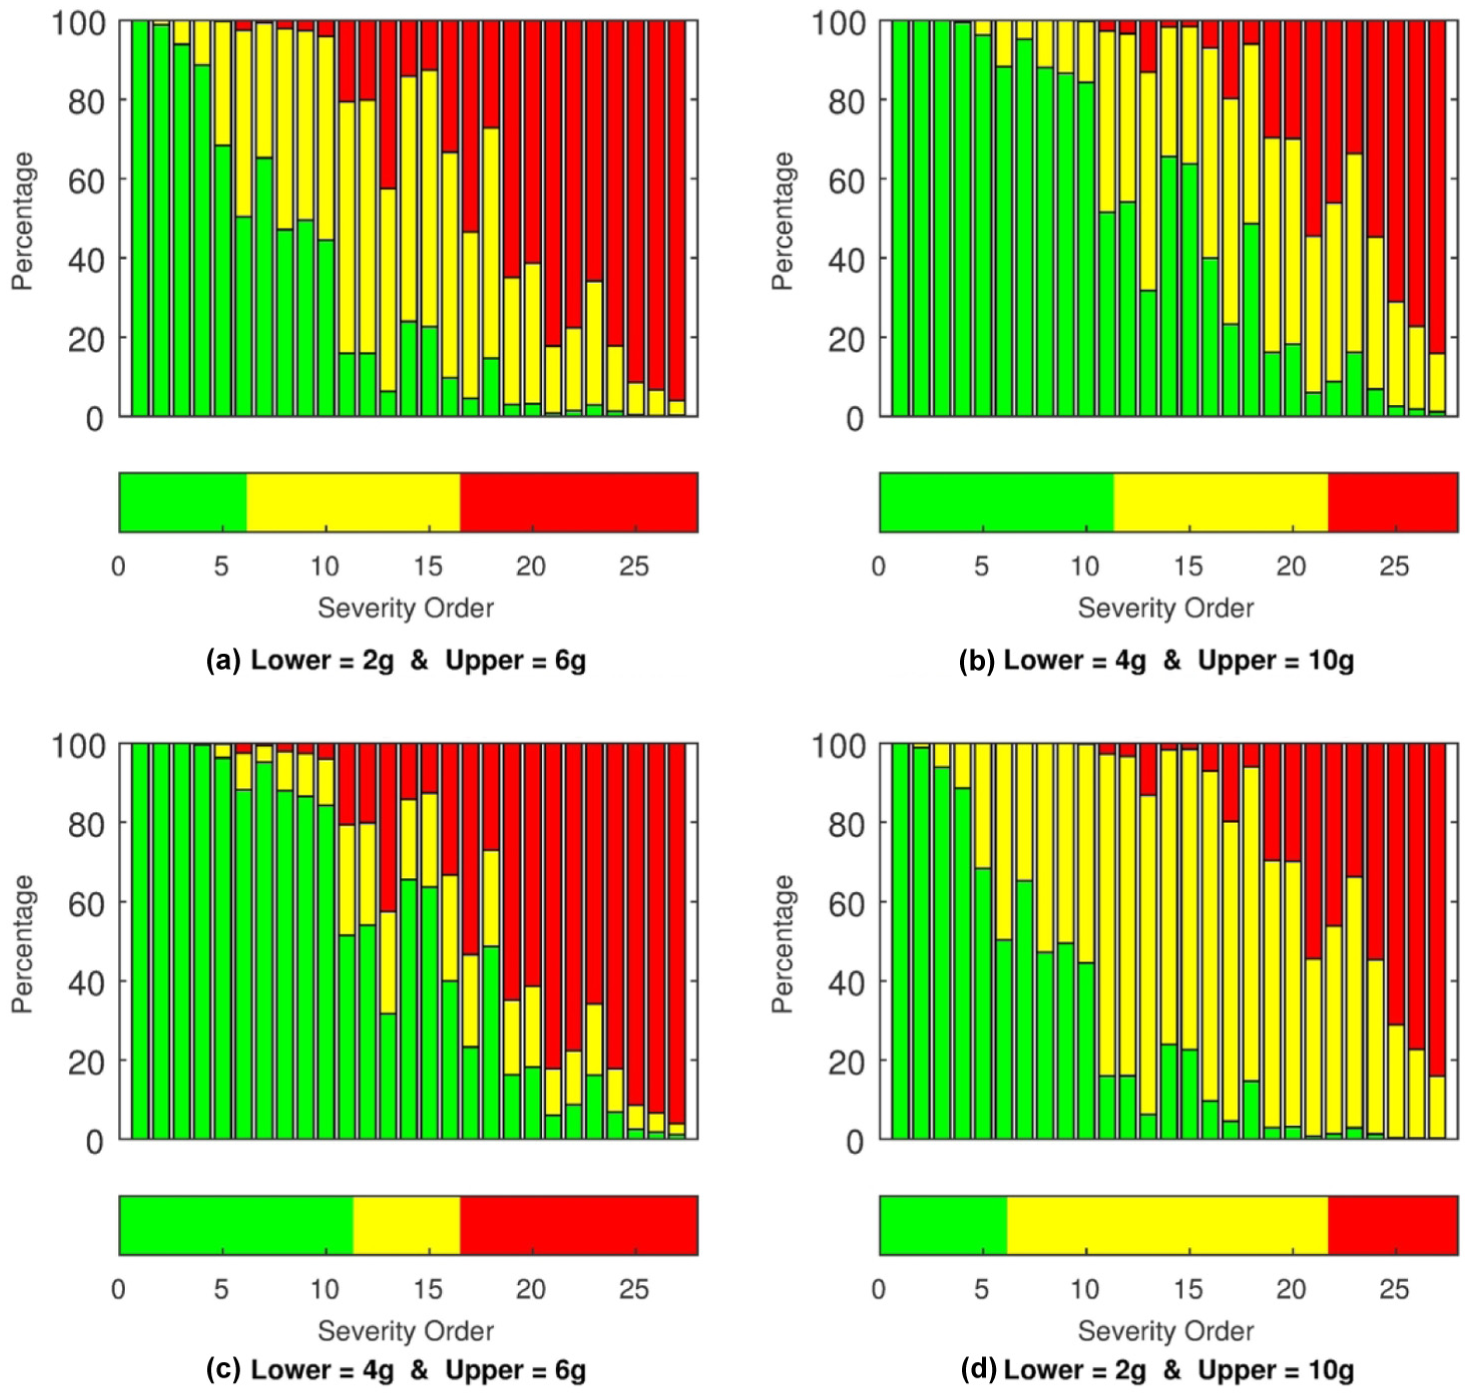
Severity percentages computed for the 27 acceleration time histories using four different lower and upper MPEAP limit combinations corresponding to (a) 2g–6g, (b) 4g–10g, (c) 4g–6g and (d) 2g–10g.
It can be seen in Figure 6 that most of the time the method is able to determine green and red severity levels with an acceptable level of accuracy. Since the yellow severity level is bounded by green and red levels, it obviously acts as a transition region in between them and the mixing of the severity percentage around the limits is clearly visible. The same is manifested in Table 5.
Severity percentage computed for the 27 acceleration time histories for the lower and upper limit combination of MPEAP = 2g and MPEAP = 6g.
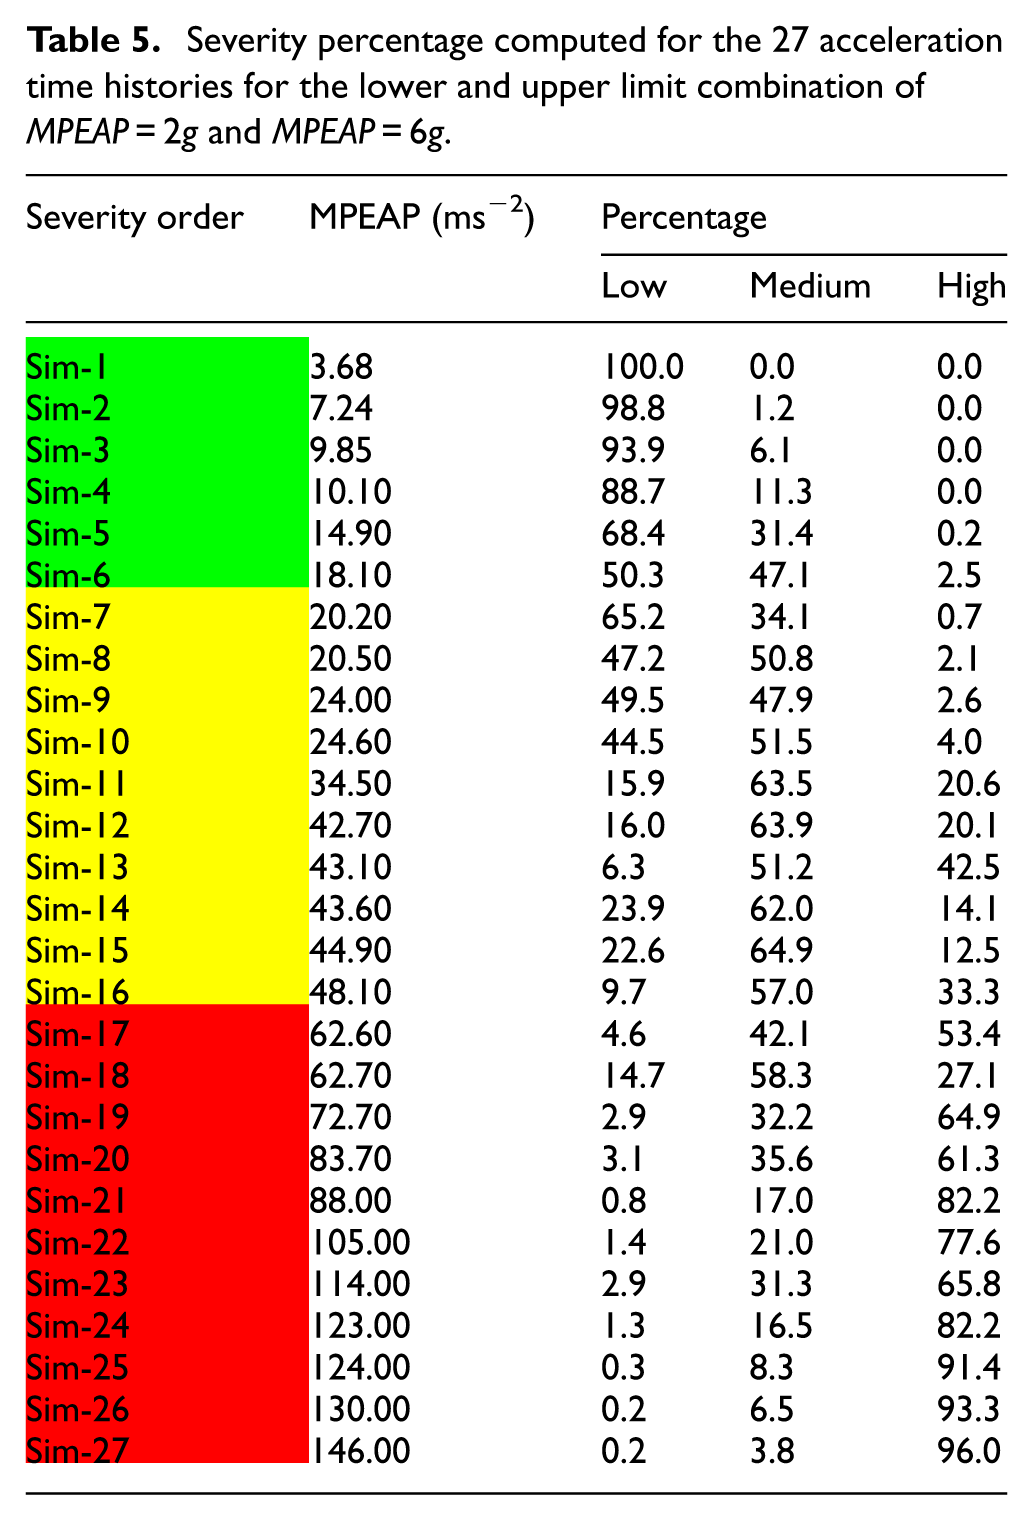
Figure 7 shows a zoomed-in 2-min window of the acceleration and the predictive indicator of Sim-21. The MPEAP limits are 2g and 6g. The severity of Sim-21 is red, MPEAP is about 9g and red is displayed 82% of the time, yellow 17% and green 0.8%. Corresponding severity indicator is displayed as a color code, green, yellow and red, every second.
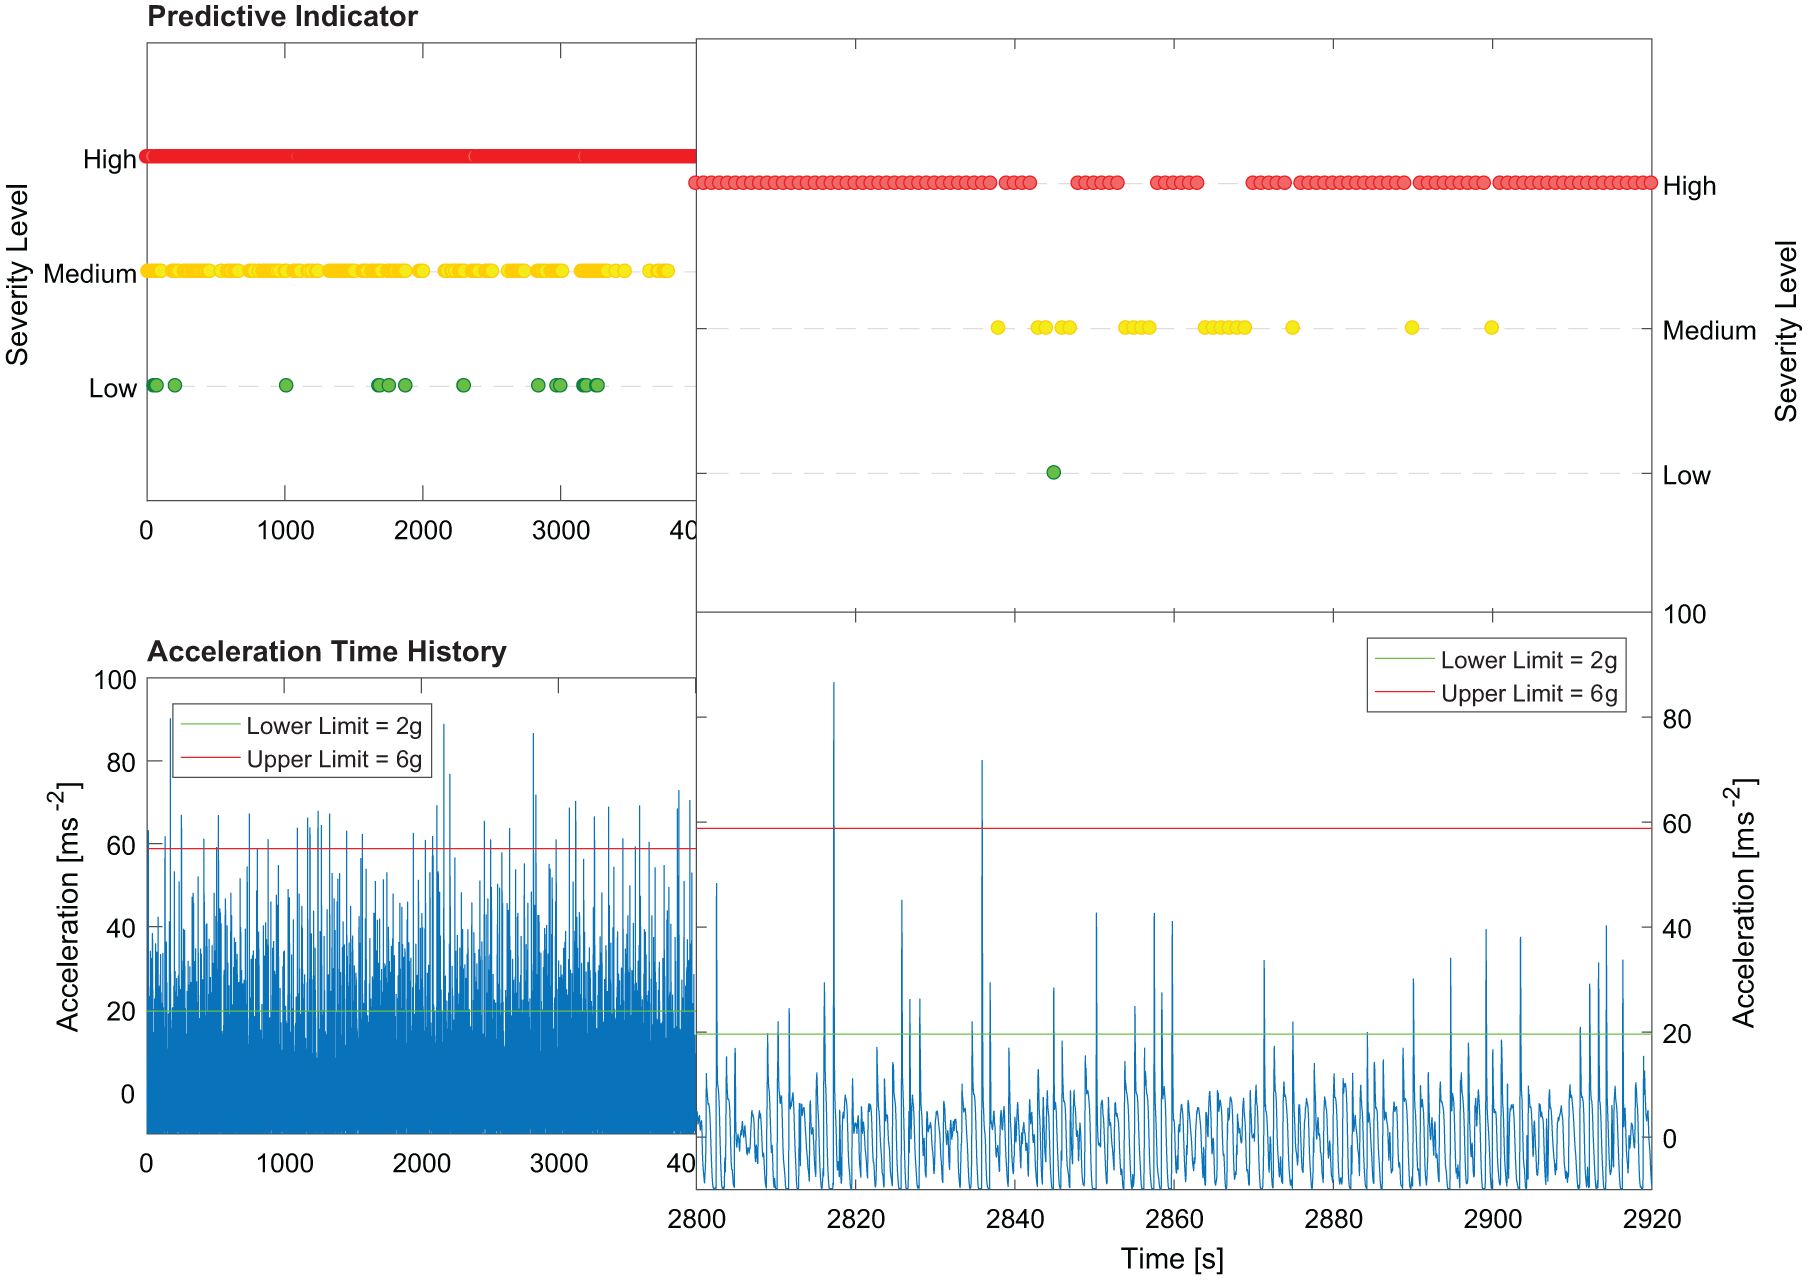
Severity feedback for the simulated acceleration time history of Sim-21. The 2-min time window between 2800 and 2920 s has been zoomed in.
It can be seen in Figure 7 that the method analyzes data every second and basically outputs the red severity color code as intended. It is important to notice that the indicator only stays yellow for a few seconds in a row and the erroneous green merely flicks for a second.
Verification
SI method applied to acceleration measurements
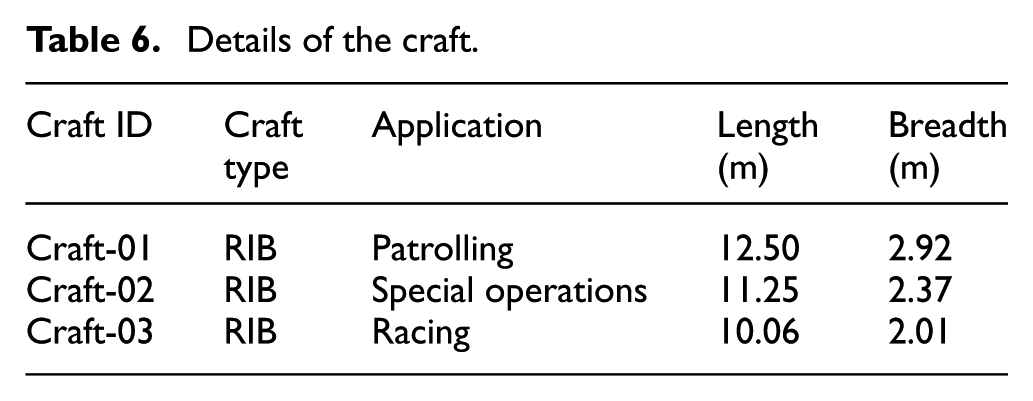
The method is verified using three actual acceleration time histories measured onboard three full-scale HPMC, details of which are given in Table 6.
Details of the craft.
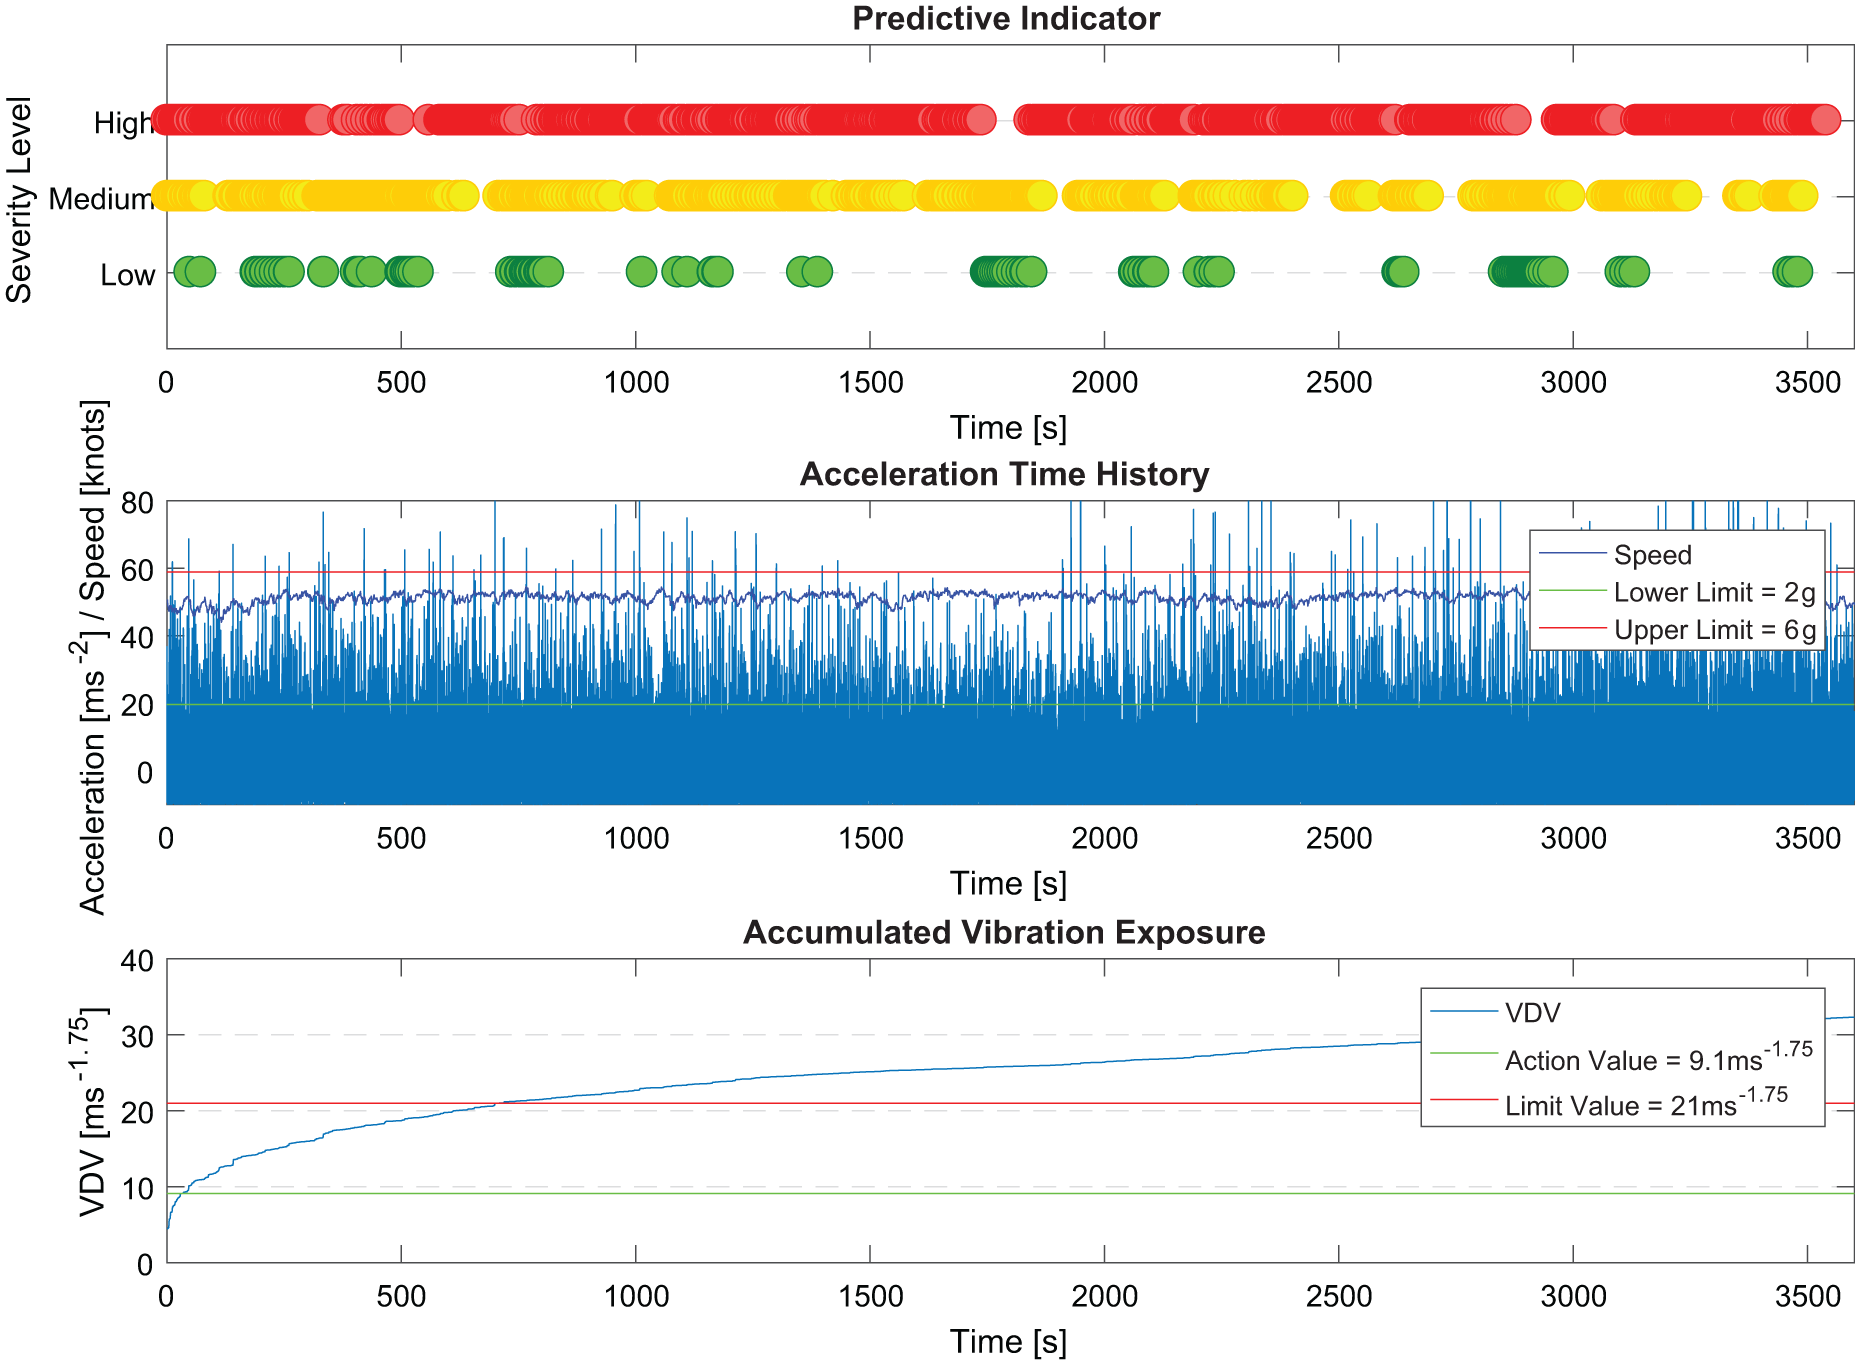
The 1-h acceleration time history of vertical acceleration (z-direction) measured at the driver seat of each craft is examined. The sampling frequency of the acceleration data is 600 Hz. The signals are low-pass filtered at 100 Hz. SI is computed using 60 s, 1 Hz, moving time window. The severity levels are set to MPEAP, 2g and 6g.
Noticing that it takes 20 min to reach the VDV = 9.1 ms−1.75 action value 5 and that the VDV growth is very slow indicating overall reasonably moderate conditions during the patrol mission of Craft-01 (Figure 8). Although the color code output is related to the somewhat arbitrarily selected limits, the SI characterizes the conditions basically as green, with some rougher sequence around t = 1000 s where acceleration time series show higher magnitude.
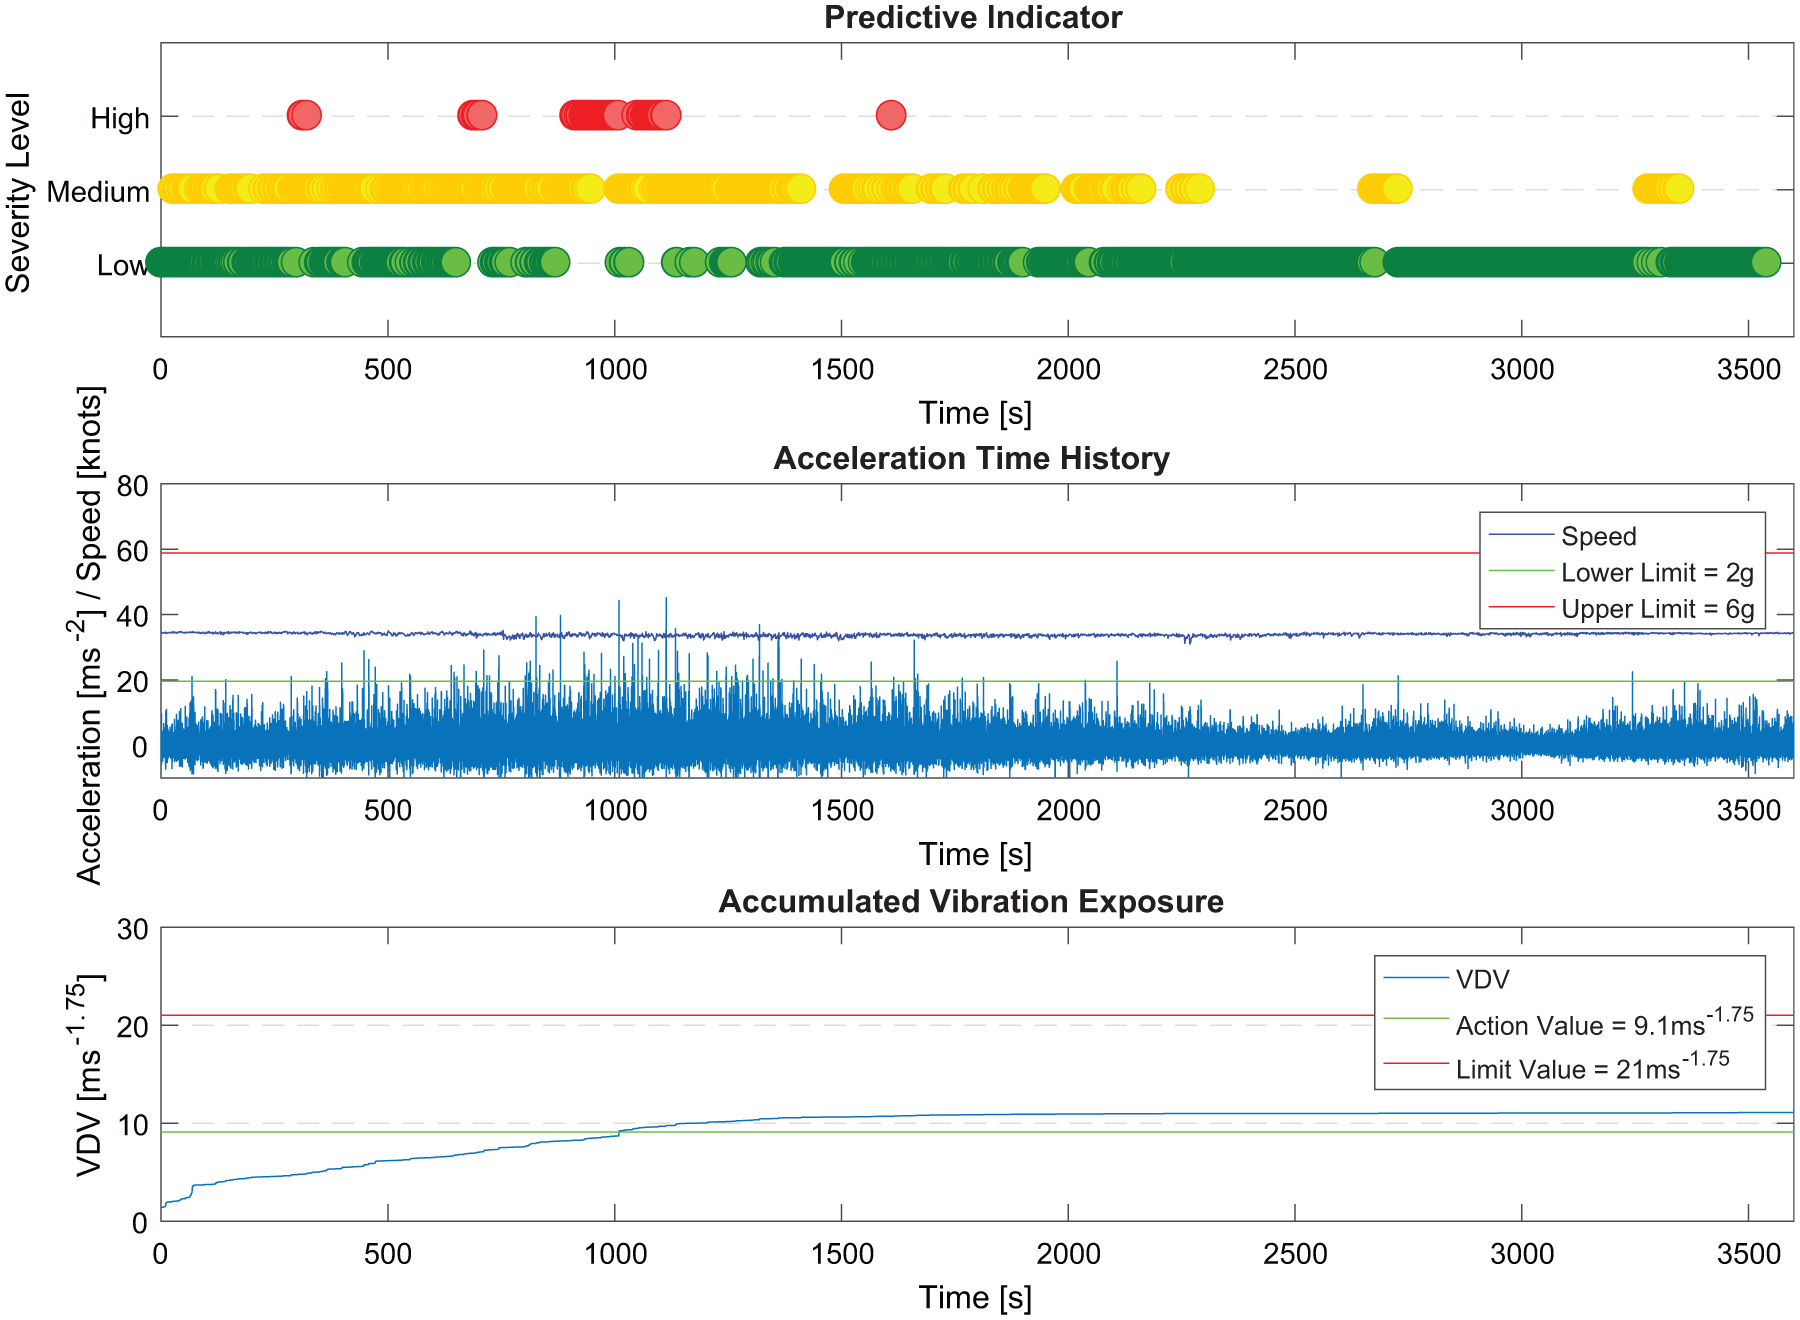
Indication of exposure severity due to instantaneous impact exposure and accumulated vibration exposure for Craft-01.
Again, using the dose (VDV) development as an indicator for ride severity, it is observed that the ride with Craft-02, in general terms, is rougher with clear acceleration magnitude variation which also is reflected by the predictive indicator (Figure 9).
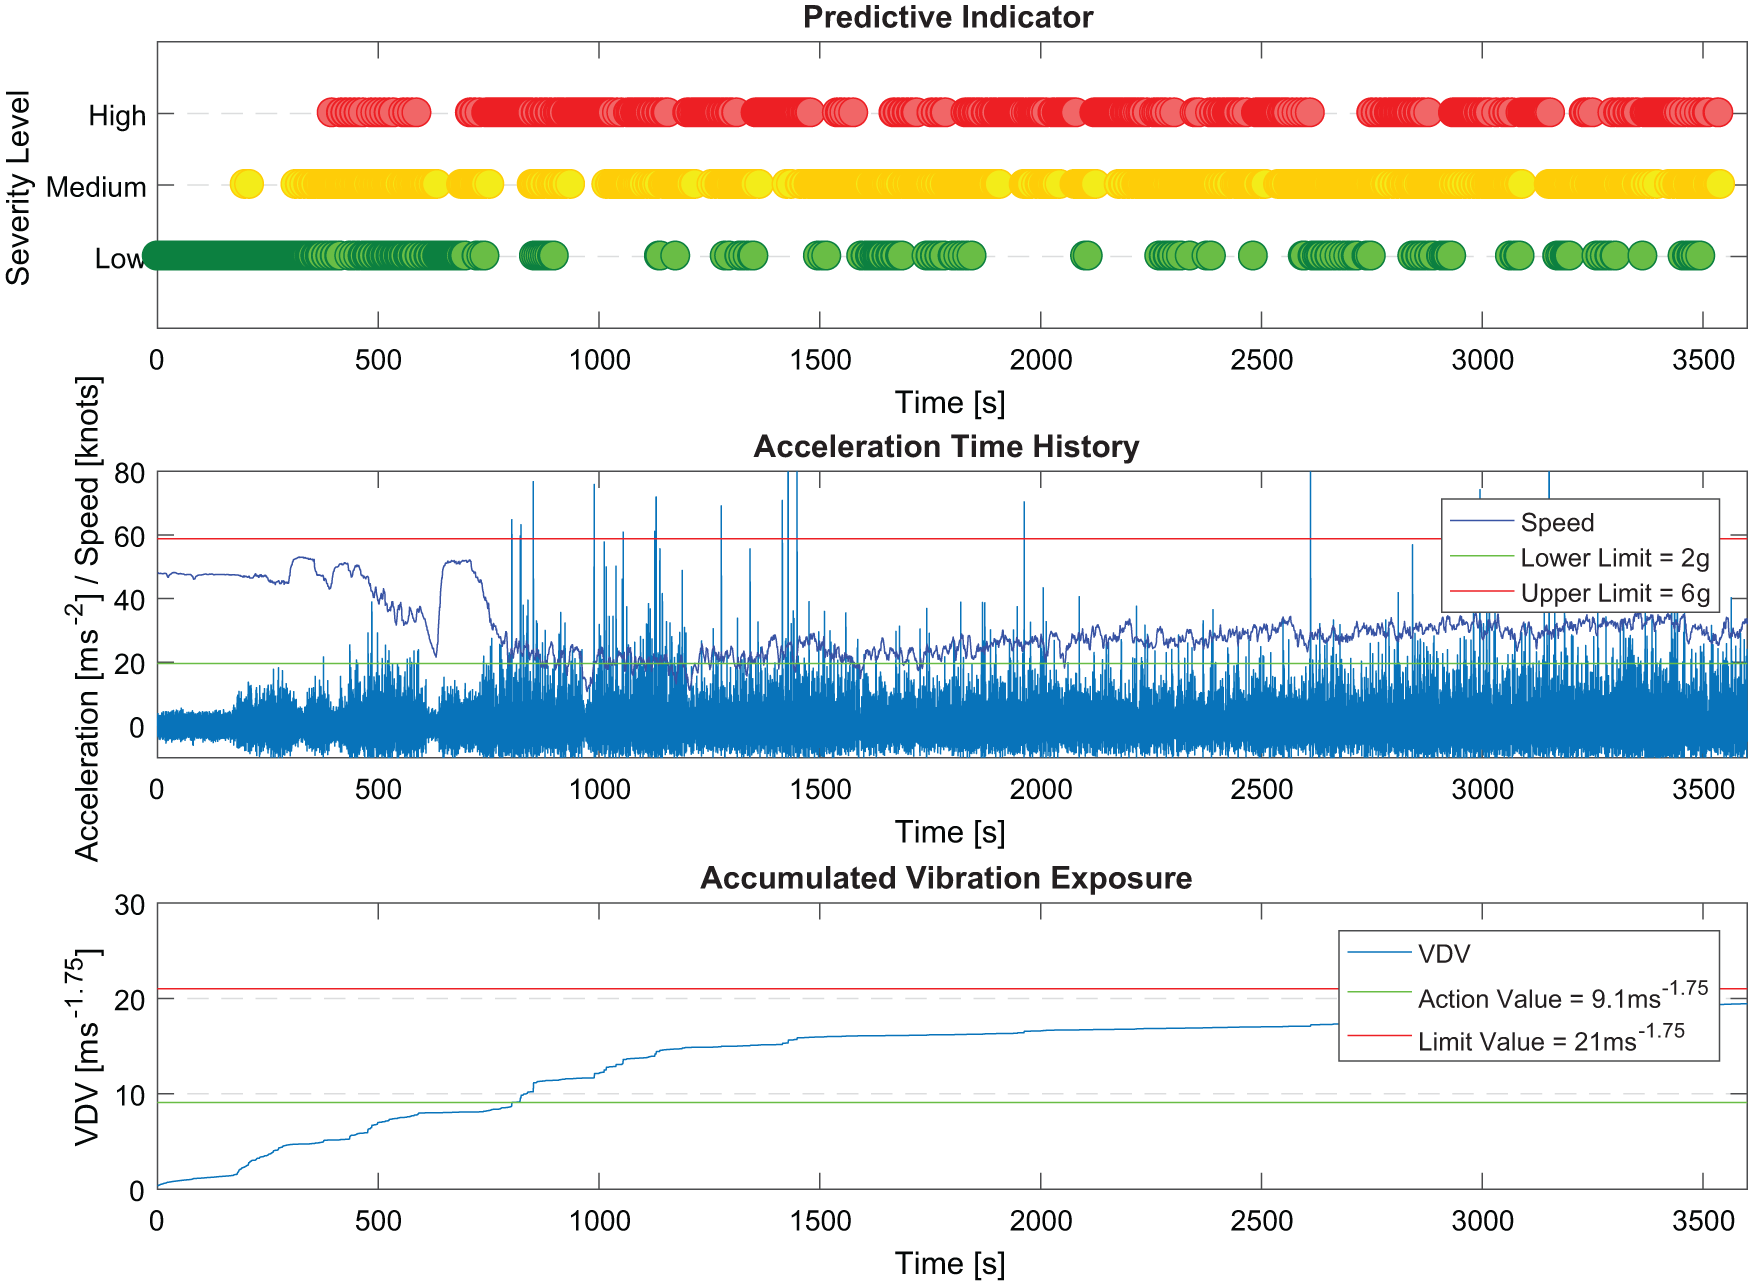
Indication of exposure severity due to instantaneous impact exposure and accumulated vibration exposure for Craft-02.
The third case (Figure 10) is undoubtedly the roughest, concluded both by the VDV exceeding the limit value in about 10 min and by the regularity of high peaks seen in the acceleration time history.
Indication of exposure severity due to instantaneous impact exposure and accumulated vibration exposure for Craft-03.
The results shown in Figures 8–10 verify that the method computes SI, determines the predictive indicator and then updates the crew every second. The action and limit values, as given in the European Parliament and the Council of the European Union 5 for accumulated vibration exposure, have also been indicated in Figures 8–10. It is important to observe in Figures 8–10 that even when the accumulated exposure, that is, VDV, is lower than the legislated action and limit values, 9.1 and 21 ms−1.75, respectively, 5 the method displays high severity level, red predictive indicator and vice versa, indicating the significance of considering both impact events and the accumulation in the feedback method.
Discussion
If it is assumed that the analyzed data set represents a considerably large range of peak acceleration processes, the SI-MPEAP relationship is, in principle, boat independent. This means that a craft of any size and geometry, at any speed and sea state that leads to a peak acceleration process describable by a Weibull distribution with shape and location parameters ranging within that of the investigated data set, could be estimated to its 3-h MPEAP magnitude by computing the proposed measure, SI.
Although the 27 three-hour time histories provide considerable amount of exposure data covering a large range of MPEAPs, Figure 2(a) shows that MPEAPs are not uniformly distributed covering the entire range of MPEAPs. Moreover, the simulations do not cover the whole range of possible probability distributions in between the minimum and the maximum MPEAP values, that is, 3.68 ms−2 and 146 ms−2. Therefore, this feedback method can further be investigated by increasing the number of simulated acceleration time histories, thus more and equally distributed data points representing the whole range of MPEAPs as well as vast variety of probability distributions. This needs systematically developed series of simulations covering a range of defined probability distributions with pre-defined range of shape and location parameters. Such study will allow the feedback method to be generalized independent of the craft design and operational parameters and for considering only the craft acceleration response.
The method is prone to display incorrect predictive indicator around the limits, as can be seen in Table 5. It can also be observed in Figure 7, in the validation of Sim-21, that the occasions of displaying green instead of red, which is 0.8% of the severity percentage for 3-h exposure, do not consistently last longer than for about 2 s and that the occasions of displaying yellow which is 17% last only for about 10 s. Although the risk of misindication can be lowered by increasing the update frequency of the method, in reality, craft operators cannot continuously keep their attention on the feedback display. Therefore, the determination of severity can be further refined by introducing a Boolean logic to decide the severity based on the fraction of predictive indicators computed during the immediate 15 s to 30 s of history. When the Boolean logic is applied for the immediate 15 s of history at every 1-s time step, the severity percentage for Sim-21 improved from 0.8%, 17.0% and 82.2% to 0.0%, 8.4% and 91.6% for green, yellow and red, respectively.
The idea is that the predictive indicator should make the crew aware of the severity of their ride and in that case it is feasible to take operational action to diminish the impact exposure, for instance, by changing the speed, course or posture. The dose indicator is exposure time dependent and can similarly be used to decide to abort a mission, change the crew or reduce the craft speed to decrease the dose growth. For following up the long-term exposure, in line with the intention of ISO 2631-5, 4 the VDV or Sed could individually be logged for crew members.
As indicated in the article, the ranges of green, yellow and red are arbitrary. The association of vibration exposure in terms of impact acceleration and vibration dose with human response in terms of adverse health effects and/or degraded performance has still not been fully understood. Therefore, recommendations for green-to-yellow or yellow-to-red limits need further research. The proposed approach determines a statistically well-defined peak acceleration value, that is, MPEAP, as a reference for impact exposure. Together with the established VDV, the dual excitation characteristics, that is, vibration and shock (random and transient), are monitored.
It is potential to scale the MPEAP using the acute effects of the impacts on human body, for instance, ultimate strength of functional spinal units (FSU) or the human tolerance to impact acceleration 12 based on the impact–injury relationships. Similarly, relationships between vibration dose and the incidence of adverse effects can also be quantified. Since the MPEAP and incidence are probabilistic measures, exposure severity can later be determined in terms of risk using impact–injury and dose–effect relationships. These relationships can further be strengthened by epidemiological and experimental data.
Summary and conclusion
A real-time feedback method is developed in order to determine severity of impact exposure and accumulated vibration exposure aboard HPMC and communicate it to the crew. A measure, SI, is developed to probe the severity of impact exposure, at a given point in time, during real-time operations by means of the latest 60-s exposure history. Severity due to instantaneous impact exposure is expressed in terms of the MPEAP and linked to the SI, the product of the RMS and the UF, designed to catch the impact characteristics of the acceleration processes. The method is derived from a data set of 27 simulated, 3-h acceleration time histories of a 10-m planing craft. The VDV is selected for analyzing the effect of the accumulated vibration containing multiple shocks on humans.
It is concluded that the SI radically improves the ability to rank the severity order of the 27 simulated acceleration time histories compared with the ranking based on the RMS. The SI rarely misinterprets the severity, that is, showing red, high severity level, instead of green, low severity level, or vice versa in the order of a few percent of the 1 Hz feedback. Examples also show that these rare misinterpretations are spread over the 3-h time history and the incorrect severity indications last only for a few seconds in a row. It is also concluded that the method is able to recognize an adequate MPEAP severity level by analyzing 60-s vibration sequences, which is appreciated to be of representative timescale for stationary operational conditions. On this basis, the SI is concluded capable of a decent characterization of the ongoing stochastic acceleration process within a sufficiently short time indicating the acceleration levels that are to be expected during the present state of operation.
Three actual acceleration time histories measured aboard full-scale HPMC are used to illustrate the crew feedback of severity due to instantaneous impact and accumulated vibration exposures. It is concluded that the method developed for analyzing the instantaneous impact exposure works as a severity indicator where the limits between green-yellow and yellow-red are selected based on MPEAP values. It is appreciated that the occurrence of acute injuries can be related to MPEAP magnitudes guiding to the severity limits. Accumulated vibration exposure determined by VDV is associated with crew psychophysical fatigue resulting in performance impairments, which also functions as a severity indicator. When the relationship between the exposures and the outcomes is better understood, it will set the severity limits for VDV color coding. Finally, appropriate epidemiological and experimental data are required for aptly linking the exposure conditions containing vibration and shocks with the adverse health and performance effects in HPMC personnel (persons who ride and operate these craft) and setting up the design and operational limits.
Footnotes
Declaration of conflicting interests
The author(s) declared no potential conflicts of interest with respect to the research, authorship, and/or publication of this article.
Funding
The author(s) disclosed receipt of the following financial support for the research, authorship, and/or publication of this article: This research is funded by the Gösta Lundeqvist foundation for ship research (Gösta Lundeqvists stiftelse för skeppsteknisk forskning) and the Swedish Maritime Administration (Sjöfartsverket).