
Abstract
Material flow analysis is used to identify and quantify the flow of phosphorus (P) in ship-generated food waste and wastewater. Passenger, cruise, RoPax and cargo ships in the Baltic Sea were investigated in three scenarios: (1) if all waste is discharged to sea, (2) if all waste is disposed of ashore or (3) if the food waste fraction is disposed of ashore and wastewater is treated on-board. About 107 tonnes of P is generated annually in the waste streams, with highest contribution of approximately 62 tonnes (58%) from wastewater in the ship-category RoPax. Approximately 24 tonnes of P is contained in the food waste generated by the ships in the study. Forthcoming regulations over allowed nutrient concentrations in sewage will lead to 80% reduction in P from passenger ships and can reduce about 31 tonnes of P entering the Baltic Sea environment. If both sewage and grey water instead are offloaded in port reception facilities, about 76 tonnes of P-reduction to the sea can be reached. As most phosphorus recovery practices currently only are available on land it is recommended to direct the waste streams to port reception facilities for further treatment ashore.
Introduction
Challenges associated with global scarcity of phosphorus, an essential element for all living organisms, have recently been discussed in numerous publications.1–3 According to research, the phosphorus supplies will not keep pace with the demand and the reserves will be exhausted in about 50–100 years. 4 Therefore, actions should be taken that cover opportunities for improving efficient use and reuse of this element. 2 Phosphorus can potentially be recovered from mixed wastewater streams, or from separate organic waste fractions. 5 Current research is focused on recovery of struvite from the wastewater as this process has the potential to remove phosphorus from wastewater byproducts and provide an alternative source of phosphate fertilizer.4,6 Expanding the effort to find new sources for recycling of phosphorus is highly relevant.
By recycling and reusing, the negative effects of phosphorous as excessive nutrient can also be reduced. In certain areas such as the Baltic Sea, eutrophication is a serious pollution problem. 7 The annual inputs of phosphorus to this sea area amount to about 38,300 tonnes. 8 The majority of the phosphorus enters the Baltic Sea as waterborne and the atmospheric contribution is estimated to be about 5.5% of the total phosphorus input. 8 Most of the phosphorus enters the sea from sources located on land, but an additional source of this nutrient are the wastes generated on-board ships. The area is heavily trafficked with approximately 2000 ships operating at every moment. 9 The ship-generated waste streams that can be legally discharged to the Baltic Sea are sewage, food waste (FW) and grey water (GW). Sewage, also called black water (BW), is wastewater that originates from toilets, medical facilities, premises for living animals or other wastewaters when mixed with those drainages. 10 Untreated BW can be discharged to the sea if the ship is travelling at least 12 nautical miles (NM) from the nearest land, whereas treated BW can be discharged closer to the land. 11 GW is collected from dishwater, shower, laundry, bath and washbasin drains, and its discharges are not limited by the international law. 12 FW generated on-board can be any ‘spoiled or unspoiled’ foods and food scraps. 13 According to the regulations, ships may discharge ground FW overboard in the Baltic Sea when the ship is further than 12 NM from the nearest land.
An alternative to sea disposal is to dispose of the wastes in the port reception facilities (PRFs) which is a common handling of sewage from passenger ships in regular traffic.14,15 Other options are to treat the GW together with the BW in the marine sewage treatment plants (STPs) or to dispose it of in PRFs. Only officially approved marine STPs are allowed to be installed on-board ships, and the quality of the treated wastewater has to meet criteria stated in respective International Maritime Organization (IMO) resolutions.16–18 More stringent sewage regulations will apply for new passenger ships from 2019 onwards and for all passenger ships from 2023, as the Baltic Sea has been designated as Special Area under MARPOL Annex IV. The regulations will require that all passenger ships in the Baltic Sea that do not dispose of the sewage ashore must treat the sewage on-board using equipment capable to reduce nutrient content. 19 According to these requirements, the concentration of phosphorus in the effluent should be either maximum of 1 mg P/L or else at least 80% reduction of P content is required. 18 This limit is in the same order of magnitude as for the effluent from municipal wastewater treatment plant, set by the European Union (EU) directive. 20 Also, Baltic Marine Environment Protection Commission (HELCOM) recommendations set P requirements to wastewater treatment plants to be 0.5–5 mg/L depending on their size. 21 FW from ships in international traffic that have visited at least one port outside EU is considered as international catering waste (ICW) in EU and thus subject to special regulations ashore. 22 Catering waste and material that has been in contact with this waste must, due to risk of spreading diseases, be managed by incineration or burial in an authorized landfill, and therefore conversion to compost or biogas is not a feasible alternative.
Other waste streams from ships that can be relevant for the phosphorus load are the bilge water (BLG) and atmospheric contribution. BLG which gets accumulated in the lowest part of the ship is a mixture of different substances from machinery, spills and overflow tanks. This wastewater can be disposed either of ashore or into the sea when the ship is en route and if the oil content does not exceed 15 ppm. 23 Atmospheric contribution of phosphorus from ships is regarded limited because marine fuels contain very little (<15 ppm) phosphorus. 24 The lubricant used in ships’ engines may contain phosphorus and typically 1–2 g/kW h of the lubricant is combusted during normal operation of a ship.
To estimate the total amount of phosphorus available for recovery, it is necessary to describe the phosphorus content in different materials. There are studies on phosphorus flows in cities, countries and industry, but the role of shipping in the anthropogenic part of the phosphorus cycle is not well known. The main goal of this article is to, with help of flow analysis, identify and estimate the flow of phosphorus in the sewage, FW and GW generated on ships in the Baltic Sea. A further goal is to study the effect of the forthcoming stringent sewage regulations on the distribution of phosphorus flows.
Methodological approach
Material flow analysis (MFA) is ‘a systematic assessment of the flows and stocks of materials within a system defined in a space and time’. 25 The materials analyzed can be either substances (e.g. elements such as phosphorus) or goods. MFA is a tool that helps recognize issues, set priorities, analyze and improve effectiveness of measures for the efficient and sustainable material management.25–27
The discussed system in this study is called the ‘shipping system’ and the system boundary is set to include ships travelling in the Baltic Sea (Figure 1). The shipping system is embraced by ‘anthroposphere’ which is a system of human activities and habitats. There is a further system boundary between ‘anthroposphere’ and ‘natural environment’ to emphasize a difference between man-made and natural environment. Phosphorus enters the discussed system through food and detergents provisions. There are few outflows of phosphorus from the system, mainly through the management of the FW and the wastewaters generated on-board. The flows are described in Table 1.
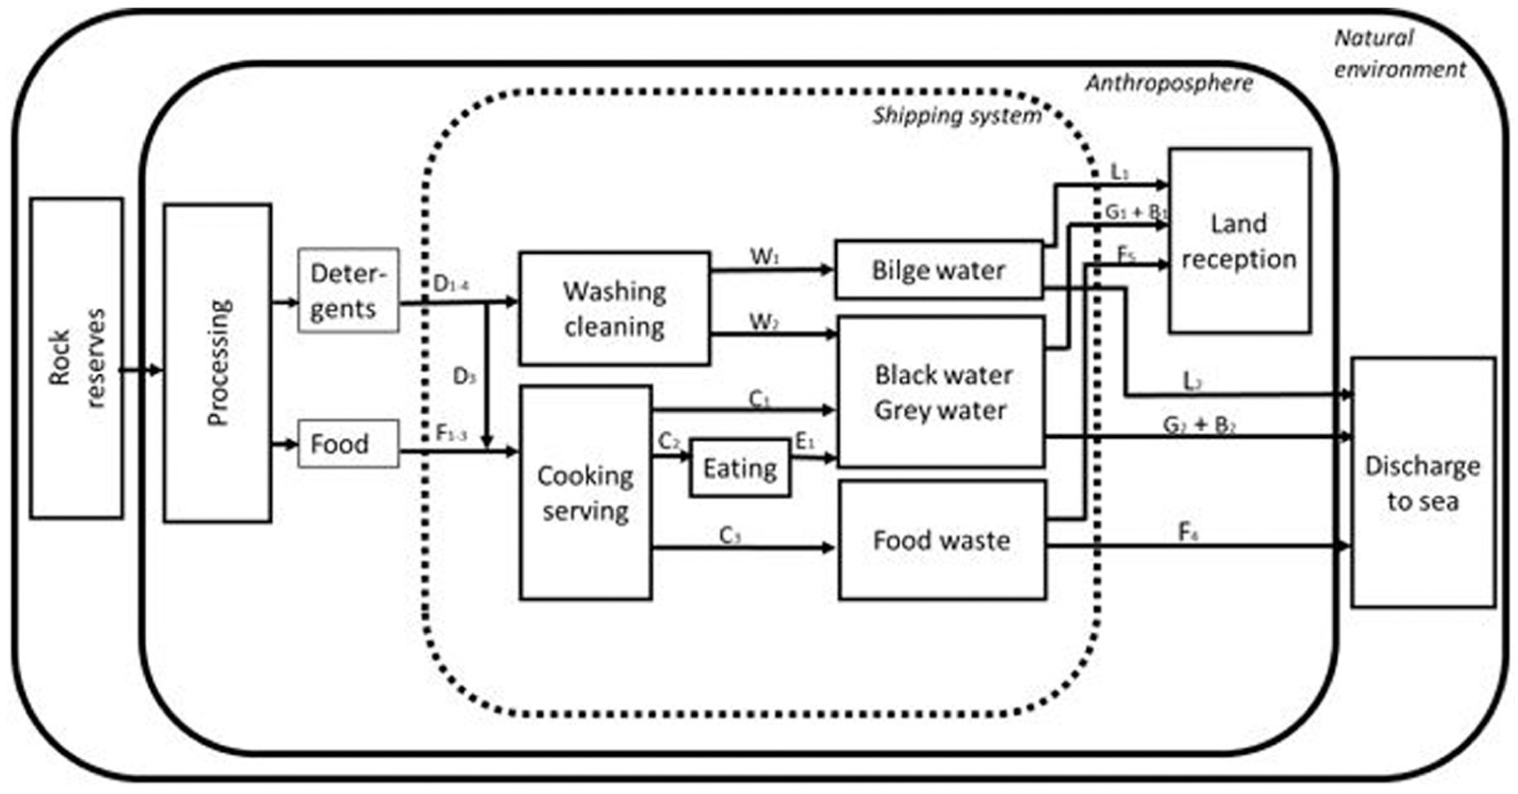
Simplified overview illustrating phosphorus input and output flows in the shipping system where the system boundary is marked with a dotted line.
Quantification of P flows.
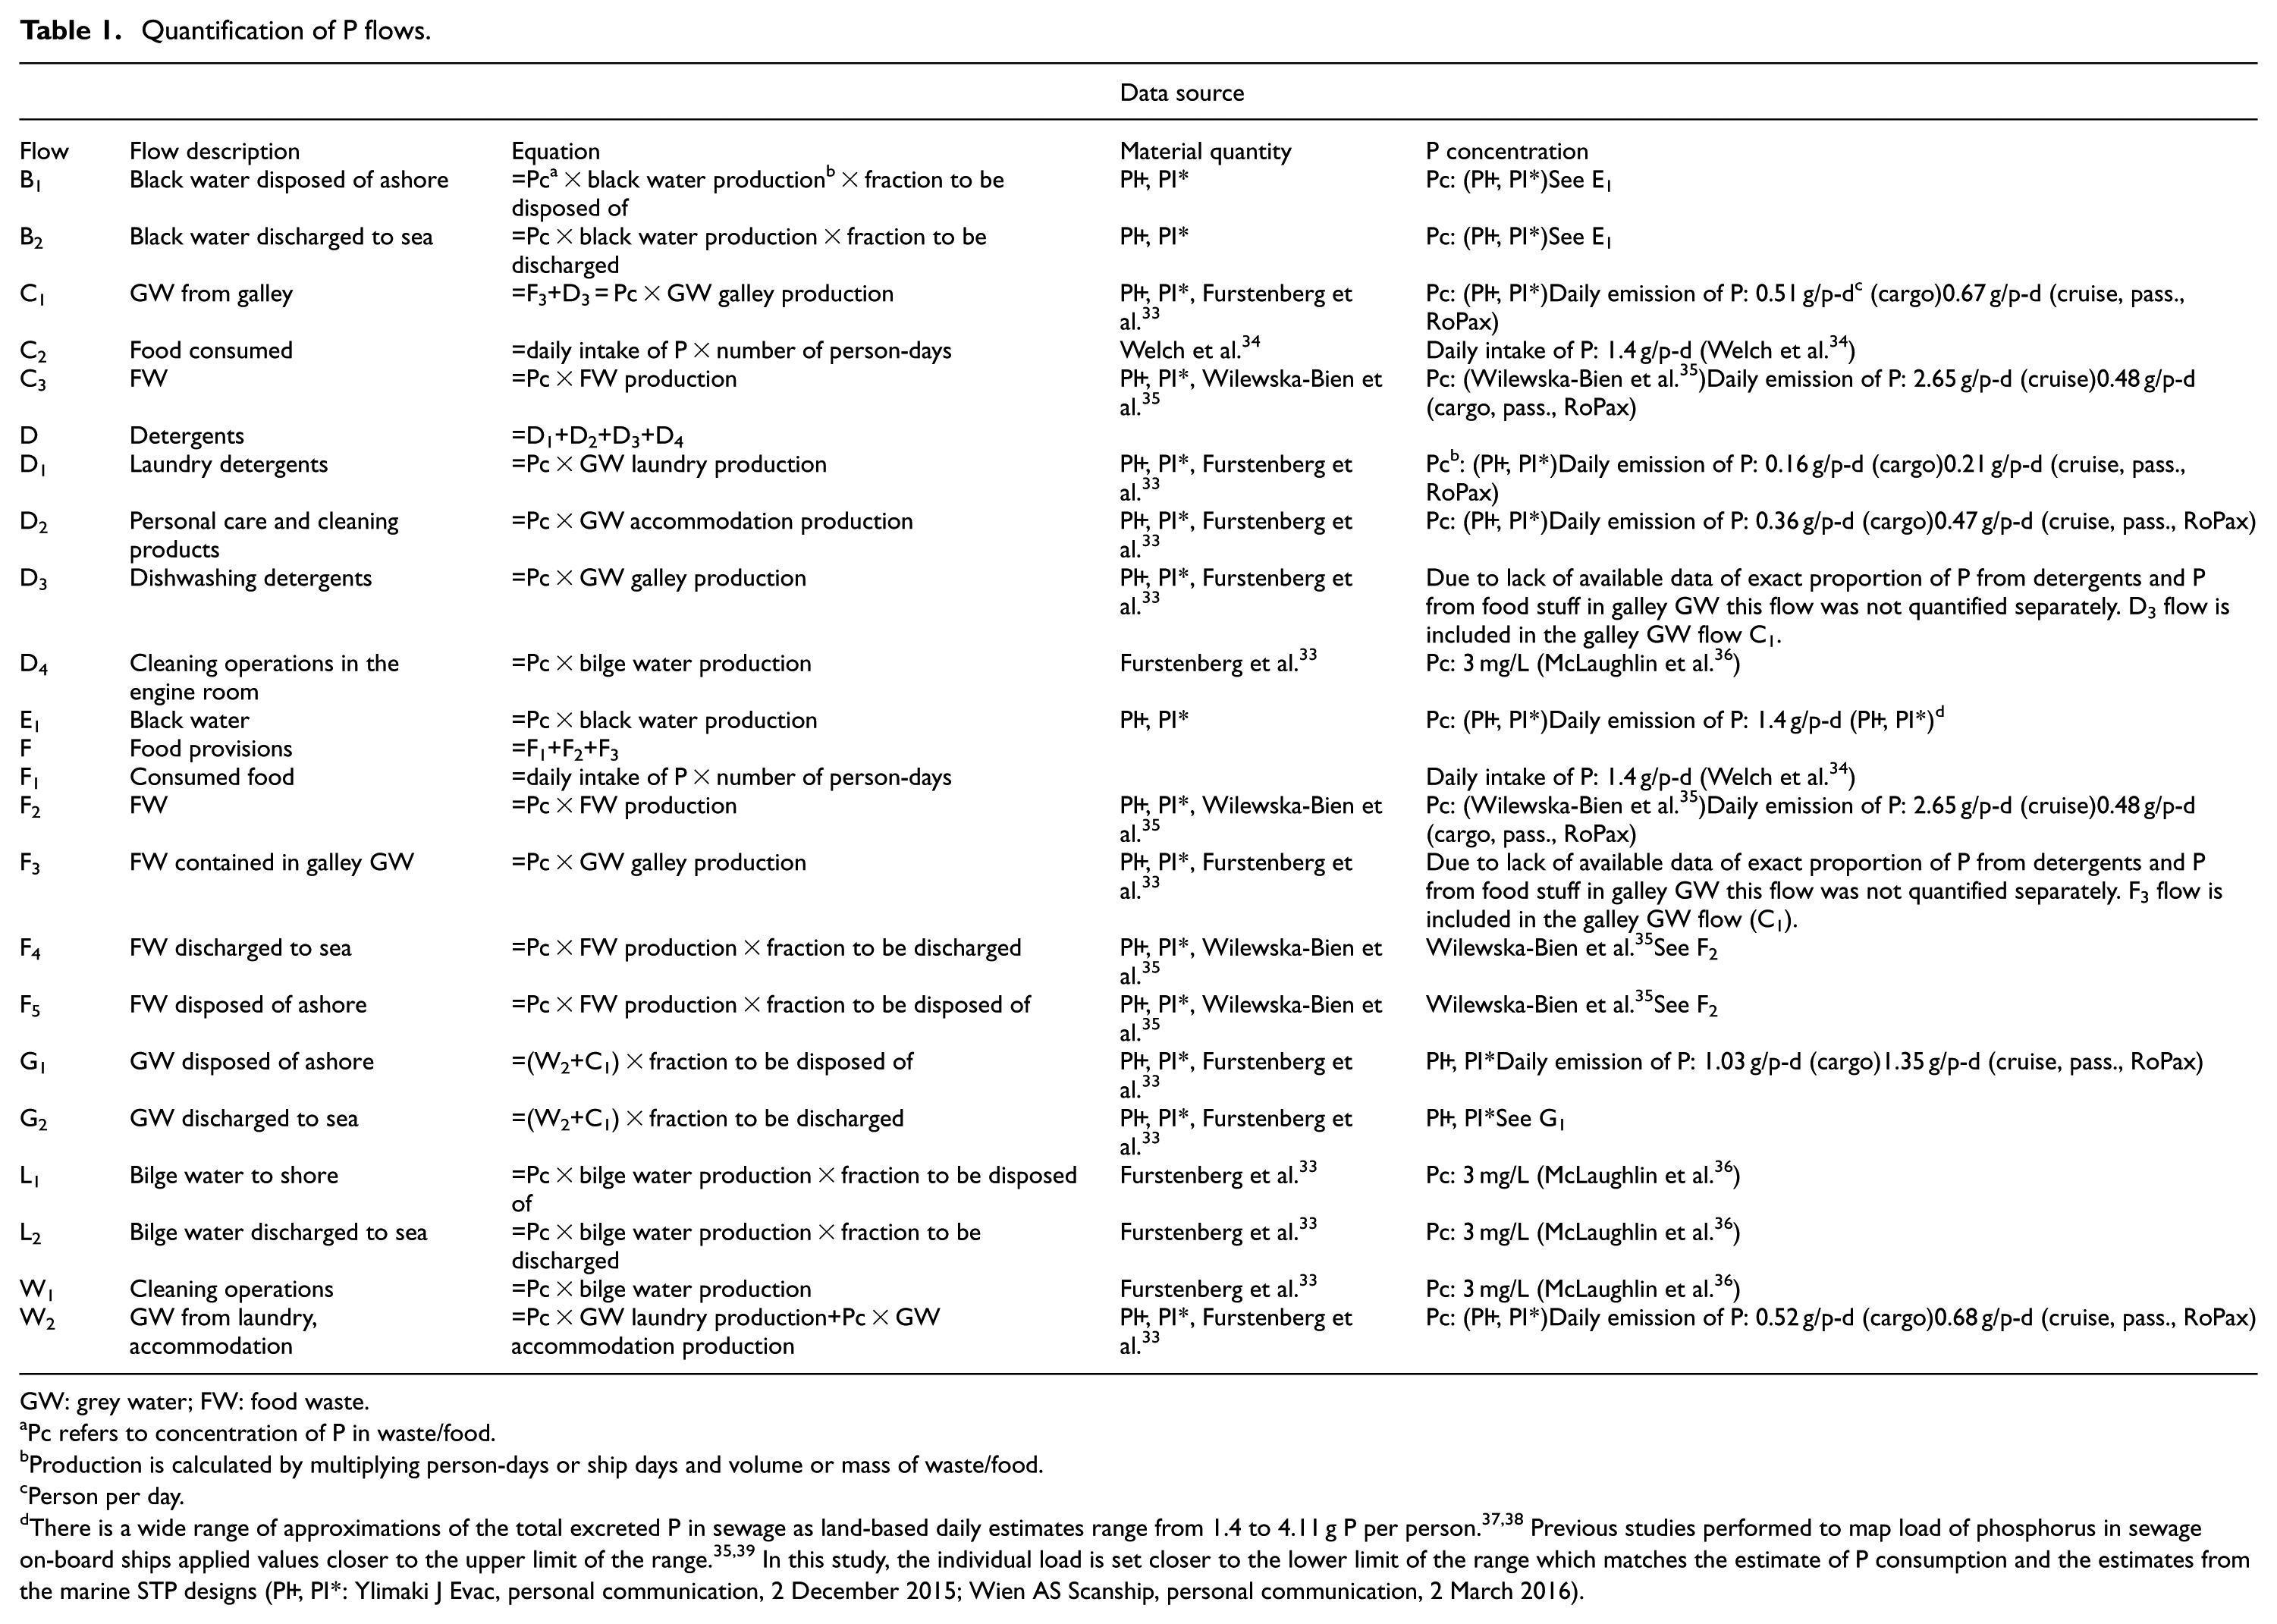
GW: grey water; FW: food waste.
Pc refers to concentration of P in waste/food.
Production is calculated by multiplying person-days or ship days and volume or mass of waste/food.
Person per day.
There is a wide range of approximations of the total excreted P in sewage as land-based daily estimates range from 1.4 to 4.11 g P per person.37,38 Previous studies performed to map load of phosphorus in sewage on-board ships applied values closer to the upper limit of the range.35,39 In this study, the individual load is set closer to the lower limit of the range which matches the estimate of P consumption and the estimates from the marine STP designs (PI+, PI*: Ylimaki J Evac, personal communication, 2 December 2015; Wien AS Scanship, personal communication, 2 March 2016).
The studied population is the crew and passengers travelling in the Baltic Sea. The area of study has been defined according to the definition enclosed in the MARPOL 73/78 as Baltic Sea Proper with the Gulf of Bothnia, the Gulf of Finland and the entrance to the Baltic Sea bounded by the parallel of the Skaw in the Skagerrak at 57°44.8′ North. 23 The study is limited to year 2014, based on the maritime traffic data (from the Automatic Identification System (AIS)). The individual ships have been gathered in groups: (1) passenger ships that transport people between different destinations in the region, (2) cruise ships which are passenger ships comparable to ‘floating resorts’, (3) RoPax ships that carry both wheeled cargo and passengers and (4) cargo ships which include general cargo ships, bulk cargo ships, container ships, tankers and vehicle carrier ships.
The number of crew members and the passenger capacity has been estimated from statistics published in the branch magazines, vessel type, size of the ships and passenger capacity. 28 The passenger capacity reported in available ship registries indicates the maximum number of people on-board; however, in short sea passenger traffic with regular routes, the total capacity is only used around peak seasons during summer and Christmas. The average passenger capacity utilization of 50% was therefore set for RoPax and passenger ships, based on quarterly reports of major shipping companies operating regular routes between Finland, Sweden, Estonia and Germany. In case of cruise ships, a 90% passenger capacity was set, as stated in HELCOM report. 29 For cargo ships, the passenger capacity was set to zero and only the size of the crew was used in the calculations.
The total number of person-days on-board ships (Table 2) was compiled with the aid of emission modelling program Ship Traffic Emission Assessment Model (STEAM).30–32 This study is concentrated only on activities at sea when the ships are cruising and manoeuvring (and the movement of persons between land and sea is limited). Gender and age of the persons travelling on ships are not included in this study.
Number of million person-days according to the ship segments operating in the Baltic Sea per year.
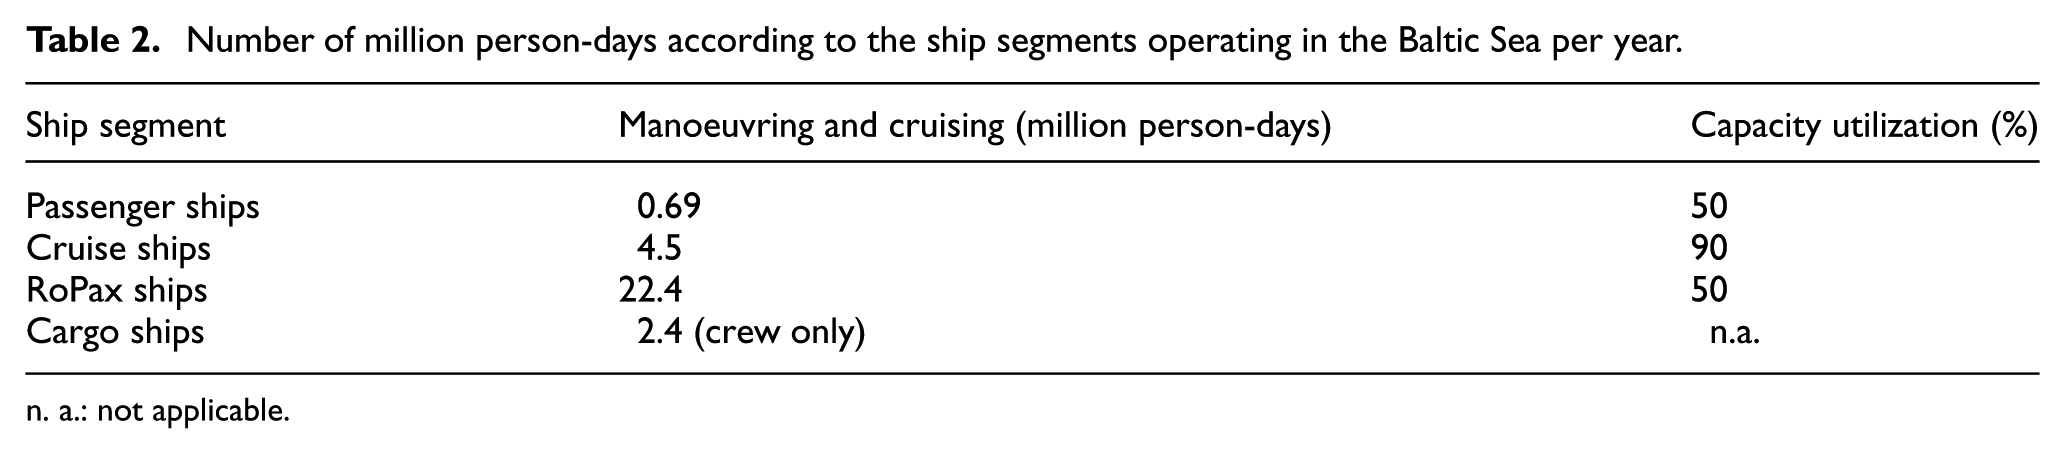
n. a.: not applicable.
The following scenarios of phosphorus fate have been analyzed in this study:
‘Discharge to sea scenario’. FW and untreated sewage and GW are discharged legally to the sea.
‘PRF disposal scenario’. FW, sewage and GW are disposed of ashore for further treatment.
‘Diversified scenario’. FW is disposed of ashore, whereas sewage and GW are treated on-board (and effluent from STP released to the sea).
Under the ‘Diversified scenario’ also, two sub-scenarios (3.1 and 3.2) concerning different management of sewage and GW by ships transporting passengers were analyzed.
The three chosen scenarios represent the options for handling of the discussed wastes in the Baltic Sea region. They also reflect the historical developments in the maritime industry of ship-generated wastes handling, from historical unlimited discharge to the sea to today’s shore-disposal and treatment. ‘Discharge to sea scenario’ can currently take place, but the sewage handling will be changed after 2019/2023 along with the Special Area regulations. 19 ‘PRF disposal scenario’ is the opposite scenario and presents the magnitude of the material in different waste streams that can possibly be processed further to recover phosphorus. In the third scenario (Diversified), the on-board sewage treatment is used by shipping industry. In the sub-scenarios, a possible solution to avoid potential future problem of limited capacity of PRFs is addressed. In the sub-scenarios, the passenger ships and RoPax ships dispose of wastewater ashore and the cruise ships treat sewage on-board, either together with the entire GW generated (sub-scenario 3.1) or with laundry and galley (ship's kitchen) fractions of the GW (sub-scenario 3.2).
Results and discussion
The shipping system studied is presented in Figure 1. The phosphate rock reserves are in the natural environment where about 95% of all phosphorus in the Earth crust is found as apatite – Ca10(PO4)6X2 (X being F, OH or Cl). 40 The phosphate rock is extracted and processed in the anthroposphere. About 90% of the global demand for rock phosphate is used for food production. 4 Moreover, phosphate is needed for detergent production where sodium tripolyphosphate (STPP) is a common ingredient of many detergents. 41 In the household detergents, the content of phosphorus, due to environmental concerns and regulations, is being reduced. 42
Input flows to the shipping system
Amounts of ingested phosphorus via food
The ships are provided with food that has been produced on land. To estimate the consumption of phosphorus with food, the mean phosphorus intake in Europe, 1447 mg P per person and day, has been applied in this study, which is also consistent with other estimates of daily phosphorus consumption.34,43 The annual consumption of phosphorus with food on-board ships in the studied system is 43.6 tonnes of P (Figure 2). The food that is not consumed is considered FW in the study.
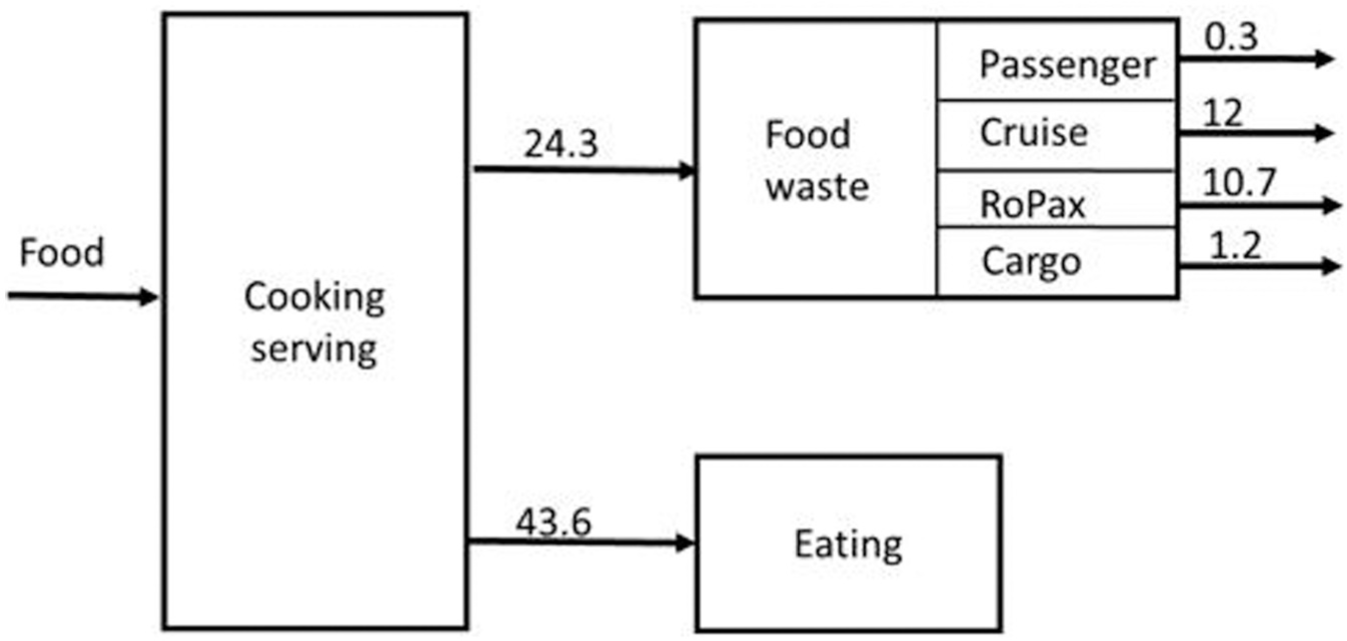
Phosphorus flows (tonnes P/year) in the consumed food and food waste generated on different ship segments in the Baltic Sea.
Phosphorus in the detergents used on-board
Phosphorus in the form of phosphate is used in detergents mainly to soften hard water, increase the surface activity of the active washing compounds, raise pH and to deflocculate bigger particles of dirt. 41 The total annual amount of phosphorus consumed during laundry on-board ships is assumed to equal the annual amount of phosphorus contained in the laundry wastewater.
Another potential need of detergents containing phosphorus are cleaning operations associated with the engine room where the amount of phosphorus used will end up in the BLG. Assuming 3 P mg/L in the BLG,33,36 the annual amount of phosphorus used for cleaning purposes is approximately 715 kg.
Further source of cleaning products containing phosphorus that are provided on-board ships are dishwashing detergents and personal care products which are discharged to galley GW and accommodation GW, respectively.
Internal flows
Phosphorus in the FW
The flow of phosphorus in the generated FW is 24.3 tonnes (Figure 2). The generation of FW varies and is related to the number of persons on-board and the way food is served. 44 It is assumed that on cruise ships one person generates approximately 2 kg FW daily. On cargo ships, the generation is supposed to be lower, approximately 0.36 kg/person-day, and as there are gaps in information about FW generation on RoPax and passenger/ferry ships the same estimate as for cargo ships has been assumed in the study. 35 FW is characterized by dry solids (DS) content of 25.5% and phosphorus content of 5.2 g P/kg DS. 35
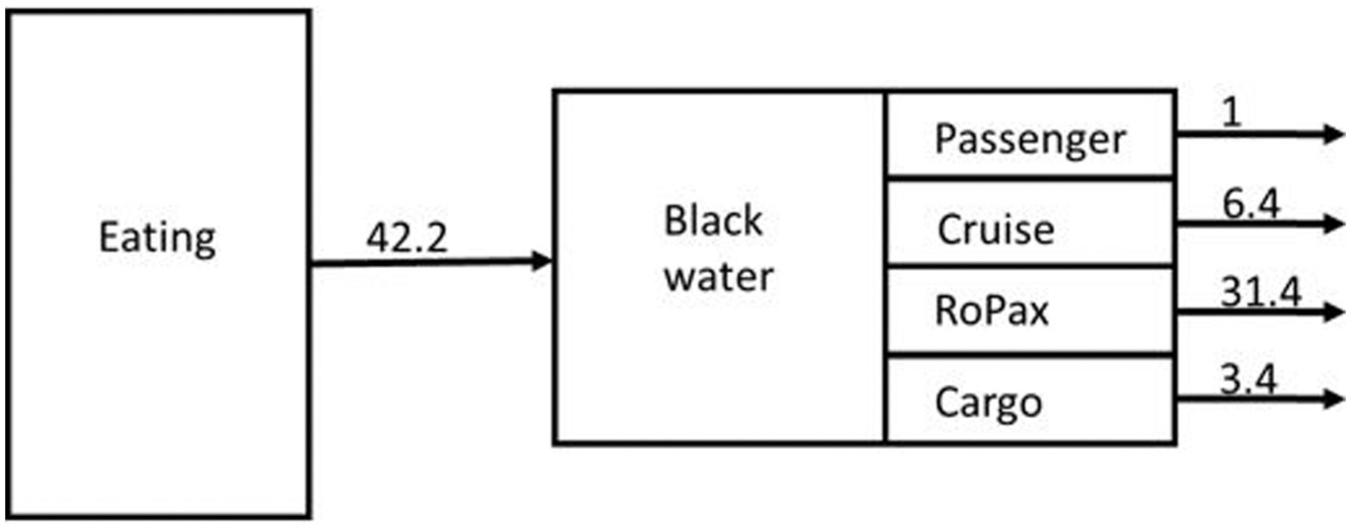
Phosphorus flows (tonnes P/year) in the generated BW (sewage) on different ship segments in the Baltic Sea.
Phosphorus excreted
In case of adults, the amount of consumed phosphorus is roughly equal to the amount excreted with urine and faeces which end up in BW in the analyzed system. 45 Based on daily estimate of 1.4 g P per person, the cumulative phosphorus flow is 42.2 tonnes of phosphorus per year (Figure 3).
Phosphorus present in the GW
Three categories of GW are analyzed in the study: GW from accommodation, laundry and galley. The total annual P flow with the GW from all ships included in the study is approx. 40 tonnes (Figure 4). The main contribution comes in galley GW with about 19.8 tonnes of P. GW from accommodation (from showers and wash basin drains) carries approximately 13.9 tonnes of P, whereas GW from laundry carries approximately 6.2 tonnes of P. The concentration of phosphorus in each GW category was estimated by the providers of the marine equipment, which was combined with the GW volume estimates.33, PI+, PI* The input data for accommodation GW are 0.5 g P per person and day on passenger ships and 0.4 g P per person and day on cargo ships. The galley GW estimates used are 0.7 g P per person and day for passenger ships and 0.5 for cargo ships. The higher load of P in galley water is due to the presence of food particles that contain phosphorus together with P from the detergents.
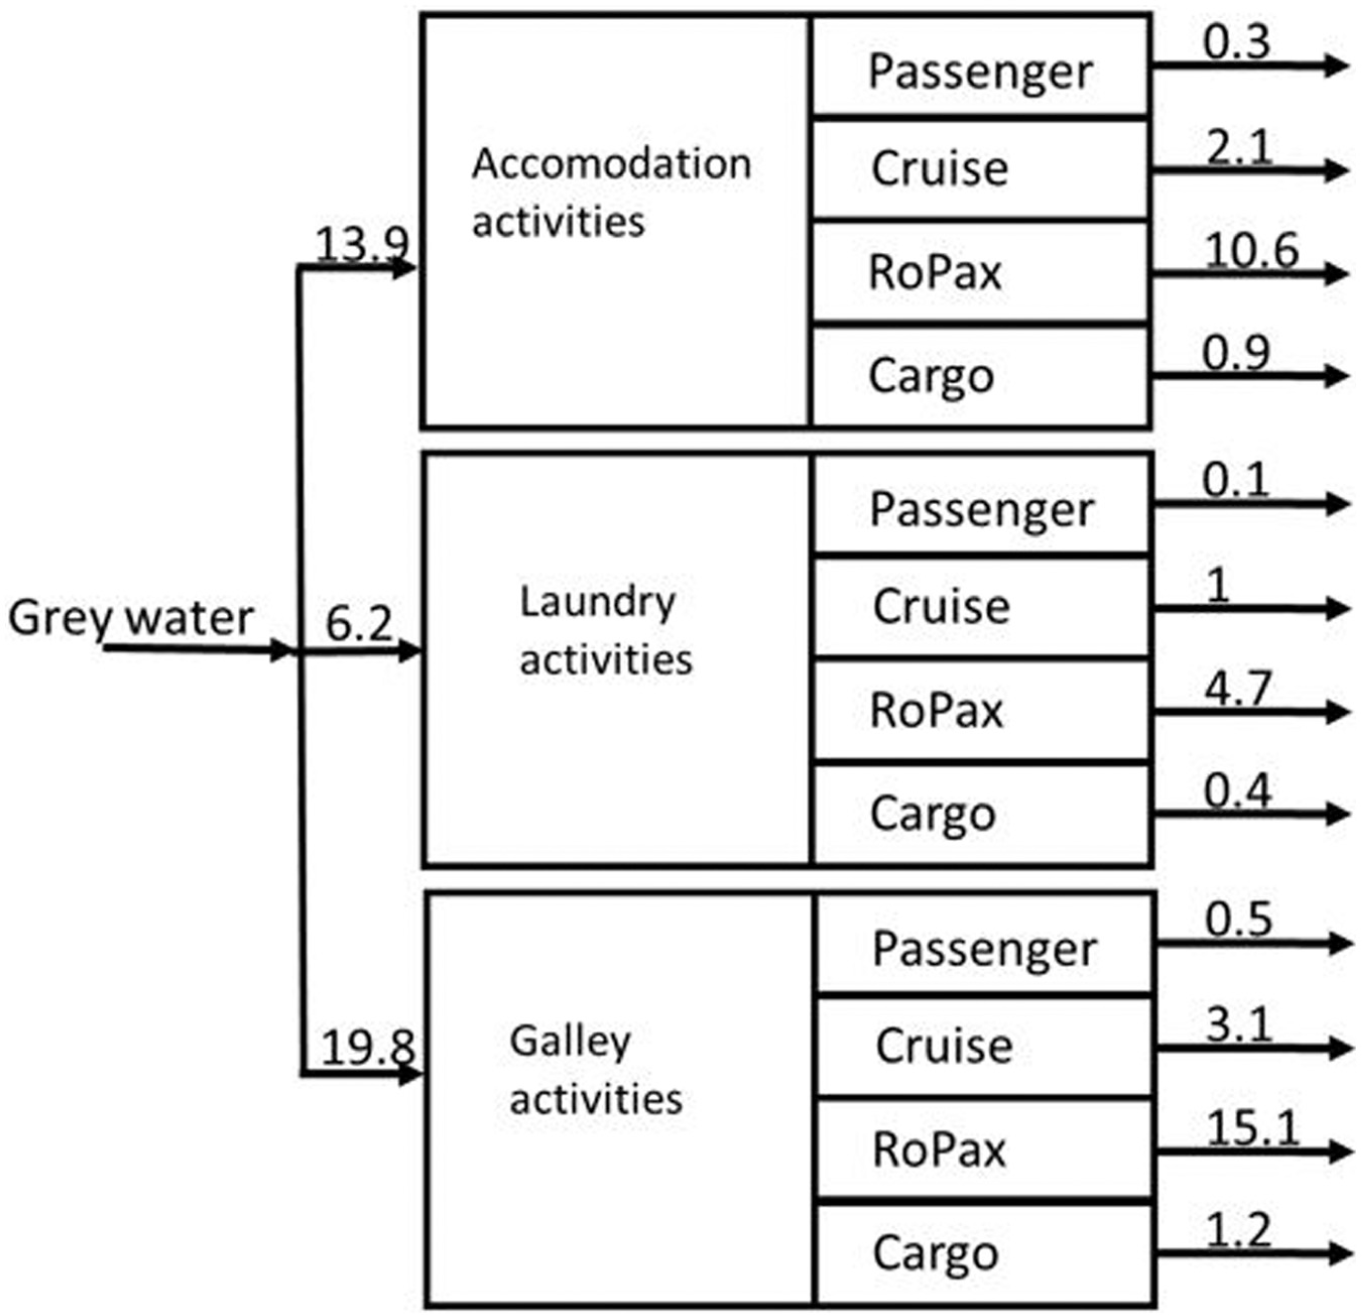
Phosphorus flows (tonnes P/year) in the GW generated on different ship segments in the Baltic Sea.
Based on the daily load of 0.2 g P in laundry GW per person on ships, the total annual flow of phosphorus from the ships sums up to 6.2 tonnes (Figure 4).
The major inflow of the phosphorus to the system is the food to be consumed. The food provisions may contain about 67.9 tonnes of P where about 43.6 tonnes is consumed and 24.3 tonnes of P contained in the FW (Figure 2). The content of phosphorus in the food types varies, and choice of diet has an impact on the amount of phosphorus generated in the sewage. It has been revealed that vegetarian households can produce around half of P in the sewage compared with households where people eat meat. 4 Vegetarian cruises are not common on the market yet, but it has been noticed that the demand for vegetarian food options grows and the menus served on-board include vegetarian alternatives.
The total P load from the GW generated on-board passenger ships has been estimated to be 1.4 g P/person and day, whereas the corresponding values for household GW reported in the literature span between 0.4 and 2.2 g P/person and day, and most of the data are below 0.6 g/person and day. 37 The difference between ship- and land-based values might be due to the fact that the values for GW on-board are based on estimates for large passenger ships that can be more compared to the venues in the touristic environment rather than household environment. The lower value for the household GW is also associated with the fact that use of phosphate in household detergents has reduced in recent decades. 46 Phosphorus flow with the laundry GW corresponds to about 16% of the total flow of P in the GW generated on-board ships. It occurs that passenger ships in regular traffic to simplify operations load off dirty laundry on shore and load on clean, which significantly reduces the fraction of laundry GW. Transferring laundry process from sea to shore is a preferable solution if the land wastewater treatment is at least as effective in nutrient reduction as wastewater treatment on-board. There is no law regulating use of detergents on-board ships, but the phosphate-containing detergents on-board ships have started being replaced with other products through voluntary actions. 47
BLG generation
The annual total flow of phosphorus in the BLG from ships is 715 kg. In this study, a simplified approach was used by applying 1200 L BLG/day for cargo ships and 400 L BLG/day for passenger ships. 33 RoPax ships were treated as passenger ships in that case and were assigned production factor of 400 L BLG/day. The concentration of phosphorus in BLG is about 3 mg/L. 36 Modelling the BLG generation to its full extent is, however, not straightforward, as there exist significant variations in the produced volumes for ships even in the same categories.
Output flows – the scenarios
Discharge to sea scenario – FW, sewage and GW discharged legally to the sea
The first scenario illustrates a situation where the phosphorus exits the shipping system with the ship-generated waste streams; FW (24.3 tonnes of P), sewage (42.2 tonnes of P) and GW (40 tonnes of P) being discharged overboard (natural environment; Figure 5).
‘Discharge to sea’ scenario. Phosphorus flows (tonnes P/year) with the wastes into the marine environment.
The highest share of released phosphorus is in categories BW and GW from RoPax ships, whereas the highest share of released phosphorus with the FW is associated with the cruise ships. The total contribution of phosphorus from RoPax ships is at least three times higher than from the other ship segments. The share of emitted phosphorus is relatively low in case of cargo and passenger ships. The amount of phosphorus released with the BLG is not depicted in Figure 5 because it is at least an order of magnitude less than other sources.
In the Baltic Sea, the contribution of P from ships is low in comparison with land-based sources. However, if ships operate and discharge waste in spots vulnerable to eutrophication, the local impacts cannot be excluded. Sewage, GW and FW discharged to seawater contribute with dissolved and particulate phosphorus, which will undergo continuous transformations in the water column and sediment in marine environment. The fraction of dissolved inorganic phosphorus can directly be assimilated by phytoplankton and converted to organic compounds, whereas phosphorus bound in organic matter will become available to phytoplankton through the process of remineralization. 48 The sediment may be a sink for the phosphorus, however, only partially since the decay of the sinking biomass, including FW, contributes to maintain low oxygen levels in the bottom waters which, in turn, provide the conditions for ongoing phosphate regeneration from the sediment.
The ‘discharge to sea’ scenario is a less probable scenario in future as many RoPax ships today already have holding tanks where the sewage is stored and disposed of ashore. There are also efforts to introduce no-special-fee system in all ports to encourage ships to leave the wastes in PRFs. In addition, from 2023 all passenger ships operating in the Baltic Sea would need to either dispose sewage in the PRFs or treat it through nutrient reduction. The total amount of GW that will be discharged overboard is hard to estimate as it is not regulated as sewage and because in some cases it is mixed with sewage and treated on-board.
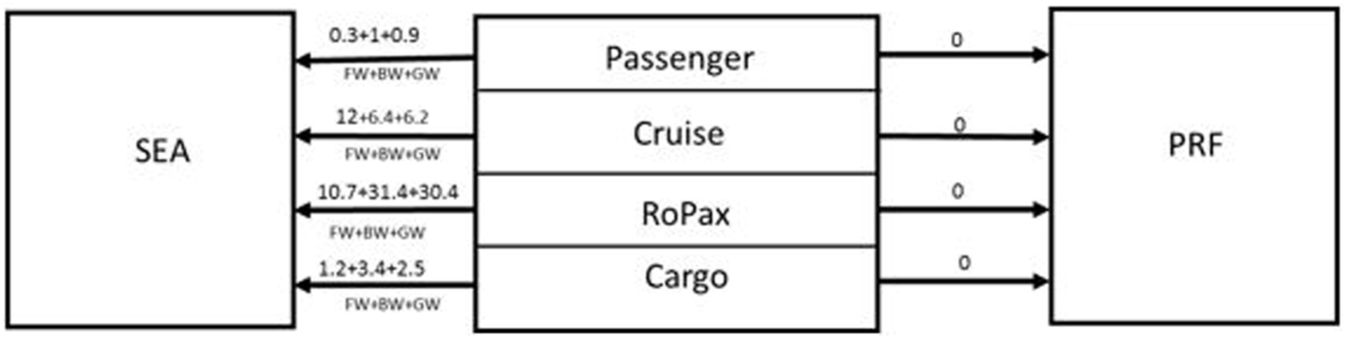
PRF disposal scenario – FW, sewage and GW disposed of in PRFs
This scenario demonstrates an arrangement where all ships dispose the wastes (FW, sewage, GW) in the PRFs (anthroposphere). The ships must store the waste on-board while travelling at sea and adjust the length of the time at sea between port calls, according to the capacity of the holding tanks. In case of bigger passenger ships, the FW would need to be pre-processed on-board to reduce its volume and slow down the decomposition processes prior to disposal in PRFs. In contrast to ‘discharge to sea’ scenario, totally 106.4 tonnes of P would be disposed of in PRFs.
On land, collected sewage and GW will be treated in the municipal wastewater treatment plants. In the effective wastewater treatment plants, the majority of phosphorus is, through precipitation or biological removal, captured in the sewage sludge and the remaining P is discharged to the marine environment. 49 Consequently, capacity and methods of connected wastewater treatment plant used at port of call will govern the fate of the offloaded ship sewage and the quality of the effluent returned to the sea.
Considering FW, the contribution from cruise ships (12 tonnes) is classified as ICW, due to calls to St. Petersburg in Russia, a popular cruise ship destination located outside EU. The ICW is being transported to incineration plants or deep burial on authorized landfills. FW which is not ICW can be used for other purposes including biogas production or composting. This includes the waste from passenger ships operating between ports in EU (0.3 tonnes P) and fractions of FW from RoPax and cargo ships, depending on the ships’ routes and the policy at a specific port.
The prerequisites for the ‘PRF disposal’ scenario are well-developed PRFs and time-efficient reception of waste in ports. An extra benefit for the ships is if ports offer this service free of charge or covered by a mandatory waste fee.
Diversified scenario – FW to PRF; sewage and GW treated in marine STPs
This scenario demonstrates arrangement where all ships dispose the FW in the PRFs and treat mixed sewage and GW in on-board STPs (Figure 6). In the discussed scenario, passenger ships are equipped with advanced STP that fulfil requirements MEPC 227(64) and that 80% of P from wastewater is retained in the sewage sludge and the effluent contains the remaining 20%. No reduction of P in wastewater is assumed for non-passenger ships as they are excluded from the Special Area regulations.
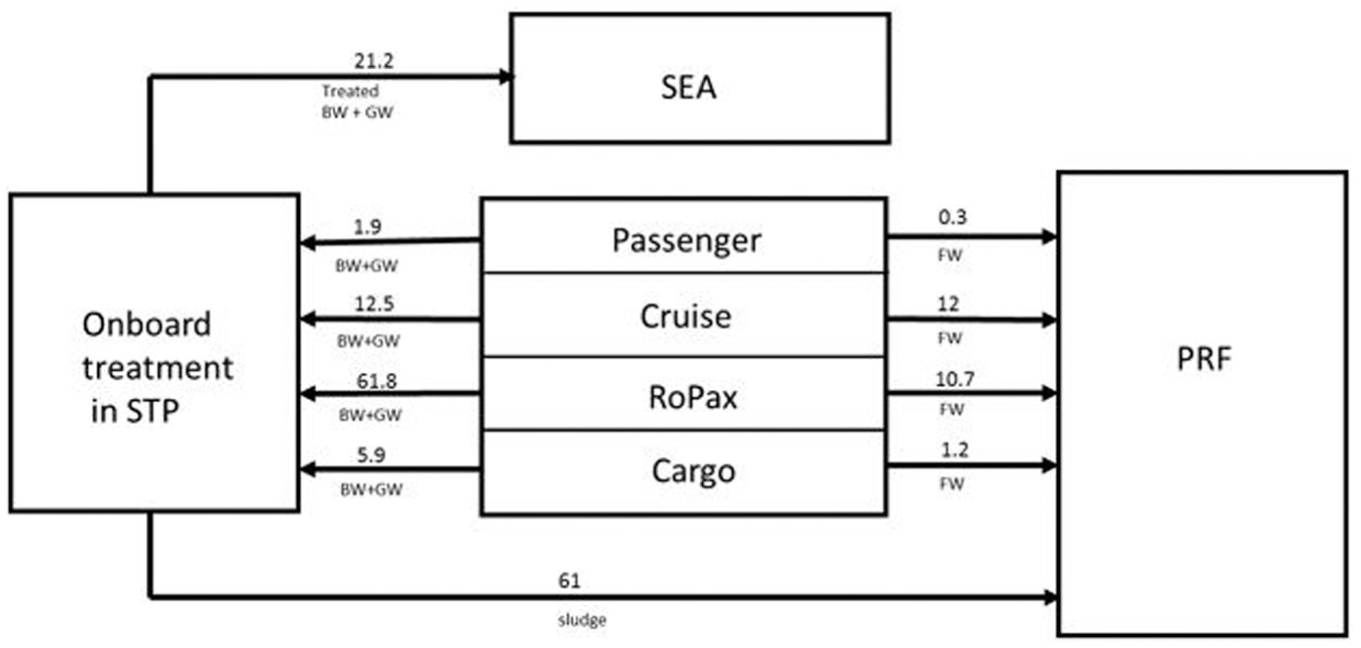
Diversified scenario. Phosphorus flows (tonnes P/year) in the waste streams disposed in PRF and treated on-board in the STPs in different ship segments.
In ‘diversified scenario’, 80% of phosphorus is sent to land and the remaining part (21.2 tonnes) is discharged to the sea, which is about 20% of the amount in the ‘discharge to sea’ scenario. According to the Special Area regulations discharge to sea of sewage sludge will not be allowed for the passenger ships. 19 Other ships can choose to either dispose it in the PRF or discharge to the sea at the minimum distance of 12 NM from the coast. Shipping sector is preparing for the forthcoming Special Area regulations, as at least eight cruise ships, about 10% of cruise ships operating in the Baltic Sea during 2015, have installed STPs that fulfil the Special Area regulations regarding reduction of nutrients in sewage. 50
The P load entering the environment with the effluents is about 21.2 tonnes. This load could be reduced by about 4.7 tonnes if all ships, beside passenger ships, have nutrient-reducing STPs installed. Further reduction could be reached with the increasing efficiency of on-board treatment.
A variant of the diversified scenario, under the Special Area conditions, can be a situation when passenger ships and RoPax ships would dispose sewage and GW in the PRF and the cruise ships, which come to the region seasonally, would treat both sewage and GW reducing P content by 80% (sub-scenario 3.1). The cargo ships in that case discharge the wastewater to the sea.
The calculations in sub-scenario 3.1 show that P-contribution from cruise ships’ GW is approximately half of the cargo ships’ contribution (Table 3). A further variation in the diversified scenario is when the passenger ships and RoPax dispose of the wastewaters ashore and cruise ships treat sewage together with laundry and galley GW and discharge accommodation GW. The accommodation GW occupies the largest volume calculated per passenger in comparison to laundry and galley GW, and therefore in theory this fraction may be beneficial for the ship to be discharged to the sea. Such solution requires though a separate holding tank for the accommodation wastewater. The calculations show that when only part of GW is treated by the cruise ships, the P-contribution from the GW is slightly larger than from cargo ships (Table 3). In none of sub-scenarios, the sewage sludge formed on-board cruise ships can be discharged to the sea in the Baltic Sea area. It can be disposed of in the PRFs in the region or managed outside the region according to relevant regulations.
Sub-scenario 3.1 and sub-scenario 3.2 for passenger ships with different management of grey water.
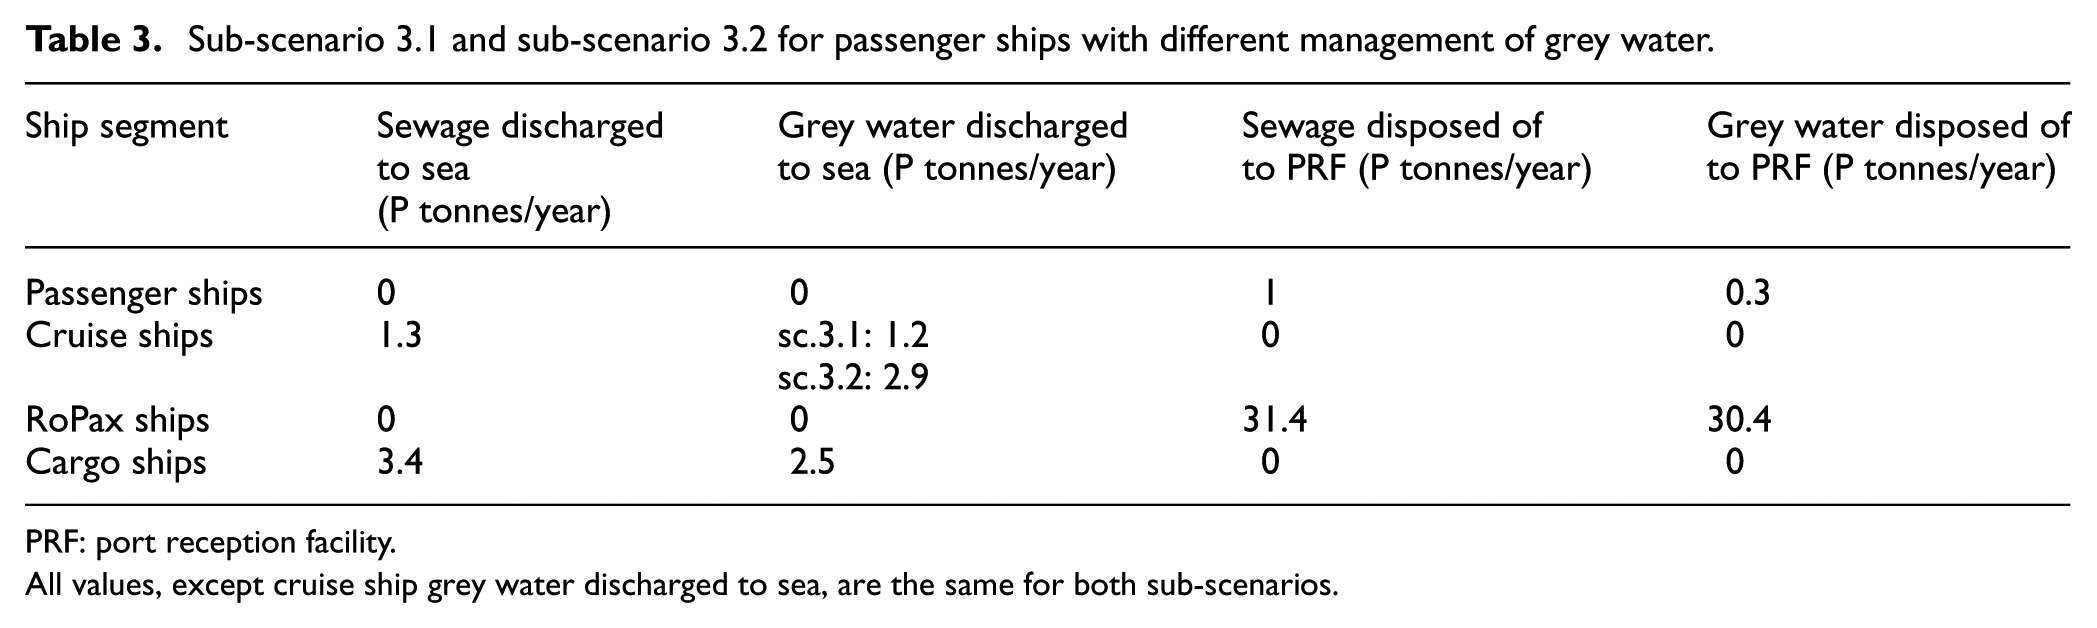
PRF: port reception facility.
All values, except cruise ship grey water discharged to sea, are the same for both sub-scenarios.
The annual flows of P associated with sewage, GW and FW generated on-board ships and their distribution between land and sea are presented in Table 4.
Summary of phosphorus flows (tonnes P/year) transferred to land and sea in the main discussed scenarios.
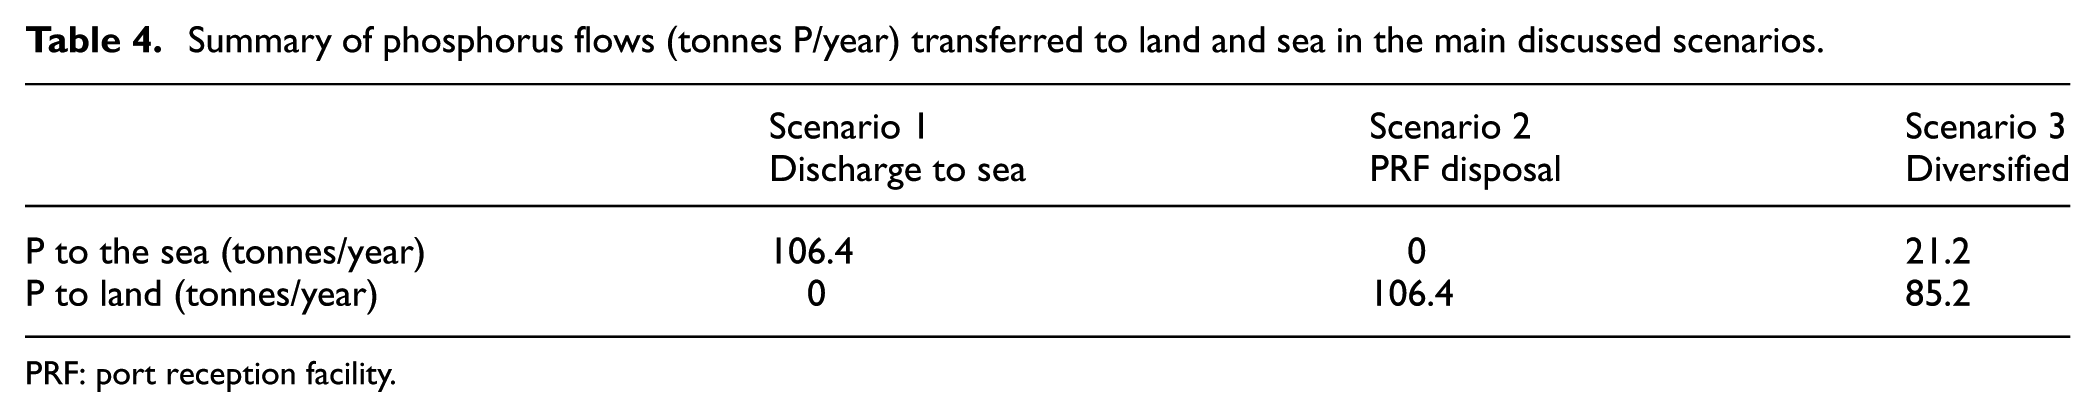
PRF: port reception facility.
Closing phosphorus cycle – avoidance and recovery
In the light of foreseen global phosphorus deficit, it is of interest to analyze how shipping could contribute to minimize or avoid waste generation and to help recover phosphorus from secondary sources. From the environmental perspective, it is most beneficial to reduce the amount of produced waste in the first step. Strategies that can be used to solve the global scarcity of phosphorus by activities on-board are the reduction in generation of FW and the reduction in consumption of meat and dairy products. For sewage and an unavoidable fraction of FW that have limited capacity to be reduced, a recovery option should instead be considered. Another way to minimize P generated on-board is through changing the composition of the GW. Detergents and other cleaning media have not been mapped in detail in this study, and benefits could be derived if the phosphorus-free detergents are used on-board.
Phosphorus has been recovered on land from municipal and industrial wastewaters, sewage sludge and digested sludge. 2 Waste streams produced on-board ships could be added to increase the pool of waste materials for phosphorus recovery which are treated on land if PRF scenario takes place. At the same time, it is important to continuously reduce the waste volumes produced as this is most effective from the energy recovery perspective. 51 The most likely solution might be a combination of prevention of avoidable FW and recycling of the unavoidable waste. Although there are trials to recover phosphorus from various waste streams, the products are often contaminated with undesired components such as heavy metals and thus not acceptable for application to agricultural land without further treatments. 52 To benefit environment, the treatment of wastewater on land should be at least as effective for phosphorus removal as on-board treatment plants as the efficiency determines the amount of phosphorus that enters the marine environment with the after-treatment effluent. Another aspect associated with the management of waste on land is that treatment alternatives are limited by law governing in certain place, for example, rules regarding ICW limit the options to handle FW. How the FW is received, whether separated or mixed with GW, will also have impact on possible treatment options. If FW is sent to incineration, phosphorus is captured in ashes and further treatment is necessary to recover phosphorus and overcome challenges with trace metal content. There are several points in the wastewater treatment where the phosphorus can be recovered; however, the introduction of FW in the wastewater generates problems as under anaerobic conditions hydrogen sulphide is formed which leads to issues with health, safety and corrosion.
From the phosphorus recycling perspective, it is important to have control over the waste streams and their compositions. As the most recovery practices occur currently on land without limitations typical for the shipping sector, it is recommendable to direct the waste streams to the PRFs for further treatment. Through the on-board treatment of the wastewater, the volume of waste to be stored on-board is reduced and the treatment eliminates the nutrients from the effluent. Sewage sludge generated on-board brought to PRFs for further treatment has potential for phosphorus recovery. Also, FW from ships has potential for phosphorus recovery although the treatment may include several steps.
The effect of forthcoming regulation on the phosphorus amounts discharged to the sea will vary dependent on scenario. Assuming 80% reduction of P in the sewage from RoPax, cruise and other passenger ships, about 31 tonnes of P is saved from entering the Baltic Sea environment. If both sewage and GW instead are offloaded in PRFs, about 76 tonnes P-reduction to the sea can be reached.
Conclusion
Compared to the overall phosphorus input to the Baltic Sea, the phosphorus from shipping in this study represents about 0.3% of the total annual input. 8
Driving forces that can steer in which direction the scenarios will be shifted in the future are the following:
Regulations. In few years, the effect of regulations for the Baltic Sea as Special Area under Annex IV will be seen; however, it will only impact the passenger ship segment.
Infrastructure on land. The presence of adequate capacity of PRFs and how smoothly the waste can be offloaded from ships is of importance. Another factor is the presence of well-working agreements between ports and the treatment facilities which enables unproblematic further treatment on land.
Financial aspects. The cost of marine waste handling equipment and the waste fee charged in ports impact the handling strategies chosen by the shipping companies.
Policies and practices on-board. Introduction of policies on how proactively the waste handling is performed on-board and engaging the crew and the passengers in contributing to sustainable travelling.
Footnotes
Declaration of conflicting interests
The author(s) declared no potential conflicts of interest with respect to the research, authorship and/or publication of this article.
Funding
The author(s) disclosed receipt of the following financial support for the research, authorship, and/or publication of this article: This work resulted from the BONUS SHEBA project and it was supported by BONUS (Art 185), funded jointly by the EU and the Academy of Finland. The authors are grateful to the HELCOM member states (Sweden, Finland, Russia, Estonia, Latvia, Lithuania, Poland, Germany, Denmark and the EU) for allowing the use of HELCOM AIS data in this research. Funding from BalticSea2020 is aknowledged.