
Abstract
Reviews of bubble curtain oil herding studies in 1971 and in 1997 concluded that a bubble oil boom, or pneumatic oil barrier, is ineffective for retaining oil spills except in quiescent water, such as harbors. A bubble oil boom generates a sea-surface outwelling flow that traps or blocks oil. The primary bubble oil boom failure mode arises from oil droplet injection due to turbulence and instabilities at the oil slick front, where the outwelling flow balances the oil spreading. Bubble oil boom leakage occurs where these droplets are entrained into and pass through the bubble barrier. Increasing bubble flow creates stronger outwelling flows but increases turbulence and instabilities, leading to enhanced oil droplet entrainment. Natural seep observations, field trials, and laboratory studies demonstrate that a bubble plume with a wide bubble oil boom area, which is driven by an array of several parallel spargers (a bubble raft), can increase oil retention greatly while addressing key bubble oil boom failure modes compared with a line-source bubble curtain plume. Further improvements are identified by synergistic bubble oil boom application with a retaining skirt, dramatically improving the bubble oil boom performance. Specifically, the bubble oil boom keeps the oil distant from the skirt, minimizing or eliminating several conventional oil boom failure mechanisms. Also, entrained droplets, which easily traverse a single bubble curtain, are blocked effectively by a wide bubble plume curtain.
Keywords
Introduction
It is well recognized that combating oil spills in coastal waters is of great communal interest. This has led to continuous efforts to improve oil spill mitigation strategies. The preferred spill mitigation strategy often uses oil booms to contain and concentrate floating oil, prior to oil skimmer recovery. 1 Despite improvements over the decades, limitations of tow speed and operation under real-world conditions remain serious.
A different approach to controlling oil spills, namely a pneumatic boom, was tested by the US Coast Guard in 1971. 2 A pneumatic boom consists of a bubble curtain, referred to herein as a bubble oil boom (BOB). Traditionally, it is generated from a long submerged perforated air pipe whose bubble plume generates an upwelling flow that drives an outwelling flow at the water surface. The outwelling flow is the barrier that blocks the oil. The 1971 study concluded that BOBs were useful only for low-current conditions, e.g. for protecting harbors and other installations in sheltered (calm) waters. Currently, commercial BOBs are anchored at such locations. 3 A review by Lo, 4 including laboratory results on the effects of the currents, waves, and oil type on the BOB performance, concluded that BOBs are ineffective for oil spill retention but may provide spill deflection in a current. Further, Lo 4 concluded that a BOB alone could not contain effectively an oil slick but could have utility in conjunction with downstream collectors.
Nevertheless, observations in the Coal Oil Point (COP) seep field, a natural marine hydrocarbon seep field offshore southern California, described by Hornafius, 5 suggested that large bubble plumes can block oil (Figure 1). Here, extensive seabed oil and gas sources produce perennial oil slicks. Recent COP observations provided important insights into distributed bubble sources and their interaction with oil slicks on scales not reproducible in the laboratory. 6 These oil slicks are herded and blocked by bubble-plume-induced outwelling flows (Figure 1(C)), even in the presence of currents and waves. For example, bubble plumes were observed to block oil against winds up to 5–7 m/s and a swell of 1–2 m significant height (I Leifer, 2008, University of California, Santa Barbara, unpublished observations).
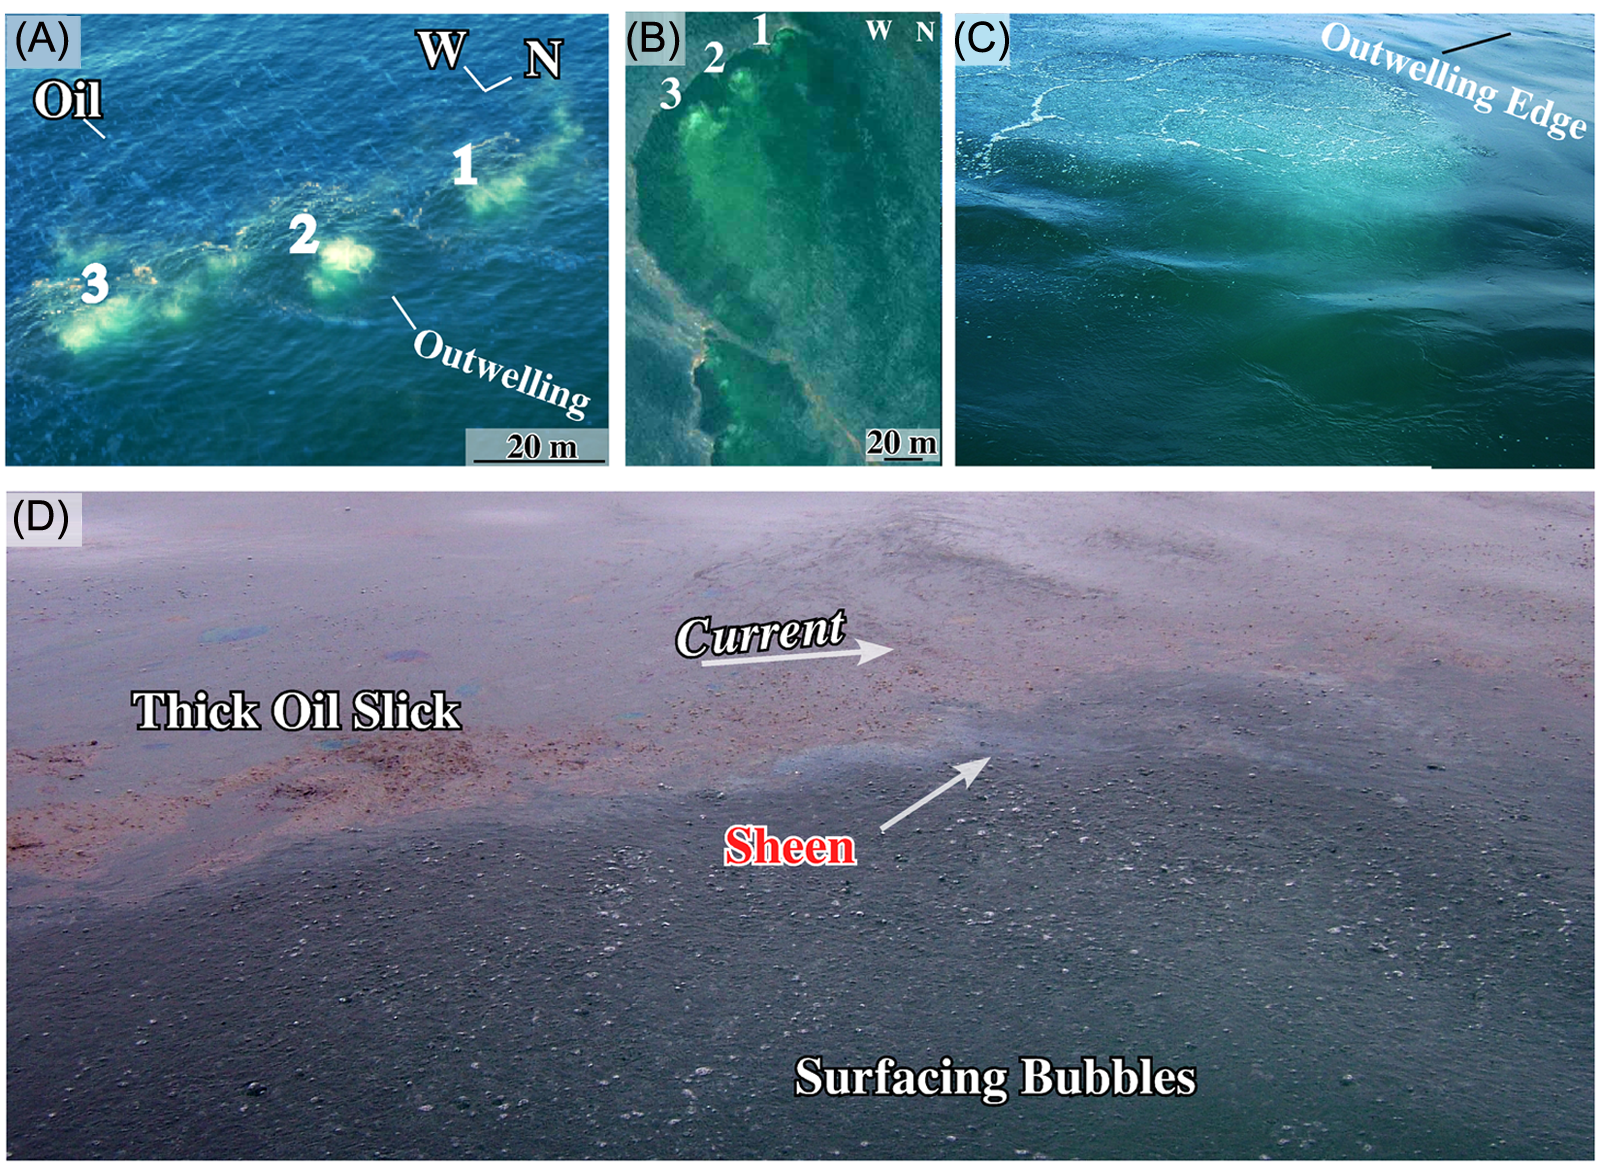
(A), (B) Aerial images of large intense area-source bubble plumes in the COP seep field, Trilogy Seeps (approximate size scale shown in the figure). (C) Surface photograph from the boat of Trilogy B seep (position 2), showing surface boil and outwelling flow. (D) Bubble plume diverting a drifting oil slick in the COP seep field. (Photographs by Ira Leifer.)
Large bubble plumes were investigated in a marine upwelling study 7 with insights applied to develop a novel bubble trawl for small copepod flotation. 8 Specifically, a towed bubble raft produced an area bubble plume that lifted and concentrated Calanus finmarchicus from the upper 10–15 m of the water column into a thin shallow surface or near-surface layer. These field studies demonstrated that area bubble plumes exhibit processes distinct from point- and line-source bubble plumes. In the following, the term bubble plume is used to represent the vertically induced flow from a bubble source, the term bubble curtain is used for bubble plumes from a line source, which is narrow and thus relatively two dimensional (2D), and the term area bubble plume describes the bubble plume from a distributed source composed of several parallel air bubblers (spargers). The width-to-depth ratio of an area bubble plume is close to unity, rather than very small as for a bubble curtain. For BOB application, the distributed or area bubble plumes are much longer than wide, i.e. the boundary conditions are orthogonal to the plume horizontal axis.
This study reviews oil boom failure mechanisms, as well as the principles that govern BOB dynamics and kinematics for both bubble curtains and bubble rafts. Field and laboratory test results 9,10 have demonstrated the potential of area bubble plumes for full-scale marine BOB application through investigation of distributed bubble plume processes alone and in tandem with an oil boom skirt (blocking wall). For the tandem BOB, detailed fluid motions were obtained in large-scale oil-free flume tests. 11
A well-designed oil boom should be flexible to conform to wave motions and yet sufficiently rigid to retain as much oil as possible. Designs range from small lightweight booms for manual harbor deployment to large robust booms for open-sea use, requiring cranes and sizeable vessels for handling and deployment. 1
Ocean tests play a critical role in understanding the oil boom performance and failure. Oil boom failure occurs owing to overtopping or leakage where oil passes under the boom, surfacing as downstream oil patches. Boom overtopping mechanisms include overfilling, wave splashover, and boom diving due to a high towing speed. Overfilling often occurs with waves and current-induced boom diving and splashover. Boom leakage mechanisms include frontal slick droplet injection (entrainment) from the confined pool, and boom surfing due to opposing currents and/or winds blowing in the tow direction. 1
Leakage occurs when oil droplets are injected sufficiently deeply to pass under the oil boom and is highly sensitive to the towing speed. Once the towing velocity exceeds the boom’s critical towing speed, the frontal wave ‘breaks’ on a large scale, leading to dramatically increased oil entrainment. 12 –14 An increased towing speed increases the development of instability and hence droplet injection.
An important and distinct leakage mode occurs for flow at an acute angle to the boom. The accumulation of boundary layer vorticity can develop into discrete, vertically oriented vortices (whirlpools), preferentially located at boom-segment junctions. 15 These vortices can transport oil below the boom. An acute-angle boom flow occurs along the leading boom segments that steer oil towards the apex, and for protection booms for water intakes, coastal regions, and sensitive biotopes (e.g. aquaculture and important ecosystems).
The oil pool thickness at the boom increases as more oil is collected and/or as the boom is towed more rapidly. 16 In large towed booms, pool thicknesses up to 80 cm have been measured. 17 At the associated towing speeds, entrainment becomes significant. The oil pool thickness limitation to avoid significant entrainment depends on the oil characteristics. Moreover, the oil pool thickness is unsteady and oscillatory with oil ‘surging’ towards the boom and then receding, leading to leakage during surges. 18,19
A tandem BOB oil boom mitigates many of these failure modes, as was demonstrated in a field test in the COP seep field, described in the section on BOB at-sea tests.
BOB dynamics
BOB failure
The underlying principles and failure modes of a BOB are highly distinct from those of a conventional oil boom. 2,20 The main parameters controlling the BOB performance are the bubble buoyancy flux gQ l , the relative BOB–ambient current or tow speed V c , the oil slick buoyancy g o h, and the boom configuration. Here, Q l is the air volume flux per unit length (m2/s) at the source depth. Because the bubble mass is negligible, a bubble plume’s buoyancy is approximated by the acceleration g due to gravity multiplied by the density ρ of the displaced water (air volume), whereas the specific buoyancy of oil is g o , defined as g(ρ–ρ o )/ρ, where ρ o is the oil density (and varies between oils).
A BOB blocks oil if the maximum induced outwelling near-surface velocity V m exceeds the oil’s spreading velocity V s plus the current or tow velocity V c . Towing appears as a current in the boom’s frame of reference (Figure 2). Because of interactions between the plume and the ambient currents, V m also depends on the current V c . V s is a density current that depends on the oil pool’s thickness h according to

where k generally is about 2 but is a weakly decreasing function of viscosity, particularly for heavier crude oils (see p. 73 of the book by Turner 21 ). Clearly, h depends on the oil characteristics and increases with increasing V c , which concentrates the oil in a smaller area. Thus, overrunning for a BOB (Figure 2(B)) occurs when V s +V c >V m (V c ). Once oil breaches the location of the maximum outflow V m , typically just outside the plume surfacing location, the oil suppresses the outwelling flow (see the section on the wide-flume results) and continues to overrun the BOB. Oil breaching is enhanced by turbulent fluctuations. Turbulent r.m.s. horizontal velocity fluctuations v′ are approximately 20% of the surface outflow velocity measured outside the surface boil, where the outflow meets the oil pool. 20
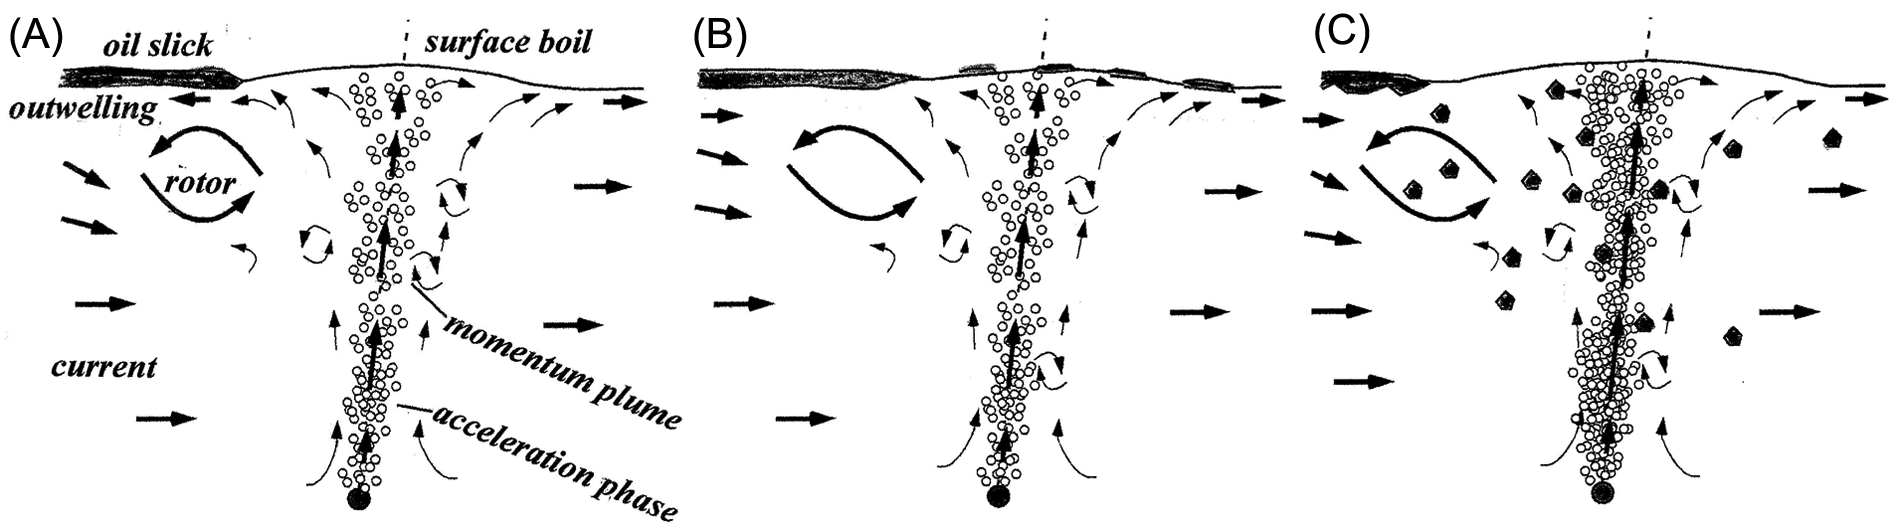
Sketches of the flow induced by a BOB (A) while blocking the oil, (B) failure mode from overrunning and (C) diffusion of injected oil droplets (shaded regions). Note the upstream rotor.
Unfortunately, increasing the bubble flow to prevent overrunning increases turbulence, internal waves, and bubble bursting, which leads to higher entrainment. Then, some fraction of the injected droplets drifts into the bubble curtain and transits the bubble barrier (Figure 2(C)) owing to turbulent eddy diffusive transport.
BOB laboratory-to-field scaling
Extension of small-scale laboratory tests to large-scale field applications depends on Froude similitude 21 for equation (1) and the buoyancy flux gQ l for similar geometry and dynamics. This requires that the compressibility, viscosity, and surface tension do not create ‘model effects’ and that the bubble plume and the flow geometry are similar. Most serious among these effects is the bubble rise velocity u B , which depends on the bubble size and viscosity. This is particularly the case in the flow establishment zone (the acceleration phase) near the source, where u B greatly exceeds the induced upwelling momentum velocity 22 V up . Other plume characteristics, such as the bubble size and spatial distributions 7 may not replicate their geometric aspects either. Froude scaling applies where these effects are small for plumes with similar dynamics and geometries as determined by the plume parameters (the spatial distribution of bubble sources, source depth, buoyancy flux, and ambient current profiles).
Equation (1) can be expressed as a densimetric Froude number

where U is a characteristic velocity such as V m , and L is a characteristic length scale such as h. Froude similitude of two flows requires the same Fr value for both, i.e. the Froude number ratio Fr R = Fr 1 /Fr 2 = 1 for flows 1 and 2. The specific buoyancy flux ratio g R of air in water and the specific buoyancy flux ratio g oR of oil in water are independent of scale; thus, g oR = g R = 1, and

where U
R
is the characteristic velocity ratio. Because U
R
= L
R
/T
R
, the timescale ratio is given by
Relationship between upwelling and outwelling flow
From large-scale pneumatic wave barrier tests, Bulson 23 observed that V m varied as

for bottom-mounted bubble sources in water from 3 m to 11 m depth. This was adopted by the US Coast Guard for pneumatic oil booms. The power law dependence is in agreement with dimensional analysis scaling for the buoyancy-driven upwelling velocity V up (which drives the outwelling flow) for single-phase incompressible buoyant 2D plume-like induced flows from a heat source (V up ≈ Q 1/3). For continuum 2D plumes, V up is independent of the depth above the bubble source (see p. 332 of the book by Fischer et al. 23 ). Most observations and theoretical simplifications suggest a Gaussian lateral distribution of the upward flow. Outflow vertical distributions have been considered as both linear 24 and Gaussian. 25 Using a semiempirical theoretical model based on energy considerations, Brevik and Kristiansen 26 suggested, similar to the formulation given by Fanneløp and Sjøen, 25 that

with m = 1. However, large tank studies 27 have shown that m = 0.85–0.90, with turbulence decreasing m.
Distributed BOBs
Although oil leakage occurs for BOB curtains in weak currents, natural seep observations suggest that a distributed area bubble plume can block oil leakage effectively, even for strong currents. This performance could relate to the distinct turbulence characteristics of distributed area plumes. If the area plume source were approximated as N parallel shallow spargers (or perforated pipes), the turbulence eddy length scale l e in an area-source bubble plume of width W should scale as the sparger element separation. In contrast, the turbulence transfer time through the barrier scales as W 2 . Moreover, dividing the buoyancy flux over several sparger lines reduces the local turbulence energy density v′ 2.
Where a plume is formed by a series of parallel separated sources that merge into a single wide plume, length scales still should increase at the same rate with increasing height above the source. Because an area plume produces a wide plume from a shallower depth than a similar flow curtain plume, l e remains small compared with a similar-sized plume originating from a deeper point or line source. Field tests with a 75 m2 area plume produced turbulent eddies comparable with W for depths deeper than W (I Leifer, 2009, unpublished observations). As a wide source was lowered to a greater depth, its area plume characteristics were reduced, i.e. it ‘forgot’ its initial conditions. Because the outwelling flow derives from the contributions of all the bubbles in the plume and consists of water with a significant momentum, transient variability in the bubble buoyancy flux has a minimal effect on large-scale induced fluid flows. For example, field observations of a towed bubble raft 8 showed that the outwelling flow persisted for minutes after most bubbles had surfaced.
Currents and outwelling flow
A key near-surface feature of strong bubble plumes is the conversion of the upwelling flow’s vertical momentum into the outwelling flow’s horizontal momentum, generating angular momentum. 20 This creates a rotor or lateral vortex for a 2D plume (Figure 2). 28 Currents affect these dynamics by compressing the lateral vortex upstream of the curtain, bounded by a convergence front between the outwelling flow and the ambient flow. The mechanism by which currents affect the bubble plume depends on the current and the plume strength and geometry. Jones 20 described bubble curtains as insensitive to weak currents but observed detrainment of bubble clouds lifting from the bent-over curtain in a strong current. In contrast, seep field observations suggested that strong currents primarily cause small bubble detrainment with little effect on the overall plume buoyancy flux. 7 There may be a difference between line and area plume detrainment that also depends on the bubble size and spatial distributions, or it may relate to the bubble size distribution of the different observations. In an area plume, the bubble clouds are much smaller than the plume. 11
Bubble plume processes
Relevant observations from a natural oil or gas seep
Although large-scale bubble plumes have been studied for lake destratification (see, for example, the paper by Wüest et al. 29 ), at-sea studies in the presence of currents, waves, and significant (and persistent) stratification are nonexistent outside of natural hydrocarbon seep bubble plumes in shallow-sea 7,30,31 and deep-sea settings. 32 As a natural system, seep emissions are geologically focused (spatially nonuniform) with emissions decreasing with increasing distance from a central region. 33 For the plume studied by Leifer et al. 7 and shown in Figure 1, W ≈ 5 m near the sea surface. Plume necking, a common feature of distributed plumes, 34 was not observed in these shallow seeps (I Leifer, 2005, unpublished observation), probably because of the nonuniform spatial distribution. Although outwelling flows for natural seeps remain unstudied, strong upwelling flows (to 1 m/s) have been observed. 30 Moreover, outwelling flows can be sufficiently large to induce wave breaking at the edge of the surface boil, as studied in detail by Evans. 35 Based on equation (5), comparable outwelling flows could be 1 m/s. Clearly, numerous complications affect the BOB performance in natural settings. Herein, more ideal situations of uniform currents with no wind, no waves, and no stratification are considered to understand the important processes better.
Bubble plumes
There are many similarities between bubble and buoyant continuum plumes, but important differences exist because bubble plume buoyancy elements have a significantly different density from the ambient fluid and thus rise through the surrounding fluid. 36 For example, where a continuum plume encounters stratification, it may form a horizontal intrusion layer and cease to rise, while bubbles continue to rise, although they may lose fluid into an intrusion layer. 37 Then, the rising bubble plume generates a new shallower momentum plume. 37
The effectiveness of two-phase (bubble) plumes in creating an upwelling flow can be characterized by the ratio λ of the buoyancy distribution width to the induced flow width. For axisymmetric bubble plumes, λ ≈ 0.8 (see, for example, the paper by Milgram
38
) because of the tendency for the buoyancy elements (bubbles, especially large bubbles) to collect near the plume center.
22
Rowe et al.
39
showed that λ varies with the buoyancy flux, from
Both continuum plumes and bubble plumes create large-scale vortices (thermal billows or bubble clouds) that ascend towards the surface. These ascending eddies transport buoyant fluid laterally and create negative velocity defects in the outer region (relative to their ascent), narrowing the velocity profile compared with the buoyancy profile. In bubble plumes, less buoyancy is delivered to the outer parts by these vortices because bubbles tend to follow each other. 22 For very small weak three-dimensional (3D) bubble plumes, it was found that the fluid volume flux was proportional to Q 1/2 and increased linearly with increasing height above the source. Because these were small-scale laboratory bubble plumes, the bubble size (r = 2 mm) and wake scales are important. In a study of weak seabed bubble plumes, 40 it was found that V up ∝ Q 0.66 for weak plumes, decreasing to Q 1/2 for the stronger plumes in the study (0.01 l/s<Q<0.1 l/s), which was attributed in part to the fact that weaker plumes are in the acceleration phase at the measurement height, about 1 m. In contrast, most studies find that V up ∝ Q 1/3 for strong plumes, 23,39 where the synergy of bubbles in close proximity produces significant hydrodynamic interactions. 41 Fluid entrainment (acceleration of low momentum, ambient fluid causing plume growth and driven by the buoyancy flux) is usually parameterized as proportional to V up , formalized by an entrainment coefficient α, which is a measure of the increase in the upward mass flux with increasing height. McClimans 42 proposed that small bubbles (r<250 µm) increase α by increasing the buoyancy flux residence time. Seol et al. 43 suggested that α increases with increasing Q and decreases with increasing bubble rise velocity u B . Rowe et al. 39 showed that α increased more than 50% when Q was increased by a factor of 4, without noting changes in u B .
Bubble curtain plumes
Figure 3(A) and (B) shows images of 2D bubble curtain plumes. There is little necking near the source, which creates a plume width W comparable with the sparger width. Billows develop many sparger widths above the source. The small submillimeter bubbles (Figure 3(A)) clearly are advected laterally, revealing eddy motions. In contrast, the larger bubbles from the sparger in Figure 3(B) are poor fluid tracers. Most 2D and 3D plume hydrodynamics are quite similar, although Fischer et al. 23 found that λ≈1.35 for a 2D continuum plume and argued on dimensional grounds that the vertical velocity is independent of the distance above the source. For the 2D sources, Taylor 36 found that V m of a continuum phase curtain plume is 1.71 times that of a bubble curtain. 35 This suggests that λ = 0.79, close to the value used by Milgram 38 for axisymmetric plumes and the value used by Brevik and Kristiansen 26 for bubble curtains.
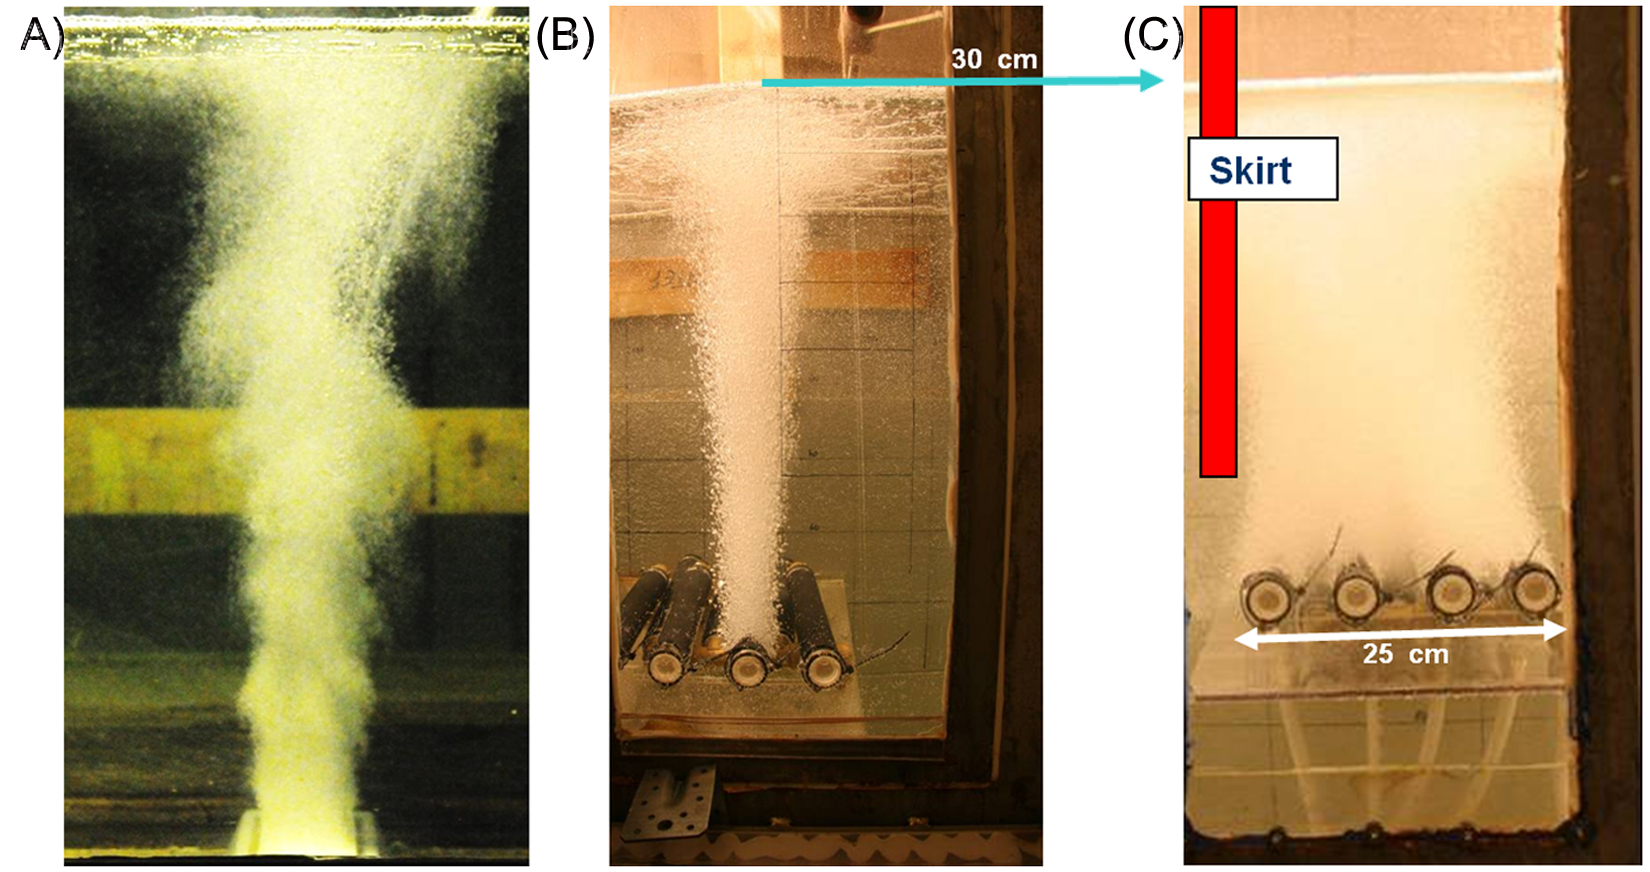
End views of 2D bubble plumes rising from bottom-mounted spargers. (A) A flat ceramic sparger 6 cm wide and 60 cm long at 70 cm depth producing small bubbles (photograph by Geir Tesaker). 42 (B) A porous tube 45 cm long at 60 cm depth producing large bubbles 9 (see the section on the narrow-plume setup for details). (C) A bubble raft plume from seven spargers (three spargers below the platform). The vertical bar shows the location of a simulated skirt used in some tests.
Area bubble plumes
Several studies have considered area bubble plumes from parallel spargers (e.g. Figure 3(C)). Area bubble plumes are distinct from bubble curtain plumes, e.g. plume necking, or narrowing, occurs a short distance above the source in an area bubble plume. A study by McClimans 42 showed a 15% increase in V m for two parallel sources at a horizontal separation of 15% of the source depth. In contrast, Bulson 24 showed no significant difference ‘when two or more adjacent manifolds are delivering the same total Q’; however, he used sparger element separations less than 5% of the depth. The bubble plumes probably merged during the rise, losing their initial distributed plume characteristics while still deep in the water column.
A special bubble-trawl area bubble plume was created to study fisheries applications and consisted of four sections of 12 bubble lines (75 m2). The bubble raft was towed at 0.5 m/s at a constant 15 m depth and demonstrated that a large-scale towed plume could upwell water strongly. 8 Raft segments were staggered with depth to inject bubbles continuously into the ascending ‘bubble sheet’, increasing the bubble concentrations and sheet buoyancy. Although the relative area-to-depth ratio of the bubble trawl was similar to that of the large natural seeps studied by Leifer et al., 7 the fluid dynamics were different because it was towed at midwater depth and had over 90% porosity (less than 10% flow blockage). This allowed entrainment from below of fluid that typically is denser, unlike for seabed sources. Grimaldo et al. 8 concluded that entrained fluid was not exclusively from the side, in contrast with a model described by Fanneløp and Webber. 34
BOB at-sea tests
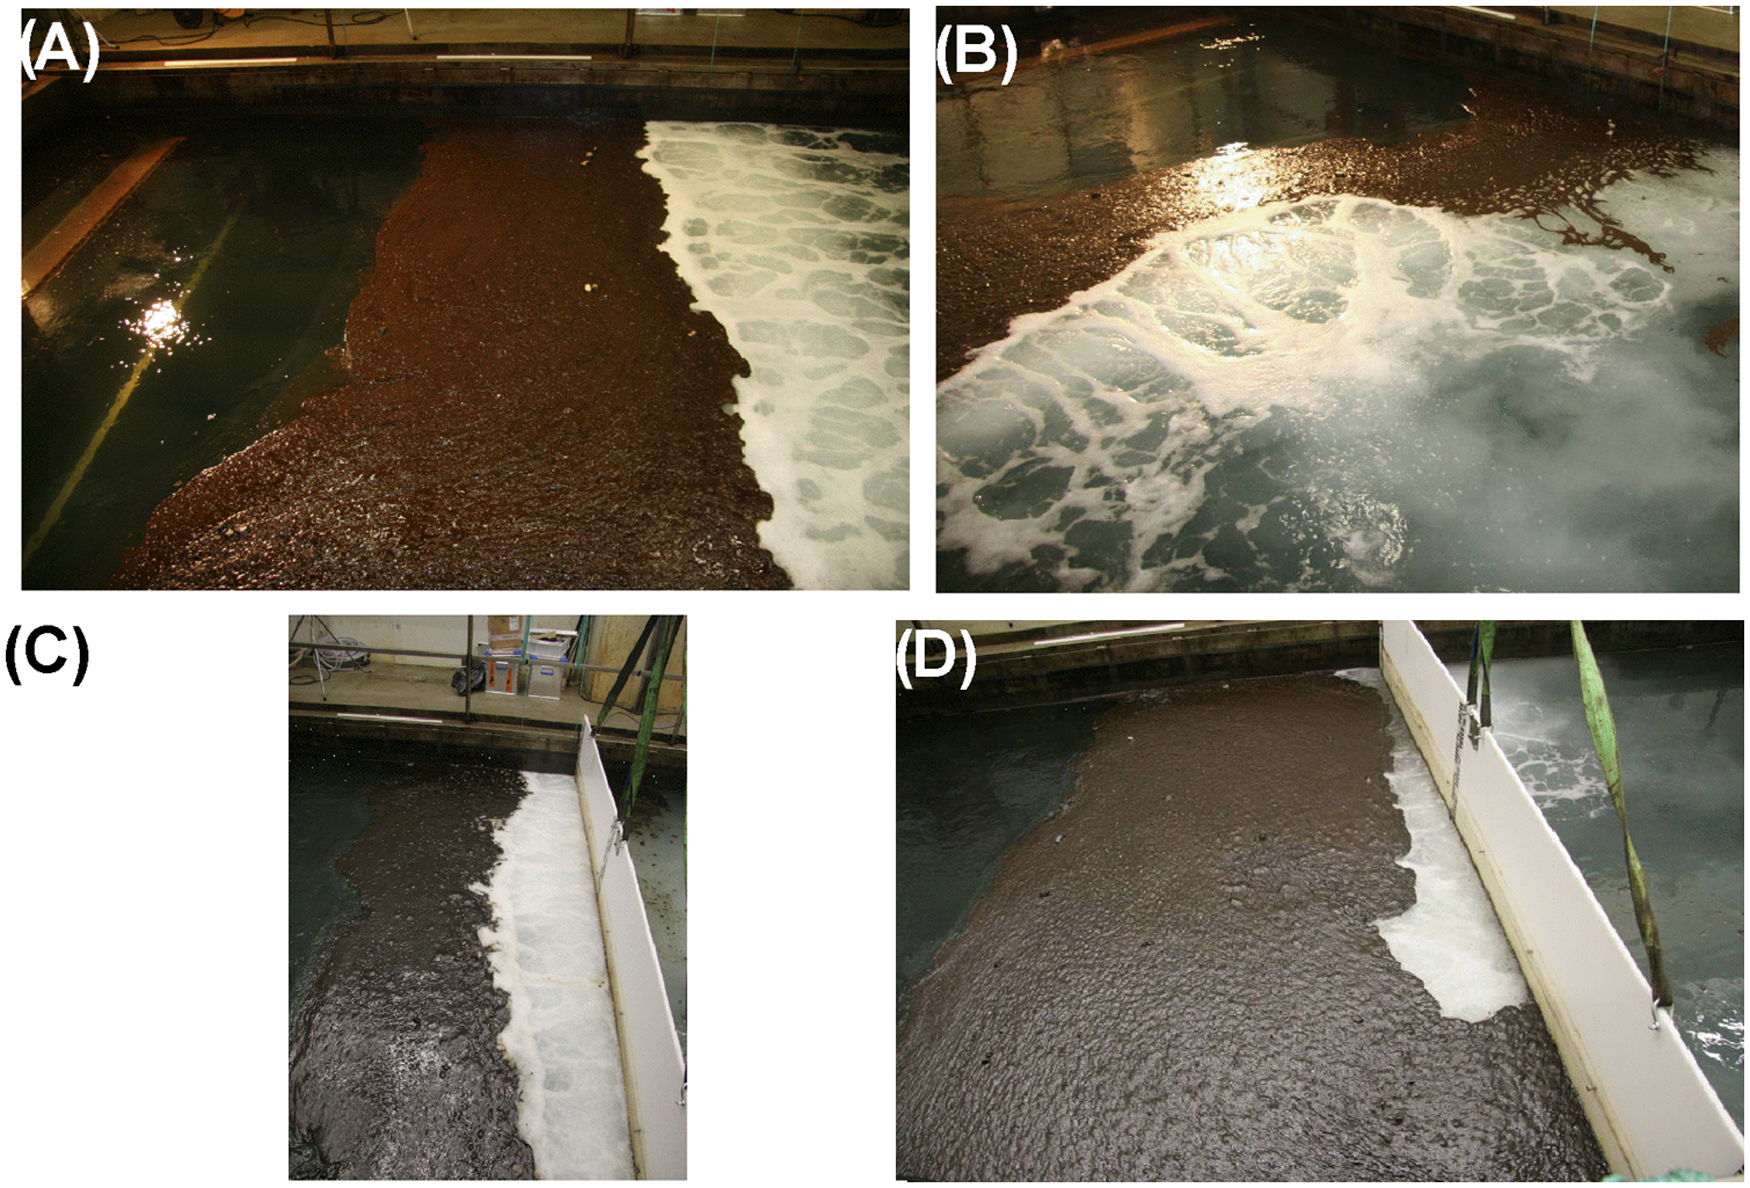
Real-world testing of a BOB-enhanced oil boom (tandem scheme) was conducted in the COP marine hydrocarbon seep field (Figure 1). Using a natural seep field takes advantage of its continuous natural (no permit needed) oil emissions. For the field trials (Figure 4), calm weather and seas were chosen to facilitate visualization of the BOB performance and failure.
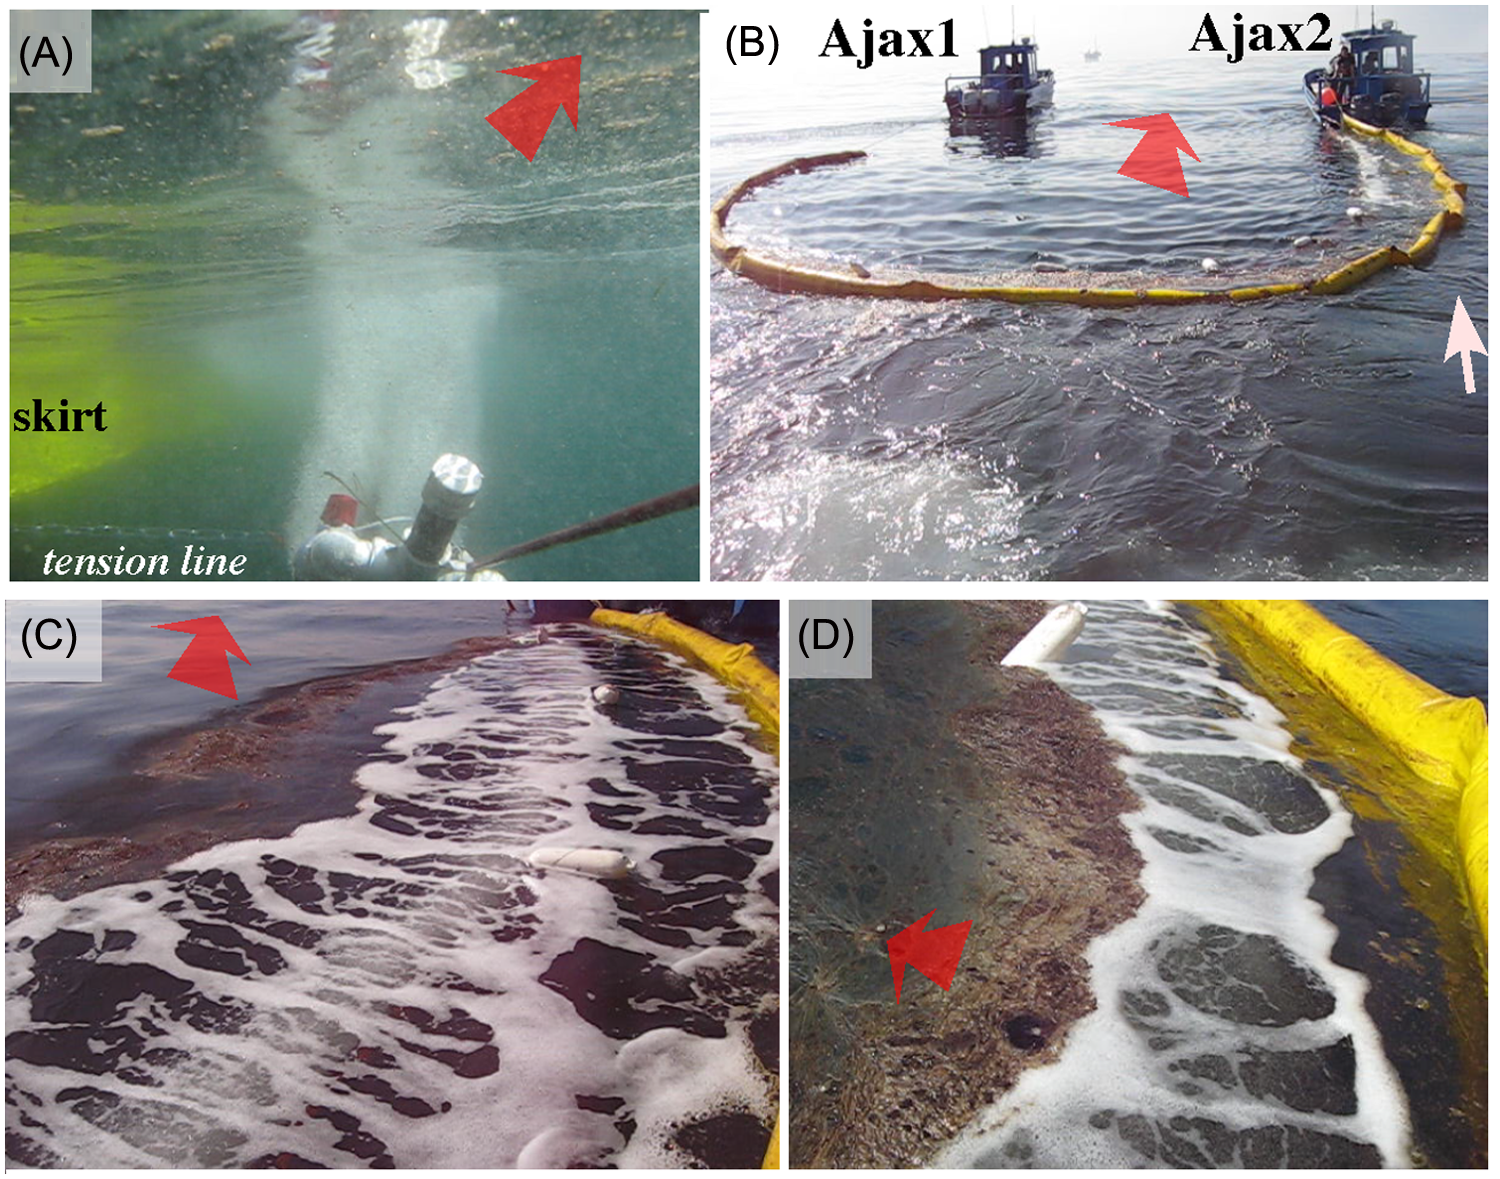
Images from the BOB enhanced oil boom tests in the COP. (A) Underwater view of dual bubble lines at 30 cm depth with the oil boom skirt on the left. (B) Dual boat boom deployment. (C) Oil slick pushed away from the oil boom’s guiding segments by rising bubbles. (D) BOB at the boom apex retaining the oil pool. The boats are Ajax 1 and Ajax 2, courtesy of Clean Seas. Red arrows show the tow direction. The white arrow shows the surfacing location of the entrainment vortex.
A dual bubble curtain was produced from two 30 m sparger elements (porous rubber soaker hoses), which were mounted 30 cm distant from an oil boom and maintained by a series of floats at 30 cm depth (Figure 4(A)). Regulated air flow was supplied from a compressor through an air flow manifold. The total oil boom length was 60 m so that the tandem configuration extended from one of the support vessels to past the apex in a typical ‘J’ configuration 1 (Figure 4(B)). After deployment, the two support vessels slowly towed the oil boom, collecting natural seep oil, while a third vessel (a 7 m Boston whaler) allowed observation of the BOB performance.
The BOB outwelling flow easily diverted the oil slick away from the oil boom along the acutely angled guiding boom sections (Figure 4(C)), with the slick thickening as it drifted along the boom. Vortex entrainment leakage was observed from these boom segments in the absence of bubbles; however, BOB enhancement maintained the oil slick approximately 1 m from the oil boom, preventing oil entrainment by vortices along the boom.
The BOB performance was challenged more strongly at the boom apex where the current was perpendicular to the oil boom. As the tow speed increased, the oil slick front moved closer to the bubble plume, eventually overrunning at about 0.7 m/s, a tow speed approximately 40% higher than generally used for oil boom operations. As the tow speed approached the critical break-through speed, wave effects became important. Wave orbital interaction with organized bubble structures in the bubble plume led to temporary weakening of small sections of the bubble curtain over which the oil surged forwards. Oil overran portions of the BOB that recovered too slowly. Underwater observations (Figure 4(A)) indicated that the loss of BOB coherency from waves was due in part to bubble plume disruption. In particular, wave orbital motions caused the plume to rise closer and further from the oil boom between the trough and crest respectively. This led to a mismatch between the driving buoyancy flux and the upwelling flow, evidenced by offsets between the bubble surfacing location and the surface boil driven by fluid motions at the sea surface. Prior to BOB plume overrunning, oil slick penetration was greatest at convergence zones between boils, where overrunning occurred first.
Once oil significantly overran a portion of the bubble plume, it suppressed the outwelling flow, creating a strong feedback, effectively quenching the outwelling flow and thus BOB oil blocking (Figure 4(D)). Slowing the tow speed allowed BOB recovery after a few seconds. An underwater video showed that the BOB blocked drifting submerged oil from the upstream front and sinking oil from weathering. The latter process was unrelated to the boom processes.
Laboratory tests
Laboratory tests were conducted in a narrow oil flume 9 (0.5 m) and a wide oil flume 10 (4 m) at the SINTEF SeaLab to study the BOB dynamics. The narrow flume allowed high-quality visualizations of the general character and details of fluid motions, including the surface outflows and the effect of a nearby barrier that simulated a tandem BOB-assisted oil boom. Studies investigated various oil slick thicknesses and area bubble plumes of various widths (various numbers of sparger elements). Bubble oil droplet flotation through attachment was also studied in the narrow flume, but the low interception probability observed suggested that this process would be ineffective in open waters. The wide-flume tests were conducted to study lateral variations in the induced flows for shallow bubble raft area plume sources, including the effect of a nearby barrier.
Narrow-flume setup
The narrow oil flume was an oval recirculating flume (Figure 5(A)) 1 m deep that was filled with 5 m3 of filtered seawater with a salinity of 34 practical salinity units, maintained at an ambient temperature of 13 °C, giving a density of 1.026 g/cm3. The test section features uniform flow with negligible turbulence because upstream water was forced through a porous wall (Figure 5(A), lower right arrow). Oil (yellow region) was introduced downstream from the porous wall and upstream of the bubble curtain to create oil pools ranging in mean thicknesses from 0.1 cm to 2 cm. Troll crude 250 °C + residue oil was used as a water-free oil and as an emulsion with a water content of 70 vol %. The oil and emulsion densities were 0.929 g/cm3 and 0.996 g/cm3 respectively, with viscosities of 370 cP and 5630 cP respectively.
(A), (B) Bubble curtain and barrier experimental setups in the (A) narrow-flume facility (2 m wide and 4 m long) and (B) wide-flume facility (4 m by 10 m long), side view; note the thrusters and return circulation under the flume floor. (C) Side-view schematic diagram of the bubble raft setup. (D) Side-view schematic diagram of the flume velocity profile.
Bubbles with 0.25 mm<r<1 mm were generated by sparger tubes (Fishtik-HP, Alita) with slits of 0.5 mm width (Figure 3(B)), where r is the equivalent spherical radius. An area bubble plume was created by a 25 cm × 40 cm raft of seven parallel sparger elements (each 35 cm long) (Figure 3(C)) mounted across the flume with 5 cm of offset between the upper spargers and the lower spargers (Figure 5(A)). The bubble curtain and area plume widths were 10 cm and 25 cm for one sparger and seven spargers respectively.
In a second experimental series, a barrier was submerged to 30 cm, downstream of the spargers, to simulate a tandem BOB and skirt (Figure 3(C)). The surface outwelling velocity V m was calculated from the time that a small float was used to move 30 cm from the bubble boil’s edge (surface arrow in Figure 3(B)). Studies in a larger (oil-free) flume 11 showed that this average velocity is close to V m.
Air flows Q of 8 l/min, 12 l/min, 16 l/min, 20 l/min, and 24 l/min were supplied to the spargers from a mass flow controller (Bronkhorst El-Flow). The imposed currents V c were 5 cm/s, 10 cm/s, 19 cm/s, and 25 cm/s. The flume 50 cm wide was narrowed gradually to 44 cm width at the bubble raft to ensure that the bubble plume spanned the flume width. The flume width for the single-sparger bubble curtain (Figure 3(B)) near the bubble curtain further was narrowed gradually to 35 cm.
Narrow-flume results
The strong upwelling flows generated by the wide plumes created outwelling flows that confined surface oil to the upstream side of the flow against a current, with the oil pool front generally about 10 cm from the bubble plume (Figure 6). The maximum outwelling flow occurred slightly beyond the bubble plume edge, while the oil front was about 10 cm from the bubble plume edge in Figure 6(A). However, for currents above a critical breakthrough current V c >V c B , oil overruns the outwelling flow. Overrunning generally first occurs near one wall (Figure 6(B)). Thus, the BOB effectiveness was quantified by increasing V c until breakthrough (e.g. Figure 6(B)). Slightly prior to overrunning, the oil pool front becomes unstable, with slow wave-like oscillations allowing transient penetration of the oil front to the bubble plume edge. These penetration flows generally occurred at convergence zones between boils within the bubble plume.
Down-looking photographs of a seven-sparger bubble raft test. (A) BOB oil retention for a 22 cm/s current. (B) Incipient oil breakthrough for a 25 cm/s current. The rectangle shows the approximate sparger raft location.
Without a skirt, V m increased as Q 0.37 (Figure 7), in agreement with published parameterizations 36 of V up(Q), suggesting that V m scales approximately as V up, in agreement with equation (5) for bubble plumes. Shifting from a bubble curtain to an area bubble plume (one sparger to seven spargers) caused a slight decrease in the outwelling flow. Addition of a skirt, however, significantly reduced V m and changed the flow field with V m ∝ Q 0.46; therefore, for an increase in Q, the increase in V m was greater than for a bubble plume with no skirt. This suggests that the skirt shifted the flow to the acceleration phase for this setup, i.e. reduced the momentum flux to the flow. This was contrary to expectations that the skirt would increase the upstream outwelling flow by eliminating downstream outwelling.
Outwelling velocity V m versus buoyancy flux Q with no ambient current, for seven spargers with a skirt (open squares), for seven spargers without a skirt (open squares with a cross inside), and for one sparger (open circles with a cross inside) without a skirt, and power law least-squares fits (solid curves) to the data.
The BOB’s oil blocking ability follows the same general trend as V m (Q), but with important differences (Figure 8(A)). For a given bubble plume arrangement and oil pool thickness, increases in Q correspond to the ability to contain the oil pool for higher V c . Although some data sets could be fitted with a power law, others could not. Thus, linear polynomials were fitted using a least-squares linear regression analysis (Table 1). Interestingly, except for the thickest oil layer, h = 20 mm, the ability to block oil for a given Q varied negligibly with the oil thickness. However, for h = 20 mm, there was a very strong dependence of V m on Q, which appeared quadratic (fit not shown).
BOB failure current V cB with respect to the air flow Q and the oil slick thickness h for water-free low-viscosity oil: (A) seven spargers without a simulated boom skirt; (B) seven spargers with and without a skirt; (C) for oil 7 mm thick. See Table 1 for fits; data keys are given in the figure.
Fit parameters for experimental data shown in Figure 8, where h is the height, b and a are the fit parameters of the function, V c B = a + bQ, and R 2 is the correlation coefficient.
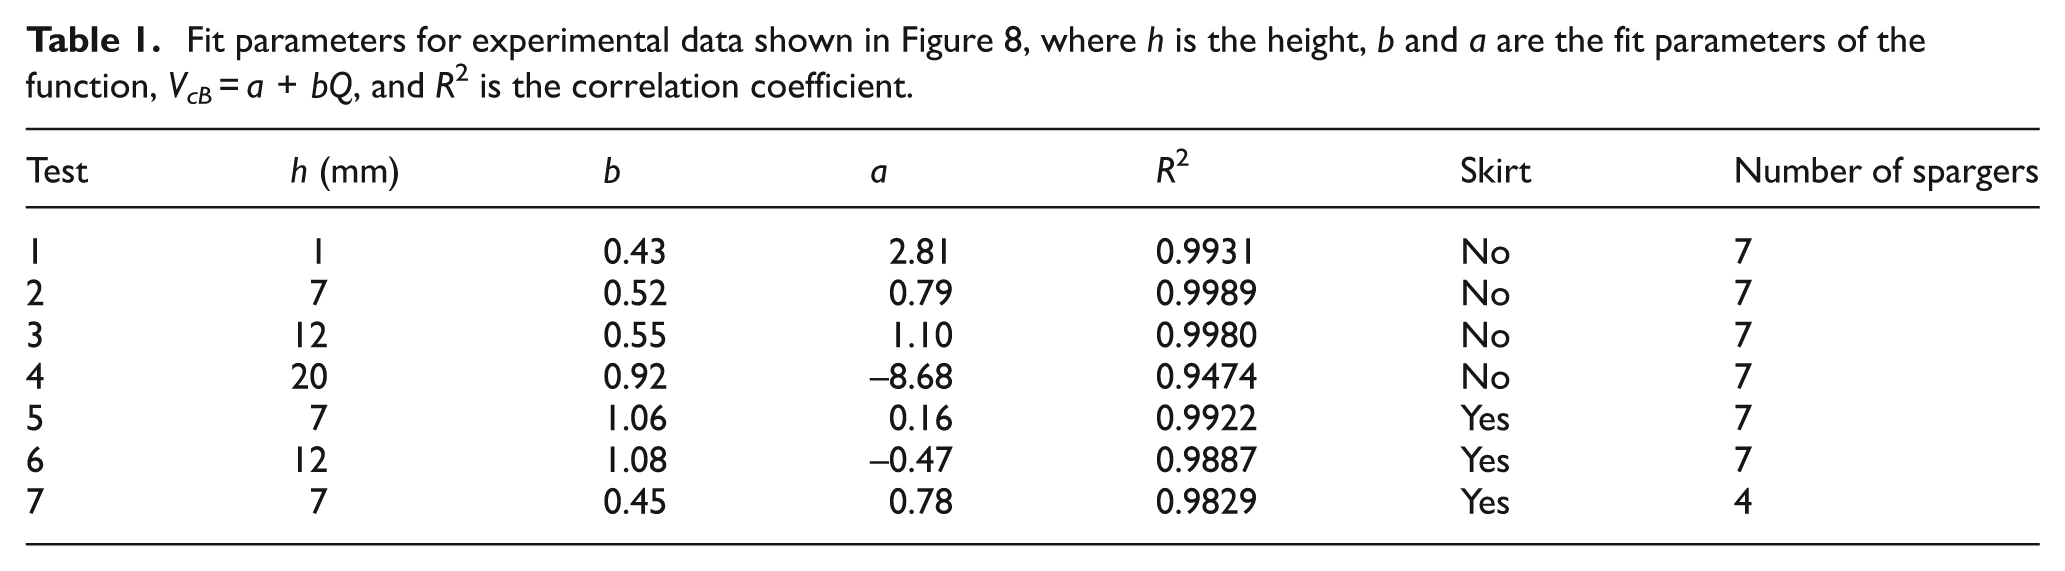
For h = 20 mm and no current, i.e. V m = V s at breakthrough, overrunning occurred for Q≲12.5 l/min. For higher Q, the data suggest that V m (Q) at breakthrough approaches asymptotically the trend of the other oil thicknesses, e.g. V m for h = 20 mm, Q = 20 l/min. Combining these facts with the results in Figure 7, the densities of the fluids and equation (1) suggest that k is close to 1 for the emulsion in the narrow-flume tests.
Addition of a skirt (Figure 8(B)) greatly boosted the blocking efficiency and increased the sensitivity to Q; i.e. an increase in Q produces a greater improvement in the BOB blocking efficiency with a skirt than without a skirt. Also, the BOB performance with a skirt showed no clear dependence on the oil thickness for the range of thicknesses tested.
As in the comparison between a curtain plume and an area plume (Figure 7), the effect of the bubble plume intensity on oil blocking (Figure 8(C)) was to increase the BOB performance. The bubble plume intensity is defined as the number of bubbles per unit area with the same Q and was studied by using four spargers mounted over three spargers, giving the same width for four spargers and for seven spargers. By comparison, addition of a skirt provided a far more dramatic improvement.
Besides improved oil blocking for the area bubble plumes versus curtain bubble plumes, another very important advantage of an area plume BOB compared with a curtain plume BOB was the increased efficiency at blocking entrained oil droplets from traversing the bubble plume. For the bubble curtain plume, a video showed that entrained oil droplets occasionally pass through the bubble barrier (leakage), although most oil droplets recirculated to the oil pool. In contrast, the area bubble plume returned almost all oil droplets to the oil pool, i.e. efficiently blocked the oil droplets. The primary exception was for oil droplets near the plume base, where upwelling flows were uneven and probably poorly developed. Droplet recirculation was highly effective even for higher Q, despite a dramatic increase in the oil droplet entrainment with increased Q. This recirculation was also documented by video from the field tests and in the wide flume.
The balance between the outwelling flow and the oil spreading depends on the oil density and viscosity. In this regard, the BOB performance in retaining an oil–water emulsion pool was better than for pure oil (Figure 9). Least-squares curve fits for pure oil and an oil–water emulsion (no skirt) found similar power law exponents (1.30 and 1.13 respectively) and asymptotic offsets (i.e. the minimum Q for BOB oil blocking), with good correlation coefficients (R 2 = 0.982 and 0.999 respectively).
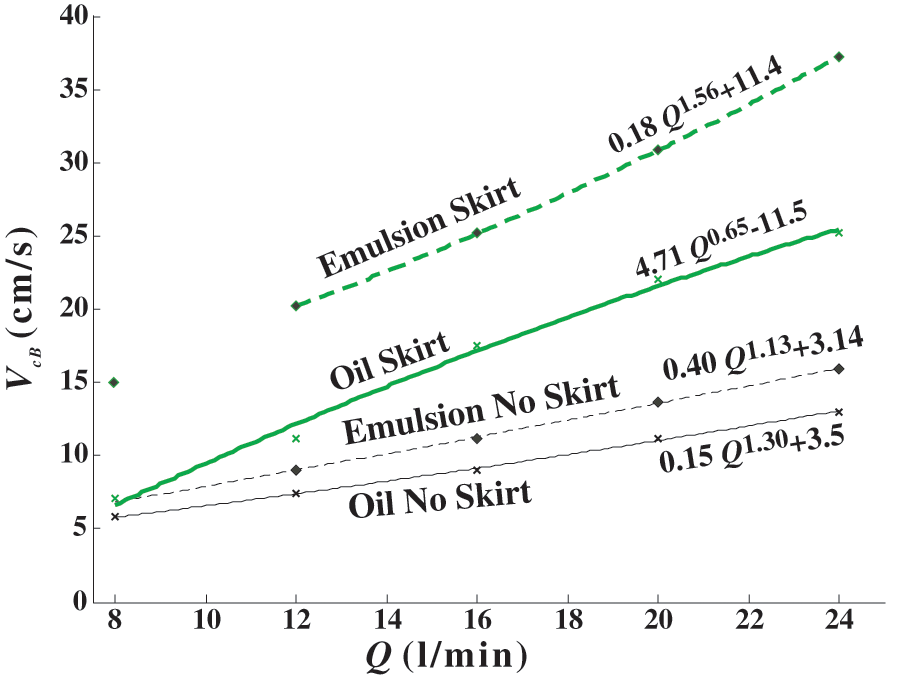
Breakthough current V cB versus air flow Q for bubble raft experiments with pure oil and with a 70 vol % water emulsion.
As before, addition of a skirt dramatically improved the BOB performance (tandem BOB). In addition, the relative improvement was greater for the emulsion than for oil. However, the offsets in the functional form of V cB (–11.5 and +11.4 for oil and the emulsion respectively) with respect to Q indicate that the power law model is a poor description of the BOB performance with a skirt, unlike flows without a skirt. This suggests multiple flow regimes. Further, the tandem BOB showed a power law exponent less than 1 for V cB with respect to Q. This weak dependence was derived both with and without the lowest flow value. The net effect is that the tandem BOB performance is greater at higher flows for the emulsion than for pure oil.
Another difference was the sensitivity of V cB to Q with and without the skirt for the two oil types. For both, V cB ∝ Q b where b ≈ 1. This significantly higher value of b characterizes how a skirt improved the BOB efficiency, especially for higher Q and higher viscosity. This demonstrates the importance of the interfacial boundary conditions between the oil pool and underlying water and their interaction with the BOB fluid dynamics and highlights the challenge in scaling these results based on Froude similitude.
Wide-flume setup
Tests in the wide flume (Figure 5(B) to (D)), described in detail by Leirvik,
10
revealed the 3D behavior of oil slicks (orange strip) under the influence of a BOB. The channel test section’s water depth was 1.35 m and the current profile decreased approximately linearly from the air–water interface to approximately 1 m depth. The bubble raft consisted of five bubble spargers 4 m long mounted at 46 cm depth. The spargers were porous rubber hoses, commonly sold as garden air-soaker hoses. The air was supplied by a diesel-powered Kaeser M80 air compressor that could deliver 8 normal m3/min of air at 7–8 bar. Oil-free air, cooled to ambient, flowed through two tubes with a length of 30 m and an inner diameter of
Horizontal velocity measurements were made using surface drifters and a single-axis propeller with a vane wheel flow probe (Höntzsch vane wheel, 25–18 mm) for deeper measurements. Outwelling flow depth profiles were measured for one sparger and five spargers in still water and for five spargers with a 27 cm/s current, with and without a skirt, for Q = 1000 l/ min. The velocities were measured at 5 cm, 7.5 cm, 10 cm, 12.5 cm, and 15 cm depth. Also, the flow velocities at 5 cm depth for conditions of oil breakthrough were recorded and corroborated with video recordings.
Tests with oil, both with and without a skirt, were performed for Q values of 400 l/min, 1000 l/min, 2500 l/min, 3750 l/min, 5100 l/min, and 7700 l/min at 1 atm to measure V cB . In each test, V c was gradually increased until oil overran the surfacing bubbles, with five spargers, with and without a skirt. In addition, the three lowest Q values were tested with a one-sparger BOB.
The test oil was a bunker fuel oil (IF30) that had been used in a previous field trial. Studies with the oil both as a 50% oil–50% seawater emulsion and as a pure oil were conducted. The emulsion density varied from 0.977 g/cm3 to 0.997 g/cm3 during the experiments, but the viscosity varied only from 6270 cP to 6540 cP. Because of the low temperature, the emulsion viscosity was higher than the emulsion viscosity of the small oil visualization flume tests. Oil volumes of 150 l or 300 l were introduced and the average oil pool width was measured to estimate the oil pool thickness.
Wide-flume results
The outwelling flow velocity profiles measured in the wide flume (Figure 10A) were well described by an offset Gaussian V(z) = c
1 exp[–(c
2 – z)2/
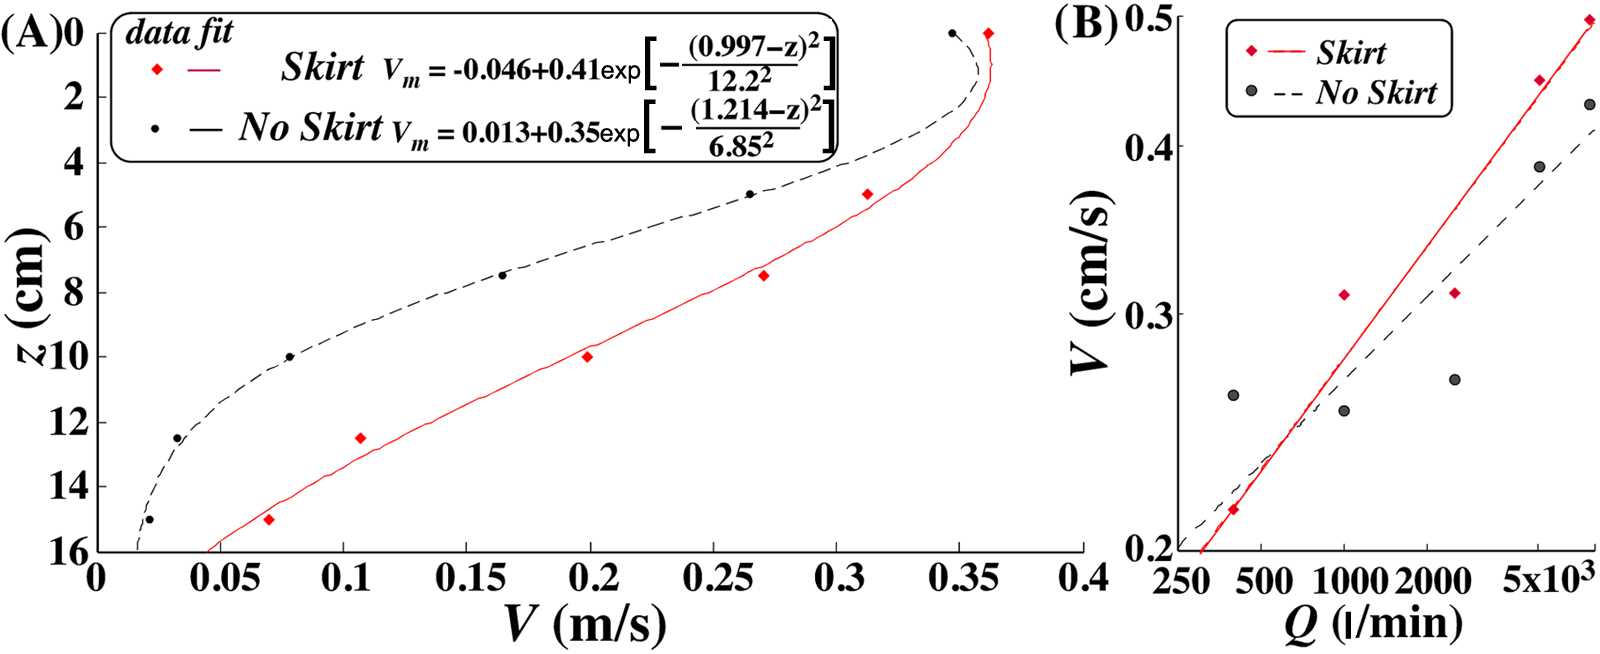
(A) Outflow velocity profiles for a five-sparger raft in the wide oil flume with an air flow Q of 1000 l/min and fits. (B) V m with respect to Q and fits. Data keys are given in the figure.
Although the surface velocity was slightly lower than the peak velocity, it was similar and is a good proxy for the overall flow. A power law fit showed a dependence of V m ∝ Q 0.21 for the BOB (Figure 10(B)), although the correlation coefficient was poor (0.800). Addition of a skirt increased the power law dependence to Q 0.276.
Although the velocities at 5 cm depth are an indicator of the strength of the outwelling flow, the critical velocity with respect to oil herding is V m and its ability to oppose oil spreading and currents in the presence of the flow variability V m –v′. Therefore, herding should also depend on the outflow’s consistency, which was tested for the BOB with oil. The oil front profiles prior to overrunning (Figure 11(A)) visually showed small instabilities, which were similar in appearance to those for the skirt-enhanced BOB in a similar state (Figure 11(C)). During overrunning of the BOB without the skirt, there was damping of the outwelling flow at the edges (Figure 11(B)), which increased the central outwelling flow, creating significant 3D asymmetries. Once significant overrunning occurred (Figure 11(D)), outwelling flows were damped almost completely. During this process, turbulence and bubbles from the bubble plume could increase entrainment as well as oil emulsification; however, the oil prevented observation. Unfortunately, the flume currents could not be controlled below 27 cm/s, which prevented useful data from being collected for the one-sparger BOB. Compare Figure 11(A) with Figure 1(D) and Figure 11(D) with Figure 4(D).
Images showing BOB operation (A), (B) without a skirt and (C), (D) with a skirt, (A), (C) prior to overrunning and (B), (D) afterwards.
The breakthrough current for the five-bubbler raft largely was insensitive to Q for Q<2500 l/min, increasing thereafter (Table 2). For all flows, the skirt increases the BOB performance, but the increased performance p defined as 2
p
= V
cB
(skirt)/V
cB
(no skirt), i.e. the binary power law exponent, showed significant variability with no clear trend. The mean p value was 0.424 ± 0.12, which is better than predicted for a reflective wall (p = 1/3) and far better than for the narrow-flume results where
Breakthrough currents for different air flow rates, where Q is the airflow, V cB is the breakthrough current, and p is a performance measure defined by 2 p = V c B (skirt)/V c B (no skirt).

V cB and the oil slick thickness h were largely insensitive to Q for the BOB alone. For the five-sparger raft, an increase in Q from 400 l/min to 7700 l/min increased h from 2.5 cm to 3 cm. 10 However, for the tandem BOB and Q = 7700 l/min, h was close to 10 cm at breakthrough.
Underwater videos in the small tank (Figure 12(A) to (F)) captured the bubble raft’s effectiveness at herding submerged entrained oil droplets back to the oil pool. Here, the entrained oil droplets penetrate only a short distance into the plume, while being guided by the upwelling and outwelling flows back towards the oil pool. Although most oil recirculation occurs subsurface, some recirculation drifts were observed in the surface outwelling flow (Figure 12(G) to (J)).
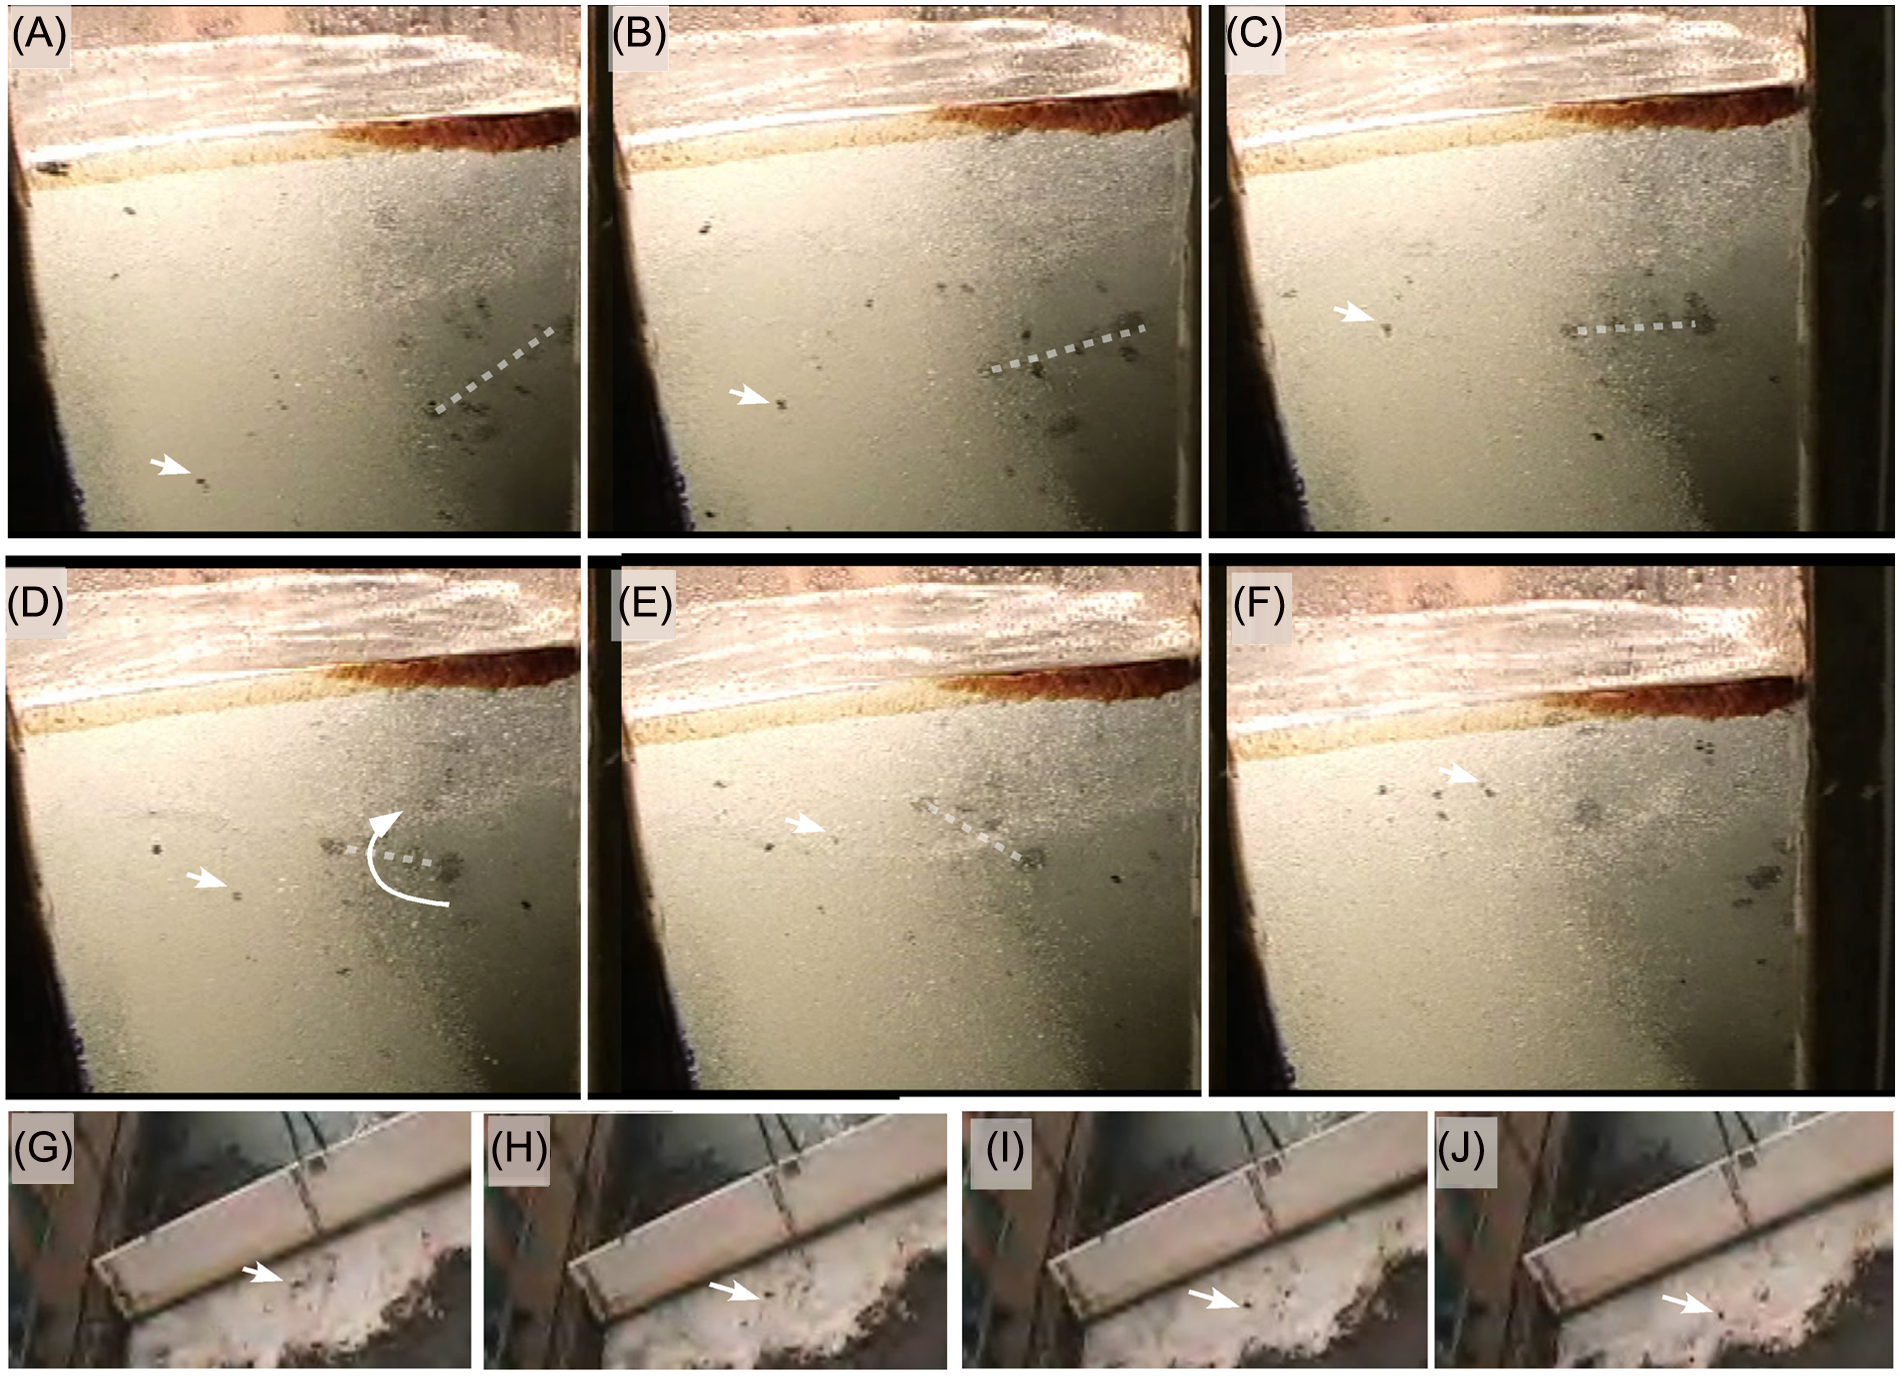
(A)–(F) Image sequence from the narrow flume showing recirculation of entrained oil globules: the white dashed line connects two oil globules trapped in the rotor; the arrow follows the track of a small oil droplet as it is recirculated by the bubble plume. (G)–(J) Down-looking image sequence of the wide flume, showing outwelling of a surfaced oil globule (arrows) back towards the oil pool.
Discussion
BOB failure modes
Insights from natural hydrocarbon seep field plumes and oil slicks, at-sea field trials and laboratory studies all showed that area bubble plumes can block thick oil slicks under a range of sea states including currents. In contrast, narrow bubble curtains are effective only under near-quiescent conditions. The key difference between conventional (curtain) BOBs and natural seepage bubble plumes (where leakage is not observed) is that seep bubble plumes are distributed and nonuniform.
BOBs have two primary failure modes: overrunning and leakage due to oil droplet entrainment followed by eddy diffusion through the bubble curtain. Although increasing the buoyancy flux increases the outwelling flow, reducing overrunning, increased turbulence enhances oil droplet entrainment and hence subsurface leakage. The flume studies showed that an area plume addresses subsurface leakage effectively by transporting injected oil droplets back towards the oil pool.
The only zone where the oil droplets traversed the wide bubble plume was near the base in the flow establishment region where the plume is in the acceleration phase. At the plume base, entrainment by the plume is minimal (peak entrainment occurs at the depth of necking). In the narrow-flume tests, bubble plumes were formed at the tank bottom, which creates flow conditions distinct from a marine application. Here, bubble plume entrainment arises from bottom- and wall-constrained recirculation. In contrast, entrainment for a near-surface source also occurs from below the bubble source. As a result, the plume flow development, and thus the blocking efficiency in the narrow-flume tests, was probably less effective than in the wide-flume tests and in the field.
To first order, droplet transport across the bubble plume is by eddy diffusion, which scales as the eddy size l
e
multiplied by v′. Further, the diffusion timescale through a bubble curtain is proportional to the square of the curtain width W, which relates to the plume formation elements that grow with increasing height above the bubble source. Thus, eddy diffusion across the plume (i.e. leakage) is reduced if W increases without increasing l
e
, i.e. a long diffusion timescale. For isotropic diffusive transport, the eddy diffusivity κ
e
∝v′l
e
scales between two different situations, denoted 1 and 2, as κ
eR
= κ
e1 / κ
e2 =
The laboratory studies suggested that this barrier transfer probability is highly conservative owing to greater flow complexity. Specifically, observations suggested that oil droplets were trapped in eddies near the plume’s periphery and that these eddies were guided by the upwelling flow towards the upstream side. Nevertheless, eddy diffusion theory provides guidance for improving the BOB design.
BOB failure occurs when the outflow current V m is slower than the oil’s spreading velocity V s plus the ambient current (or tow speed) V c . As a result, the greater the viscosity (as in an emulsion), the lower is V s and the higher is V cB for the BOB (Figure 9). This was shown by the higher V cB for the emulsions compared with pure oil in the wide- and small-flume experiments for the same Q. In equation (1), the viscosity is an important factor in the effective oil pool thickness 21 kh, which is due to the balance between the currents, outwelling, spreading flows, and amount of oil. However, several of the above results showed that the BOB performance was insensitive to h alone, in agreement with previous work. 4
Prior to overrunning, instabilities develop along the oil slick front, which begin to penetrate the surface boil. In the field, this was identified as resulting in part from wave orbital motions, leading to mismatches between the bubbles and upwelling flow as evidenced by displacement of the bubble surfacing location and the upwelling surface boil. However, this behavior was also observed in the laboratory without gravity waves (see Figures 1(D), 4(D) and 11). The instabilities manifest partly as oil surging behavior, which is also observed for conventional oil booms. These occur through circulation instabilities in the oil pool due to nonuniform oil thickness, among other effects. Thus, overrunning probably involves interaction between instabilities in both the oil pool and the bubble-plume-driven upwelling flow and waves where present. The outwelling velocity is zero in the boil center, reaching a peak somewhat outside the actual bubble plume’s surfacing footprint (boil). 11 When the slick penetrates beyond this point, it quenches the upwelling flow at the surface and hence the surface outwelling flow. In the narrow flume, this penetration first occurred at the walls (Figure 6(B)), where boundary effects lessen the outwelling flow.
BOB performance and flow field
One of the more interesting findings was that increasing the number of spargers very minimally increased the surface velocity (Figure 7). Although on first consideration this would imply a minimal increase in oil retention, in fact, there was a significant increase in the oil retention capability (Figure 8(C)). The explanation must lie in the outwelling current profile. Evidence was observed in the rate of thickening of the oil slick away from the leading edge, which was slower for the thicker BOB plume. This suggests a significant subsurface outflow which pushes oil away from the front, and it is the oil thickness near the front that drives the spreading current V s . In addition, oil pool frontal wave development was greater for the area bubble plume than for the bubble curtain, suggesting greater oil-water velocity shear. Conceptually, this can be understood as arising from a broader plume driving a broader upwelling flow, which by continuity must create a thicker, less sheared outflow because the surface outwelling velocities are similar. 11 This drives the rotor under the oil slick (Figure 2). This thicker outwelling flow is connected intimately to the rotor through momentum transfer to the surface outflow and influences it where it sinks below the interface (at the oil front).
In the presence of a current, additional complexity arises related to the rotor (Figure 2), because the current causes recirculating flows to occur locally rather than distant from the plume, as in the absence of a current. 28 Jones 20 showed that a weak ambient current can enhance the outflow somewhat while a strong ambient current can reduce it. This can be explained as arising because the weak current compresses the rotor into a smaller volume, strengthens it and thereby accelerates the more depth-constrained outflow to a thinner layer. 11 The current also transfers momentum to the rotor by the underflow. However, at higher ambient flows, the rotor is pushed into the plume, disrupting the buoyancy-induced flow. 11 There are large differences for the BOB with and without a skirt. Further details on the outflow, including turbulence and the effects of the currents and current–BOB orientation angle for shallow-area plumes with a skirt have been discussed by Leifer et al. 11 for a large-dimension flume without oil.
In the field tests with two spargers, overrunning tended to occur in convergence zones between boils, where the outwelling flow is less. As a result, the plume coherency was identified as playing an important role in efficient BOB operation. Thus, processes that decrease the plume coherency, such as the currents, waves, and turbulence, decrease the BOB effectiveness. From an engineering point of view, a shallower BOB depth lessens disruptive processes (the rise time is shorter); however, very shallow plumes are still in the acceleration phase and exhibit weaker upwelling flows, as well as allowing oil droplets to pass under the bubble source. Laboratory data suggest that the outwelling velocity profile rather than just the surface velocity is important for BOB oil retention, and thus additional plume acceleration is advantageous. Natural seep plumes are deep but avoid these processes because of their extensive dimensions, suggesting the potential to compensate for increased depth by increased plume thickness.
A BOB has several advantages compared with a conventional oil boom, at least for a wide BOB that alleviates subsurface leakage from oil droplet entrainment. Because the BOB uses fluid flows, it can perform with greatly reduced boom planning and over-splashing due to current and wave forces compared with a conventional oil boom. Because the BOB is submerged, it can block surface oil while allowing vessels to pass. Further, a BOB can be deployed among complex marine structures, such as docks, or in coastal wetlands, wherein conventional boom applications are highly challenged and oil leakage under the boom is a significant problem.
Bubble-enhanced oil booms
Most oil boom failure modes occur near the boom, and so a tandem BOB and traditional boom application could provide important synergies. By maintaining the oil at a distance from the skirt (Figure 4), several leakage mechanisms can be reduced or eliminated, such as the vortex oil leakage along leading boom skirts. Although the tandem arrangement seems technically challenging, field tests showed that a flexible arrangement of soaker hose sparger elements greatly facilitated deployment compared with an inflexible arrangement (i.e. perforated pipes). The flexible BOB should follow surface waves better, maintaining the source depth better. Because the bubble flow depends on the differential pressure across the bubble-producing elements, variable depth (hydrostatic pressure) along the boom can lead to reduced air flow sections where oil overrunning would occur first. The field trial success (under calm conditions) demonstrates the value of further study under less ideal marine conditions.
Although the effects of the skirt weres different in the narrow-plume study and the wide-plume study, it should be noted that the skirt-depth-to-source-depth ratio was less for the narrow-plume study than for the wide-flume study. Further studies should vary this ratio to characterize any dependence and to identify the optimum ratio. Another advantage based on the wide-flume study is that a skirt increased the outflow more than a doubling of the air supply did.
Energy costs
The use of BOBs entails an extra energy cost to supply Q. One example application is a BOB sluice that allows small vessels to enter a blocked region of oil slicks, which is not feasible with conventional oil booms. The results of the present study suggested that, for large Q, Froude scaling may be appropriate. Although the validity of Froude scaling is challenged by the viscosity and bubble rise speeds, no other scaling law applies to the present results. For a sluice opening 15 m wide and a source depth of 2 m, the power needed for V cB = 0.5 m/s is about 100 kW based on the five-sparger laboratory results in Table 2 and equation (3). Tests of a BOB sluice in a tidal current in rough winter weather using bark as a proxy for oil have been reported previously. 44 Similar retention would be expected for a tandem BOB oil boom application with half the power. Other operations could involve a fleet of small boats to maintain a ‘fire line’ at sea.
Conclusion
Although the literature suggests that BOBs be used only in quiescent waters, field and laboratory tests presented herein show successful BOB application in nonquiescent waters for area bubble plumes. The key was a wide-area bubble plume where individual boils are much smaller than W and less affected by the ambient variability. This mimics natural seep bubble plumes which create thicker outwelling flows and prevent oil droplets from traversing the bubble plume (i.e. leakage). Oil retention for a tandem BOB and oil boom was significantly greater with increasing Q than predicted for a BOB alone. The performance was also better for emulsions with a higher viscosity (a slower spreading velocity) than for pure oil. Nonlinear processes, such as instabilities in the oil pool front, and bubble plume unsteadiness were identified as important areas for further study.
Footnotes
Appendix
Acknowledgements
The authors wish to thank Clean Seas of California for the kind contribution of a vessel and personnel time, in particular, in memoriam for the kind contribution and support of Rick Gill. The contributions of Dan Culling, Chris Stubbs, Morgan Soloway, Christoph Pierre, and Shane Anderson to the field trails are also acknowledged. We thank our anonymous reviewers for helpful comments and suggestions.
The project also received support, advice, and technical input from NorLense AS, NOFI Tromsø AS and Norsk Oljevernforening For Operatørselskap.
Funding
This work was funded by the Research Council of Norway (PETROMAKS project no. 187376), Statoil ASA (contract no. 4501688678), and ENI Norge AS (re. no. ENINO/PRO/198926-1).