
Abstract
Recent European and global trends in education have been to promote inclusive education and expand education, resulting in the increased provision of special education. In promoting inclusive education, recent special education reforms have also aimed to curtail the rise in identification rates for students in special education, for example, by focusing more on early support and discontinuing fiscal incentives to identify students with special educational needs. Using official special education statistics, we studied how Finland’s special education system reforms changed the share of students in special education. In addition, we examined variations in special education provisions among municipalities before and after the reforms, and identified municipal-level predictors of variations. This study utilised piecewise linear latent growth curve modelling to analyse changes, thereby providing an example of how this method can be applied in policy reform studies. The results indicated, in particular, that the funding reform has incentivised municipalities to decrease identification rates for students in special education and to diminish special education provision. However, different municipalities have different special education provisions and have changed these provisions in varied ways. In particular, we found that small and large municipalities differ in special education practices and reform implementation.
Keywords
Introduction
In recent years, the debate around special education has often concentrated on two phenomena: the increase in the identification of students with special educational needs (SEN) and inclusive education. As noted by Tomlinson (2012), these two phenomena paradoxically coexist, as student diversity in mainstream schools has increased as a result of inclusive education, which in turn has increased the need for special education and special education professionals. Additionally, special education policy reforms in many countries have been driven by these two issues. For instance, Response to Intervention in the USA and Learning and Schooling Support in Finland are examples of education reforms aiming to promote inclusive education while also reducing identification rates for students in special education (Jahnukainen and Itkonen, 2016). In this study, we focus on the Finnish case and examine whether the latest broad reforms of special education have succeeded in promoting inclusive education and stopping the increase in special education.
The past decade has seen a considerable increase in the identification of students with SEN. As noted earlier, the expansion of education and the promotion of inclusive education in mainstream schools, which are now more diverse than before, is one reason for the increase in special education (Tomlinson, 2012). Special education can be viewed as a response to the challenges faced by general education. The increasing diversity of students has challenged the general education system and led to the need for differentiation. According to Richardson and Powell (2011), this has resulted in the elaboration of classification systems, an increased need for special educators and additional organisational options for diverse students (e.g. special schools or special classrooms). Thus, the diagnosis and identification of students with SEN have benefitted professionals. Moreover, they have benefitted parents because they ensure additional resources for students (Tomlinson, 2012).
Although the increased provision of special education is a global phenomenon, there is considerable variation internationally in the identification of students with SEN (Ferguson, 2008; Richardson and Powell, 2011). Historically, definitions of SEN have varied at different times and in different countries (Richardson and Powell, 2011; Tomlinson, 2012), and this partly explains the variation in identification rates. The identification rates for students who have normative and low-incidence disabilities are the least varied. These students have a clear, natural basis for their educational needs. Among the three cross-national categories (OECD, 2000, 2007), which are commonly used in international comparisons, these students are included in category A (students with disabilities), for which there are generally adequate measuring instruments and agreed criteria (OECD, 2000, 2007). Variation is greater in the non-normative and high-incidence categories, which, in the OECD’s categorisation, refer to students with learning difficulties (category B) and students with disadvantages (category C). Their SEN depend more on the interaction between the student and the educational context, or it can be a consequence of the students’ socioeconomic, cultural, or linguistic background (OECD, 2000, 2007).
Like identification rates for students in special education, the rate of inclusive education, as measured by the share of students with SEN in general education classes, varies between nations (e.g. Ferguson, 2008; Richardson and Powell, 2011). Although segregated settings were at one time more common, the trend in education in the last decade has increasingly been to teach more students with SEN in general education classes. Internationally, the Salamanca Statement of 1994 set the goal of providing education for all children, including those with SEN, within the general education system. In the framework for action on special needs education, UNESCO (1994: 19) proposed that, at national level, ‘both policies and financing arrangements should encourage and facilitate the development of inclusive schools’.
The definition of inclusion seems to vary in the literature but has often been understood as the place of provision of special education (e.g. Haug, 2017; Nilholm and Göransson, 2017). On this view, inclusive education means ensuring that every student gets the support they need in mainstream settings. From a broad perspective, inclusive education refers to the process of enhancing community and participation and of lowering barriers to learning (Ferguson, 2008; Haug, 2017; Nilholm and Göransson, 2017; Thomas, 2013). Richardson and Powell (2011) reviewed the relationship between inclusive education and the structure of a nation’s education system and found that it is more common in centralised education systems, such as those of Italy and Norway, for students with SEN to be educated in general education classes. In contrast, in decentralised education systems, such as those of Germany and Denmark, segregated placement is more common (Richardson and Powell, 2011).
One factor in education systems that has been argued to affect the identification and placement of students with SEN and regional variation in identification rates is special education funding (e.g. Greene, 2007). According to Harr et al. (2012), there are two broad types of special education funding: census and non-census systems. In census-based systems, the funding is based on the total enrolment or the total school-aged population, whereas, in non-census funding systems, the funding is based on the overall number of students with SEN (Harr et al., 2012). The increase in special education has often been explained by the introduction of financial incentives in the form of non-census systems (i.e. weighted funding systems) (e.g. Cullen, 2003; Greene and Forster, 2002; Kwak, 2010). Moreover, non-census funding systems can have incentives to increase either segregated or integrated placement, depending on whether the funding is based on the number of students with SEN in special schools and special classes or in general education classes (Fletcher-Campbell et al., 2003).
A census-based system, instead, is sometimes considered free of any fiscal incentive to identify students with SEN (Harr et al., 2012) and can be used to slow cost growth in providing special education (Dhuey and Lipscomb, 2013). Such systems, which are based on the supply of services, have been argued to support inclusive education (e.g. Fletcher-Campbell et al., 2003). However, census-based funding also has some disadvantages. According to Baker and Ramsey (2010), rates of students with disabilities can vary and are not necessarily distributed evenly across regions. If state funding is census-based, this may lead to inequity in the quality of special education services across districts and increase school districts’ share of special education funding (Dhuey and Lipscomb, 2011, 2013). In addition, a census-based funding system is not completely free of fiscal incentives; specifically, it can incentivise service reductions, lower identification rates and less costly placements (Dhuey and Lipscomb, 2013; Mahitivanichcha and Parrish, 2005).
Mahitivanichcha and Parrish (2005) suggested that when reforming special education, one should consider that fiscal incentives promote rather than discourage planned reforms, such as inclusive education. For example, in the Netherlands, reforms to the special education funding system in the 1990s and 2000s aimed to stop special school referrals by changing the funding system to be more census-based and allocating funds not only to special schools but also to clusters of regular schools and students who require special services (Fletcher-Campbell et al., 2003; Pijl, 2016). However, according to Pijl (2016), these reforms failed to decrease special school referrals and increased the identification rate of students with SEN in mainstream settings, thus increasing expenditure.
In addition, Dhuey and Lipscomb (2011) showed that although the state’s funding system became census-based, the placement of students with severe disabilities outside general education classrooms increased because the expense of doing so was reimbursed. Clearly, then, the relationship between fiscal incentives and special education practices is complex and is likely to be influenced by other contextual and political factors (Mahitivanichcha and Parrish, 2005). Moreover, funding systems at the local or school level may differ from the state-level funding system, resulting in various implementations of state-level funding reforms (Fletcher-Campbell et al., 2003).
The Finnish special education system
In Finland, the objectives of educational policy are to ensure that every child has an equal opportunity to be educated and the right to enrol in a local school (Law 628/1998; see also Halinen and Järvinen, 2008). Since the late 1960s, when comprehensive schooling was established, the Finnish system has involved two forms of special education: full-time and part-time (Kivirauma and Ruoho, 2007). Full-time special education targets those students who need regular support; it requires an official decision and can be arranged either in a special class or in a general education class. In contrast, part-time special education is a form of early support that can be provided temporarily and flexibly alongside other teaching in general education settings without any official decision (Finnish National Board of Education (FNBE), 2010). Part-time special education plays an essential role in the Finnish support system and has even been identified as one reason for the success of Finnish students in the PISA study (Kivirauma and Ruoho, 2007). Compared with class-based special education, it is less expensive and has been especially useful in small municipalities, where class-based special education is more difficult to arrange due to the small number of students (Jauhiainen and Kivirauma, 1997).
In Finland, like elsewhere, the provision of special education has increased in recent decades. For example, between 2001 and 2009, the share of students in full-time special education increased from 5.2% to 8.5%, and the share of students in part-time special education rose from 20.1% to 23.3% (Official Statistics of Finland (OSF), 2016). In the same period, the share of students in special classes decreased from 70% to 50%, and the share of students with SEN who were taught only in a general education class increased from 15% to 30% (Kirjavainen et al., 2014b). The increase in full-time special education reflects the growth in high-incidence disabilities (i.e. students with difficulties or disadvantages); low-incidence disabilities (i.e. students with severe disabilities) remained relatively constant in the period 2001–2010 (Kirjavainen et al., 2014b).
Graham and Jahnukainen (2011) reported that the increased provision of special education in Finland is owed in part to administrative changes that extended special education in comprehensive schools to new groups of students. From the late 1990s onwards, students with severe disabilities were transferred to comprehensive school. More significantly, since 1999, the Basic Education Act enabled not only students in special classes but also some students taught in general education classes to be defined as having SEN (Graham and Jahnukainen, 2011). In addition, the increase in students in special education seems partly due to municipalities’ financial situation. According to Kirjavainen et al. (2014a), both tax revenue and state grants for municipalities related positively to the share of students receiving special education in the period 2001–2010.
In Finland, basic education is publicly funded and is commonly arranged by municipalities (see Halinen and Järvinen, 2008). Although the state allocates funding for basic education, local authorities in the municipalities can decide independently how those funds are used. The autonomy of local authorities increased in the 1990s as a result of decentralisation (Rinne et al., 2002). According to Rinne et al. (2002), this contributed to the transfer of responsibility for funding cuts from the central administration to municipalities in the economic recession of the 1990s. Before the latest reform, funding of special education was non-census. Municipalities received extra funding based on their enrolment of students with SEN (Law 635/1998; see also Graham and Jahnukainen, 2011; Jahnukainen, 2011). For students with SEN who attend nine years of compulsory education, funding increased 1.5 times. For students with severe disabilities, whose compulsory education is extended to 11 years, the funding was 2.5 times higher than basic funding. The funding was highest (i.e. four times the basic funding) for students with the most severe developmental disabilities in extended compulsory education.
The Finnish special education system was reformed in two phases at the beginning of the 2010s (see Figure 1). First, the funding of special education was reformed in 2010 (Law 1704/2009). Second, the Basic Education Act, which regulates arrangements for special educational support, was amended in 2011 (Law 642/2010). As mentioned above, before the funding reform, municipalities received extra funding based on the number of students with SEN (i.e. students in full-time special education) (Law 635/1998). After the reform, basic education funding was based on the number of residents of compulsory school age (6 to 15 years old) in municipalities (Law 1705/2009). Thus, one essential element of this reform was that extra funding for students in full-time special education was discontinued, with the exception that education providers continued to receive additional funding for students with severe and most severe developmental disabilities in extended compulsory education (Law 1705/2009; see also Pulkkinen and Jahnukainen, 2016). Following the reform, the funding of special education is now mainly census-based.
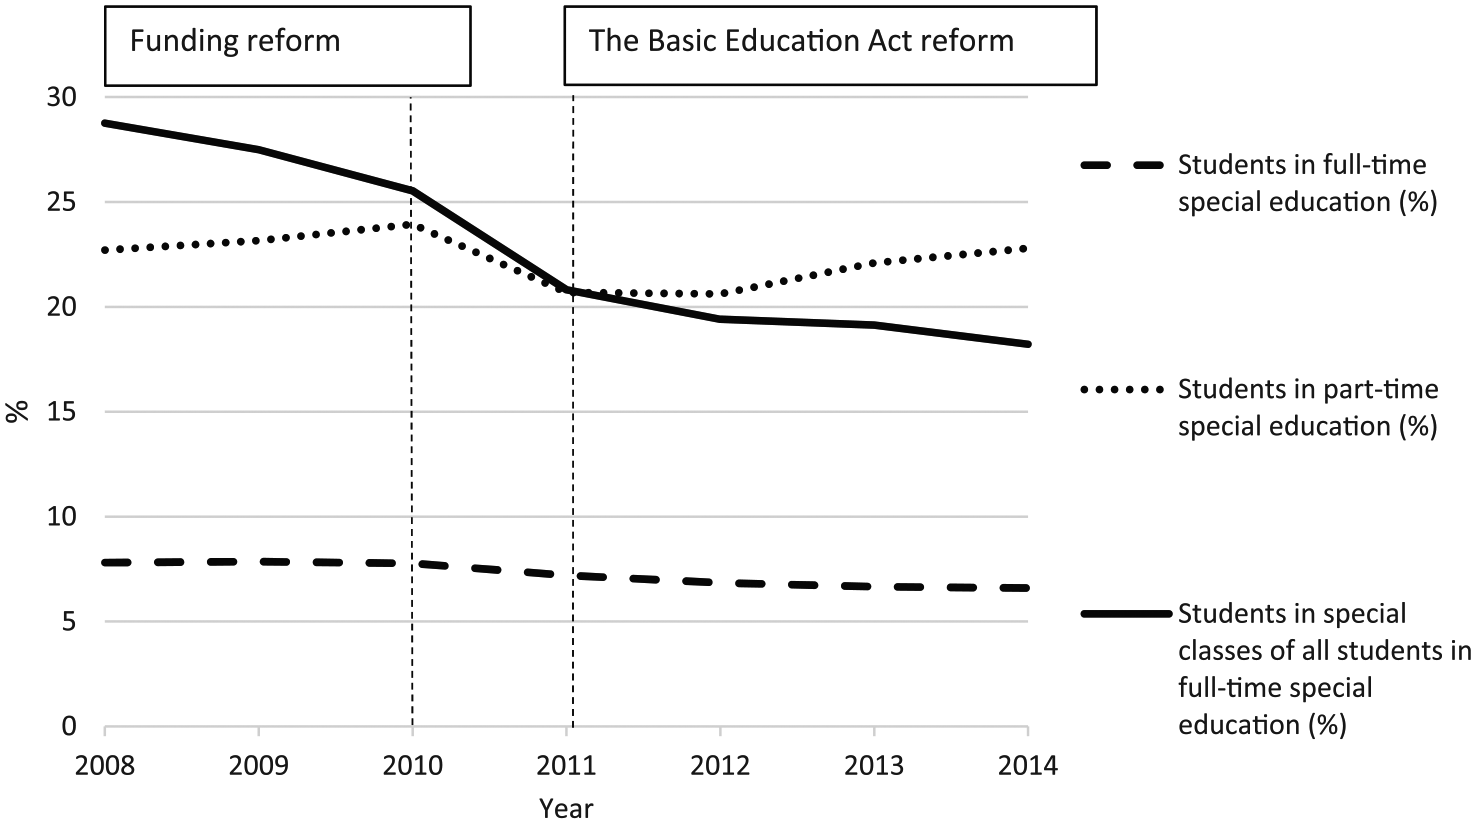
Share of students in special education in Finland between 2008 and 2014.
The reform of the Basic Education Act of 2011 meant the transfer of special educational support from the two-tiered system of part-time and full-time special education to the three-tiered support model (general, intensified and special support) called Learning and Schooling Support (FNBE, 2010). In the new model, special support (Tier 3) is equivalent to full-time special education. Part-time special education instead serves as a form of support for students in all three tiers, even though, according to OSF (2016), most (60%) of the students receiving part-time special education during the school year 2015–2016 were in Tier 1 (general support).
The aims of the reforms were defined in the Special Education Strategy (Ministry of Education (MoE), 2007), which was launched in 2008. It was followed by a nationwide development project called the Kelpo Initiative, which helped support almost all Finnish municipalities to develop their support practices (see Ahtiainen, 2017). Although the reform was implemented nationwide and the provision of support was guided by legislation and the National Core Curricula (FNBE, 2010), some previous studies of the most recent Finnish educational reforms (e.g. Pesonen et al., 2015; Pulkkinen and Jahnukainen, 2016; Thuneberg et al., 2014) noted that there are differences in how municipalities have implemented the reforms. In addition, municipalities differ in their arrangements for special education and in the share of students receiving it (Kirjavainen et al., 2014a; Lintuvuori et al., 2017).
The present study
This study examined changes in the share of students in special education (including part-time special education, full-time special education and special class placements) from 2008 to 2014. We examined how the educational reforms of 2010–2011 altered the share of students in special education in the municipal comprehensive schools. We studied changes at municipality level because, in Finland, municipalities are principally responsible for the organisation and financing of special education in basic education. Because earlier studies (Pesonen et al., 2015; Pulkkinen and Jahnukainen, 2016; Thuneberg et al., 2014) identified differences between municipalities in terms of arrangements for special education and in the implementation of reforms, we investigated variation in the level and rate of change in special education before and after the reforms. In addition to descriptive statistics, latent growth curve modelling (LGM) was used to analyse this variation and determine whether the variation can be predicted by municipal-level factors. We performed separate analyses of changes in part-time special education, full-time special education and special class placements because it can be assumed that the reforms may have differentially affected these. The first phase of the overall reform (funding reform in 2010) removed financial incentives for full-time special education but may at the same time have reduced special education resources. The latter phase of reform (the Basic Education Act reform in 2011) regulated investment in early support and inclusive education, which may have increased the need for part-time special education while reducing special class placements.
The research questions were as follows.
How did the share of students in part-time and full-time special education and in special classes change between 2008 and 2014? The investigation involved three distinct phases: change before the reforms, change between the funding reform and the Basic Education Act reform, and change after the Basic Education Act reform (see Figure 1).
1.1 Did the share of students in special education change between 2008 and 2010 (i.e. before the reforms), and did the rate of change vary across municipalities? 1.2 Did the share of students in special education change between 2010 and 2011 (i.e. between the funding reform and the Basic Education Act reform), and did the rate of change vary across municipalities? 1.3 Did the share of students in special education change between 2011 and 2014 (i.e. after the Basic Education Act reform), and did the rate of change vary across municipalities? 1.4 Was the initial level in the share of students in special education related to the rate of change in each of the three phases? Were the rates of changes related to each other?
Did municipal-level background factors (i.e. size, financial situation and socioeconomic characteristics) predict variations across municipalities in the level and rate of change in special education in each of the three phases?
Methods
Data
The data are based on special education statistics compiled by Statistics Finland. These official statistics include information about the number of students in both part-time and full-time special education. The statistics also contain data on the place of provision of special education (OSF, 2016), covering pre-primary education (6-year-olds), grades 1–9 (7–16-year-olds) and additional basic education teaching (grade 10, 17-year-olds). Since pre-primary education and additional teaching also include additional years of education for students in extended compulsory education (usually those with severe disabilities), they were included in the present data. Extended compulsory education begins a year earlier and lasts for 11 years rather than the usual nine years of compulsory education (Law 628/1998).
These data are collected annually from educational institutions by means of a web-based questionnaire. Data are collected in September, and information about the number of students in full-time special education and the place of provision describes the situation at that point in time. In contrast, the data on part-time special education refer to the number of students over the last school year (e.g. part-time special education statistics for the school year 2009–2010 were collected in September 2010).
We used special education statistics for the period 2008–2014 (see Figure 1). The first year of the study period is the year following the launch of the Special Education Strategy (MoE, 2007), which framed the goals of the reforms that followed. The selected study period enabled us to examine changes in the share of students in special education before and after the reform years (i.e. funding reform in 2010 and the Basic Education Act reform in 2011). However, the studied period does not include other significant reforms of basic education such as the new National Core Curriculum, which was launched in the autumn of 2014.
Ordered as a special compilation from Statistics Finland, our data include statistics for special education organised by municipality (N = 301). Data are the population data of Finnish municipal comprehensive schools. Because the aim of the study is to investigate differences between municipalities and contributory factors at municipal level, we have excluded data on private and state organisers of special education, as well as the autonomous province of Aland, which differs from the municipalities in this regard. This means that our study covers 96% of all 2988 comprehensive schools and 82% of all 148 special schools in 2008, and 95% of all 2498 comprehensive schools and 76% of all 99 special schools in 2014. Total enrolment in municipal comprehensive schools was 537,215 students in 2008 and 517,547 students in 2014. As there was some consolidation of municipalities in Finland between 2008 and 2014, we have used the municipal divisions for the year 2015. To study the relationship between changes in special education and background variables at municipal level, the special education data were combined with other key municipal data that are freely available on Statistics Finland’s website (OSF, 2017).
Variables
Special education
The dependent variables were: (a) the percentage of all students in basic education who are receiving part-time special education; (b) the percentage of all students in basic education who are receiving full-time special education; and (c) the percentage of students in special classes compared to all students receiving full-time special education. Part-time special education refers to teaching that students with difficulties in learning or school attendance can receive in addition to other teaching, without any official decision. The statistics include all students who have received part-time special education at least once in a school year; some of these students may have received part-time special education only once and others weekly within the school year. Part-time special education can provide support within all three tiers of the Learning and Schooling Support system, including students receiving full-time special education (Tier 3). For that reason, some students may be included both in the statistics for full-time special education and in the statistics for part-time special education. Full-time special education refers to teaching that is provided to students for whom it was officially decided to offer special support. After the reform of the Basic Education Act, this refers to students in Tier 3.
Students in special classes are students who receive full-time special education and are taught fully in a special class. The official statistics include information about the setting where students are provided full-time special education (OSF, 2016). Until 2011, the statistics assigned the place of provision of special education to three categories: (a) teaching is provided fully in a general education class; (b) teaching is provided partially in a general education class; or (c) teaching is provided fully in a special class. Since 2011, this has been increased to five categories. The only category redefined in 2011 referred to cases where teaching is provided partially in a general education class. The redefined statistics describe the percentage (1–20%, 21–50%, or 51–99%) of teaching provided in a general education class. The category in which all teaching is provided in a general education class and that in which all teaching is provided in special classes, either in a mainstream school or in a special school, have remained the same. Here, we used the latter category as a dependent variable. The above changes in special education statistics during the study period do not relate to our three dependent variables. For the dependent variable of special class placements, the proportion of missing values ranged from 0% to 1%. There were no missing values for part-time and full-time special education.
Municipal-level background variables
We used municipal-level background variables (covariates) to predict the level and rate of change in the share of students in special education. The descriptive statistics for municipal-level variables are presented in Table 1. The models included variables relating to special education supply and demand. As small and large municipalities differ in terms of how they are able to arrange their special education provision, the variable used to describe supply was total enrolment in municipal schools, indicating the size of municipality. In addition, financial factors such as tax revenue, state grant for municipalities and the municipality’s annual contribution margin are also related to the supply of special education. As these financial factors are strongly correlated with each other, we included only one of these as a variable in the models to control for the effect of a municipality’s financial situation on share of special education students and changes in this regard. The variable selected to describe the financial situation was tax revenue per capita, which in Finland has been shown to have the strongest effect of the three above financial factors on share of special education students (Kirjavainen et al., 2014a). There were missing values on some of the background variables for 13 municipalities (4% of the total).
Descriptive statistics for municipal-level background variables (N = 301).
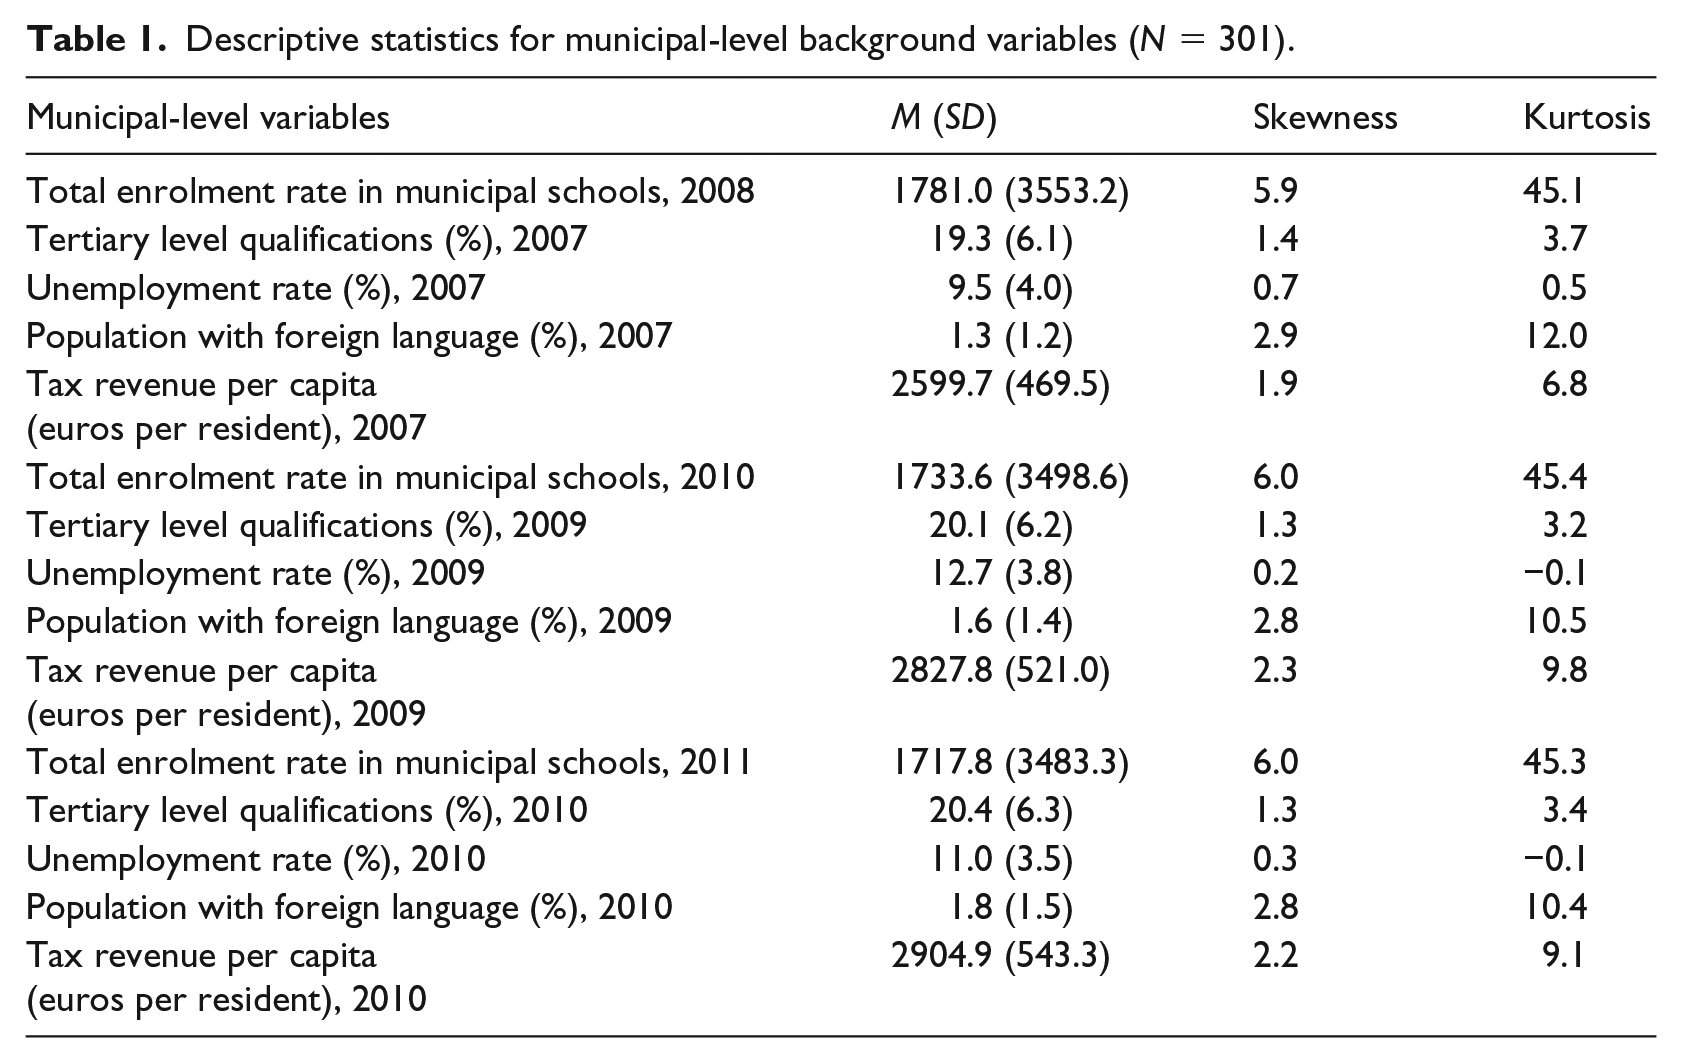
Since socioeconomic and ethnic minority backgrounds are related to demand for special education (e.g. Anderson et al., 2015; Kvande et al., 2018; Skiba et al., 2008; Sullivan and Bal, 2013), the following characteristics of municipalities were included in the predictors: share of the population aged 15 and over with a tertiary-level qualification (including all lower, higher and doctorate-level tertiary degrees); unemployment rate (i.e. ratio of unemployed to employed of the same age (aged 18–74) within the labour force); and share of population speaking a foreign language (i.e. native language other than Finnish, Swedish, or Sami, which are Finland’s official languages). Of these variables, the latter describes populations with an ethnic minority background.
Analysis
Means and standard deviations were used to study the share of students in special education and variations in it across municipalities before and after the reforms. For the analyses, the study period (2008–2014) was divided into three phases, or pieces, based on the years of the two reforms (i.e. 2010 and 2011) (see Table 2). To investigate the effects of the funding reform and the Basic Education Act reform on the share of students in special education, we calculated the effect sizes (Cohen’s d; Cohen, 1988) by subtracting the first year of the phase from the last year of the phase and then dividing the remainder by the standard deviation of the last year of the phase. As suggested by Cohen, effect sizes of .20 are considered small, .50 medium and .80 large. In addition, we used latent growth curve modelling (LGM) (Bollen and Curran, 2006) to analyse the form and strength of the change in the share of students in special education, variations in these changes before and after the special education reforms across municipalities, and which municipal-level background factors predict these variations.
Model specifications for three-piece model. The first piece covers the period from 2008–2010, the second piece covers 2010–2011 and the third piece covers 2011–2014.
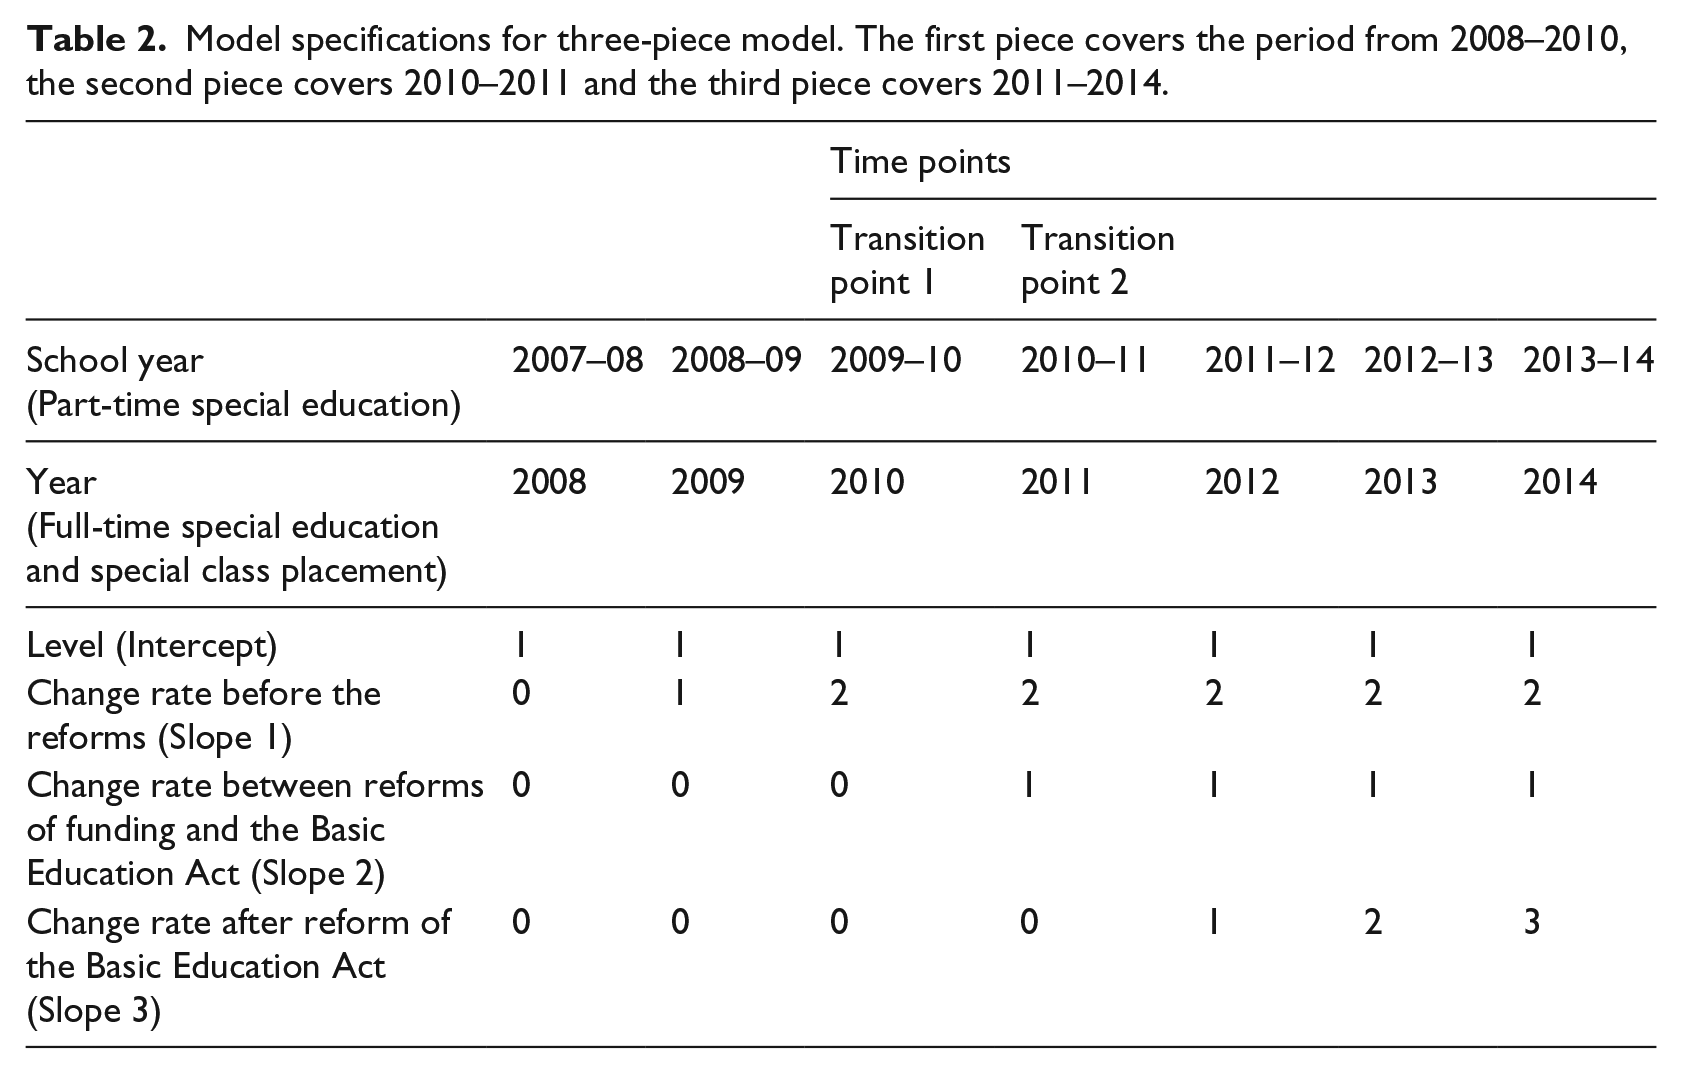
To find the LGM that best described the data, we first explored a linear specification of growth trajectories to analyse whether changes in the share of students in special education are linear. Since the results showed that the changes were not linear, we explored a non-linear specification of growth trajectories using piecewise linear growth modelling (PLGM) (Bollen and Curran, 2006; Flora, 2008). The same model was separately tested for part-time special education, full-time special education and special class placements. The models included seven time points. Based on how the statistics were compiled, the time points for full-time special education and special class placement were 2008–2014, while school years from 2007–2008 to 2013–2014 were used for part-time special education.
PLGM was used because additional linear slope factors make PLGM easier to interpret than polynomial growth models (Flora, 2008). In addition, PLGM facilitates incorporation of separate phases of the overall change process (Kohli and Harring, 2013) and analysis of differences in the relationship between slope factors and predictors (Diallo and Morin, 2015). We used a three-piece PLGM (Bollen and Curran, 2006; Flora, 2008) with a linear slope for each phase (i.e. piece) to examine whether the share of students in special education changed before the reforms, after funding reform until the Basic Education Act reform, and after the reforms (see Table 2).
Model goodness of fit was assessed using the comparative fit index (CFI), the Tucker–Lewis index (TLI), the root mean squared error of approximation (RMSEA) and the standardised root-mean-square residual (SRMR). According to Hu and Bentler (1999), goodness of fit between hypothesised model and observed data is indicated by CFI and TLI values greater than 0.95, SRMR values lower than 0.08 and RMSEA values lower than 0.06. Alternatively, Bollen and Curran’s (2006) recommended cutoff criteria are 0.90 for TLI and 0.10 for RMSEA. The chi-square test was also used to assess model fit, where a non-significant p-value indicates that the model fits the data adequately. Since we used population data, the fit indices were used only to acquire information about which model described the data best.
First, we explored unconditional models (i.e. covariates not included) separately for the three forms of special education. Second, we accounted for the variation across municipalities in initial level and rate of change in the share of students in special education by fitting multivariate linear regression models. These used time-invariant covariates in order to analyse how municipal-level background variables at the beginning of each phase predicted the variation in growth factors (i.e. level and rate of change) across municipalities (Curran et al., 2010). On that basis, the initial level (year 2008) and the first slope (2008–2010) were predicted by total enrolment for the year 2008 and other municipal factors for the year 2007. Total enrolment for the year 2010 and other municipal factors for the year 2009 were used to predict the second slope (2010–2011). The third slope (2011–2014) was predicted from total enrolment for the year 2011 and other municipal factors for the year 2010. P-values are not reported in the results because the study is based on population data. The analyses were performed using the Mplus statistical package (Version 7.4; Muthén and Muthén, 1998–2015). As the special education variables were somewhat skewed, maximum likelihood with robust standard errors was used as the method of estimation.
Table 3 presents fit indices for the unconditional and conditional models. Overall, the three-piece model fitted the data well for all three processes, although the chi-square test was statistically significant for unconditional models of part-time and full-time special education and for the conditional model of full-time special education, indicating poor model fit.
Growth model fit statistics for the estimated three-piece models.
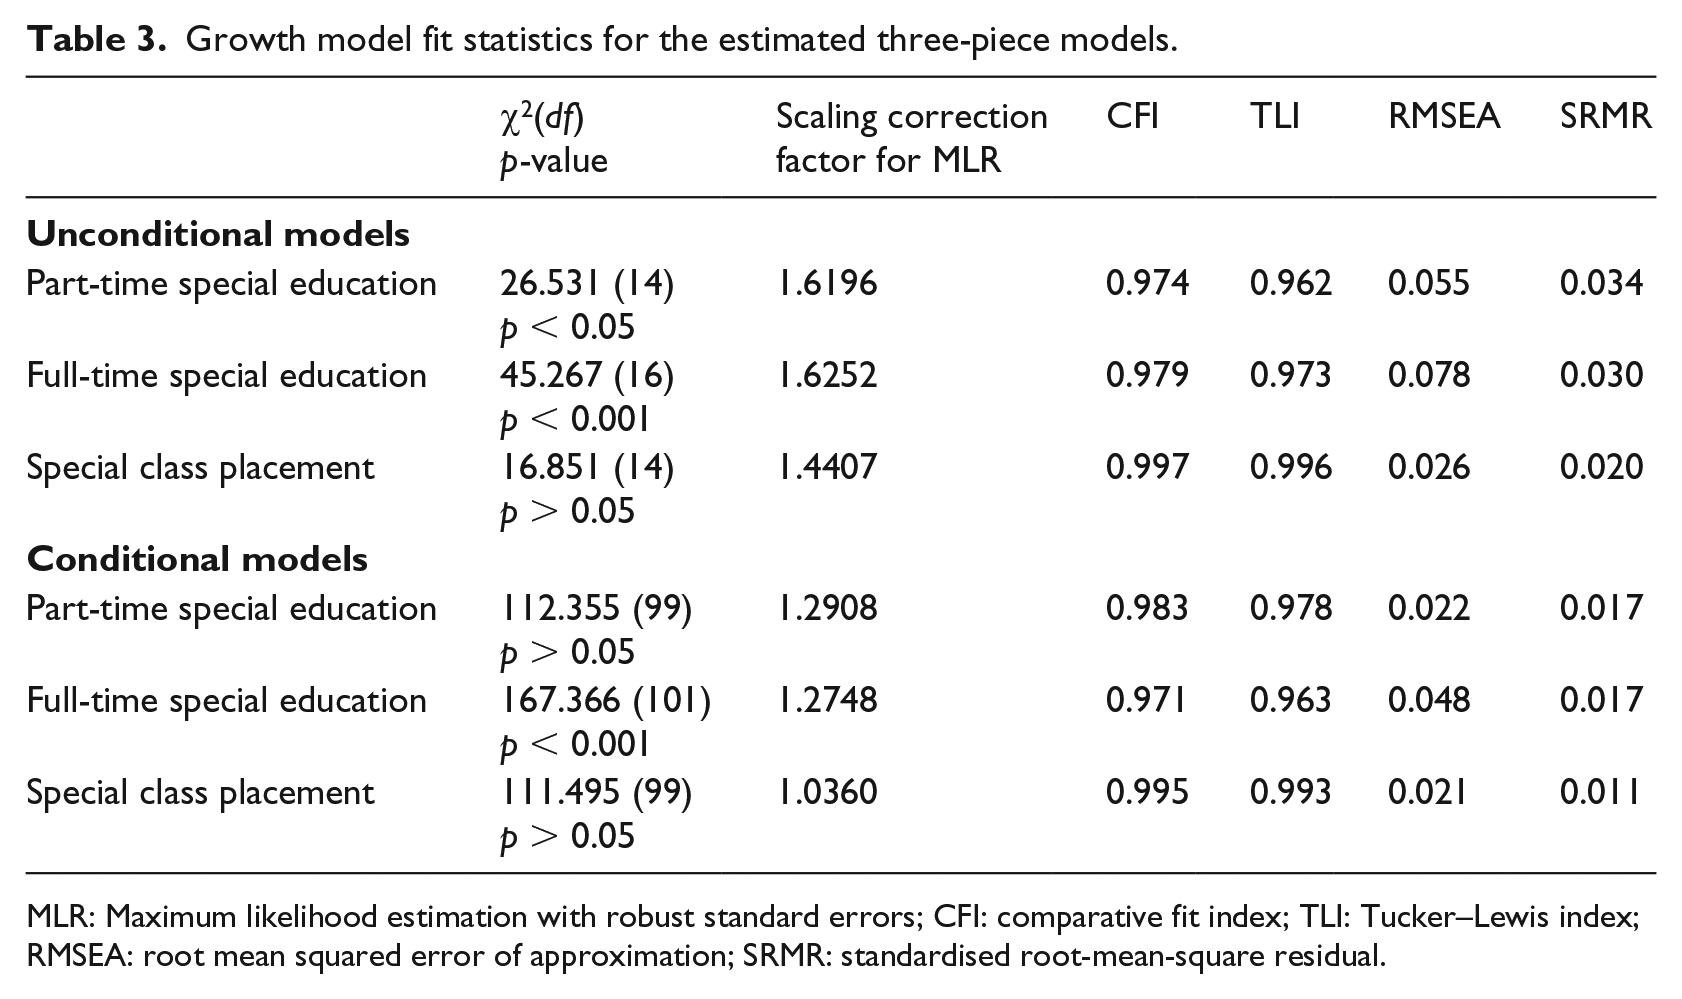
MLR: Maximum likelihood estimation with robust standard errors; CFI: comparative fit index; TLI: Tucker–Lewis index; RMSEA: root mean squared error of approximation; SRMR: standardised root-mean-square residual.
Results
Changes in special education between 2008 and 2014
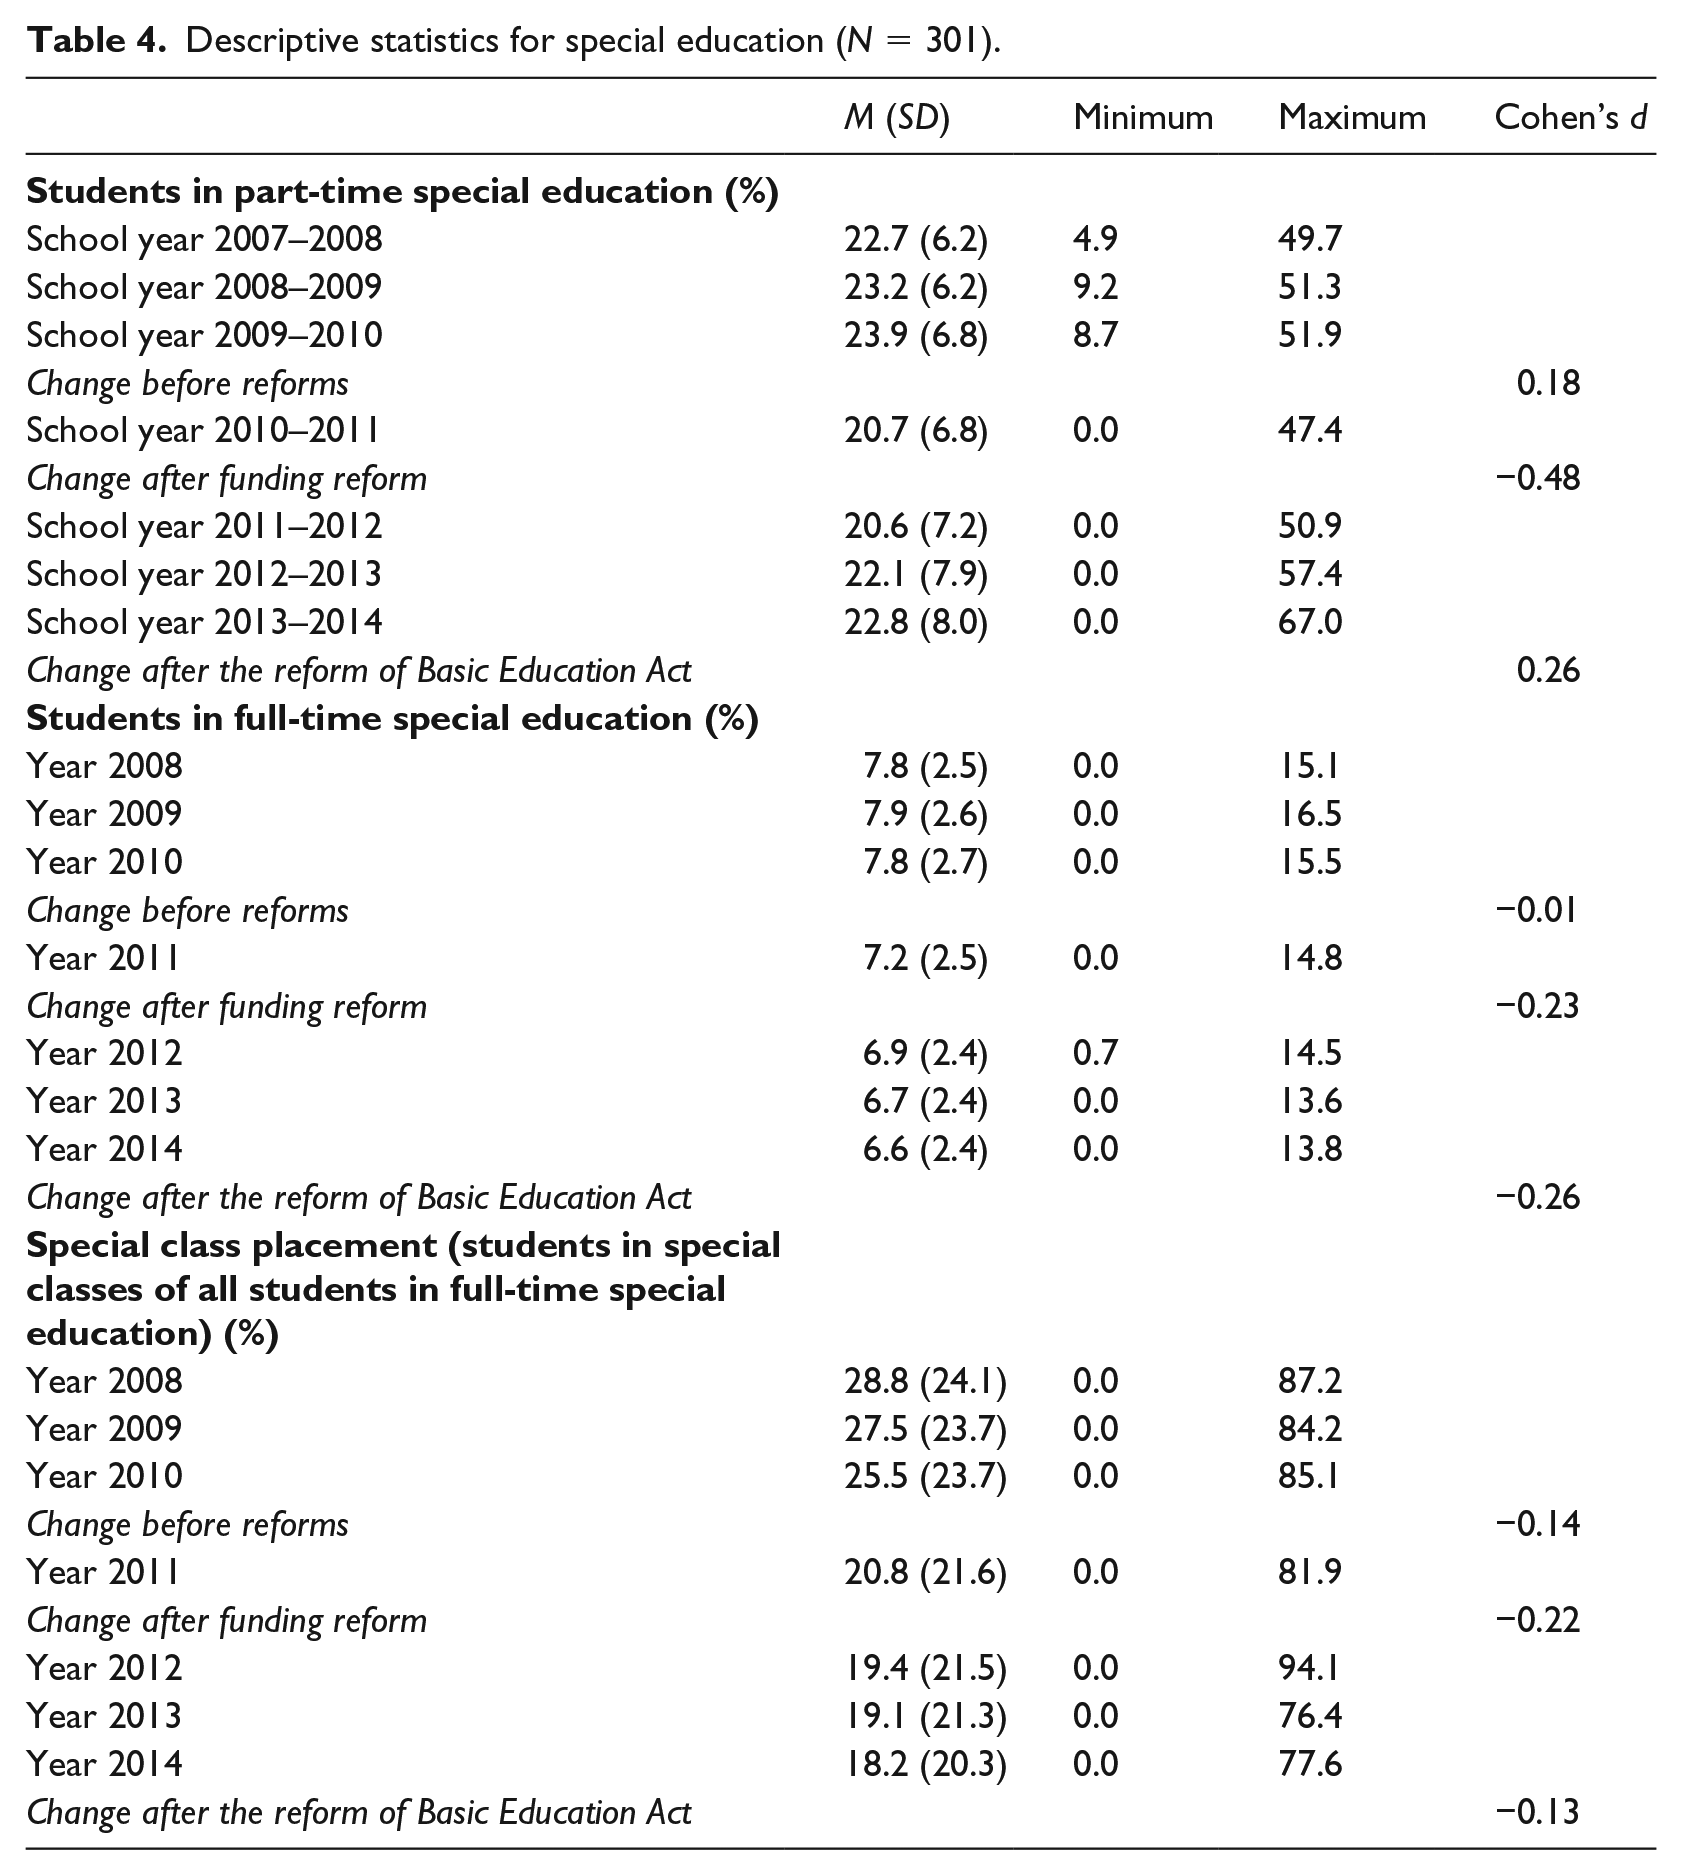
The results show that the reforms under study produced changes in the share of students in special education, but these changes varied in different forms of special education. Table 4 shows descriptive statistics for the three forms of special education, and Table 5 shows the results of the unconditional PLGMs. In the 2007–2008 school year, the average share of students in part-time special education was 22.7% (Table 4). In the three-piece model (Table 5), the factor mean of Slope 1 was 0.6, which means that this share increased by about 0.6% until the 2009–2010 school year, when the funding reform was introduced. The effect of change before the reforms was small (see Cohen’s d in Table 4). However, the figure decreased by 3.4% immediately after the funding reform. This effect was medium. Following the Basic Education Act reform, the share increased by an average of 0.7% between the 2010–2011 and 2013–2014 school years. The effect of this change was small.
Descriptive statistics for special education (N = 301).
Parameter estimates for the three-piece models (N = 301).
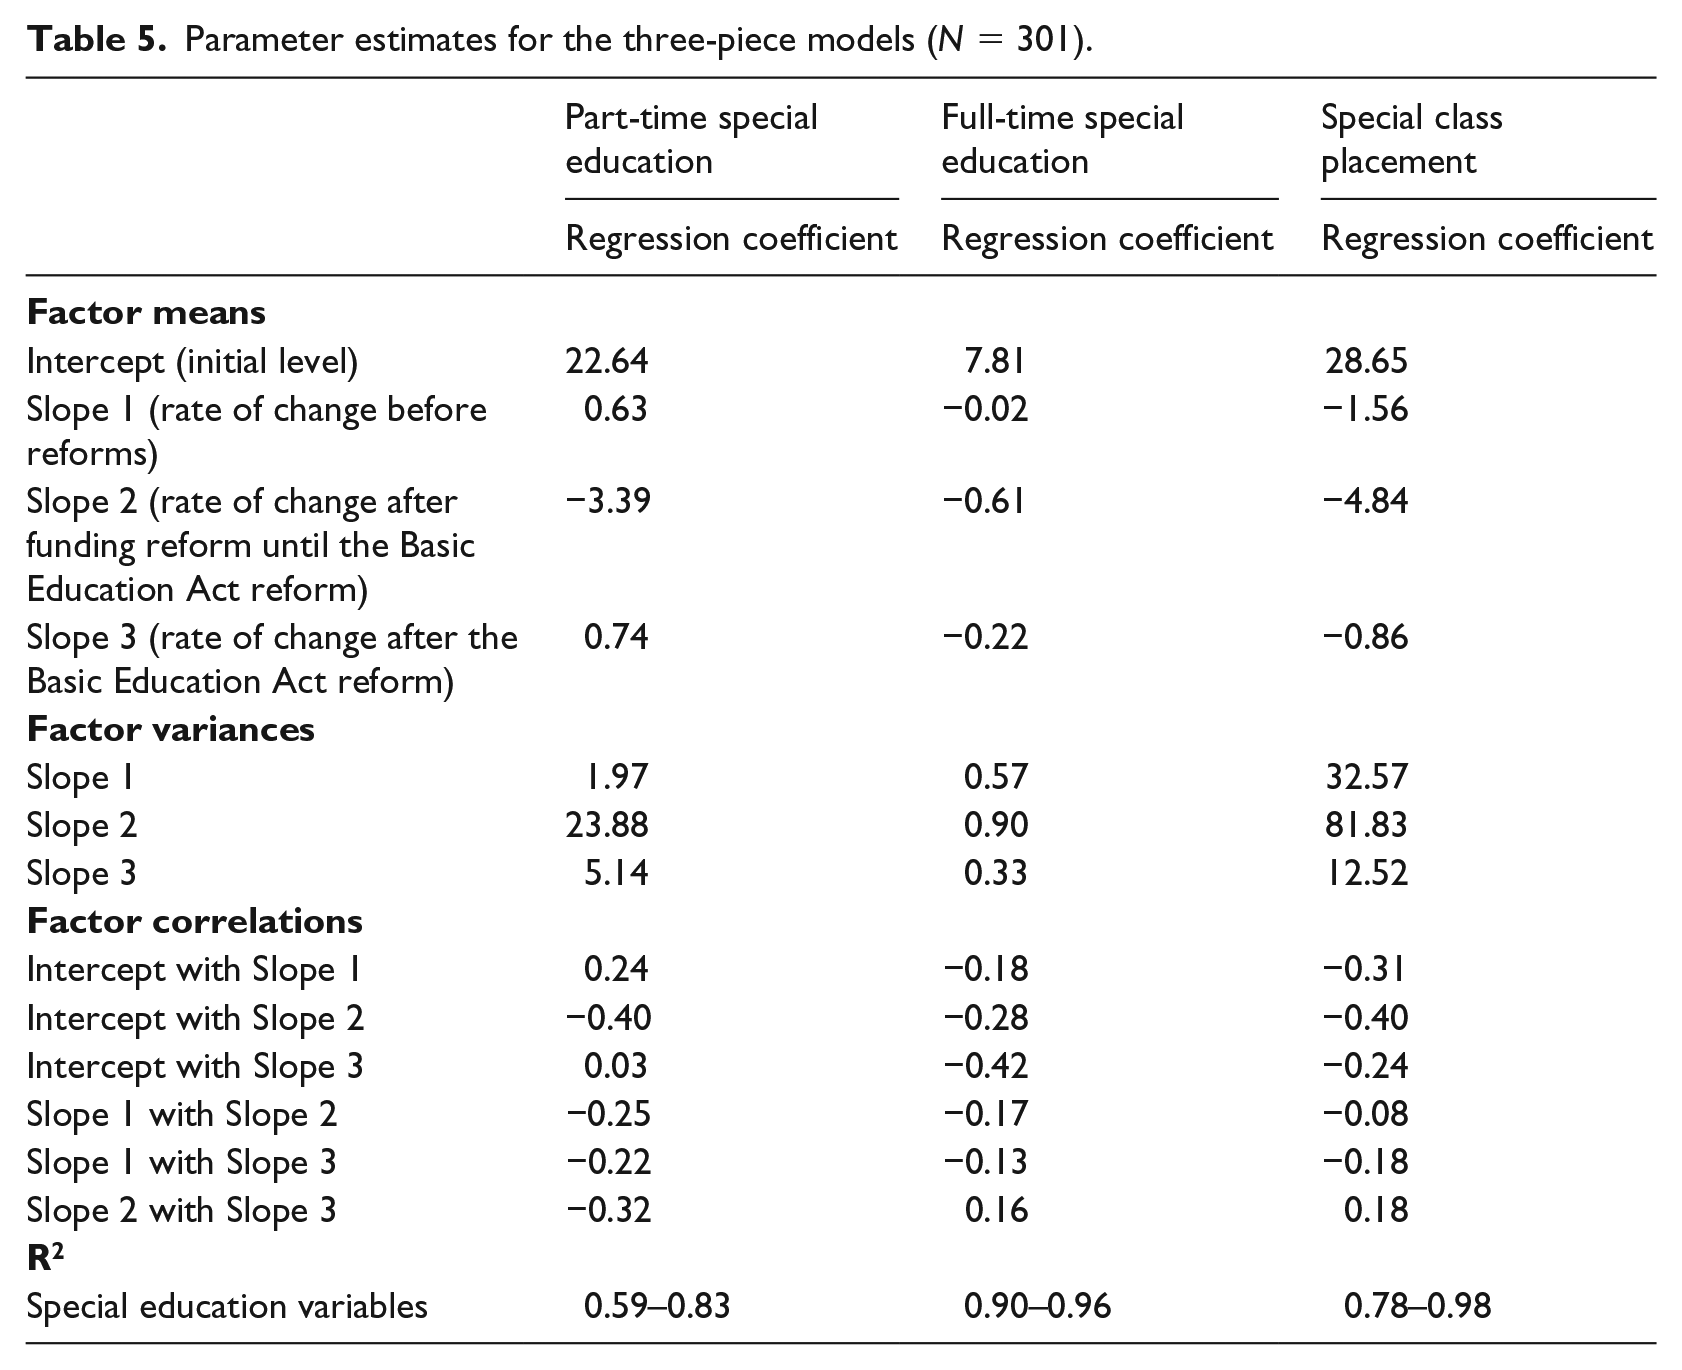
The results showed variation across municipalities in the share of students in part-time special education (see standard deviations in Table 4) and in the rates of change (see factor variances in Table 5). After the reforms, the variation increased slightly (Table 4). Variation in the rate of change across municipalities was greatest in all three forms of special education following the funding reform (Slope 2; see Table 5). For part-time special education, variation in the rate of change was greater after the Basic Education Act reform (Slope 3) than before the reforms (Slope 1).
The factor correlations in Table 5 show the relationship between the initial share of students in part-time special education and the rates of change. The initial level (intercept) determined most of the rate of change after the funding reform (Slope 2), whereas there was no correlation between the initial level and the rate of change after the Basic Education Act reform (Slope 3). The initial level was positively correlated with the rate of change before the reforms (Slope 1) but negatively correlated with the rate of change after the funding reform (Slope 2). This indicates that municipalities with a higher share of students in part-time special education in 2007–2008 showed a steeper growth in that share before the reforms and steeper decline immediately after the funding reform. In other words, the differences in the share of students in part-time special education across municipalities increased before the reforms and decreased after the funding reform.
Furthermore, the rates of change were correlated with each other, although quite weakly (Table 5). For part-time special education, all correlations were negative. Municipalities with faster growth in the share of students in part-time special education before the reforms (Slope 1) showed a steeper decline in that share after the funding reform (Slope 2). Moreover, municipalities showing a steeper decline after the funding reform (Slope 2) showed faster growth after the Basic Education Act reform (Slope 3).
Changes related to full-time special education seem to differ from the changes related to part-time special education. In 2008, the average share of students in full-time special education was 7.8% (Table 4). Before the reforms, there was no change. After the funding reform, the share decreased by 0.6%, and after the Basic Education Act reform, it decreased by an average of 0.2%. However, the effects of these changes were small (see Cohen’s d in Table 4).
The variation in full-time special education among municipalities was relatively stable (see standard deviations in Table 4). As the factor variances in Table 5 show, the variation in the rate of change was greatest after the funding reform (Slope 2) and greater before the reforms (Slope 1) than after the Basic Education Act reform (Slope 3).
Regarding the share of students in full-time special education, all correlations between the initial level and rates of change were negative, meaning that differences among the municipalities decreased in each of the three phases. The initial level had the strongest correlation with the rate of change after the Basic Education Act reform (Slope 3).
For full-time special education, the correlations between the rates of change were weaker than the correlations for part-time special education (Table 5). The initial level had the biggest impact on the rates of change in full-time special education during each phase, and there was only a weak relationship among the rates of change. The rate of change before the reforms (Slope 1) was negatively correlated with the rates of change after the reforms (Slopes 2 and 3). This means that municipalities with a steeper decline in the share of students in full-time special education before the reforms showed a slower decline in that share after the reforms. The correlation between Slopes 2 and 3 was positive: municipalities with a steeper decline after the funding reform also exhibited a steeper decline after the Basic Education Act reform.
Of all the students in full-time special education in 2008, the average share of students in special classes was 28.8%. However, it declined within the study period (Table 4). As Table 5 shows, before the reforms, the share decreased by an average of 1.6%. After the funding reform, it decreased by approximately 4.8%. The share of students in special classes also decreased after the Basic Education Act reform, but the decrease was smaller than after the funding reform, averaging 0.9%. Of all these changes, the effect of the change after the funding reform was greatest, although it was still small (see Cohen’s d in Table 4). As the standard deviations in Table 4 show, variation in the share of students in special classes decreased after the reforms. Variation in the rate of change was greater before the reforms (Slope 1) than after the Basic Education Act reform (Slope 3) (see factor variances in Table 5).
The factor correlations in Table 5 show that all correlations between the initial level and rates of change were negative. In other words, differences among the municipalities regarding the share of students in special classes decreased in each of the three phases. The greatest correlation was observed between the initial level and Slope 2, meaning that the initial level had the greatest impact on change after funding reform. The correlations between the rates of change were weaker than correlations between the initial level and slopes (Table 5). Municipalities with greater decline before the reforms (Slope 1) showed slower decline after the Basic Education Act reform (Slope 3). In addition, municipalities with a greater decline after the funding reform (Slope 2) showed a greater decline after the Basic Education Act reform (Slope 3).
Municipal-level background factors predicting variations across municipalities
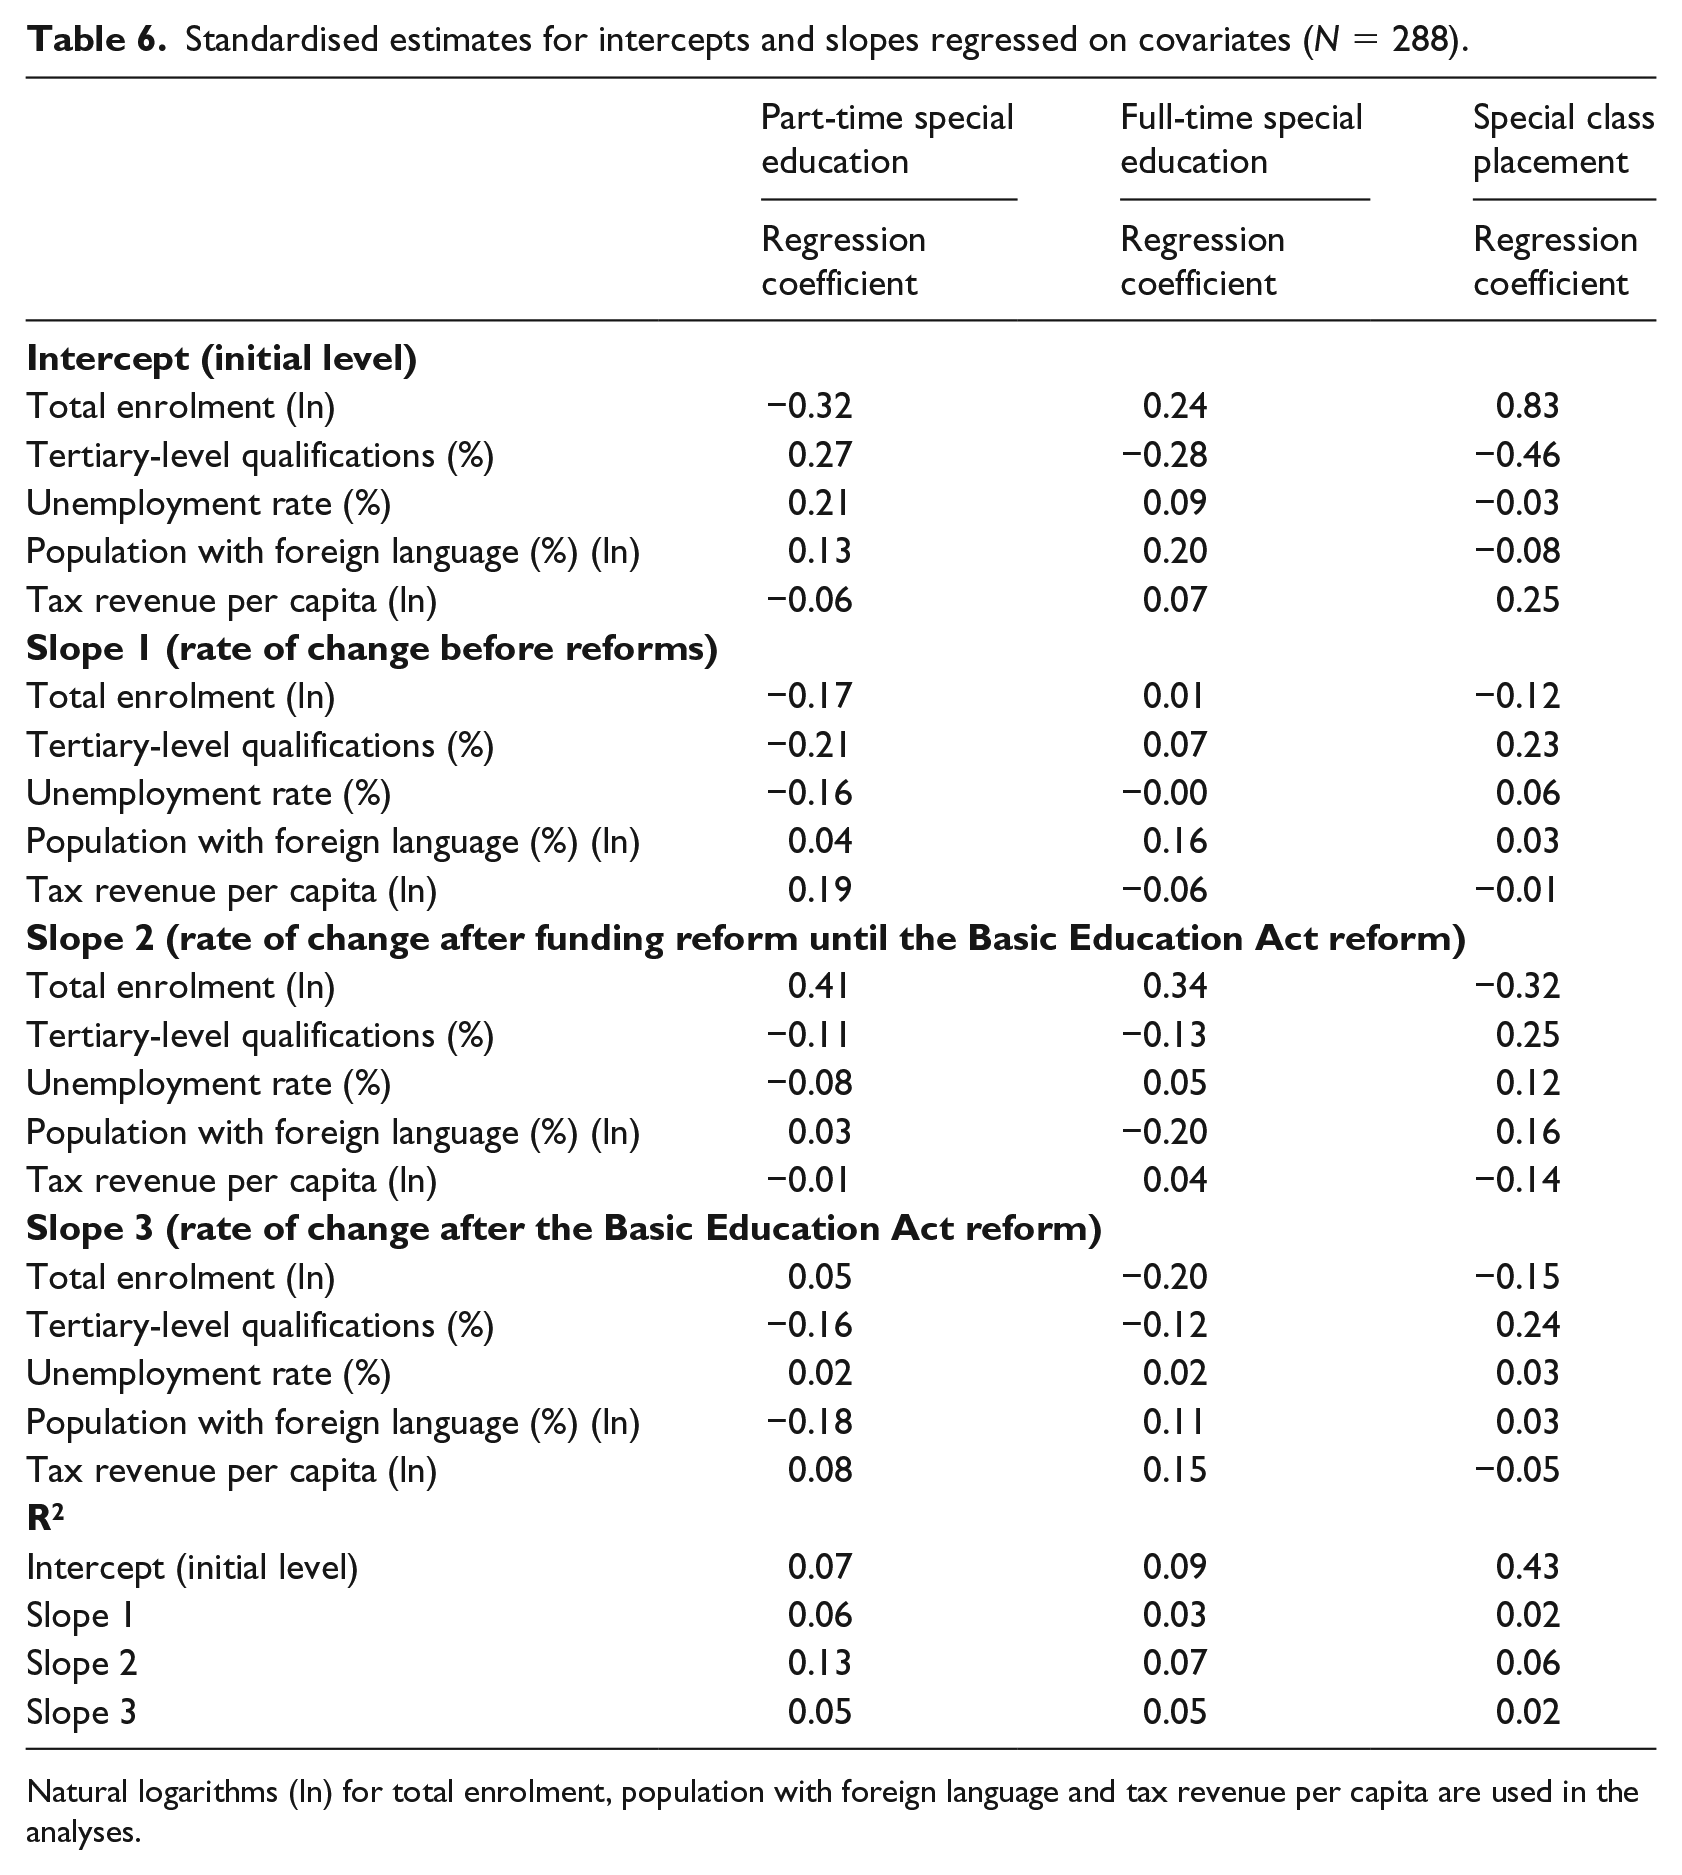
Table 6 shows the relationship between municipal-level background characteristics and the initial levels and rates of change in the share of students in all three forms of special education. According to the R2 values, these characteristics accounted for 43% of the variation across municipalities in the initial level of students in special classes and 13% of the variation in the share of students in part-time special education after the funding reform. For all other initial levels and rates of change, less than 10% of the variance across the municipalities was accounted for.
Standardised estimates for intercepts and slopes regressed on covariates (N = 288).
Natural logarithms (ln) for total enrolment, population with foreign language and tax revenue per capita are used in the analyses.
The strongest predictor of variance in the initial share of students in part-time special education across municipalities was total enrolment. Municipalities with higher total enrolment had a lower share of students in part-time special education (i.e. that share was higher in small municipalities). In addition, a higher share was related to both a higher share of population with tertiary-level qualifications and higher unemployment rate.
Variance between municipalities in the initial share of students in full-time special education and special classes was predicted by total enrolment and the share of the population with tertiary-level qualifications, but the relationship was in the opposite direction compared with the case of students in part-time special education (see Table 6); municipalities with a higher total enrolment had a higher share of students in full-time special education and special classes, and a higher share of the population with tertiary-level qualifications was associated with a lower share of students in full-time special education and special classes. Moreover, municipalities in which a higher share of the population speaks a foreign language had a higher share of students in full-time special education, and municipalities with higher tax revenue per capita had a higher share of students in special classes.
All associations with the rate of change before reforms (Slope 1) were quite small (see Table 6). The strongest predictor of the rate of change in part-time special education and special class placement before the reforms was the share of the population with tertiary-level qualifications. Municipalities in which a higher share of the population has tertiary-level qualifications showed a slower increase in the share of students in part-time special education and a slower decline in the share of students in special classes. Tax revenue per capita also predicted changes in the share of students in part-time special education; the increase was faster in municipalities with higher tax revenue per capita.
The rate of change after the funding reform (Slope 2) was best predicted by total enrolment, but the direction of the relationship varied for different forms of special education. Decline in the share of students in part-time and full-time special education was slower in municipalities with higher total enrolment (i.e. in larger municipalities). In contrast, municipalities with higher total enrolment showed faster decline in the share of students in special classes. The decline was, however, slower in municipalities in which a higher share of the population has tertiary-level qualifications. The share of the population who speaks a foreign language negatively predicted the share of students in full-time special education; the share decreased faster in municipalities in which a higher share of the population speaks a foreign language.
Associations with the rate of change after the Basic Education Act reform (Slope 3) were quite weak (Table 6). The share of the population with tertiary-level qualifications was the strongest predictor of changes in the share of students in special classes; the decline was slower in municipalities in which a higher share of the population has tertiary-level qualifications. In addition, total enrolment was the strongest predictor of changes in the share of students in full-time special education; the decline was faster in municipalities with higher total enrolment. In municipalities in which a higher share of the population speaks a foreign language and has tertiary-level qualifications, the increase in the share of students in part-time special education was slightly slower.
Discussion
Recent international reforms of special education have usually sought to reduce identification rates for students in special education and to promote inclusive education. These kinds of reforms were also introduced in Finland at the beginning of the 2010s. Using official statistics, we examined how reforms of funding and the Basic Education Act in Finland have affected the share of students in part-time and full-time special education, as well as in special classes. The results show that both reforms have changed the share of students in special education. These changes, however, differ across forms of provision and seem greater following funding reform than after reform of the Basic Education Act.
Non-census funding systems are related to increases in the provision of special education, whereas census-based systems do not offer a fiscal incentive to identify students as having SEN (e.g. Harr et al., 2012; Dhuey and Lipscomb, 2013). The special education funding reform introduced in Finland in 2010 changed the funding system from non-census-based to mainly census-based. Our study showed that this reform influenced special education by incentivising municipalities to reduce the share of students in full-time special education, where extra funding was discontinued after the reform. However, the share of students in part-time special education and special classes also decreased after the funding reform, even though neither the old nor the new funding system explicitly took these students into account. This corroborates the work of Dhuey and Lipscomb (2013) and Mahitivanichcha and Parrish (2005), which argues that census-based funding can incentivise reductions in service and less costly placements. Under the previous funding system, the extra money for students in full-time special education would probably have enabled municipalities to provide more resources for part-time special education and special classes.
Following the reform of the Basic Education Act, the share of students in full-time special education and in special classes decreased, while the share of students in part-time special education increased. This reform aimed to shift support from full-time special education to early support such as part-time special education. Thus, our results suggest that this goal was achieved. However, the reduced provision of full-time special education and special class placements might also owe partly to the influence of funding reform. Changes in full-time special education, which requires an administrative decision, are probably slower to implement than those in part-time special education, which is a more flexible form of support. In addition, the slight decline in special class placements had already started prior to the reforms, indicating that some principles of inclusive education had already influenced Finnish education policy (see e.g. Graham and Jahnukainen, 2011).
This study showed variation in the share of students in special education and the rates of change across municipalities. Earlier studies (e.g. Iversen, 2013; Kirjavainen et al., 2014a; Lintuvuori et al., 2017; Thuneberg et al., 2014) identified differences between municipalities in arrangements for special education and in implementation of special education system reforms. In addition, Pulkkinen and Jahnukainen (2016) noted that local authorities seem keen to retain existing special education structures, which affects how reform is implemented. The present results support these findings, as changes in special education provision were determined by initial levels of provision.
Municipalities seem to differ in how they respond to policy incentives. In this regard, our results reflect the views of Mahitivanichcha and Parrish (2005), who stated that the relationship between fiscal incentives and special education practices is influenced by multiple contextual factors, including regions’ political traditions, policies regarding special education and the availability of services. For example, some municipalities may favour segregated placements instead of inclusive practices. The data used in this study do not include information on region-specific political traditions and policies. However, the relationship between the initial levels of provision and the changes in special education indicates that the availability of services influences fiscal incentives.
This study also examined whether the initial level of different forms of special education and the rates of change could be predicted by municipal-level factors related to both demand and supply. The results showed that the best predictor of the initial level and rate of change was total enrolment: full-time special education and special class placements were more common in large municipalities, and part-time special education was more common in small municipalities. These results are consistent with the literature, which shows that segregated placement is more common in urban and densely populated areas (e.g. Mahitivanichcha and Parrish, 2005; Meijer and de Jager, 2001). Part-time special education, instead, is favoured in small municipalities as it is easier and less expensive to arrange than class-based special education due to the small number of students (Jauhiainen and Kivirauma, 1997). In addition, our results indicated that after the funding reform, the share of students in part-time special education and full-time special education declined more slowly in large municipalities than in small ones. These results seem to be consistent with previous studies, which showed that responses to fiscal incentives are greater in small districts (Cullen, 2003; Kwak, 2010; see also Mahitivanichcha and Parrish, 2005).
The results also agree with those achieved by Kirjavainen et al. (2014a). The current study shows that the financial situation of the municipality has some influence on special education provisions; the better the financial situation, the more common special class placement was and the faster the provision of part-time special education increased before the reforms. In addition, variation in special education provision was slightly related to the socioeconomic characteristics of municipalities. This supports the observations of Baker and Ramsey (2010), who highlighted that the rate of students with disabilities can vary across regions and suggested that the funding system should take into account variations in demand in order to guarantee the equity and quality of special education.
The strength of our study is its use of population data. In addition, we have used piecewise linear latent growth curve modelling, which enabled us to clearly demonstrate how the rate and direction of changes in special education provision varied from phase to phase and across municipalities. Although the use of this method has increased in psychological studies in recent years, it is rather rarely used in studies concerning education policy reforms. Thus, the present study provides an example of how piecewise linear latent growth curve modelling could be applied in policy reform studies.
Nevertheless, the study also has some limitations. First, it is important to note that the funding reform and Basic Education Act reform partly overlapped and may have had a combined effect on special education provision. Therefore, the findings concerning the effects of a single reform must be interpreted with caution.
Second, the models used in this study explained a relatively small proportion of the variation across municipalities. Accordingly, variation in special education and its changes across municipalities were influenced by factors other than those examined in our study. For instance, Mahitivanichcha and Parrish (2005) noted that the relationship between fiscal incentives and special education practices is influenced by contextual and political factors. In addition, municipalities may have their own funding systems for allocating money to special education (e.g. Fletcher-Campbell et al., 2003). Thus, further studies could focus on municipalities’ various policies to arrange special education as well as funding systems and their influence on special education practices.
Third, the results regarding inclusive education describe only the placement of students with SEN. Although the decline in special class placement shows that the education system in Finland is becoming more inclusive, it is impossible to use the results to conclude how the essential objectives of inclusive education – full participation and community (Thomas, 2013) – have been achieved in Finnish schools. Further research on inclusive education from this perspective would be worthwhile. Studies could also profile municipalities based on the share of students in special education and study the predictors of these groups of municipalities. In addition, it would be interesting to study whether municipalities could be grouped based on their change trajectories.
Taken together, the changes in the share of students in special education seem in part to parallel the aims of the latest special education reforms. However, the fiscal incentives of funding reform are not as consistent as they might be with the aims of the reformed Basic Education Act (see Mahitivanichcha and Parrish, 2005). For example, part-time special education was reduced as a result of funding reform. Following the Basic Education Act reform, it was increased again, indicating that this form of provision plays an essential role in the Finnish special education support system. However, the new funding system does not directly promote the use of part-time special education, and municipalities vary in terms of how it is used. This may be due to municipalities’ differing financial situations, as a transition to a census-based funding system increases municipalities’ share of special education funding (Dhuey and Lipscomb, 2011). If the education reforms aim to improve the support services that students receive and to reduce regional differences in special education services, funding reforms should align with these aims and government funding should ensure that it is possible to arrange sufficient support services within all municipalities.
Footnotes
Acknowledgements
We thank Professor Asko Tolvanen for assistance with methodology.
Declaration of conflicting interest
The author(s) declared no potential conflicts of interest with respect to the research, authorship, and/or publication of this article.
Funding
The author(s) disclosed receipt of the following financial support for the research, authorship, and/or publication of this article: This work was supported by the Finnish Ministry of Education and Culture.