
Abstract
IEA’s International Computer and Information Literacy Study (ICILS) 2013 showed that in the majority of the participating countries, 14-year-old girls outperformed boys in computer and information literacy (CIL): results that seem to contrast with the common view of boys having better computer skills. This study used the ICILS data to explore whether the achievement test used in this study addressed specific dimensions of CIL and, if so, whether the performances of girls and boys on these subscales differ. We investigated the hypothesis that gender differences in performance on computer literacy items would be slightly in favour of boys, whereas gender differences in performance on information literacy items would be slightly in favour of girls. Furthermore, it was examined whether such differences varied across European countries and if item bias was present. Data was analysed using a confirmative factor analysis model, i.e. a multidimensional item response theory model, for the identification of the subscales, the explorations of gender and national differences, and possible item bias. To a large extent the results support our postulated hypothesis and shed new light on the commonly assumed disadvantaged position of girls and women in modern information society.
Keywords
Introduction
In the 1980s and 1990s, the low participation of girls and women in computer science courses and computer-related professions, as well as the implementation of educational computer use in primary and secondary education, resulted in many studies exploring the differences between girls and boys in computer access, use, abilities and attitudes (Cooper, 2006; Meelissen, 2008; Volman and Van Eck, 2001). The research in this area mainly focused on the perceived gender gap in computer attitudes such as liking computers, perceived usefulness of computers, self-confidence in computer use and anxiety in using computers.
Several theories attempted to explain the disadvantages of girls in computer attitudes and competencies. For instance, the ‘socialization theory’ is based on the assumption that girls and boys are taught by their environment (parents, peers, media and school) to value computers differently. Computers are assumed to be unattractive to females because of computers’ ‘male image’ caused by a past association with mathematics, science and technology (e.g. Charlton, 1999). As a result of the perceived masculinity of computers, boys feel more encouraged to explore various uses of computers, thereby increasing their knowledge and confidence (Ertl and Helling, 2011). Research has shown, for example, that girls’ computer use is often limited to schoolwork while boys tend to also use computers much more for leisure activities (BECTA, 2008).
The ‘attribution theory’ was used to describe another effect of the perceived masculinity of computers (Volman, 1997). While working with computers, girls tend to blame themselves for mistakes and attribute success to external causes, such as the simplicity of the task or luck (the ‘outsider repertoire’). Boys tend to find external causes in the case of failure and boast about their successes in using computers (the ‘expert repertoire’). This gender-specific behaviour could also explain gender differences often found in self-efficacy; that is, students’ own assessment of their success in performing computer-related tasks. Girls feel less confident about their computer competencies and tend to underestimate their abilities, while boys tend to overestimate their achievements (Meelissen, 2008).
According to some scholars, teachers also had a role in this confidence gap (e.g. Janssen Reinen and Plomp, 1993; Volman and Van Eck, 2001). There were not enough computer-literate female teachers who could function as role models for girls, and it was assumed that teachers were not aware of their sometimes gender-biased instruction. For example, Volman (1994) observed how secondary school teachers in the Netherlands were often inclined to help girls by demonstrating how to perform the computer tasks. Boys, on the other hand, were often encouraged to find out for themselves and, as result, became more confident in their abilities.
Most studies from the 1980s and 1990s confirmed the gender gap in attitudes and (perceived) competencies, especially among secondary school students (Cooper, 2006; Volman and Van Eck, 2001). For example, in 1992, the Computers in Education (COMPED) study showed that, in most participating countries, boys outperformed girls in functional knowledge and skills in information technology, in primary, lower secondary and upper secondary schools (Janssen Reinen and Plomp, 1993).
However, when new uses of computers, such as the internet, became available, the gender gap seemed to lessen, although this gap lessened least for females’ participation in computer science courses and computer-related professions (Lau and Yuen, 2015). Based on a review of studies between 1995 and 2007, Meelissen (2008) concluded that the disadvantage of girls in terms of computer attitudes had become less self-evident. Not all studies showed significant gender differences in attitudes. Where differences were found, girls often did not show negative attitudes, but showed (slightly) less positive attitudes towards computers. However, the results were inconclusive because the diversity of the scales used to measure attitudes made the comparison of research results difficult. The new opportunities that ICT had to offer made it more complex to define ‘computer use’ and to measure computer attitudes and computer competencies. Furthermore, very few studies in that period focused on measuring actual computer competencies of students in relation to gender and the few studies that were conducted showed no gender differences (Hargittai and Shafer, 2006; Kuhlemeier and Hemker, 2007; Meelissen, 2008).
In today’s society, in which the internet and the social use of smartphones and tablets are part of students’ everyday life, it has become even more doubtful if computers are still perceived as a ‘male domain’ and if girls are still less confident and less experienced in using ICT (Tømte, 2011; Wong and Cheung, 2012). Furthermore, information literacy has become a very important part of computer competencies. Searching, evaluating and processing information is closely connected with reading literacy skills (Fraillon et al., 2014). The international large-scale assessment studies PISA (Programme for International Student Assessment) and PIRLS (Progress in International Reading and Literacy Study) showed that in almost every part of the world, girls outperform boys in reading literacy (Mullis et al., 2012; OECD, 2010). In PISA 2009, for example, 15-year-old girls outperformed boys in every participating country by roughly the equivalent of an average school year’s progress (OECD, 2010).
Some recent studies have confirmed that the disadvantage of girls in computer attitudes and computer competencies is disappearing. Some research results even indicate that females now have more positive computer attitudes than males. For example, a recent study in the US measuring computer attitudes among eighth grade students found that girls were more positive about computers than boys were (Hohlfeld et al., 2013). In this study, the same four-item ‘Attitude Towards Computers’ self-report scale was used as in PISA 2009. In PISA 2009, however, the computer attitude of 15-year-old boys was, according to this scale, still more positive than that of girls in all European countries participating in PISA except Spain (OECD, 2011). In the study of Hohlfeld et al. (2013) girls also rated their ICT skills higher than boys. A study among Taiwanese grade 8 students showed no gender differences in students’ self-efficacy in using the internet, but girls were more positive about their self-efficacy in online communication than boys were (Tsai and Tsai, 2010). The gender differences found in their study were related to the type of ICT use: boys were more exploration-oriented internet users and girls more communication-oriented internet users.
Studies reporting an advantage of girls are not limited to computer attitudes or self-efficacy in computer use. Nowadays, as technologically more advanced testing is possible, more studies use performance-based digital tests consisting of test items in a genuine, virtual test environment, which also results in a shift from testing ‘knowing of’ to ‘showing how’. The first international large-scale assessment study using a performance-based digital test was IEA’s International Computer and Information Literacy Study (ICILS) 2013 (Fraillon et al., 2014). Computer and information literacy is defined as: ‘an individual’s ability to use computers to investigate, create, and communicate in order to participate effectively at home, at school, in the workplace, and in society’ (Fraillon et al., 2013: 17). It turned out that in most of the 21 countries or regions, 14-year-old girls significantly outperformed boys in ICILS 2013. In line with the ICILS results, Flemish sixth grade girls also outperformed their male classmates in a computer-based assessment in both technical ICT skills, such as retrieving a file from a specific location or opening an attachment, and so-called higher-order ICT competencies, such as delivering information in an email (Aesaert and Van Braak, 2015).
However, the conclusion that the traditional gender gap in computing has reversed may be premature, as some studies still report no gender differences or show differences that are still in favour of boys. In contrast to the studies mentioned above, no gender differences in digital competencies (that is, digital judgements, acquiring and processing digital information, and producing digital information), were found in a Norwegian study among upper secondary students (Hatlevik and Christophersen, 2013). Secondary school girls and boys in the Netherlands of various age groups also showed the same level of ability in their information and strategic internet skills (Van Deursen and Van Diepen, 2013). Gui and Argentin (2011) assessed Italian secondary students’ digital literacy by developing an assessment covering the following three areas: (1) theoretical skills, including answering knowledge-based questions; (2) operational skills, the ability to use computer applications and navigate efficiently; and (3) evaluation skills, the skills in information evaluation practices. The test in this study showed no differences between girls’ and boys’ performance in operational and evaluation skills. However, girls were outperformed by boys in theoretical skills. Gui and Argentin (2011) concluded that female students are as skilled as male students in common online activities, but might experience difficulty when confronted with unexpected technical problems or outcomes.
Evidence that the gender gap has not fully counterbalanced can also be found within the ICILS results themselves. In ICILS 2013 no gender differences were found for basic ICT self-efficacy, but the scores of boys on the advanced ICT self-efficacy scale were higher than the girls’ scores in the participating countries (Fraillon et al., 2014). These outcomes are in contrast to the results of the actual assessment in CIL, which was in favour of girls. The differences between the results of the advanced ICT self-efficacy scale and the CIL assessment may be explained by the attribution theory mentioned earlier. In the case of advanced computer skills, girls may still tend to underestimate their abilities while boys may tend to overestimate their abilities. It also suggests that using a self-efficacy scale to measure students’ computer competencies may give a misleading indication of students’ real abilities in computing (Aesaert and Van Braak, 2015).
In summary, recent studies suggest that there is no longer a digital divide in favour of boys. With regard to computer use, boys and girls may have different interests, but that does not necessarily mean that these differences result in advantages or disadvantages for either girls or boys. With regard to computer attitudes, there seems to be more and more evidence that the gender gap is closing. However, with regard to self-efficacy in ICT use and ICT competencies, the results remain mixed.
One of the reasons for these mixed results may be the use of self-reported self-efficacy scales and assessments in such studies. The concept of ‘computer’ has become much more complicated due to the many different uses of and devices for ICT, compared to the 1980s when gender differences concerning computers were first researched. As a consequence, studies in this area come with a great variety of ways to name, define and measure computer competencies (Ilomäki et al., 2016). This makes it difficult to compare studies and to draw general conclusions about the role of gender in (perceived) computer competencies, especially conclusions across countries. Furthermore, there is often limited information available about the validity of the instruments, such as the possible gender bias in the test items. For example, some test items may function differently for girls and boys, which complicates the comparisons of results between genders.
If measurement issues are handled properly and there is no sign of differential item functioning, international comparative research can reveal systematic differences in computer and information literacy and provide valuable pointers to look where these differences originate from. The differences might be explained by cultural, economic and/or educational differences, potentially resulting in different experiences of students with ICT and therefore varying levels of competencies. Signalling these cross-country differences serves as an important step for the evaluation of educational systems.
This study focuses on the relation between gender and computer competencies. As a result of its scale, its extensive conceptualization of computer competencies and the opportunity to model across countries, the assessment data of ICILS 2013 was used for our explorations. Although the CIL test was initially based on two dimensions (strands): (a) collecting and managing information; and (b) producing and exchanging information, the results were only reported on a single, unidimensional scale (Fraillon et al., 2014). The results showed a high correlation between the observed scores on these two dimensions. Furthermore, the mean achievement of students across countries varied little when data from both dimensions were analysed separately.
In this study we propose an alternative classification of the ICILS test items based on a content review by experts. Next, we will compare the performances of girls and boys in European countries on these three new dimensions. The dimensions will be entered as three latent factors in a confirmatory factor analysis (see, for example, Muthén and Muthén, 1998–2012), or, completely analogously, as three latent variables in a multidimensional IRT model (MIRT model; see, for instance, Reckase, 2009).
In line with the study of Gui and Argentin (2011) we assume that the gender gap differs for different dimensions of CIL. As girls outperformed boys in the overall CIL achievement in ICILS 2013, we are specifically interested to see in which dimensions the gender differences are most prominent. It is hypothesized that boys will have a disadvantage in items referring to competencies such as evaluating and sharing information, but an advantage in items measuring technical skills.
As a last step, item bias, i.e. differential item functioning by culture and gender, is investigated to further evaluate the validity of the IRT model.
The four research questions are:
Is a three-dimensional representation of computer and information literacy appropriate for the ICILS data, i.e. to what extent does the data fit a three-dimensional IRT measurement model in terms of model fit, correlation structure and item loadings?
In which dimensions of computer and information literacy are gender differences most prominent?
To what extent are these differences consistent across European countries participating in ICILS 2013?
To what extent is the validity of the multidimensional IRT measurement model threatened by gender-related item bias and cultural item bias?
Methodology
Dataset and item classification
By assessing 14-year old students from a representative sample in 21 countries, ICILS 2013 provides representative data within and across countries (Fraillon et al., 2014). Between 138 and 318 schools were randomly selected in each country. Twenty students were then randomly selected from all students in the target grade (usually grade 8) in each sampled school.
Four computer-based modules were developed in ICILS. Each 30-minute module had a theme (for example, organizing a school trip) and consisted of a number of small discrete tasks or questions followed by a large final task. The modules comprised 62 tasks and questions. Some allowed for dichotomous scoring (0 score points for no credit, 1 for full credit); others allowed for partial credit scoring (0 score points for no credit, 1 for partial credit, 2 for full credit). The combined test modules comprised 81 score points. The items were administered according to a balanced module rotation, meaning each student completed two modules randomly allocated from the set of four computer-based modules.
In each country the responses were coded by trained scorers. To assess the reliability of scoring, 20 per cent of the responses were scored independently by two scores. Items with too low reliability (i.e. below 75 per cent) were left out of further analyses.
This study explores the data from all European countries in ICILS 2013 with a response rate above 80 per cent at school level. This high level of response of the representative sample ensures representative findings for the population of 14-year-olds in regular education. The average achievement test scores and the extent of gender differences of the countries are presented in Table 1.
Achievement test scores for the selected countries in this study.
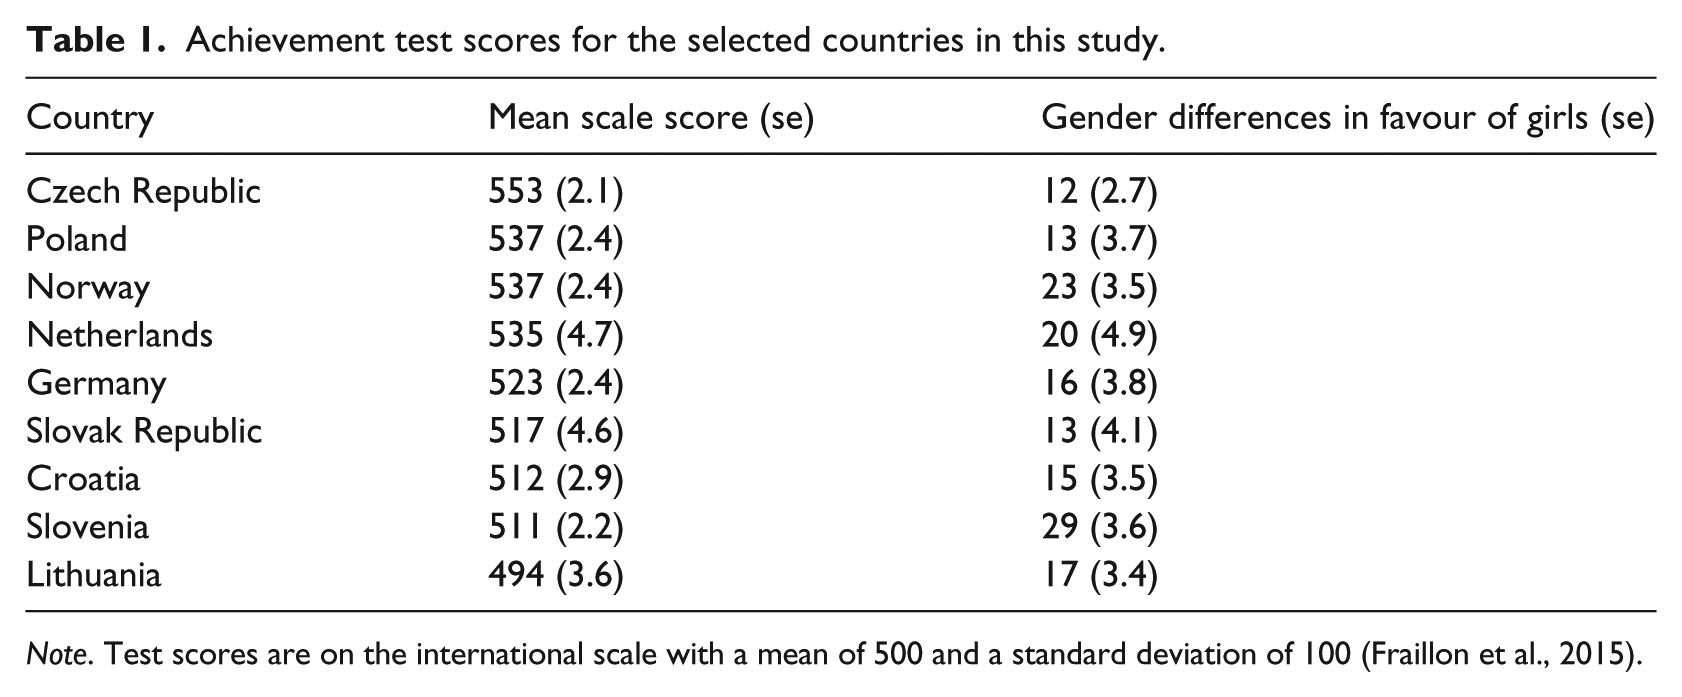
Note. Test scores are on the international scale with a mean of 500 and a standard deviation of 100 (Fraillon et al., 2015).
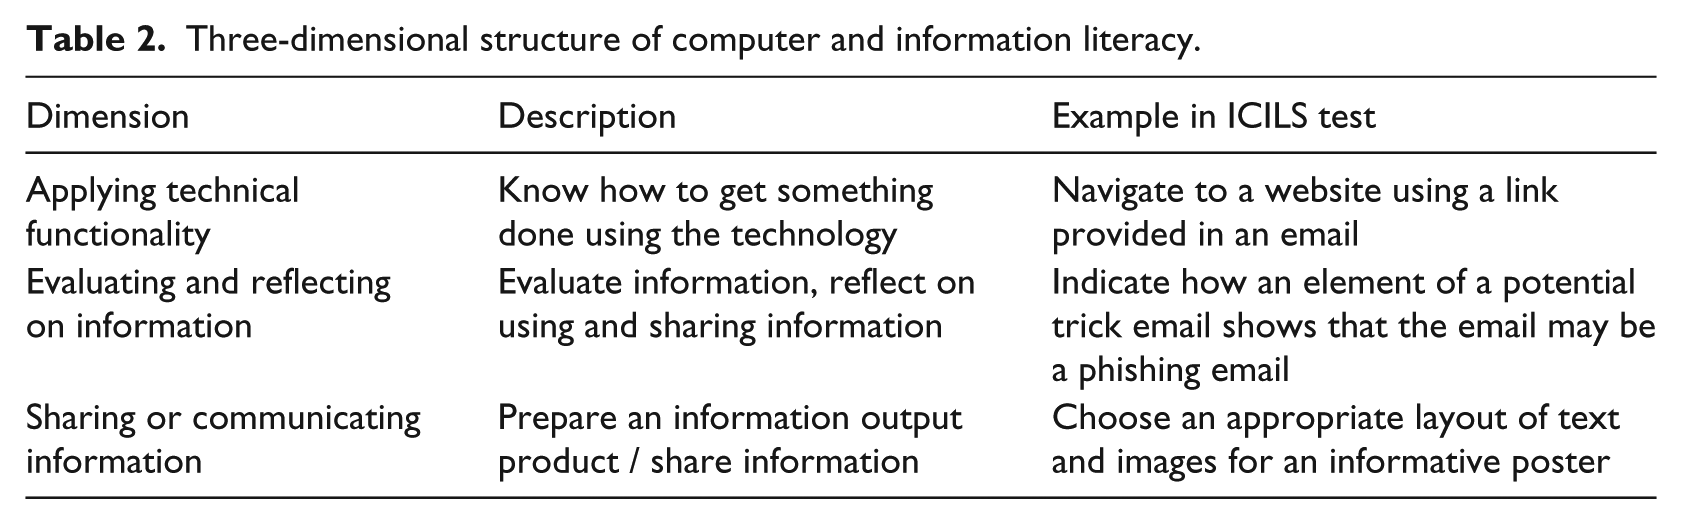
Only items with satisfying scaling properties for all European countries according to the study’s technical report (Fraillon et al., 2015) were considered, resulting in a dataset of 45 items and a sample size of 25,133 students. Although, based on literature, it was expected to find dimensions strongly related to the computer literacy and information literacy, there were no dimensions specified beforehand. A content review of the items by two experts resulted in several proposed categorizations of the items into multiple dimensions. Based on the experts’ further consultation, the three-dimensional categorization was considered most suitable. The experts then assigned each item to one of the three dimensions with respect to its relevance, resulting in complete agreement about the categorization of the items according to the three dimensions. These dimensions can be illustrated by the following example. Suppose a student wants to send out a birthday invitation to his friends by email. An essential step is to know how to login to an email account, know where to place the email addresses of the intended guests, where to put the text, how to import illustrations and so on. These skills belong to the first dimension: applying technical functionality. The first dimension relates closely to the more traditional ‘computer literacy’ as it entails knowing ‘which buttons to push’. Knowing what information needs to be in the invitation email, and putting email addresses in ‘bcc’ to prevent the unnecessary sharing of addresses, are elements that show some reflection on the information the student uses or produces and relate to the second dimension: evaluating and reflecting on information. This second dimension relates closely to the more traditional ‘information literacy’. The third dimension, sharing or communicating information, refers to preparing an information product. In the example, this could be choosing a suitable font size, colour and pictures to make the invitation inviting. This third dimension was strongly incorporated in the large tasks at the end of each module in the ICILS test, where an information product had to be created, for example a poster. The three dimensions of CIL are further described in Table 2. Of the 45 items, 14 relate to the first dimension, 19 to the second and 12 to the third dimension.
Three-dimensional structure of computer and information literacy.
Model estimation and model fit
A multidimensional IRT model, i.e. a confirmatory factor analysis model, was used to validate the proposed three-dimensional structure of the ICILS test data (research question 1). To justify the use of this rather extensive IRT model, the model was first compared to more simple IRT models: the unidimensional partial credit model (PCM; Masters, 1982) and the unidimensional generalized partial credit model (GPCM; Muraki, 1992). The PCM is the most parsimonious model and was also used by the ICILS consortium (Fraillon et al., 2015). The model assumes that only one latent variable is needed to explain response behaviour. The GPCM is an extended version of the PCM, which is also unidimensional but includes not only item location parameters β to characterize the overall score level of an item, but also an item discrimination parameter α, which represents the extent to which the item correlates with the latent variable. In the terminology of factor analysis, this parameter represents a factor loading. In the three-dimensional GPCM, it is assumed that three correlated latent variables are needed to explain response behaviour. Comparisons were made based on the log-likelihood, AIC and BIC fit indices, with smaller values of the indices indicating a better model fit. More complex models result in lower values of these indices. However, they do, obviously, come at the cost of more complexity. Therefore, a more complex model (say, the GPCM) is only preferred over the simpler model (say, the PCM) when the difference in fit indices is judged substantial.
The models were estimated across the nine European countries with gender groups within each country (research questions 2 and 3). The models gave insight into the distribution of the respondents on the latent variables. That is, the estimates included the mean achievement scores for boys and girls in the countries of interest, the correlation structure of the three latent dimensions and the extent to which the items loaded on their specific dimensions.
Finally, two methods of investigation were applied to evaluate gender-related item bias and item bias across countries (research question 4): one based on the difference between observed mean item scores in the gender and country groups and their expected values under the three-dimensional GPCM; the other on comparing parameter estimates obtained for the subgroups.
Parameter estimation and evaluation of model fit was done in the framework of marginal maximum likelihood (MML; Bock et al., 1988) using the public domain software package MIRT (Glas, 2010).
Results
A model comparison based on fit indices is presented in Table 3 and provides a first indication of the appropriateness of a three-dimensional IRT model (research question 1). The first row pertains to a comparison of the PCM with the GPCM. Both models were estimated with a distinct normal latent variable distribution for each combination of gender and country. That is, every gender group within each country had a specific mean and variance on the latent scale. The item parameters were the same for all countries. The columns labelled ‘df’ and ‘-2LL’ give the degrees of freedom and the value of the likelihood-ratio statistic, respectively. The AIC and BIC statistics are based on the likelihood-ratio statistic, but they penalize over-parameterized models and large sample sizes. Note that the value of the likelihood-ratio statistic (11657374 with 44 degrees of freedom) is highly significant and the PCM is clearly rejected in favour of the GPCM. The AIC and BIC do not substantially lower the value of the likelihood-ratio statistic, so the conclusion is not altered. From the first row of Table 3, it thus becomes clear that the GPCM provides a significantly better fit to the data than the PCM. The second row pertains to testing the unidimensional GPCM against the multidimensional version. Again, the simpler model was rejected, although the differences in fit indices were smaller than in the case of testing the PCM against the GPCM. As such, this does not mean that the three-dimensional GPCM fits the data perfectly. In a subsequent testing step an important aspect of the model will be evaluated, namely the absence of item bias. However, first the parameter estimates of the three-dimensional GPCM are presented and discussed.
Differences in fit indices for model comparisons (N=25,133).
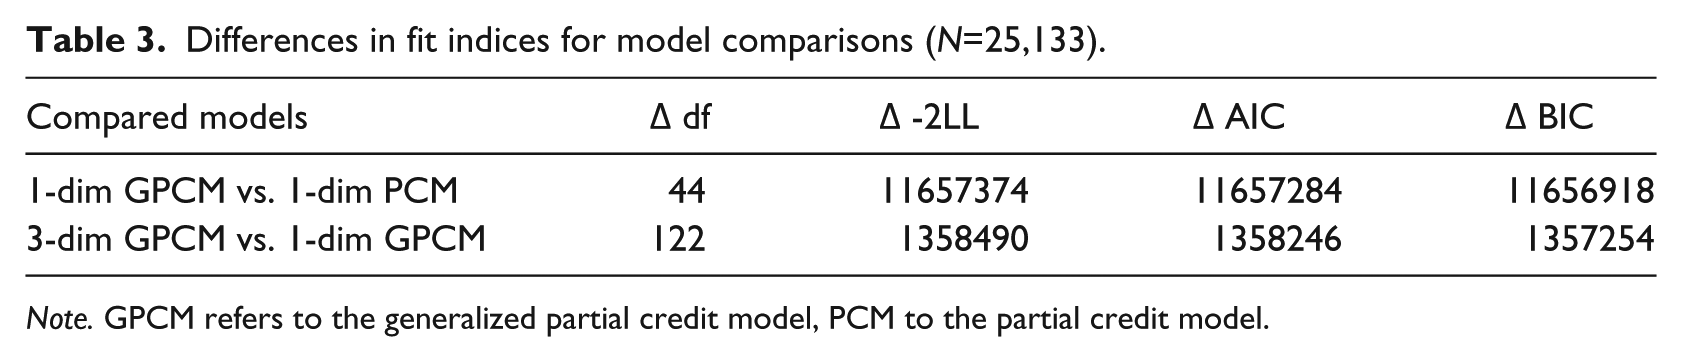
Note. GPCM refers to the generalized partial credit model, PCM to the partial credit model.
MML entails the concurrent estimate of three sets of parameters: the correlation structure, the means of the gender groups within countries and the item parameters. These estimates will be presented in that order, starting with the correlation structure between the three latent dimensions. The correlations between the latent dimensions and the respective standard errors are presented in Table 4 for each combination of a country and a gender group. Within countries, differences that are significant at the 1 per cent level are marked with an asterisk. For the majority of the countries no clear country or gender effects on the correlation structure were manifest. From the table it becomes clear that in each country Dimensions 2 and 3 have the highest correlation, whereas Dimension 1 correlates the least with Dimension 3. The dimensions correlate most strongly for Slovenia (estimates range from 0.656 to 0.982) and the weakest for Norway (estimates range from 0.636 to 0.869). It is notable that the correlation between Dimensions 2 and 3 is extremely high in a number of countries. For Croatia, Germany and the Netherlands there is also a significant difference in this correlation between boys and girls. Significant gender differences are found for all correlations for Germany, with girls showing higher correlations between the dimensions.
Correlations and standard errors between the CIL dimensions for boys and girls across countries.
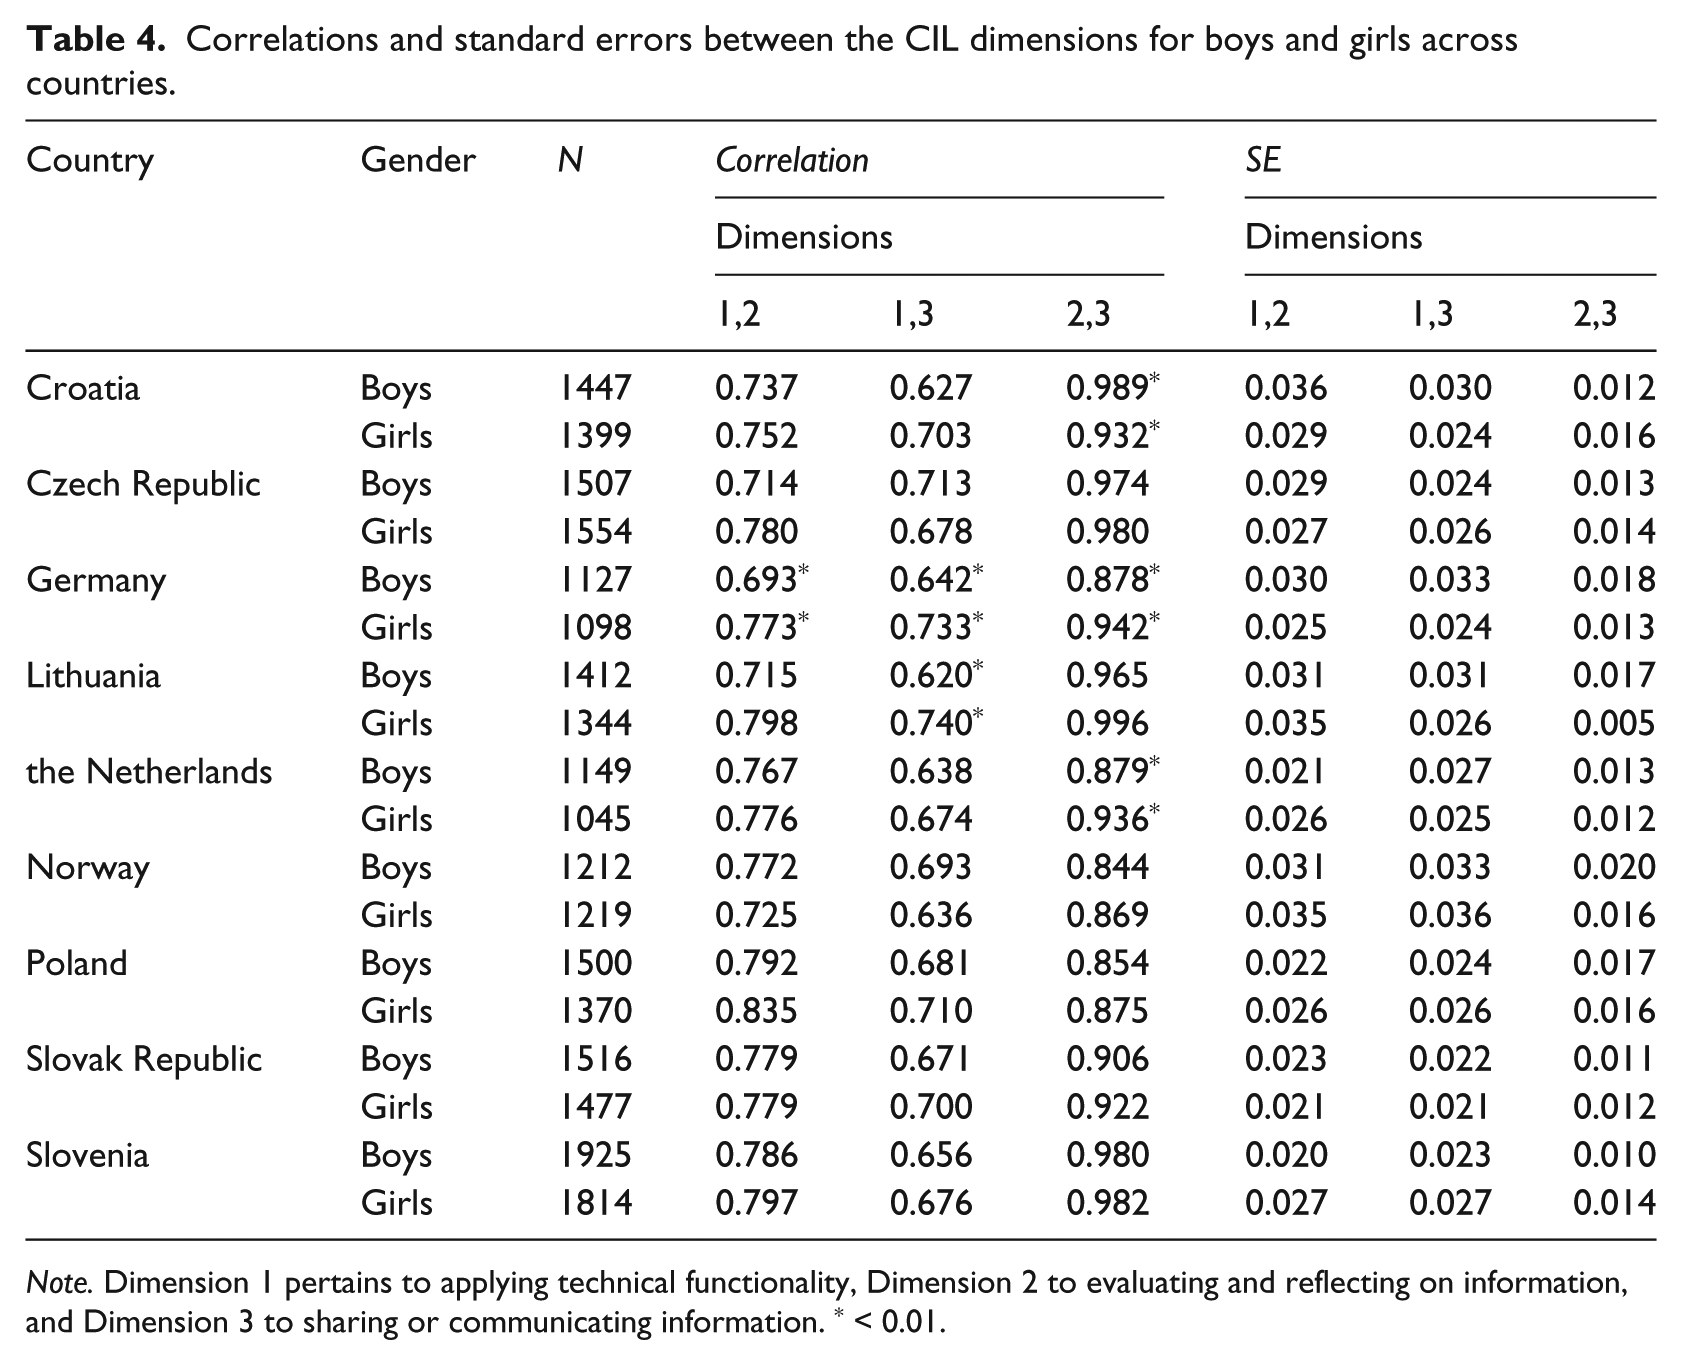
Note. Dimension 1 pertains to applying technical functionality, Dimension 2 to evaluating and reflecting on information, and Dimension 3 to sharing or communicating information. * < 0.01.
Table 5 shows the estimates of the means on the scales for the three CIL dimensions and the sample size of each gender group within a country and addresses the second and third research questions. Note that data from Slovenian girls were used to identify the origin of the subscales, with the mean of the latent scale fixed to zero and the variance fixed to 1, so they serve as a reference group. For all other combinations of gender and country, the standard deviations were free and varied between 1.051 and 2.184. The gender differences are the largest and significant across all countries for Dimension 3. Therefore, on sharing or communicating information, girls outperform boys. Furthermore, girls outperform boys significantly in evaluating and reflection on information (Dimension 2) in all countries. On Dimension 1, applying technical functionality, significant gender differences in favour of girls were found in five of the nine countries under review.
Estimated means and standard errors on latent dimensions of CIL for boys and girls across countries.
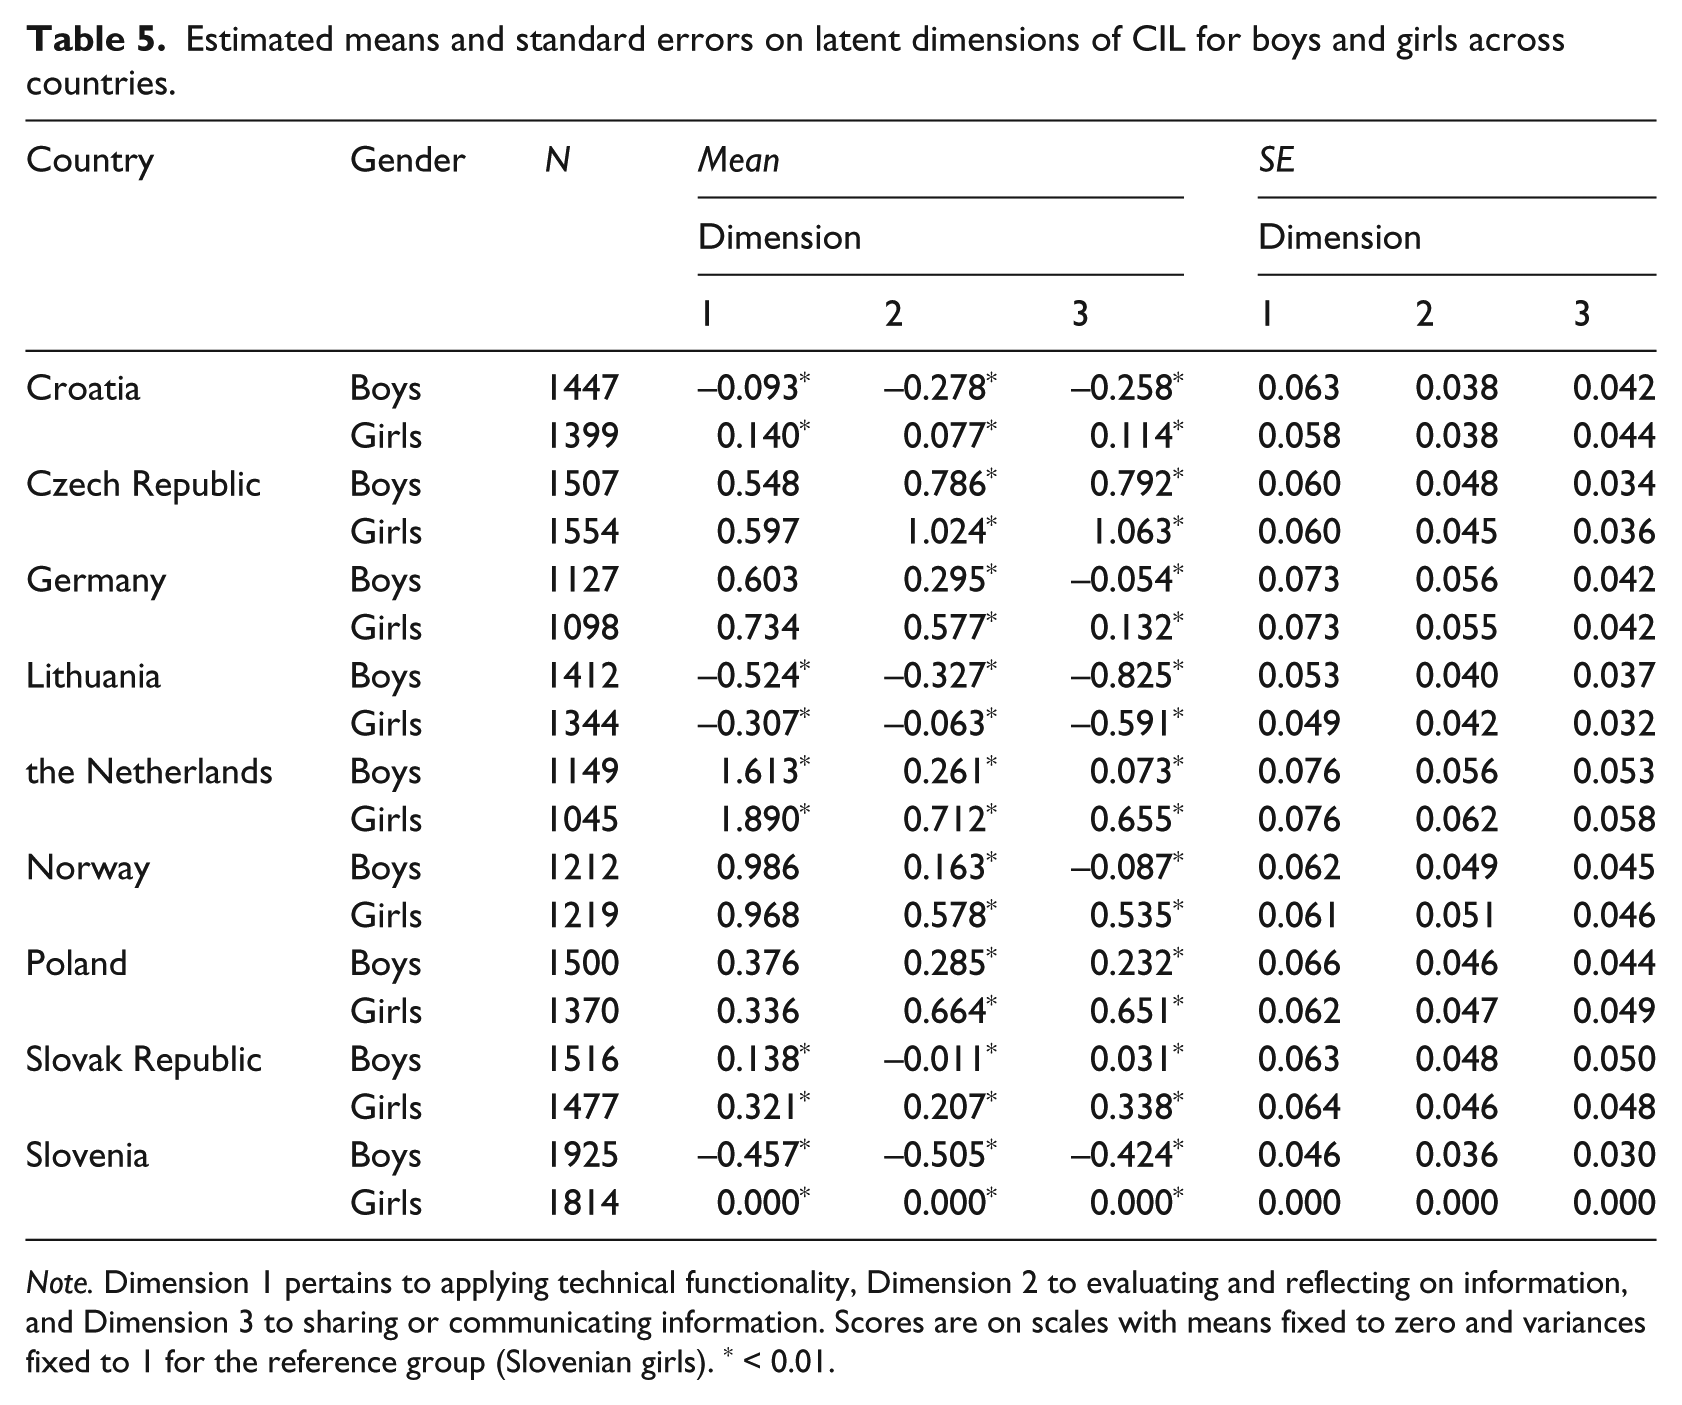
Note. Dimension 1 pertains to applying technical functionality, Dimension 2 to evaluating and reflecting on information, and Dimension 3 to sharing or communicating information. Scores are on scales with means fixed to zero and variances fixed to 1 for the reference group (Slovenian girls). * < 0.01.
Table 6 gives the estimates of the item parameters, together with the sizes of the sample that responded to each item. The items were administered according to a module rotation design, so these sample sizes are much lower than the total sample size of 25,133 students. The item parameters provided in Table 6 are grouped per dimension, i.e. per latent scale. The discrimination parameters α indicate how well an item discriminates with respect to the overall CIL proficiency, where a high value also tends to indicate a higher information value for the item. These parameters can also be interpreted as factor loadings, that is, as coefficients of the regression of the item score on the latent scale. The final column for each scale gives the average of the β parameters for polytomous items, also called the item difficulty parameter. For polytomously scored items, the number of β parameters is equal to the number of score categories minus one, and their average can serve as an indication of the (average) score level on the item. Together, the α and average β parameters give an indication of the contribution of the items to the reliability of a scale: the higher the α parameter and the closer that the β is to the mean of a group on the latent scale, the greater the contribution.
Parameter estimates in the three-dimensional generalized partial credit model for items according to dimension.
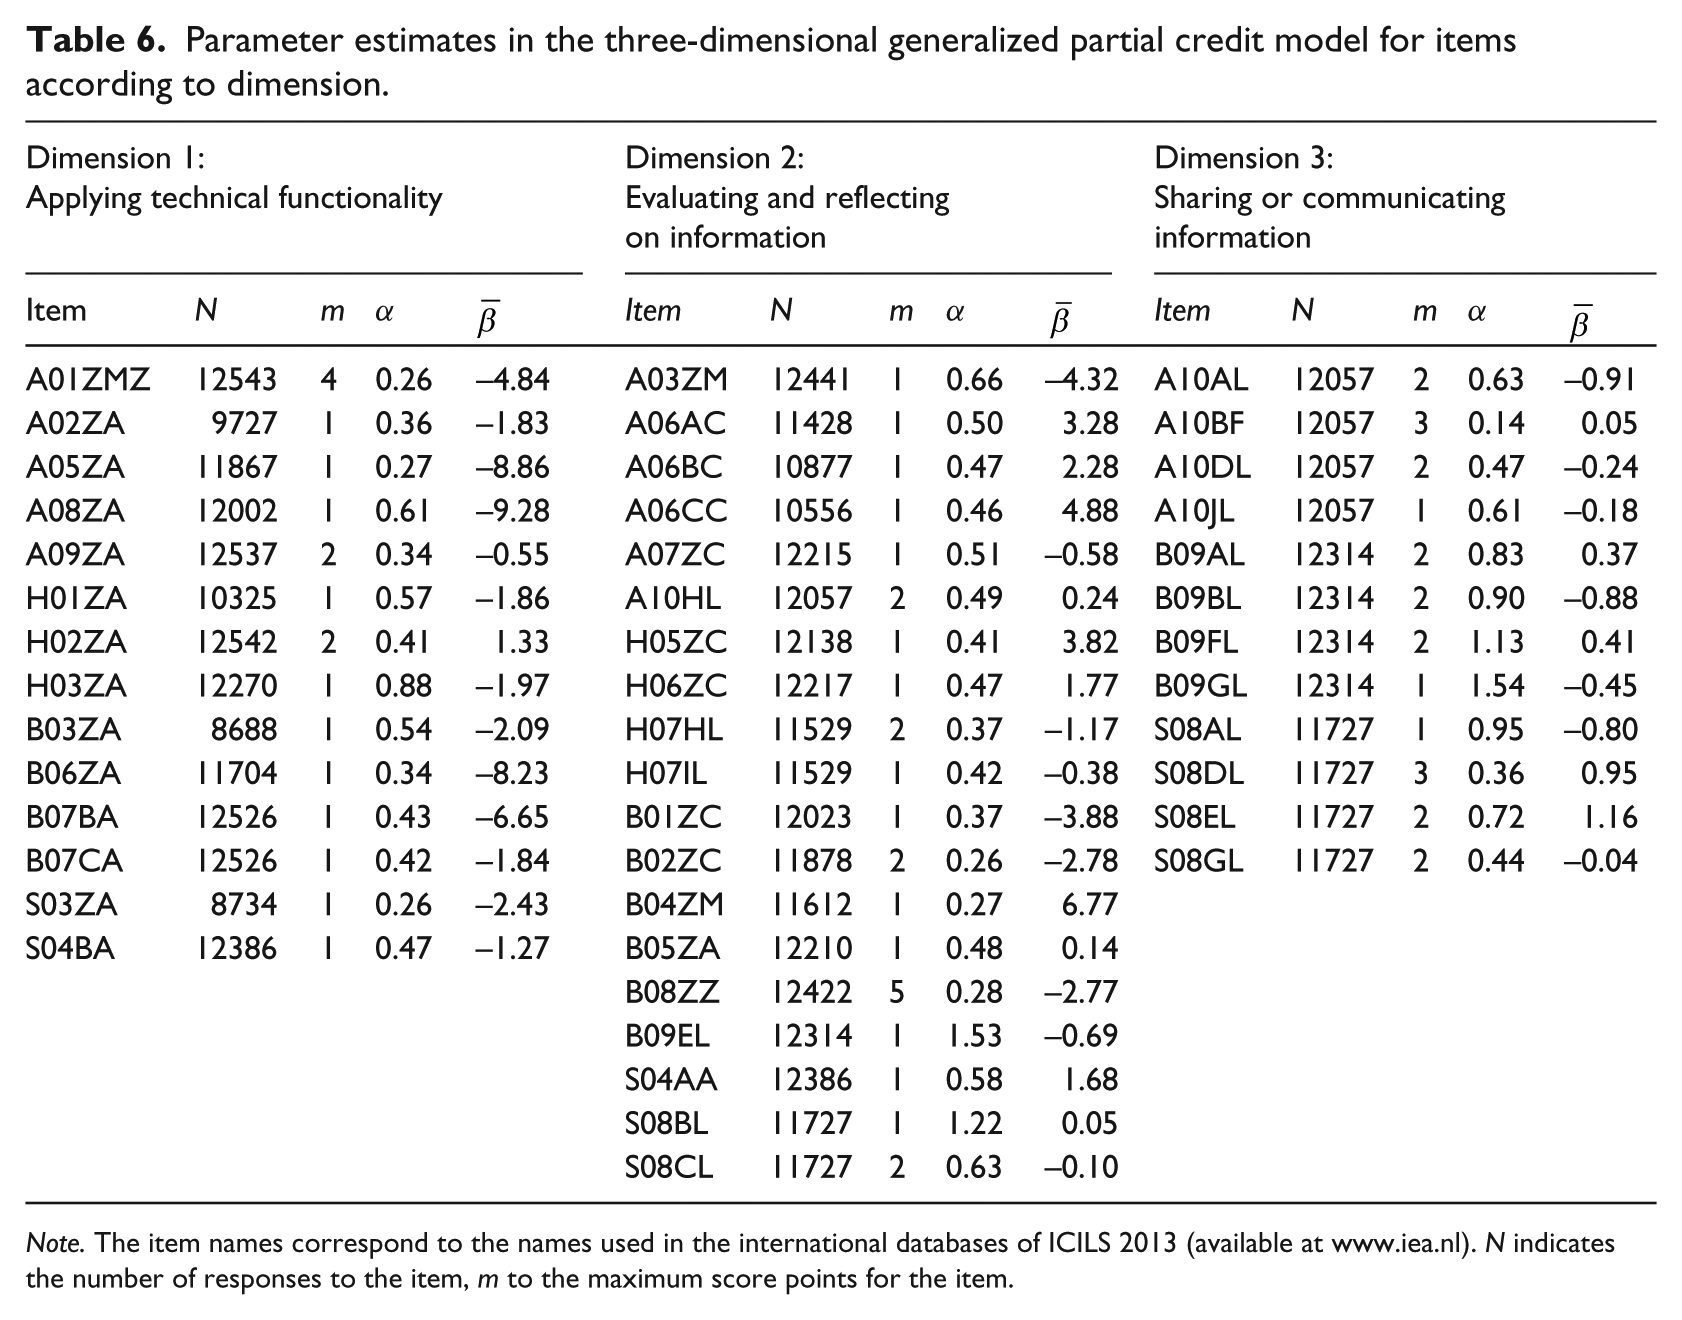
Note. The item names correspond to the names used in the international databases of ICILS 2013 (available at www.iea.nl). N indicates the number of responses to the item, m to the maximum score points for the item.
In general, the discrimination parameters for items measuring Dimension 1, applying technical functionality, are the smallest and α estimates for Dimension 3, sharing or communicating information, the largest. This indicates that items for Dimension 3 discriminate best with respect to the overall CIL proficiency and are more likely to show a high item information value, whereas Dimension 1 discriminates the least. Looking at the item difficulty parameters, it becomes clear that, on average, Dimension 1 contains items with the lowest β estimates, indicating more easy items. For Dimension 2, evaluating and reflecting on information, the average of the β parameters is the highest, indicating that overall this dimension contains harder items.
At the item level, Table 6 shows that for the first dimension, item H03ZA has the highest α estimate. This item asks students to open the internet browser application from the taskbar. For the second dimension, the items B09EL and S08BL show the highest α estimates. These items require students to include the specified information in a webpage and to find required information on website pages, respectively. The largest α value within the third dimension, as well as overall, is item B09GL where the task is to create a balanced layout for a webpage. Examples of items with relatively low α estimates are items A01ZMZ and A05ZA: identify who received an email by ‘cc’, and open webmail from a hyperlink. Item A05ZA also has a low β estimate, indicating that the item is easy. The hardest item in the test, showing a β estimate of 6.77, is item B04ZM, which asks the student to select a suitable website navigation structure for a given content on a webpage.
The investigation of the fit of the three-dimensional model continued by evaluating the presence of item bias, that is, differential item functioning across gender and countries (research question 4). The motivation was that such items might confound the comparisons of boys and girls and of countries. Item bias was investigated by applying two methods. The first method was based on residuals that are calculated as the differences between observed mean item scores in subgroups, such as gender groups and countries, and their expected values under the three-dimensional GPCM. The second method was by comparing parameter estimates obtained in gender and country subgroups. The first method exists in many forms; the present application is based on the version by Glas and Jehangir (2014) and implemented in the MIRT software package (Glas, 2010). This method was applied in two forms. In the first form, the residuals were calculated for every combination of a gender group and a country, and their absolute values were then averaged over these 18 subgroups. For each dimension, these residuals are tabulated in Table 7 under the label ‘R1’. High values in this column suggest an item functions differently for one or more groups of boys or girls in a country, that is, that there is item bias. In the second form, the residuals within these 18 subgroups were broken down further to create subgroups of respondents with low, medium and high total scores, resulting in a total of 54 subgroups. These residuals are summarized in Table 7 under the label ‘R2’ and can indicate if there is differential item functioning for subgroups of boys and girls. For example, whether certain items function differently for high achieving girls in particular. The residuals are scaled to lie between 0.0 and 1.0; 0.10 is often used as a critical value. Note that only a few items exceeded this critical value, so the overall conclusion based on this analysis is that item bias was not prevalent in this data set. Results from estimating the three-dimensional model excluding items with residuals larger than 0.10 showed no remarkable differences in group means or correlational structure. This further supports the conclusion that results were not influenced by cultural or gender item bias, based on this analysis.
Residual analysis for the three-dimensional generalized partial credit model for items according to dimension.
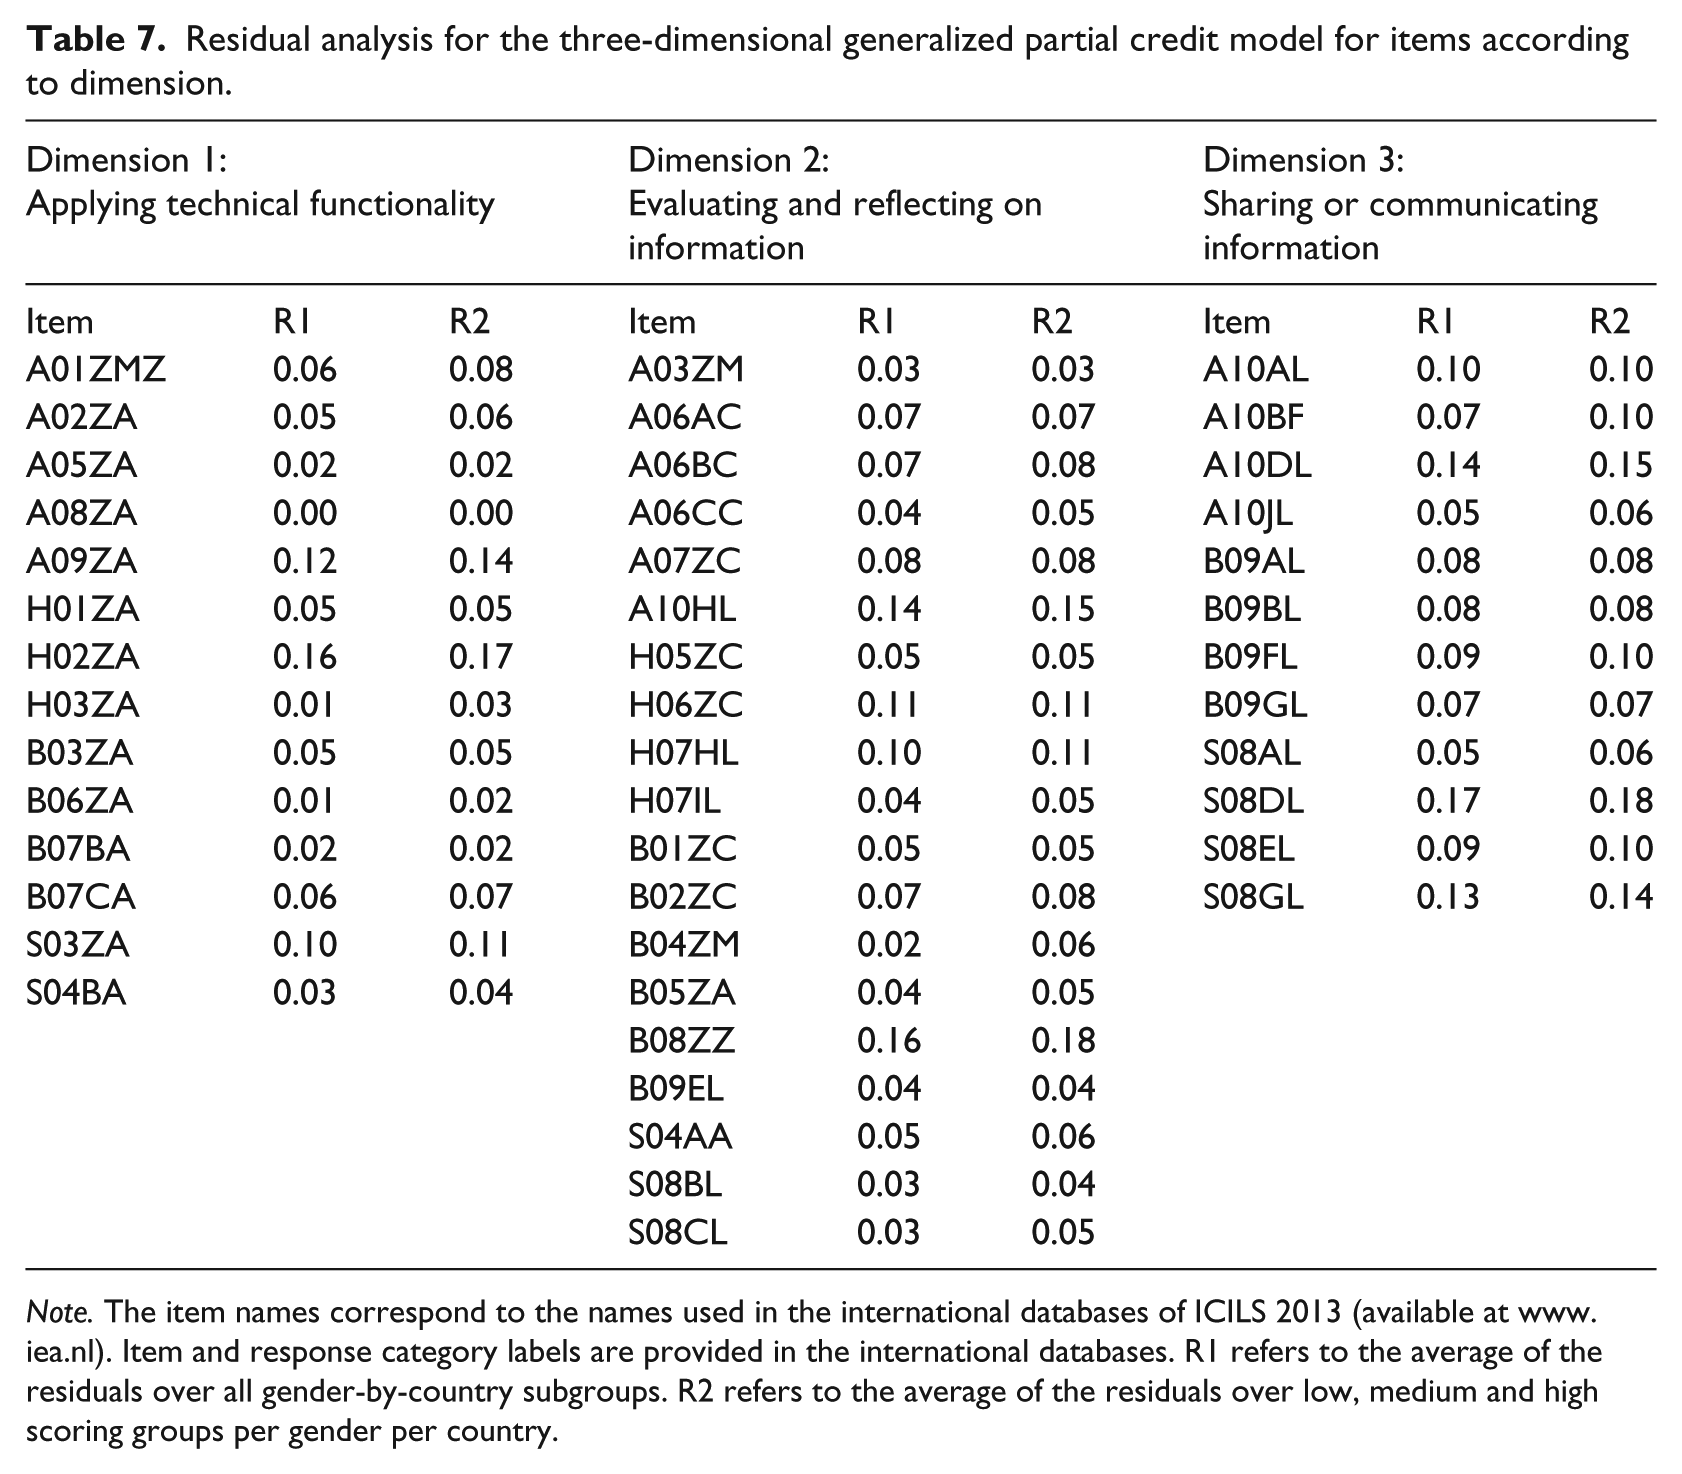
Note. The item names correspond to the names used in the international databases of ICILS 2013 (available at www.iea.nl). Item and response category labels are provided in the international databases. R1 refers to the average of the residuals over all gender-by-country subgroups. R2 refers to the average of the residuals over low, medium and high scoring groups per gender per country.
Item bias was also investigated by a second method based on comparing parameter estimates obtained in gender and country subgroups. Therefore, the three-dimensional GPCM was estimated separately for each country under review to obtain an indication of the extent to which the parameters estimates were country specific. The estimates for the Czech Republic and Slovenia showed the least agreement (Figure 1), with a correlation of 0.74. The strongest agreement was between estimates for Norway and Slovak Republic (see Figure 2; correlation 0.97). However, the overall correspondence provides no support for strong cultural differential item functioning and therefore supports the use of the three-dimensional GPCM across the nine countries to make country comparisons.
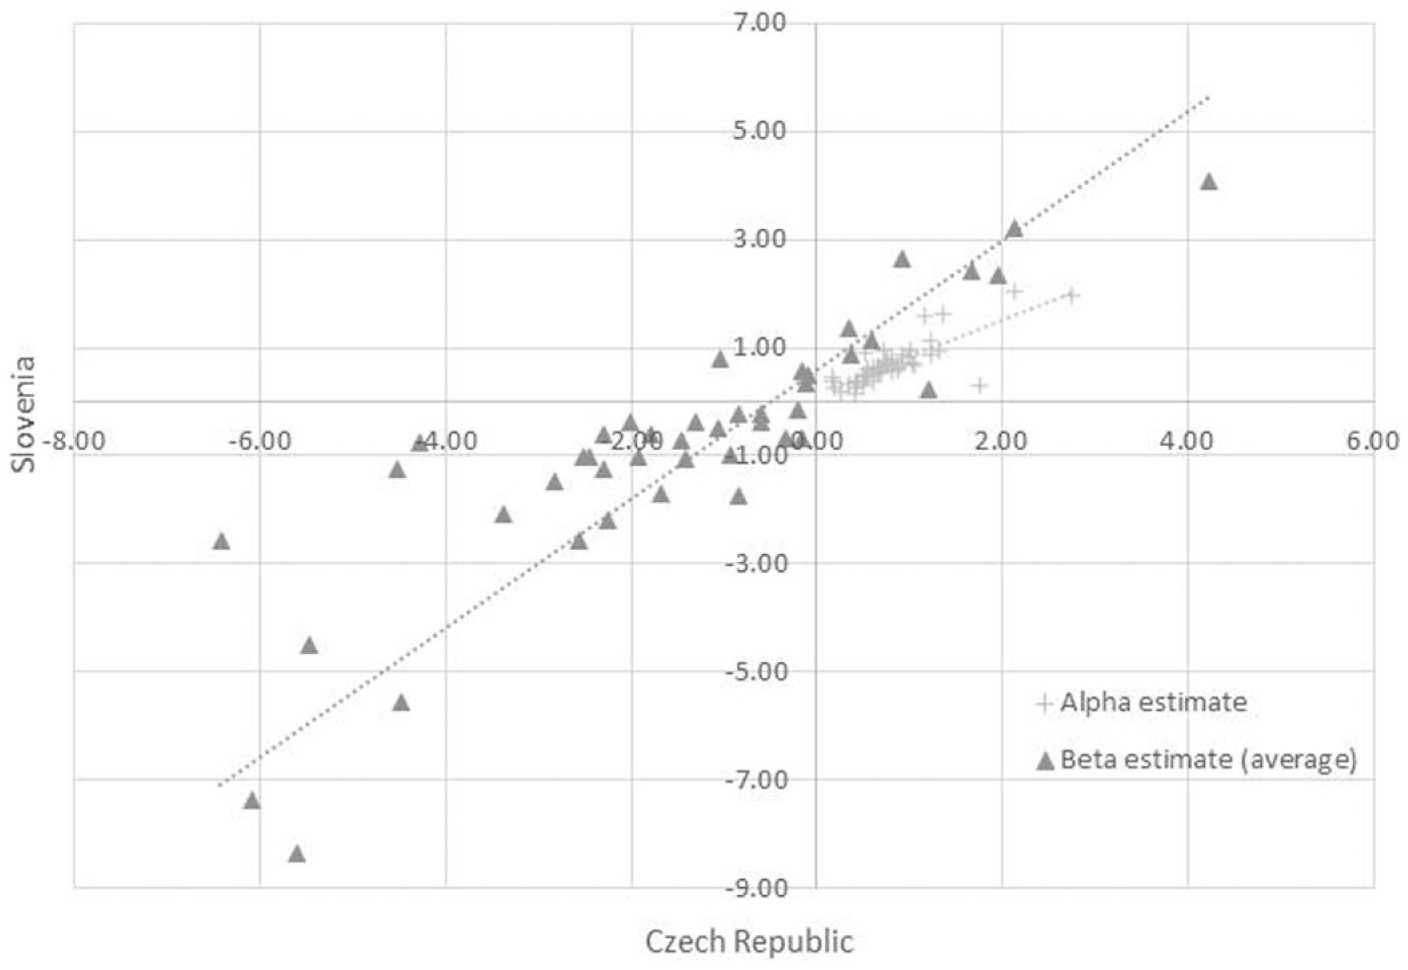
Parameter estimates for Czech Republic and Slovenia.
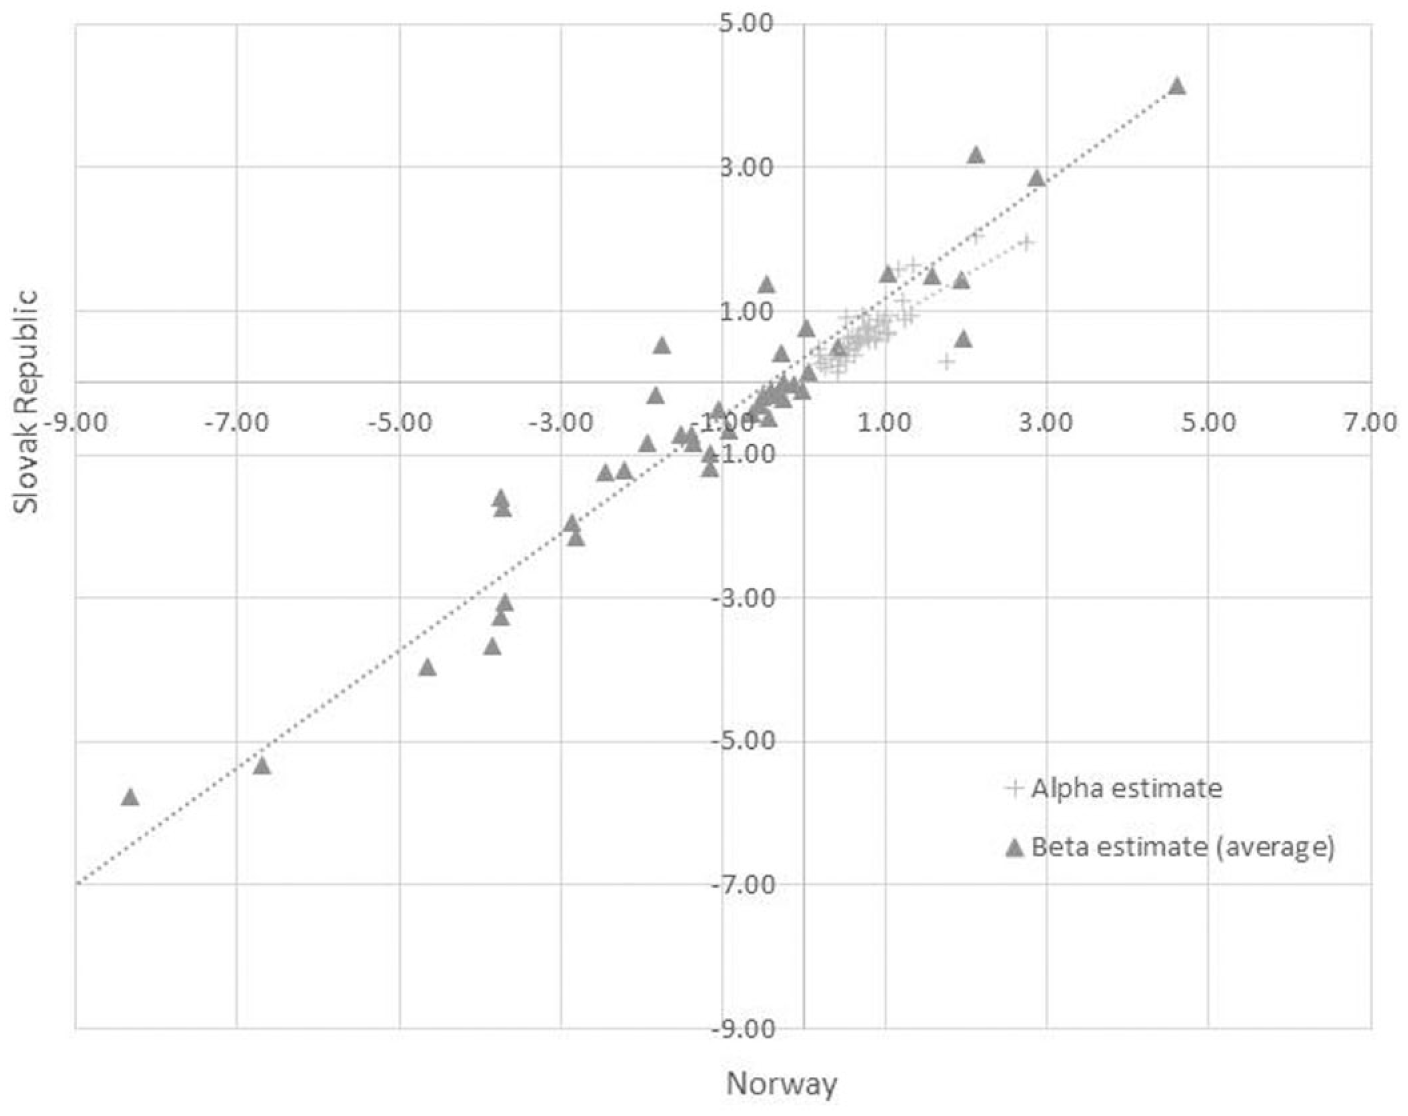
Parameter estimates for Norway and Slovak Republic.
To assess the extent to which the parameter estimates for the three-dimensional GPCM differ for boys and girls within each country, the model was estimated for boys and girls country by country. A graphical representation of the estimates for boys and girls indicated that the estimates corresponded very well overall, with the greatest correspondence in Poland (Figure 3; correlation of 0.97), but the least in the Netherlands (Figure 4; correlation of 0.82). This indicates that there is little or no gender differential item functioning in the items.
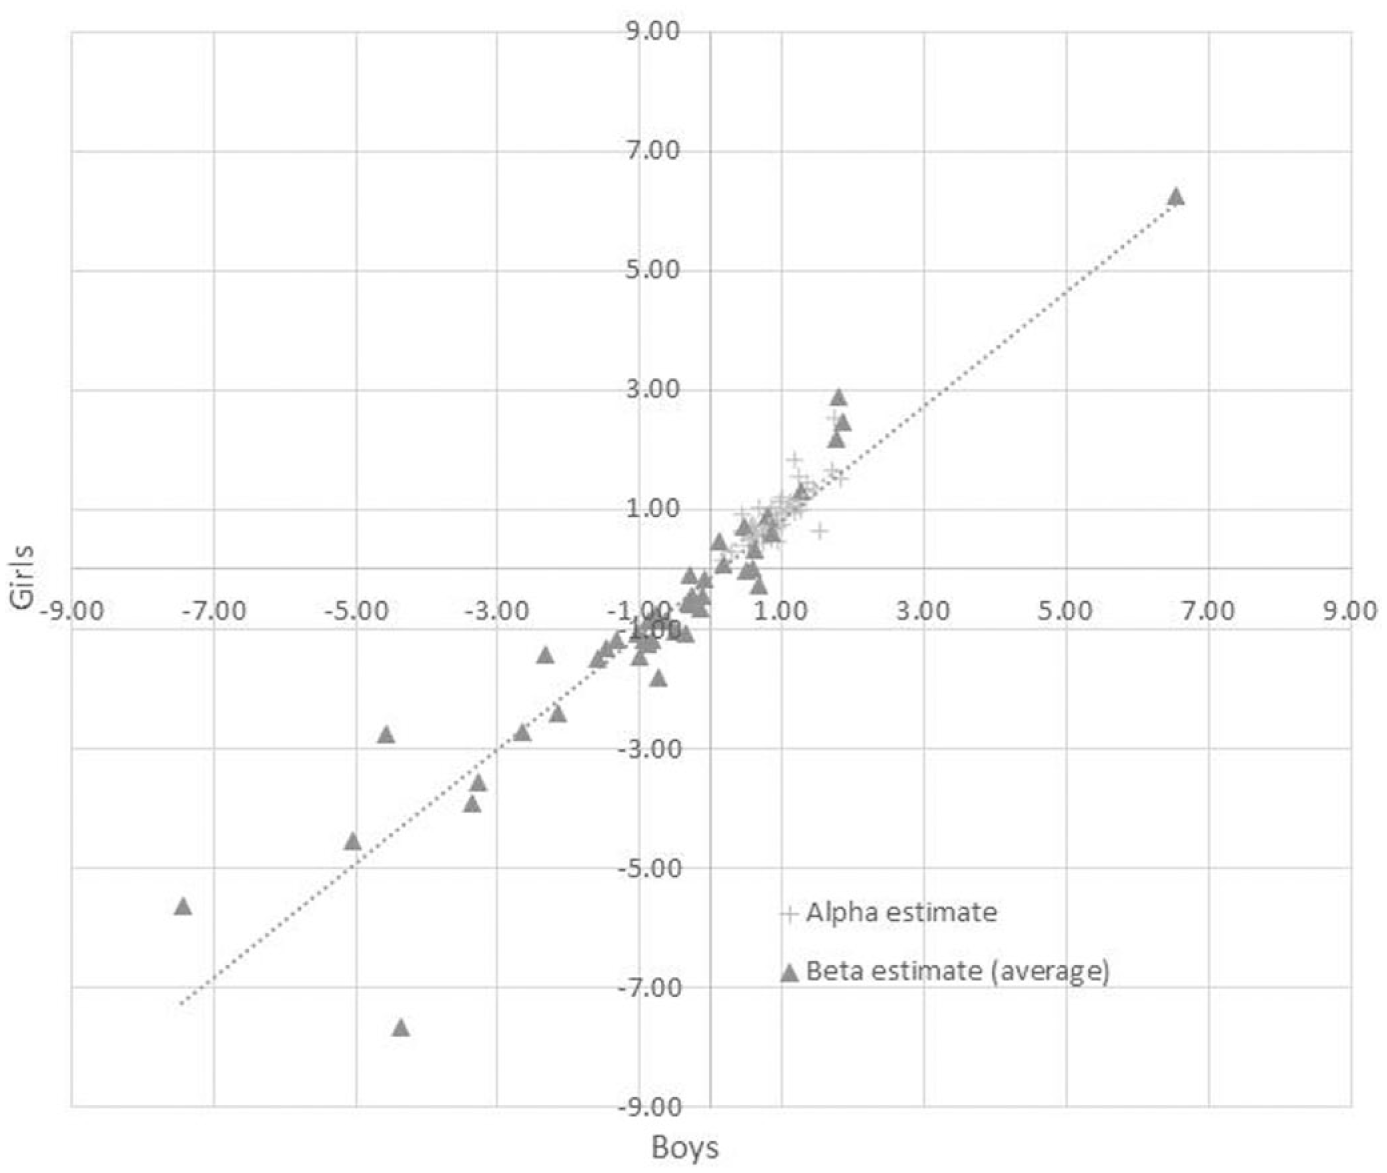
Parameter estimates for boys and girls in Poland.
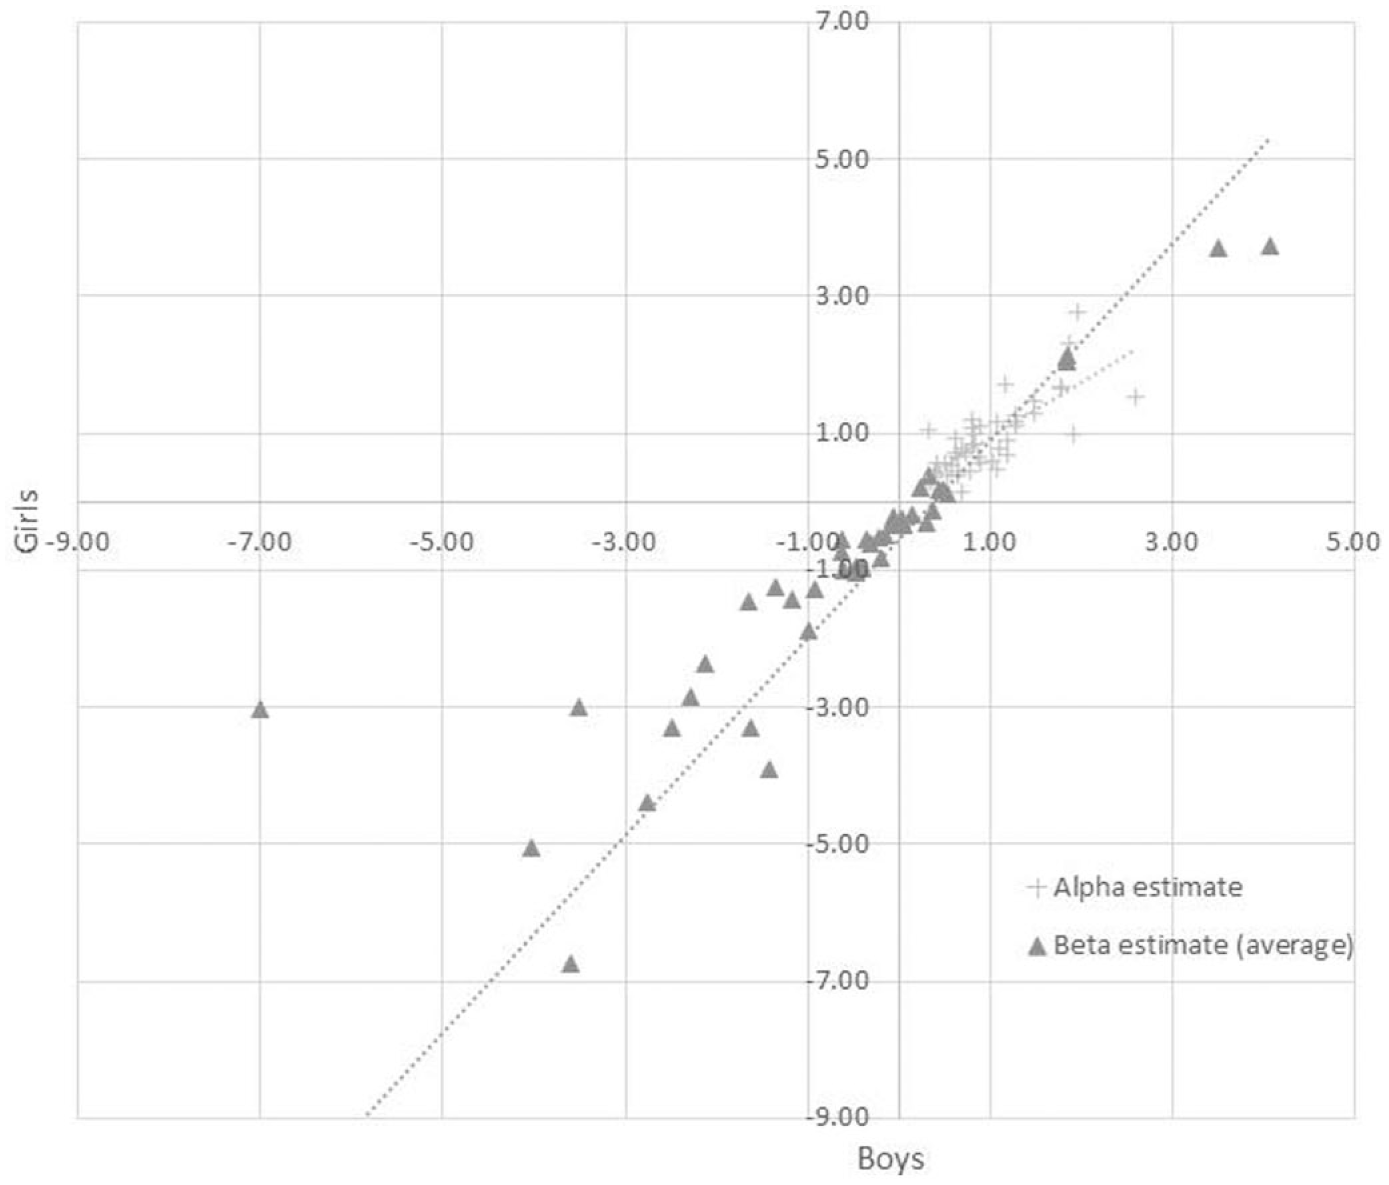
Parameter estimates for boys and girls in the Netherlands.
Discussion
The main purpose of this research was to explore whether the ICILS 2013 achievement test addressed the various dimensions of CIL and if so, whether the performances of girls and boys on these subscales differed across the participating European countries. The dimensional structure proposed consisted of three dimensions: (a) applying technical functionality; (b) evaluating and reflecting on information; and (c) sharing or communicating information. Four research questions guided the study and these are defined and discussed below.
1. Is a three-dimensional representation of computer and information literacy appropriate for the ICILS data, i.e. to what extent does the data fit a three-dimensional IRT measurement model in terms of model fit, correlation structure and item loadings?
The estimated three-dimensional MIRT model was found to fit the data from ICILS 2013 better than the unidimensional GPCM and PCM. The correlation structure showed high correlations between the three dimensions, and this was consistent across countries and genders. However, the clearest distinction was between Dimension 1 on the one hand and Dimensions 2 and 3 on the other, which corresponds with the distinction between the technical skills and information literacy known from the literature. The relative high correlations between the constructs can be interpreted as an affirmation of the integration of computer skills and information literacy into one competence: CIL. However, we believe multiple dimensions are still underlying this construct and assessing performance on these separate scales is useful to see where CIL differences originate from and which aspects could be targeted to remedy groups falling behind on CIL. Based on these findings, future research on the topic of CIL should consider using this dimensionality in the process of test development and scale analyses.
The third dimension, being able to make an information output product, was judged by the experts as a separate category of items in the ICILS test, not to be categorized in a two-dimensional model. However, it did show very high correlations with the second dimension. The item parameter estimates indicated that items on the scale for Dimension 3 are likely to show the highest information values for the CIL construct. Therefore, although the third dimension could not be clearly distinguished from Dimension 2, the items allocated to this scale do seem highly informative for measuring the CIL construct.
The scale for applying technical functionality, on the other hand, had the lowest discrimination parameters and contained, on average, items with low β estimates, indicating more easy items. Future research should broaden the scope of item difficulties on this scale, as the literature suggests that boys and girls may perform differently on items requiring basic ICT skills and tasks requiring higher-order ICT competencies (e.g. Aesaert and Van Braak, 2015; Gui and Argentin, 2011). The current ICILS data did not enable such a comparison.
Students scored, on average, lower on Dimension 2 than on Dimension 1, suggesting room for improvement in evaluating and reflecting on information. It can be argued that, in order to prepare students for participation in the current information society, information skills need more attention in education in these European countries. For example, the ICILS 2013 teacher survey asked teachers to what extent evaluating the credibility of digital information and validating the accuracy of digital information was emphasized in their teaching (Fraillon et al., 2014). Results indicate that teacher means were below the ICILS average in the majority of European countries. The non-European countries, Australia, Canada and Chile, reported a much stronger emphasis in the classrooms on these topics.
2. In which dimensions of CIL are gender differences most prominent?
The postulated hypothesis that girls have an advantage in performance on items in the more information-oriented dimensions (Dimensions 2 and 3) and that for performance on items assessing computer literacy (Dimension 1) the advantage is reversed or even non-existent, was supported. Girls indeed outperformed boys in most countries on the second dimension (evaluating and reflecting on information) and no significant gender differences were found for Dimension 1 (applying technical functionality). The gender gap in this latter area, identified by previous research (e.g. Janssen Reinen and Plomp, 1993) therefore no longer seems to exist. However, to conclude that the gender gap in ICT is truly closed would require further research on gender differences in affective factors; for example, by investigating self-efficacy measured in CIL, as the confidence of girls in various types of computer use is just as relevant for their academic progress and professional careers as their actual skills. Findings from the student survey in ICILS 2013 suggest the gap is not closed for these affective factors. Boys scored substantially higher on the self-efficacy scale for higher-level ICT skills (Fraillon et al., 2014).
The largest differences in favour of girls were on Dimension 3: sharing and communicating information. Although the conceptualization of the third dimension deserves further attention, since items in this dimension were statistically not clearly identified as a separate subscale, the items showed good discrimination and gender differences are most prominent on these items. This finding may be explained by girls being more communication-oriented users of ICT, as reported by Tsai and Tsai (2010). Another possible explanation may be found in the overall advantage of girls in reading literacy (Mullis et al., 2012; OECD, 2010). The items for Dimension 3 often consisted of relatively extensive written instructions. More importantly, the ability to read, interpret and process the presented web-based information was essential to correctly complete these tasks. In future PIRLS, PISA or ICILS assessments, it would be interesting to combine the assessment of reading literacy and CIL and to examine gender differences in the relation between these two subjects.
In addition to this cross sectional study, longitudinal studies and ICILS cycles can provide valuable additional information on the development of gender differences in CIL over time. Especially when a multidimensional perspective of CIL is taken.
3. To what extent are these differences consistent across European countries participating in ICILS?
The extent of gender differences on the separate scales varied from country to country, but no extreme difference was observed for one or several of the European countries under review. Although the number of countries in this study is limited, it suggests that the observed gender differences in CIL may be a common phenomenon, at least for European countries. The results thus provide evidence of general gender differences in CIL, but do not clearly point to, for example, educational systems with unique gender differences in CIL. A broader comparison among more countries participating in ICILS would be valuable future research on this topic.
4. To what extent is the validity of the multidimensional IRT measurement model threatened by gender-related item bias and cultural item bias?
We investigated item bias between genders and among countries as these item biases might affect the comparison of boys and girls and of countries. Both methods used failed to uncover strong evidence for item bias across gender groups or countries. Therefore, results support the use of one model across the nine countries and confirm the validity of the group comparisons based on this model.
Conclusion
In conclusion, the results of this study support our postulated hypothesis on gender differences in CIL and the dimensionality of the construct. The findings shed a new light on the often assumed disadvantaged position of girls and women in today’s information society, and provides directions for future studies on the topic with regard to dimensionality and item fit. However, before it can be convincingly concluded that the gender gap has closed or even reversed, more research is needed; for example, by assessing more challenging tasks for the computer literacy dimension and also to further investigate the gender differences in self-efficacy. In this study we specifically explored gender differences and found evidence for the assumption that the abilities of girls and boys differ between the dimensions of CIL. To deepen our understanding of gender differences in CIL – or possible differences between other groups of students, such as groups with different home environments, experiences or learning styles – we consider it important to acknowledge that CIL is not a unidimensional construct and that further exploration and conceptualization of dimensions of CIL and its relation with reading literacy is necessary. For curriculum developers, developers of learning materials, teacher training institutes, schools and teachers this information would be very valuable as ICILS 2013 convincingly showed that CIL should receive more attention in the intended and implemented curriculum of all participated countries, as most of the tested students turned out to be not a ‘digital native’ at all (Fraillon et al., 2014).
Footnotes
Acknowledgements
We kindly thank Prof. Dr. T.J.H.M. Eggen for his valuable comments that improved the manuscript.
Declaration of conflicting interest
The authors declare that there is no conflict of interest.
Funding
This research received no specific grant from any funding agency in the public, commercial, or not-for-profit sectors.