
Abstract
Several previous studies have shown that in mammals, the health status of conspecifics can be assessed based on perceptual cues. Olfactory, visual, or acoustic cues may lead to avoidant behavior, thus reducing the risk of contagion by close contact with infected individuals. We tested whether immune system activation after immunization leads to perceptible changes in body odor and facial and vocal attractiveness in humans. We have experimentally activated the immune system of male participants using vaccination against hepatitis A/B and meningococcus. Their body odor, facial photographs, and vocal recordings were collected before and 14 days after vaccination. Subsequently, the body odor samples, facial photographs, and vocal recordings were assessed by female raters for their attractiveness and healthiness. We have also measured skin coloration (from facial photographs and in vivo using a spectrophotometer), vocal parameters, and C-reactive protein (CRP) levels as a marker of inflammation. We found an increase in perceived body odor attractiveness, a decrease in facial attractiveness and healthiness, and no change in vocal attractiveness 14 days after vaccination compared to the prevaccination condition. Moreover, there was no change in facial coloration or vocal parameters between the prevaccination and postvaccination conditions. Prevaccination CRP levels were negatively associated with body odor and facial attractiveness and positively associated with body odor intensity. Overall, our results suggest that perceived body odor as well as facial but not vocal attractiveness may provide cues to activation of the immune response and that each modality may carry specific information about the individual's condition.
Introduction
Social species are constantly threatened by infectious diseases. This is due to high population densities and various social interactions, which lead to a higher likelihood of pathogen transmission than in solitary species (Altizer et al., 2003). Therefore, social species have developed various avoidance mechanisms and behaviors to lower the risk of contagion. The most important part of these mechanisms is the early detection of threatening stimuli.
It has been shown that number of social species, including humans, can assess the health status of conspecifics based on various perceptual cues. Hamilton and Zuk (1982) proposed the “contagion indicator hypothesis”, which states that male traits serve as a sensitive indicator of health status and pathogen resistance. These traits may take the form of visual cues, such as the quality of fur or plumage (e.g., Zuk et al., 1990), or olfactory cues, such as urine, feces, or body odor (e.g., Penn & Potts, 1998). Even vocal (e.g., Lopes & König, 2016) or tactile cues (Sarabian et al., 2017) may substantially contribute to the detection of sick conspecifics. While most studies in this area focus on mate choice, assessment of the health status of conspecifics is not restricted to this context. In fact, it can be highly relevant also to other social interactions, where its purpose is to avoid possible transmission of pathogens.
There is robust evidence showing that female mice distinguish between the odor of healthy males and those infected with various ectoparasites and endoparasites. In several studies, female mice showed a strong preference for the urine of control males (males injected with distilled water) compared to the urine of parasitized males (for a review, see Schwambergová et al., 2023). Similarly, Arakawa et al. (2009, 2010) found preference for the smell of urine of healthy rats as compared to individuals injected with lipopolysaccharide (LPS), a substance which activates the response of the physiological immune system and leads to behaviors characteristic of sickness, such as lack of activity, sleepiness, or reduction of grooming.
In humans, too, body odor samples from individuals infected with gonococcus Neisseria gonorrhoeae were rated as less pleasant and described as more putrid than samples from healthy individuals (Moshkin et al., 2012). Sarolidou et al. (2020) showed that body odor samples from individuals with naturally occurring respiratory infections were nominally rated as more intense, more disgusting, less pleasant, and less healthy than samples from the same participants when healthy. Moreover, odor samples collected from men injected with LPS were perceived as more aversive (Olsson et al., 2014).
Although studies of rodents tend to focus on olfactory cues to their health status, investigations of the preference for healthy individuals are not limited to this modality. Various visual cues, such as ornaments, coloration, or behavior, may likewise be assessed because infections can have a negative impact on them. For example, chimpanzees tend to avoid conspecifics who display motoric cues to disease (Goodall, 1986).
In humans, sight is the most studied modality in the context of detection of currently sick individuals. It has been proposed that cues to perceived facial attractiveness are positively associated with health, but existing evidence is rather equivocal (for a review, see Stephen & Luoto, 2023). One of the traits which influence perceived attractiveness is skin color (Fink et al., 2006), which is affected by current health status (Henderson et al., 2017). For instance, significant changes in skin color were observed even just 1 hour after LPS injection, and they varied between body regions: facial skin became lighter and less red, while skin on the arms became darker, less red, and less yellow (Henderson et al., 2017). Skin color changes could thus serve as a cue to acute illness, although they do not predict overall susceptibility to infectious diseases (Cai et al., 2019). Besides skin coloration, body fat levels also affect attractiveness ratings, whereby both excessively thin and overweight individuals are rated as less attractive (Coetzee et al., 2009; Rantala et al., 2013). These two states are not only rated as less attractive but also as associated with various health problems (e.g., Brown et al., 2009). Detection of illness is not restricted to one's cultural experience: people can detect and discriminate the faces of sick individuals as soon as just 2 hours after LPS-induced activation of the immune system regardless of the ethnic origin with the ill individual (Arshamian et al., 2021).
Infection may also affect vocalization, which is in various species a trait that plays a substantial role in many social interactions, including mate choice. It has been proposed that acoustic cues provide honest information about the individual's quality and/or condition (Xu et al., 2013). For example, LPS-injected males of the house mouse produced a lower number of regular ultrasonic syllables (regarded as sexually attractive) and a larger number of (nonattractive) high-frequency ultrasonic syllables (Lopes & König, 2016). This suggests a decrease in the production of sexually attractive acoustic signals. In humans, vocal characteristics such as the fundamental frequency or formant position could likewise be linked to current health status. In men, more masculine voices (with relatively low fundamental frequency and low formant positions) are associated with better general health and higher salivary levels of immunoglobulin A, which is a biomarker of immune function (Arnocky et al., 2018). Although fundamental frequency negatively influenced healthiness ratings, raters could not assess the health status of male speakers from their voices alone (Albert et al., 2021). Regarding sounds connected with ongoing diseases, such as coughs and sneezes, a recent study had shown that although raters were unable to distinguish whether the sounds came from healthy or genuinely ill individuals, sounds rated as more disgusting were also judged as more likely to come from sick individuals (Michalak et al., 2020).
In this study, our aim was to test possible differences in the rating of body odor, facial and vocal attractiveness, and healthiness of men before and after vaccination. We used a vaccination against both a bacterial and a viral infection simultaneously to stimulate the complex upregulation of immune system. We were not interested in the specific immune responses because the mechanism of changes in body odor or facial and vocal attractiveness elicited by immunostimulation is as yet unknown. We predicted that odor, facial and vocal stimuli will be rated as less attractive and less healthy after vaccination. Moreover, we have anticipated that the levels of C-reactive protein (CRP), a widely used clinical marker of inflammation, would be higher after vaccination than before it. CRP was chosen as a marker of potential acute-phase reaction that could occur due to immunostimulation. Some previous studies have shown a negative association between perceived facial healthiness or attractiveness and CRP levels (Phalane et al., 2017; Żelaźniewicz et al., 2020), which is why we investigated associations between the rated characteristics and CRP levels in both states, that is, both prevaccination and postvaccination.
Methods
This study is part of a larger project aimed at testing the association between immunoreactivity (measured by increased specific antibodies after vaccination), body odor quality (see Schwambergová et al., 2021), and facial attractiveness (see Pátková et al., 2022). The project was conducted at the Charles University (Prague, Czech Republic) from Q4 2017 to Q4 2019 in collaboration with the medical personnel of the Prevedig laboratory and a general practitioner. All procedures were approved by the Institutional Review Board of the Charles University (approval no. 20/2016) and conducted in accordance with the Helsinki Declaration. The study design was preregistered prior to data analyses (https://osf.io/69zgc/).
Targets
In total, 21 Czech men aged 18 to 40 years (mean = 26.2; SD = 4.62) provided body odor samples, facial photographs, and voice recordings. Participation requirements were good general health, nonsmoking, not shaving one's armpits (Kohoutová et al., 2012), and not being vaccinated against hepatitis A/B or meningococcus for the past 10 years (e.g., Shepard et al., 2006). Participants were informed about the goals of the study before its initiation and indicated their consent by signing an informed consent form. As compensation for their time and potential inconvenience, participants received 400 CZK (approx. €15) and the first dose of vaccines for free.
Procedure
Body odor samples, facial photographs, measurements of facial skin color, and voice recordings were collected twice: once during the night (body odor) or day (facial photographs and voice recordings) before vaccination, and the second time 14 days after vaccination, at a time when one could expect the highest antibody response (De Paula, 2012). Before vaccination, all targets completed a medical history form and their health status was assessed by a general practitioner. Afterwards, the targets were vaccinated against hepatitis A/B and meningococcus; for a detailed description of the vaccines, see below. We have collected three blood samples from the targets to assess the levels of specific antibodies, CRP, and steroid hormones. To determine the basal levels of these variables, we collected a blood sample before vaccination. The second sample was collected 14 days later, and the last one 30 days postvaccination to assess the dynamics of changes in antibody levels after vaccination while following the recommended interval for the second dose of the hepatitis vaccine (e.g., Galson et al., 2015). Vaccination was performed by a general practitioner who also collected the initial blood samples. Phlebotomists collected other blood samples at the Prevedig laboratory, which also performed analyses of CRP levels. All blood samples were collected at the same time of the day (7–8 am) to minimize potential variation in steroid hormone levels due to circadian rhythms (Reinberg et al., 1978); results regarding the levels of steroid hormones and specific antibodies can be found in Schwambergová et al. (2021) and Pátková et al. (2022). For the study schedule, see Figure 1.

Study schedule step-by-step. Approximately 48 h before body odor collection, targets refrained from spicy and aromatic foods, alcohol, and increased physical activity. *Blood samples were collected to assess levels of specific antibodies, steroid hormones, and C-reactive protein.
Vaccine Characteristics
To induce an immune system response, we used the Menveo vaccine against meningococcus and the Twinrix Adult vaccine against hepatitis A/B. Menveo is applied to prevent (bacterial) meningococcal diseases caused by Neisseria meningitis serogroups A, C, Y, and W-135 (see prescription information: https://gsksource.com/pharma/content/dam/GlaxoSmithKline/US/en/Prescribing_Information/Menveo/pdf/MENVEO.PDF). The Twinrix Adult vaccine is used for immunization of adults against viral hepatitis A and B (https://id-ea.org/wp-content/uploads/2012/05/Twinrix-Package-Insert.pdf). These vaccines can be applied together and are widely used in the Czech Republic. Both were applied intramuscularly (in the deltoid muscle), each in one arm.
Body Odor Collection
For body odor sampling, each donor received a list of instructions and a package containing plain cotton pads (approx. 9 × 7 cm; DM Ebelin), 100% cotton white T-shirt (Adler Malfini Heavy), a nonperfumed soap (Balea MED Ultra Sensitive), and surgical tape (Omnisilk 2.5 cm × 9.2 m). On the day before and on the day of sampling (i.e., for about 48 h), donors were asked to avoid consuming aromatic foods, such as spices, blue cheese, or garlic, alcoholic beverages or other drugs, to refrain from strenuous physical activity, such as jogging or sex, and not to apply fragranced products, which may all affect the quality of the body odor (e.g., Havlicek & Lenochova, 2006; Lenochová et al., 2009). Donors’ conformity with these instructions was checked by a questionnaire (see Appendix 2 in Schwambergová et al., 2021) completed when handing over the body odor samples. On the night of sampling, donors washed their armpits using the provided nonperfumed soap and then attached the cotton pads to both armpits using the provided surgical tape. To limit contamination by extrinsic ambient odors, they wore a 100% cotton T-shirt previously washed without any fragranced detergent as the innermost layer of clothing. They wore the cotton pads for 12 h overnight (it has been demonstrated that this sampling duration is sufficient for body odor collection; cf. Havlíček et al., 2011). The next morning, they removed the cotton pads, placed them in zip-lock plastic bags, and returned them to the experimenters. The odor samples were immediately placed in a freezer set to −20°C to limit any further microbial activity that could alter the quality of the collected body odor (Lenochová et al., 2009). Samples were then kept in the freezer until the rating session.
Acquisition of Facial Photographs
Facial photographs and voice recordings together with measurements of body composition (for details, see Schwambergová et al., 2021) and skin color (for details, see Pátková et al., 2022) were acquired in the Human Ethology laboratory at the Faculty of Science, Charles University.
Facial photographs were taken under standardized conditions in a purpose-built photographic booth to prevent any changes in illumination and color reflections. They were acquired using a 24-megapixel full-frame (35.9 × 24 mm CMOS sensor, a 35 mm film equivalent) DSLR camera Nikon D610, with a Nikon AF-S Nikkor 85 mm F1.8 AF-S G lens. Exposure was manually set to ISO 100 with shutter speed of 1/125 s and an aperture of F8 (Třebický et al., 2016). One studio strobe (Menik MD-400Ws) with a white reflective umbrella as a light modifier placed above the camera was used as the light source. The light was mounted onto a 175 cm high light stand and tilted 10° downwards toward the target. Correctness and uniformity of exposure and color settings were checked before each session using a digital light meter Seconic L-308DC and color calibration targets X-rite ColorChecker passport, respectively.
Each participant was seated on a barstool positioned 50 cm in front of a plain white background and instructed to remove any facial adornments and wear a white T-shirt provided by the researchers. Targets were asked to sit straight, with hands hanging freely alongside their bodies, look directly into the camera (Hehman et al., 2013; Třebický et al., 2019), and maintain a “neutral” facial expression. Photographs were taken from a 125 cm distance, whereby the camera was placed on a tripod with height set depending on the participant's body height so as to keep the face in the middle of the frame, with focus set on the right eye in the AF-S mode. The distance between the target and the camera (sensor plain marked φ) was verified with a digital laser rangefinder (Bosch PLR 15). This setting of camera distance, focal length, and sensor size gave a 35 × 53 cm field of view (23.85° viewing angle).
All facial photographs were postprocessed using Adobe Lightroom Classic CC (version 2017) and Adobe Photoshop CC 2015. All facial photographs were color and exposure calibrated and then exported into 16-bit Adobe RGB TIFF files in their actual size (35 × 53 cm) with 168 PPI resolution. Vertical and horizontal position of each participant in the image was adjusted so that the target's head was in the center of the frame with both pupils on the horizontal line. For further details of the photo acquisition and postprocessing procedures, see Třebický et al. (2018).
Measurements of Facial Skin Color
Facial skin color was measured in vivo with spectrophotometer Ocean Optics (OO) Flame-S with optical resolution of 2 nm, using a standard D65 illuminant. Integrating OO Sphere ISP-R was used to spatially integrate the radiant flux to scatter transmission and diffuse reflectance sample measurements. The spectrophotometer was calibrated using the WS-1 Diffuse Reflectance Standard. All measurements were taken on three regions of the targets’ faces (forehead, left, and right cheek) and on the inner side of biceps (which was not used for the further analysis). The analyzed measurements were expressed in CIEL*a*b* color space (Hunter, 1958; Huang et al., 2018).
We have also measured facial skin color from calibrated prevaccination facial photographs using ImageJ software (v 1.51) and Color Transformer 2 MatLab package. Skin color was measured in the CIE L*a*b color space and values for redness (a*), yellowness (b*), and lightness (L*) (Henderson et al., 2016) were recorded in three regions of the face (forehead, right and left cheek). We measured the largest available area per stimulus while avoiding freckles, blemishes, and hair. Facial skin color values obtained from the spectrophotometer and from facial photographs taken before vaccination correlated positively (right cheek L* ρ = 0.314, left cheek L* ρ = 0.271, forehead L* ρ = 0.458; right cheek a* ρ = 0.271, left cheek a* ρ = 0.187, forehead a* ρ = 0.442; right cheek b* ρ = 0.685, left cheek b* ρ = 0.496, forehead b* ρ = 0.250) and the same applies to color measurements after vaccination (right cheek L* ρ = 0.606, left cheek L* ρ = 0.502, forehead L* ρ = 0.368; right cheek a* ρ = 0.023, left cheek a* ρ = 0.292, forehead a* ρ = 0.308; right cheek b* ρ = 0.659, left cheek b* ρ = 0.729, forehead b* ρ = 0.699). For ease of comparison with other studies, we decided to use in further analyses measurements of facial skin color based on photographs. For analyses using spectrophotometer, see Supplemental Table S1 to S8.
Voice Recordings
Voice recordings were obtained in an acoustically treated, purpose-built photographic booth using cardioid condenser microphone RØDE NT-1A equipped with pop-up and acoustic reflection filters (to reduce any potential disruptive sounds and echoes) and connected to a PC through an I/O audio interface Focusrite Scarlett Solo Gen2. The microphone was mounted on a tripod at the height of the participant's mouth. Voices were recorded via Audacity 2.1.3. in WAV files in 24bit/192 kHz resolution. Participants stood 40 cm from the microphone. The distance and other volume-related settings were kept constant to standardize the intensity of recordings. Participants were instructed to read aloud consonants, vowels, and a sentence (“My name is Peter and I come from Prague”) in Czech from a provided sheet. For ratings and analyses, we used only the abovementioned sentence, which was used also in our other studies (e.g., Šebesta et al., 2017).
Acoustic analysis of the recorded sentences was performed with VoiceLab 1.2.0 (Feinberg, 2022; Feinberg & Cook, 2020). For extraction of all acoustic parameters, we have used VoiceLab's default setting (the Voicelab settings file and results file are downloadable from https://osf.io/4k3ud/). In further analyses in this study, we used only the cepstral peak prominence (CPP) as an objective measure of breathiness, harmonics-to-noise ratio (HNR) as an indicator of vocal ageing, fundamental frequency (F0), which is related to voice pitch and formants (F1–F4) which are related to a resonance in the vocal tract.
Raters
In total, 88 Czech women aged 18–40 years (mean = 22.9; SD = 2.85) participated as stimuli raters. Only female raters were recruited, because they, on average, score better on different areas of olfactory perception (for a review, see Brand & Millot, 2001) and they consider body odor more important when selecting a possible partner than men do (Havlicek et al., 2008). Requirements for participation were good respiratory health and no use of hormonal contraception (Martinec Nováková et al., 2014).
Facial photographs were rated twice: once for attractiveness during the session with body odor samples and voices (N = 88) (in Q1 2018) and then for healthiness during a rating session not directly related to the current study in Q4 2019. In the second session, photographs were rated by 66 females aged 18 to 40 years (mean = 23; SD = 4.71) with the same requirements for participation as outlined above. As compensation for their time, raters received 200 CZK (approx. €8) and 150 CZK (approx. €6) for participation in the first and second session, respectively.
The Rating Procedure
Rating of body odor samples took place in a well-ventilated, quiet room. The samples were presented in 500 mL opaque jars with ground glass sealing lids labeled by a nonspecific code. Each sample was rated for attractiveness, intensity, and healthiness on a seven-point verbally anchored scale (e.g., 1—very unattractive and 7—very attractive). The rating took place over 2 days (43 raters in Day 1, 45 in Day 2) to logistically accommodate the total number of raters. Ambient temperature was 18.2°C to 20.7°C (Day 1) and 18.7°C to 20.6 °C (Day 2), with humidity at 28% to 31% (Day 1) and 27% to 28% (Day 2). During one rating day, raters were presented with either prevaccination or postvaccination sample from any given odor donor (N = 21) and on the second day, they were presented with the odor donor's sample from the other condition (N = 21). For each day, the jars containing odor samples were randomly divided in three subsets and during rating, raters took breaks between each set to avoid sensory adaptation. Samples were presented in a randomized order to avoid systematic bias within a rating day. Raters were instructed to remove the lid (sealing the jar afterwards), sniff the sample, and write down their rating immediately after sniffing. The time spent sniffing was not restricted (for further details, see Schwambergová et al., 2021).
Rating of facial photographs took place in the Human Ethology perception lab under controlled settings, which were kept constant for all raters and rating days (closed window blinds, artificial illumination to reduce ambient lighting variations). The rating was conducted on two identical desktop computers with color and brightness calibrated (by XRite i1Display Pro probe) LCD screens (27” Dell U2718Q UltraSharp IPS; 3840 × 2160 @ 168 DPI, 99% sRGB color space coverage) turned to a vertical position to accommodate life-sized facial pictures. The rating itself was conducted in the Qualtrics survey suite (Qualtrics, Provo, UT). Facial photographs were presented in a randomized order and rated on a seven-point verbally anchored scale separately for attractiveness and healthiness during the first and the second session, respectively. The raters were seated 115 cm from the screen, with eyes at the height of 125 cm (measured from the floor to the outer corner of the eye). This setting closely emulated conditions under which the photographs were taken while simulating the usual interpersonal distance (Sorokowska et al., 2017; Třebický et al., 2018). Following the evaluation, raters were asked to fill in an anonymous survey on their demographic data (e.g., place of residence, education, and occupation) and olfactory abilities (e.g., self-rated olfactory abilities, allergies, recent or current common cold).
Voice recording rating sessions were conducted using a purpose-built rating experiment in PsychoPy (Peirce et al., 2011; v. 1.6) on two identical desktop computers (same as for photography rating) with Focusrite Scarlett Solo Gen 2 audio I/O interfaces and studio reference Beyerdynamic DT 770 Pro 32 Ohm over-ear closed headphones (5–35 kHz). Recordings were played from original uncompressed WAV files. Playback volume was kept constant during the presentation and between raters to preserve the relative differences in voice volume between stimuli. Sets of 21 recordings (states before vacc. × after vacc. to correspond to the body odor samples and facial photographs presented during a given day) were rated by the same group of 88 raters (43 raters on Day 1, 45 on Day 2). Raters were asked to rate the attractiveness of each target on a seven-point verbally anchored scale (from 1—very unattractive to 7—very attractive). Individual stimuli within the set were randomized. We have also collected data for voice healthiness but due to a technical error, these data were lost and could not be presented in this study. For schedule of the rating procedure, see Figure 2.

Schedule of the rating procedure. All stimuli were rated on a seven-point scale for attractiveness and healthiness. Stimuli from targets were presented to a rater on a given day either in the prevaccination or the postvaccination condition.
Data Analyses
All statistical tests were performed using Jamovi v. 2.3.13 software. For consistency of raters’ assessments, see the results of intraclass correlation analysis in Schwambergová et al. (2021) for body odors ratings and Pátková et al. (2022) for facial images ratings.
Using a Shapiro-Wilk test and visual representation, we inspected whether the variables follow a normal distribution. To explore relationships in body odor characteristics (attractiveness, healthiness, and intensity), facial characteristics (attractiveness and associations between colors), and voice attractiveness, we employed Spearman's correlation as some abovementioned characteristics (body odor intensity prevaccination and postvaccination, vocal attractiveness postvaccination and facial healthiness prevaccination) showed significant departure from normal distribution. Where correlation coefficients between variables were ρ ≥ 0.8, only one of the variables was selected for subsequent analyses (Brown, 2015).
To assess changes in the perceived body odor, facial and vocal characteristics depending on the target's vaccination status (prevaccination vs. postvaccination), we employed linear mixed-effects models using the GAMLj jamovi module. In all models, the rated characteristic (e.g., attractiveness or healthiness) was entered as a dependent variable and vaccination condition as the fixed-effect factor. To control for variability in donors’ and raters’ characteristics, we set donor and rater IDs as a random-effects factors. We used the variance of random components to estimate the contribution of each random effect to variance of the dependent variable. This results in models such as Model attractiveness < - lmer (Attractiveness ∼ 1 + State (Condition) + (1|ID_rater) + (1|ID_donor/target)). Proportions of explained variability (pseudo R2) for linear mixed-effect models are reported as R2 marginal (R2M, proportion of variance explained by the fixed effects alone) and R2 conditional (R2C, proportion of variance explained by both the fixed and random effects). Unstandardized estimates of fixed-effect slopes from linear mixed-effect models are stated with 95% confidence intervals [CI] [LL, UL]. Analogous models were used to assess the relationship between facial attractiveness and healthiness and forehead and cheek lightness, redness, and yellowness, and associations between vocal attractiveness and vocal parameters.
Body height and weight may be associated with both perceived attractiveness (Skrinda et al., 2014) and the production of antibodies (Krams et al., 2014). We, therefore, explored associations between body height, weight and rated characteristics by using Spearman's correlations and found several significant associations (Table S22 in Supplemental materials). Consequently, we added body height and weight to the linear mixed-effects models, e.g., attractiveness < - lmer (Attractiveness ∼ 1 + State (Condition) + Height + Weight + (1|ID_rater) + (1|ID_target). For the ease of parsimony, we further present the results without these variables (models with height/weight are presented in Supplemental materials, see Table S23–S27).
To test the association between CRP levels and perceived body odor, facial and vocal characteristics, we employed linear regressions. Rated characteristics were entered in prevaccination or postvaccination conditions as dependent variables and with prevaccination or postvaccination CRP levels as covariates.
Results
See Table 1 for descriptive statistics of the analyzed variables, such as donors’ age, height, and weight, ratings of body odor quality, facial and vocal characteristics, and CRP levels.
Descriptive Statistics for Target's Age, Body Height, and Body Weight, Rating of Body Odor Attractiveness, Healthiness and Intensity, Facial Attractiveness and Healthiness, Vocal Attractiveness, Color Analysis, Vocal Analysis, and CRP Before Vaccination and 14 Days After Vaccination (N = 21).

Values denoted by * show mean minimum and mean maximum rating of samples.
CPP=cepstral peak prominence; CRP=C-reactive protein; HNR=harmonics-to-noise ratio; F0=fundamental frequency; F1-F4=formants.
Relationships Between Variables
Relationship Between Body Odor Characteristics
Ratings of prevaccination and postvaccination body odor characteristics were positively correlated. Odor intensity showed the strongest association (ρ = 0.721, p < .001, 95% CI [0.372, 0.890]), followed by healthiness (ρ = 0.437, p = .048, 95% CI [−0.015, 0.740]) and a comparable but not statistically significant correlation for attractiveness (ρ = 0.418, p = .06, 95% CI [−0.036, 0.730]). Ratings of body odor attractiveness and healthiness were positively and statistically significantly correlated both before (ρ = 0.883; p < .001, 95% CI [0.688, 0.960]) and after vaccination (ρ = 0.921; p < .001, 95% CI [0.780, 0.970]). Odor intensity ratings negatively and statistically significantly correlated with both attractiveness (prevaccination: ρ = −0.827, p < .001, 95% CI [−0.937, −0.570]; postvaccination: ρ = −0.520, p = .02, 95% CI [−0.789, −0.080]) and healthiness (prevaccination: ρ = −0.686, p < .001, 95% CI [−0.875, −0.320]; postvaccination: ρ = −0.538, p = .016, 95% CI [−0.799, −0.110]). Because the correlation between attractiveness and healthiness reached the predefined threshold of ρ ≥ 0.8, in subsequent analyses we used only attractiveness ratings.
Relationship Between Facial and Vocal Characteristics
Ratings of prevaccination and postvaccination facial characteristics were positively and statistically significantly correlated for both attractiveness (ρ = 0.930, p < .001, 95% CI [0.802, 0.980]) and healthiness (ρ = 0.554, p = .009, 95% CI [0.127, 0.810]). Ratings of facial attractiveness and healthiness were also positively and statistically significantly correlated with both the prevaccination (ρ = 0.706, p < .001, 95% CI [0.348, 0.880]) and postvaccination condition (ρ = 0.650, p = .001, 95% CI [0.261, 0.860]). The value of ρ did not reach the level of 0.8; in subsequent analyses we have therefore analyzed the two variables separately. Ratings of prevaccination and postvaccination vocal attractiveness were strongly positively correlated (ρ = 0.842, p < .001, 95% CI [0.598, 0.940]).
Relationships Between All Modalities
The attractiveness of body odor did not correlate statistically significantly with prevaccination facial (ρ = −0.066, p = .775, 95% CI [−0.484, 0.380]) or vocal attractiveness (ρ = 0.342, p = .129, 95% CI [−0.118, 0.680]), nor did it correlate with postvaccination facial (ρ = −0.118, p = .609, 95% CI [−0.524, 0.330]) or vocal attractiveness (ρ = −0.318, p = .540, 95% CI [−0.666, 0.140]). We observed no statistically significant correlation between facial and vocal attractiveness in the prevaccination condition (ρ = 0.317, p = .162, 95% CI [−0.144, 0.670]) but we did find it in the postvaccination condition (ρ = 0.505, p = .02, 95% CI [0.065, 0.780]).
Changes in Perception of Body Odor and Facial and Vocal Attractiveness
Linear mixed-effects models showed that body odor attractiveness (R2C = 0.261, R2M = 0.009) and intensity (R2C = 0.385, R2M = 0.003) were statistically significantly affected by the donor's condition (prevaccination vs. postvaccination); for details, see Table 2. In particular, the ratings of body odor attractiveness were higher (by 0.31 point on the scale) and body odor intensity ratings were lower (by 0.24 point on the scale) after vaccination than before it (see Figure 3).

Mean body odor (BO) attractiveness and intensity, facial attractiveness and healthiness, and vocal attractiveness ratings in the prevaccination versus postvaccination period. Error bars show 95% confidence intervals.
Differences in Body Odor Quality, Facial Characteristics, and Vocal Attractiveness in Relation to the Target's Condition.

Odor attractiveness ratings: target ID: random components variance = 0.469, SD = 0.685, ICC = 0.181, and rater ID: random components variance = 0.259, SD = 0.509, and ICC = 0.109. Odor intensity ratings: target ID: random components variance = 1.092, SD = 1.045, ICC = 0.333, and rater ID: random components variance = 0.268, SD = 0.518, and ICC = 0.109. Facial attractiveness ratings: target ID: random components variance = 0.906, SD = 0.952, and ICC = 0.420; rater ID: random components variance = 0.428, SD = 0.654, and ICC = 0.255. Facial healthiness ratings: target ID: random components variance = 0.683, SD = 0.826, and ICC = 0.297; rater ID: random components variance = 0.439, SD = 0.662, and ICC = 0.213. Vocal attractiveness ratings: target ID: random components variance = 1.218, SD = 1.104, and ICC = 0.419; rater ID: random components variance = 0.174, SD = 0.417, and ICC = 0.093.
95% CI=95% confidence interval; ICC=intraclass correlation; LL=lower limit; UL=upper limit; SE=standard error.
We found a statistically significant effect of the target's condition (prevaccination vs. postvaccination) on perceived facial attractiveness (R2C = 0.517, R2M = 0.003) and perceived healthiness (R2C = 0.411 R2M = 0.003): donors were rated as less attractive (by 0.17 point on the scale) and less healthy (by 0.16 point on the scale) after vaccination than before it (see Table 2 for details and Figure 3). In the case of vocal attractiveness, the model (R2C = 0.452, R2M < 0.001) showed no statistically significant effect of the donor's condition (prevaccination vs. postvaccination).
Changes in Facial Coloration
Left and right cheek measures of skin lightness (ρ = 0.801, p < .001), redness (ρ = 0.861, < 0.001), and yellowness (ρ = 0.925, p < .001) were statistically significantly positively associated. In all further analyses, we have therefore used only the left cheek color values (for details, see Supplemental Table S9–S16).
Linear mixed-effects models showed that lightness was not statistically significantly affected by the target's condition (prevaccination vs. postvaccination) on neither the cheek (R2C = 0.848, R2M = 0.007) or the forehead (R2C = 0.354, R2M = 0.012) and neither cheek (R2C = 0.843, R2M = 0.0003) nor forehead (R2C = 0.545, R2M = 0.0001) redness were statistically significantly affected by the target's condition. Target's condition also did not statistically significantly predict cheek (R2C = 0.850, R2M = 0.002) or forehead (R2C = 0.488, R2M = 0.00009) yellowness (for details, see Table 3).
Differences in Facial Skin Coloration Depending on the Target's Condition.
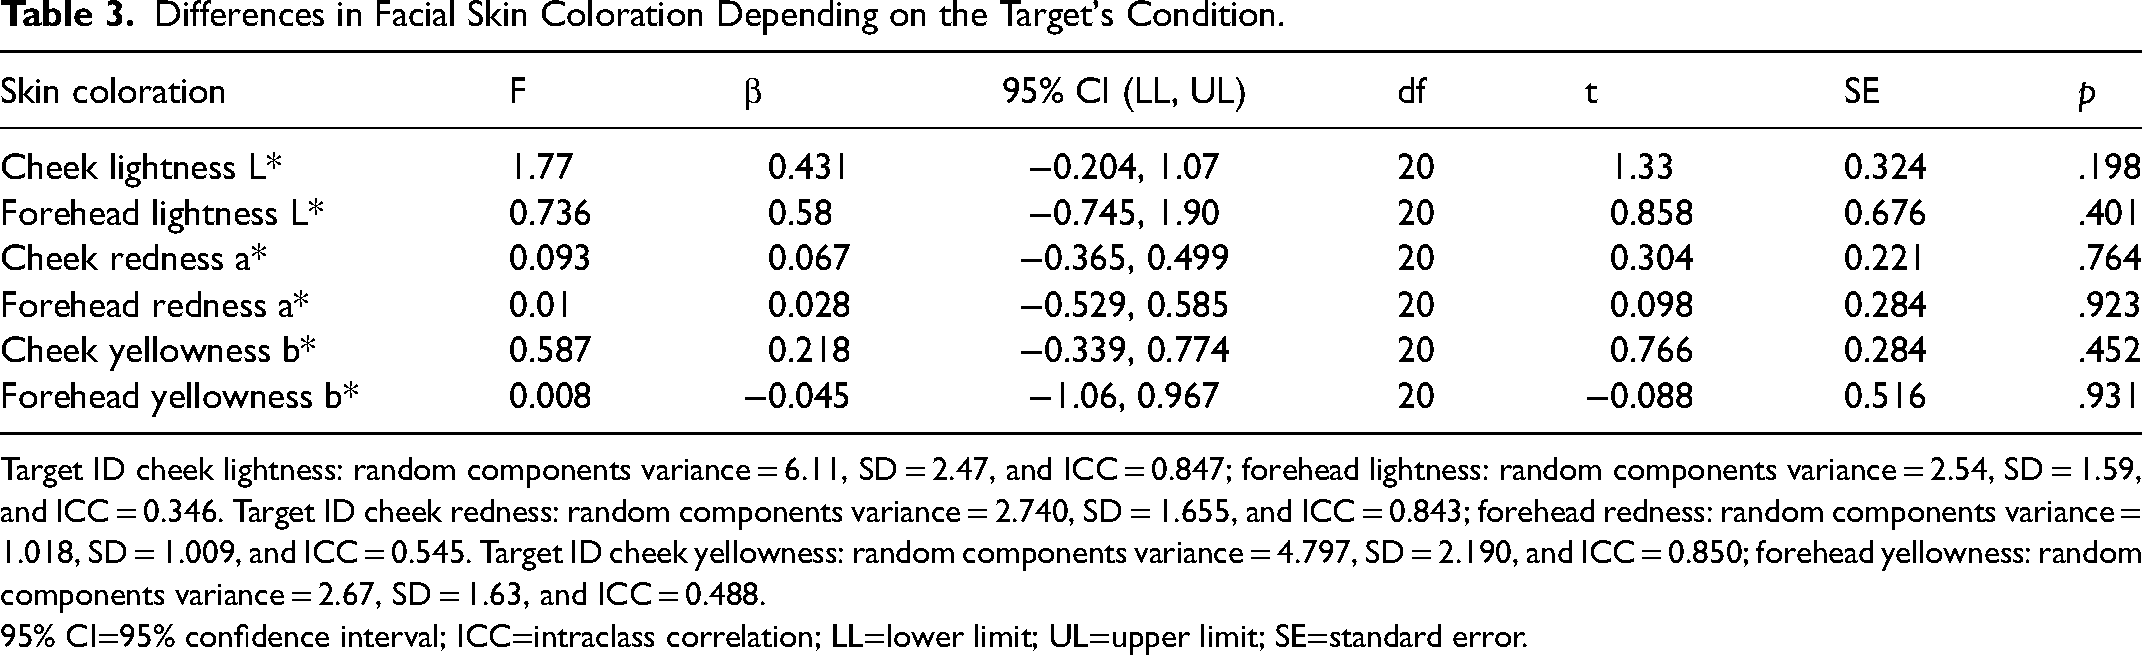
Target ID cheek lightness: random components variance = 6.11, SD = 2.47, and ICC = 0.847; forehead lightness: random components variance = 2.54, SD = 1.59, and ICC = 0.346. Target ID cheek redness: random components variance = 2.740, SD = 1.655, and ICC = 0.843; forehead redness: random components variance = 1.018, SD = 1.009, and ICC = 0.545. Target ID cheek yellowness: random components variance = 4.797, SD = 2.190, and ICC = 0.850; forehead yellowness: random components variance = 2.67, SD = 1.63, and ICC = 0.488.
95% CI=95% confidence interval; ICC=intraclass correlation; LL=lower limit; UL=upper limit; SE=standard error.
Association Between Facial Attractiveness and Healthiness and Facial Coloration
Linear mixed-effects model testing the effect of skin color on perceived facial attractiveness before vaccination (R2C = 0.540, R2M = 0.190) showed that forehead redness was the only statistically significant predictor, and it had a negative slope. The same applies to the linear mixed-effects model of the association between skin color and perceived facial healthiness before vaccination (R2C = 0.491, R2M = 0.182), where forehead redness negatively affected facial healthiness ratings (for more details, see Pátková et al., 2022 or Supplemental Table S18–S21).
A linear mixed-effects model of the effect of skin color on perceived facial attractiveness after vaccination (R2C = 0.562 R2M = 0.076) showed no effect of skin color. A separate mixed-effects model had likewise shown that perceived facial healthiness after vaccination was not affected by the skin color (R2C = 0.461, R2M = 0.053). For details, see Table 4.
The Relationship Between Perceived Characteristics and Facial Coloration.
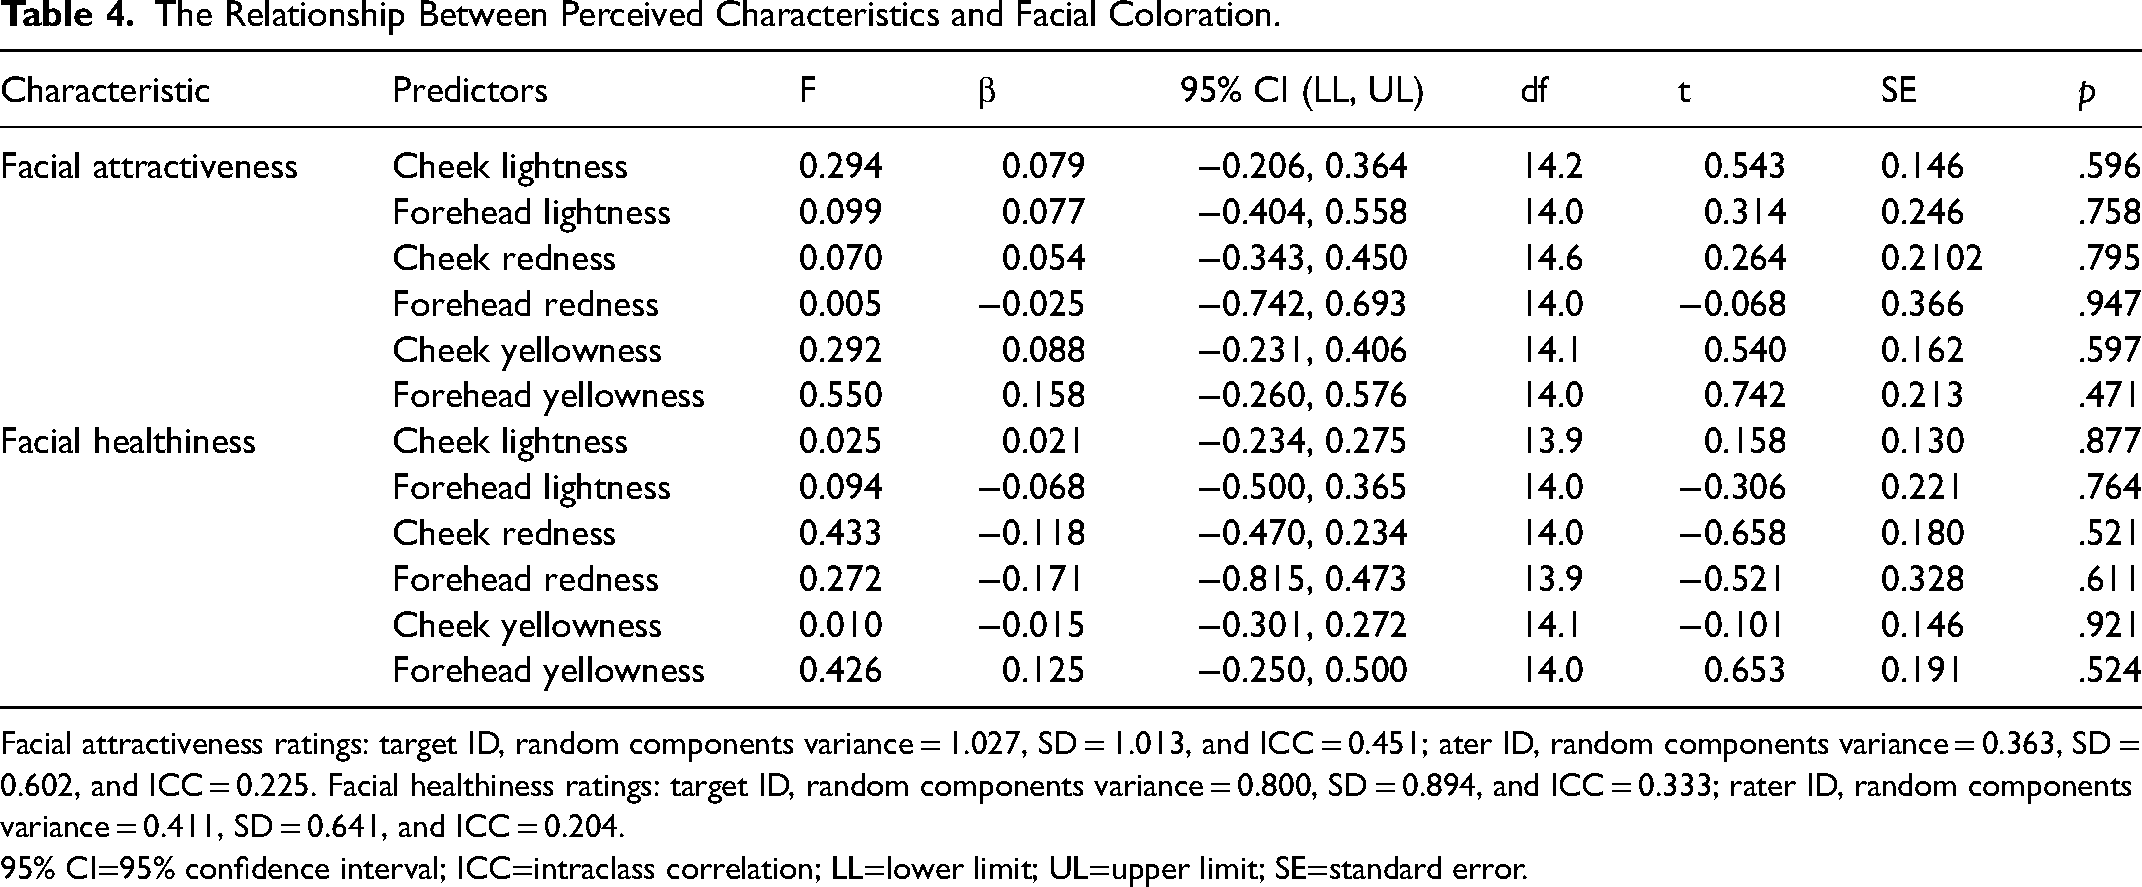
Facial attractiveness ratings: target ID, random components variance = 1.027, SD = 1.013, and ICC = 0.451; ater ID, random components variance = 0.363, SD = 0.602, and ICC = 0.225. Facial healthiness ratings: target ID, random components variance = 0.800, SD = 0.894, and ICC = 0.333; rater ID, random components variance = 0.411, SD = 0.641, and ICC = 0.204.
95% CI=95% confidence interval; ICC=intraclass correlation; LL=lower limit; UL=upper limit; SE=standard error.
Changes in Acoustic Measures
A linear mixed-effects model showed that CPPs (R2C = 0.389, R2M = 0.016), HNR (R2C = 0.673, R2M = 0.004), F0 (R2C = 0.245, R2M = 0.048), F1 (R2C = 0.150, R2M = 0.001), F2 (R2C = 0.364, R2M = 0.018), F3 (R2C = 0.325, R2M = 0.016), and F4 (R2C = 0.475, R2M = 0.005) were not significantly affected by the target's condition (prevaccination vs. postvaccination); for details see Table 5.
Differences in Acoustic Measures Depending on the Target's Condition.

Target ID: CPPs random components variance = 0.921, SD = 0.960, and ICC = 0.379, HNR random components variance = 1.503, SD = 1.226, and ICC = 0.671, F0 random components variance = 149.0, SD = 12.2, and ICC = 0.206, F1 random components variance = 978, SD = 31.3, and ICC = 0.150, F2 random components variance = 2705, SD = 52.0, and ICC = 0.352, F3 random components variance = 5984, SD = 77.4, and ICC = 0.314, F4 random components variance = 12116, SD = 110, and ICC = 0.472.
95% CI=95% confidence interval; CPP=cepstral peak prominence; HNR=harmonics-to-noise ratio; F0=fundamental frequency; F1-F4=formants; ICC=intraclass correlation; LL=lower limit; UL=upper limit; SE=standard error.
Association Between Vocal Attractiveness and Acoustic Measures
A linear mixed-effects model showed that prevaccination vocal attractiveness was statistically significantly affected by the target's CPPs (R2C = 0.453, R2M = 0.06). Higher CPPs predicted a target's voice being rated as more attractive (for details, see Table 6).
Relationships between Acoustic Measures (CPPs, HNR, F1–F4, and F0) and Perceived Vocal Attractiveness.
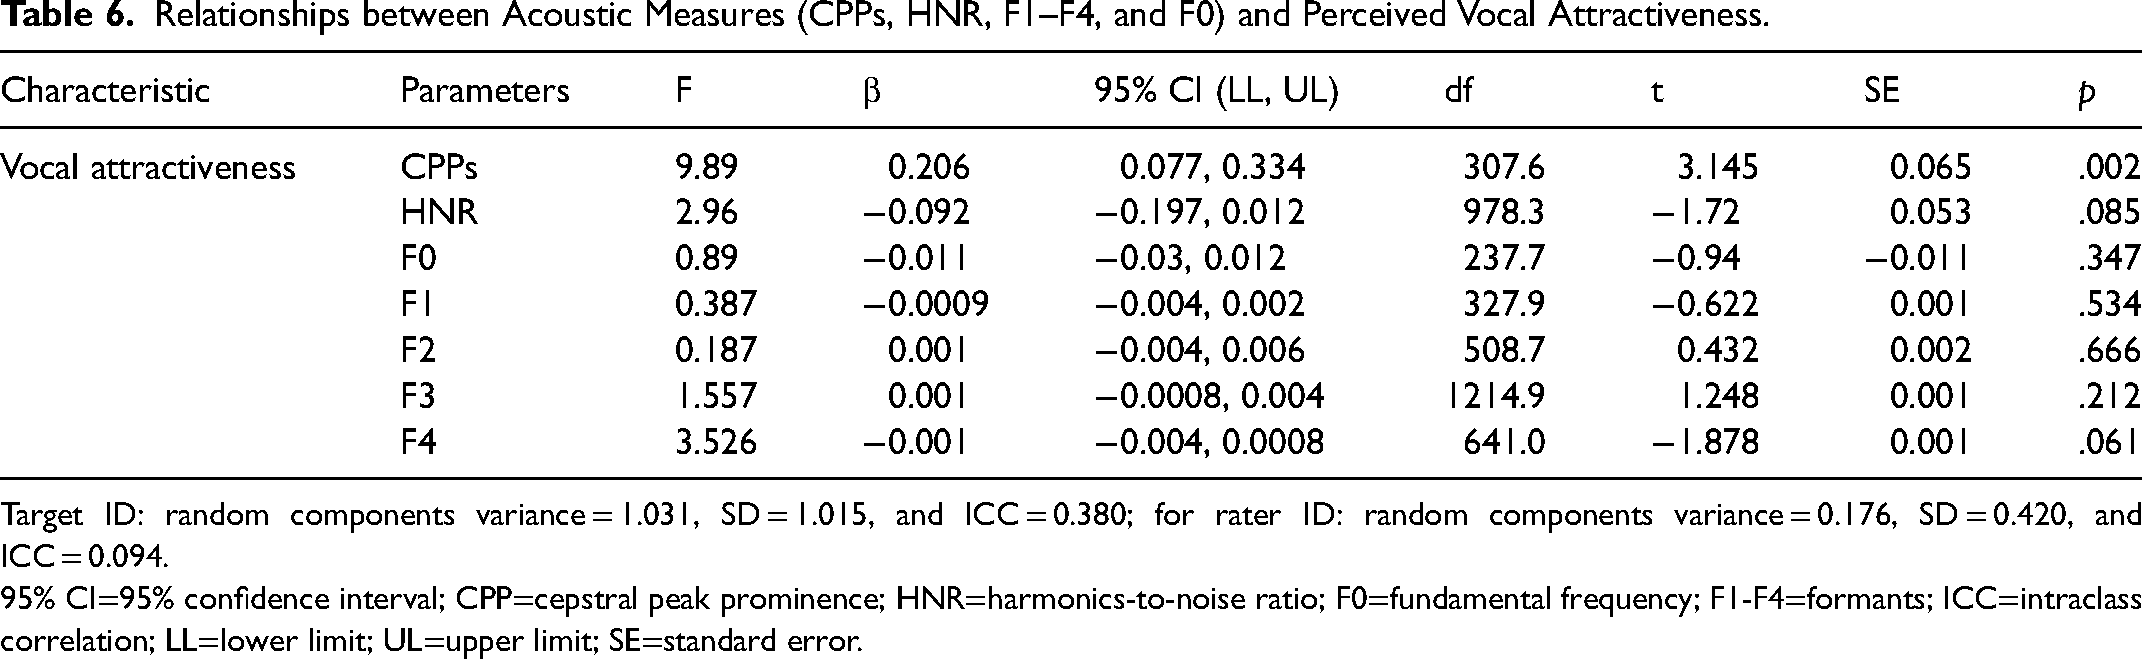
Target ID: random components variance = 1.031, SD = 1.015, and ICC = 0.380; for rater ID: random components variance = 0.176, SD = 0.420, and ICC = 0.094.
95% CI=95% confidence interval; CPP=cepstral peak prominence; HNR=harmonics-to-noise ratio; F0=fundamental frequency; F1-F4=formants; ICC=intraclass correlation; LL=lower limit; UL=upper limit; SE=standard error.
Associations Between Body Height, Body Weight and Body Odor, Face, and Voice Ratings
We observed a statistically significant positive correlation between body odor attractiveness (ρ = 0.601, p = .004, 95% CI [0.275, 0.836]) in the prevaccination condition with the body height of the targets. Moreover, we found a statistically significant negative association between facial healthiness in postvaccination condition and the body weight of the targets (ρ = −0.554, p = .009, 95% CI [−0.752, −0.054]). Finally, we found statistically significant positive correlations between body height and vocal attractiveness in both conditions (prevaccination: ρ = 0.650, p = .001, 95% CI [−0.020, 0.718] and postvaccination: ρ = 0.554, p = .009, 95% CI [−0.037, 0.710]). For details, see Table S22 in Supplemental materials.
Relationship Between CRP and Body Odor, Face, and Voice Ratings
The mean CRP levels did not statistically significantly differ between the two conditions (prevaccination vs. postvaccination; F (1, 20) = 1.41, β = 1.06, 95% CI [−0.690, 2.81], p = .249 (R2C = 0.297, R2M = 0.024). Nevertheless, prevaccination CRP levels were negatively associated with prevaccination body odor attractiveness (F (1, 19) = 6.43, β = −0.291, 95% CI [−0.531, −0.05], p = .02, R2 = 0.213) and positively predicted by prevaccination body odor intensity (F (1, 19) = 5.48, β = 0.396, 95% CI [0.042, 0.750], p = .03, R2 = 0.224). Interestingly, though, postvaccination CRP levels predicted neither postvaccination body odor attractiveness (F (1, 19) = 0.025, β = 0.006, 95% CI [−0.08, 0.09], p = .876, R2 = 0.001) nor postvaccination odor intensity (F (1, 19) = 0.015, β = −0.007, 95% CI [−0.130, 0.115], p = .904, R2 = 0.0007).
Moreover, prevaccination CRP levels negatively predicted prevaccination facial attractiveness rating (F (1, 19) = 8.85, β = −0.419, 95% CI [−0.714, −0.124], p = .008, R2 = 0.318) but not the prevaccination healthiness rating (F (1,19) = 1.13, β = −0.168, 95% CI [−0.498, 0.163], p = .302, R2 = 0.060). We found no relationship between postvaccination CRP levels and postvaccination facial attractiveness (F (1,19) = 1.63, β = −0.06, 95% CI [−0.157, 0.04], p = .217, R2 = 0.079) or healthiness (F (1,19) = 0.430, β = −0.027, 95% CI [−0.117, 0.061], p = .520, R2 = 0.022).
We found no relationship between prevaccination CRP levels and prevaccination vocal attractiveness (F (1,19) = 2.39, β = −0.301, 95% CI [−0.710, 0.107], p = .139, R2 = 0.112). An analogous result was observed in the postvaccination condition (F (1,19) = 0.739, β = −0.117, 95% CI [−0.213, −0.02], p = .401, R2 = 0.039).
Discussion
The aim of this study was to test whether immunoactivation affects perceived characteristics of body odor, face, and voice. We stimulated the immune system activation using vaccines against viral and bacterial agents (hepatitis A/B and meningococcus) and collected body odor samples, facial photographs, and voice recordings before vaccination and 14 days after it. Contrary to our expectations, we found that body odor samples were rated as more attractive and less intense 14 days after vaccination. The opposite effect, which was in line with predictions, was observed in the facial photographs which were perceived as less attractive and less healthy after vaccination. The vocal attractiveness did not differ between the prevaccination and postvaccination conditions. Interestingly, prevaccination CRP levels were negatively associated with body odor and facial attractiveness ratings.
The effect sizes in our study were rather small, ranging mostly between 0.10 and 0.29. The largest postvaccination effect size was found for body odor attractiveness (an increase by 0.31 points on a 7-point scale), followed by the change in body odor intensity (a decrease of 0.17 points), facial attractiveness (a decrease of 0.17 points), and facial healthiness (a decrease of 0.16 points). Concerning the CRP results, the largest effect size was found for facial attractiveness (β = −0.419), meaning that for each one-unit increase in the CRP, facial attractiveness decreased by 0.419 units. The results were similar for body odor attractiveness (β = −0.291), meaning that for each one-unit increase in the CRP, facial attractiveness decreased by 0.291 units. Moreover, CRP variation explains between 21% and 31.8% of variance of perceived attractiveness.
Olfactory cues may be helpful because they can often be assessed from a distance, thus allowing others to avoid potential infection. Moreover, these cues can be perceived from the environment and under conditions where cues from other senses (hearing and sight) are unavailable. The results of previous animal and human studies show a decrease in preference for the odor of sick individuals (for a review, see Schwambergová et al., 2023), often shortly after the onset of immune reaction to illness or even in cases where symptoms of a disease are no longer present. For example, men who recovered after the acute stage of gonorrhea were more likely to be associated with a floral smell (Moshkin et al., 2012). The impact of infection on body odor can be tested by comparing odor samples from a person collected when the person is ill and the same person is healthy, but this approach is logistically challenging and the variability of naturally occurring diseases is high. This is why in experimental conditions, researchers try to simulate a disease by administering an LPS injection which activates the innate immune response (e.g., Henderson et al., 2017; Olsson et al., 2014). An alternative method is vaccination (Shattuck & Muehlenbein, 2015) whose application can induce side effects comparable to the symptoms of a disease (Di Pasquale et al., 2016), because in both conditions the immune response is activated. Although negative changes in body odor could occur within a few hours (Olsson et al., 2014) or days (Sarolidou et al., 2020) after immunoactivation, our aim was to wait for a sufficient increase in specific antibodies (see Schwambergová et al., 2021). Therefore, we collected our samples 2 weeks after vaccination, at a time when one could expect the immune reaction to peak (Palm & Medzhitov, 2007). One may speculate that when the putative negative effects of immune system activation diminish and body odor returns to its baseline quality, this positive change may be at some point magnified, perhaps just about two weeks after immunization. A positive shift in the attractiveness of body odor after activation of the immune system could thus serve as an indicator of a higher-quality male who can successfully cope with a disease.
When it comes to judgments of attractiveness, visual perception in humans is usually considered the most crucial. In several previous studies, facial photographs of participants after activation of the immune system were rated as less attractive (Axelsson et al., 2018; Regenbogen et al., 2017). Moreover, these studies have shown that raters can discriminate between individuals with an activated immune system and healthy controls within a few hours after activation based on their faces (Arshamian et al., 2021). Among visual facial characteristics, skin coloration is the most sensitive to changes associated with illness (Cai et al., 2019; Henderson et al., 2017). Our results show that faces were rated as less attractive and less healthy 2 weeks after vaccination, although we found no statistically significant changes in postvaccination skin color as measured directly in vivo using a spectrophotometer or from photographs. The explanation thus cannot rely solely on changes in the lightness, redness, or yellowness of the skin. One might argue that raters could notice other cues not analyzed in this study, such as skin texture, drooping mouth corners or degraded hair quality after vaccination, which in turn may affect attractiveness and healthiness judgments.
The vocal samples in our study showed no statistically significant change in attractiveness ratings between the prevaccination and postvaccination condition. We also found no differences in voice acoustics, such as a smoothed CPP, which was previously shown to be the best acoustic predictor of perceptual voice quality (Eadie & Baylor, 2006), or the fundamental frequency. Previous studies suggest that infections and immune activity may affect vocal acoustics. For example, male mice shortly after LPS administration produced a lower number of regular ultrasonic syllables and a larger number of high-frequency ultrasonic syllables (Lopes & König, 2016). In humans, fundamental frequency negatively influenced healthiness ratings, although raters were not able to accurately assess the health status of male speakers based on their voices (Albert et al., 2021). It is likely that changes in the voice and other sounds are linked to symptoms of acute illness, such as hoarseness, sneezing, or coughing, which are rated disgusting (Michalak et al., 2020). During the voice recordings, our participants did not exhibit any such symptoms in the postvaccination condition. Like in previous studies, we found that CPPs affected attractiveness ratings positively (Balasubramanium et al., 2012).
Attractive characteristics are frequently considered to serve as cues to individual's health status perceptible by one's senses. However, the patterns of our findings regarding changes in ratings before and after vaccination differed between the three selected modalities. Multisensory integration plays an important role in overall perception of others because deployment of multiple sensory channels can yield a more reliable assessment. In general, multimodal perception has been considered in the context of two main hypothesis: the “multiple messages” hypothesis, which proposes that each cue or signal provides unique and independent (i.e., nonredundant) information about the individual's condition and quality, or the “backup signals” hypothesis, according to which cues or signals provide similar and overlapping (i.e., redundant) information (Moller and Pomiankowski, 1993). There is robust evidence that a combination of faces with voices or odors—as opposed to presenting each of these modalities separately—can significantly affect judgments of overall attractiveness (Ferdenzi et al., 2016; Regenbogen et al., 2017). Although the visual modality is considered the most important in humans, other modalities may serve as additional sources for the formation of the overall judgment (Groyecka et al., 2017). Our results can be interpreted in line with the multiple messages hypothesis, because each modality may have carried different information about the individual's condition, and this was reflected in the ratings (Třebický et al., 2022).
It was previously shown that body height is associated with immune responsiveness such as, the ability to produce antibodies in men (Krams et al., 2014) and body size may also affect facial and vocal attractiveness (Skrinda et al., 2014). Similarly, the adipose tissue level might have immunomodulatory properties and affect attractiveness ratings (Pawłowski et al., 2017). In our dataset, we did not find any significant association between body height and immune response or body mass index/adipose tissue and immune response to vaccination (Pátková et al., 2022; Schwambergová et al., 2021). However, we did find a positive association between body height and perceived body odor attractiveness, vocal attractiveness and a negative association between body weight and facial healthiness. These results are consistent with previous evidence as body size was positively associated with vocal attractiveness (e.g., Pisanski et al., 2012). Higher facial adiposity, with its link to body size, was consistently judged to be less attractive and healthy (De Jager et al., 2018). However, to the best of our knowledge, there is no similar evidence of links between body odor attractiveness and body size.
Furthermore, our results demonstrate a high sensitivity of human smell and sight to subtle cues of inflammation. CRP is a marker of inflammation processes and its elevation reliably shows currently ongoing infection and/or inflammation in the body. In the prevaccination condition, CRP levels of our sample did not exceed 5.5 mg/L, that is, levels considered clinically insignificant and normal. Such variations ∼5.5 mg/L may be caused by a small local inflammation. On the other hand, there are also other factors that can affect CRP variation, such as age, sex, smoking status, weight, lipid levels, and blood pressure (Sproston & Ashworth, 2018). Still, our results showed a negative relationship between prevaccination CRP levels and perceived body odor and facial attractiveness, which suggests that even a subtle increase in CRP levels can be perceived by smell or sight. This negative association was found only in the prevaccination condition, which may indicate that vaccination may temporarily disrupt the naturally occurring links between normal CRP levels and the perception of current health status.
Although most studies focus on the perception of health in the context of mate choice, identification of infected conspecifics is beneficial not only during selection of potential mates. In the context of mate choice, it is the between-individual differences in health cues that might be of particular relevance. In contrast, in interactions with nonstrangers, the within-individual variation in current health might be more relevant because it may help to avoid acutely ill individuals and thus lower the risk of infection. Detection of various cues to threats in the environment and within the social group is the cornerstone of complex avoidance mechanisms and it can lead to behaviors that lessen the risk of contagion. This “behavioral immune system” consists of psychological mechanisms responsible for avoidance behavior (Schaller & Park, 2011). The main task of this system is to detect possible contaminants, elicit affective reactions, and facilitate avoidance of prolonged exposure to pathogen sources. Our results provide some support for the function of behavioral immune system in terms of modulation of perceived attractiveness after immunoactivation.
Limitations
Although comparable with previous studies on the perception of body odor quality (see Moshkin et al., 2012 or Regenbogen et al., 2017), an unfortunate limitation of the present study is the low sample size of targets. We faced considerable difficulties in recruiting participants mostly because of their hesitation to participate in a “vaccination” study due to the antivaccination movement (even before COVID-19 pandemic). Among those willing to volunteer, it was also difficult to find those who met all the inclusion criteria, chiefly that of not being vaccinated against hepatitis A/B or meningococcus in the past 10 years. Vaccination against hepatitis B has been included in the compulsory vaccination protocol in the Czech Republic in 2001 (e.g., Bozzola et al., 2018) and revaccination in adolescence is also highly recommended (Shepard et al., 2006). Furthermore, there was no control group of donors (injected with an empty solvent or saline) who could be compared to the (vaccinated) experimental group in terms of changes in odor, facial, and vocal cues. This is because our sample size was already limited and splitting it into two groups would considerably lower the statistical power of the study. Future studies should certainly include a control group whose results would help interpret the temporal fluctuations in the followed characteristics.
Furthermore, the project focused mainly on humoral adaptive immunity, in particular the increase of specific antibodies after vaccination, and its effect on body odor quality (see Schwambergová et al., 2021) and perceived facial attractiveness (see Pátková et al., 2022). It should be noted that the most distinctive changes in body odor, face, or voice may take place shortly after administration of a vaccine (typically a few hours to a few days after injection), as demonstrated by studies that used LPS (Henderson et al., 2017; Olsson et al., 2014). The choice of sampling 2 weeks after vaccination may thus be appropriate for assessing the increase in antibody levels—which was our main goal in two other studies based on the same dataset (Pátková et al., 2022; Schwambergová et al., 2021)—but less so for assessing the perceptual cues linked to acute sickness.
Conclusions
The aim of this study was to test the role of multiple sensory cues in assessing the current health status. Our findings show that changes in the perceived qualities of body odor and facial attractiveness after vaccination do take place. Body odor attractiveness increased and facial attractiveness decreased 14 days after vaccination compared to the prevaccination state. These results can be interpreted as providing support for the multiple messages hypothesis, because each modality may have carried different information regarding the individual's condition. Moreover, we found that prevaccination CRP levels negatively predicted body odor and facial attractiveness, which shows that even subtle changes within relatively low CRP levels can manifest as slight changes in body odor and facial appearance. This ability to distinguish minor nuances in the health status may help in distinguishing healthier mates and social partners.
Supplemental Material
sj-docx-1-evp-10.1177_14747049231218010 - Supplemental material for Immunoactivation Affects Perceived Body Odor and Facial but Not Vocal Attractiveness
Supplemental material, sj-docx-1-evp-10.1177_14747049231218010 for Immunoactivation Affects Perceived Body Odor and Facial but Not Vocal Attractiveness by Dagmar Schwambergová, Žaneta Pátková, Jitka Třebická Fialová, Vít Třebický, David Stella and Jan Havlíček in Evolutionary Psychology
Footnotes
Acknowledgments
We would like to thank Naděje Kočnarová, MD, for medical examination, Anna Pilátová, Ph.D., for proofreading, Pavel Šebesta for assistance with voice analyses, and our participants for making this study possible.
Declaration of Conflicting Interests
The authors declared no potential conflicts of interest with respect to the research, authorship, and/or publication of this article.
Funding
The authors disclosed receipt of the following financial support for the research, authorship, and/or publication of this article: This project was supported by the Charles University Grant Agency, project GAUK No. 1398218 and GAUK No. 1374319; Czech Science Foundation (GAČR 19-11822S) and Owen F. Aldis Scholarship.
Supplemental Material
Supplemental material for this article is available online.
References
Supplementary Material
Please find the following supplemental material available below.
For Open Access articles published under a Creative Commons License, all supplemental material carries the same license as the article it is associated with.
For non-Open Access articles published, all supplemental material carries a non-exclusive license, and permission requests for re-use of supplemental material or any part of supplemental material shall be sent directly to the copyright owner as specified in the copyright notice associated with the article.