
Abstract
Recent discussions have highlighted the importance of fertility measurements for the study of peri-ovulatory shifts in women’s mating psychology and mating-related behaviors. Participants in such studies typically attend at least two test sessions, one of which is, at least in theory, scheduled to occur during the high-fertility, peri-ovulatory phase of the menstrual cycle. A crucial part of this debate is whether luteinizing hormone (LH) tests alone are sufficient to accurately assign test sessions to the peri-ovulatory phase. This article adds to this ongoing debate by presenting analyses of a detailed database of daily estradiol levels and LH tests for 102 menstrual cycles. Based on more than 4,000 hormonal measurements, it is clear that individual differences in length of the cycle, length of the luteal phase and, perhaps most importantly, the discrepancy between the timing of the LH surge and the drop in estradiol that follows it are pronounced. Less than 40% of analyzed cycles followed the textbook pattern commonly assumed to occur in fertility-based research, in which the LH surge is assumed to occur not more than 48 hr before the estradiol drop. These results suggest that LH tests alone are not sufficient to assign test sessions to the peri-ovulatory phase and that analyses of sex hormones are essential to identify whether the participant was tested during the peri-ovulatory phase.
Keywords
Whether women’s mate preferences and mating-related behaviors change during the high-fertility (i.e., peri-ovulatory) phase of the menstrual cycle so that women direct their attention and mating effort toward men displaying cues of good genes (Gangestad & Thornhill, 1998; Penton-Voak et al., 1999) has been extensively debated over the last 5 years. When investigating this peri-ovulatory shifts hypothesis, the authors aim to compare women’s preferences and behaviors during the fertile phase of the menstrual cycle and low-fertility phases. After many years of research, there is still considerably little agreement about the robustness of claimed cyclic shifts, with some researchers arguing that cyclic changes in factors such as mate preferences are reliable, while other researchers have demonstrated they are not (Gangestad, 2016; Gildersleeve et al., 2014; B. C. Jones et al., 2018, 2019; Marcinkowska et al., 2017; Wood et al., 2014). There are two crucial issues in the discussion on cyclical shifts: (1) methodological concerns related to identifying the fertile window within the cycle and (2) underestimating the complexity of determinants of women’s preferences (i.e., not considering women’s relationship status, self-judged attractiveness, or sexual openness).
In a typical ovulatory menstrual cycle, during the initial period of about 2 weeks (follicular phase), the follicle develops in the ovary. After maturation, high doses of estradiol are secreted from the ovary, the follicle ruptures, and an egg is released (ovulation occurs). Luteinizing hormone (LH) is a pituitary hormone secreted in response to increased levels of bloodstream estradiol. The LH surge usually initiates 35–44 hr before the ovulation (Cahill et al., 1998) and, together with the midcycle abrupt decline in estradiol levels (Lipson & Ellison, 1996), can be used as a reliable physiological estimate of the fertile window within a menstrual cycle (Dunson et al., 2001). After ovulation, the dominant follicle transforms into corpus luteum and begins releasing high doses of progesterone until the next menstrual bleeding occurs (R. Jones & Lopez, 2014).
Ever since the first mentions of the fertile window being around the 14th day of the menstrual cycle (Ogino, 1930), its duration has been established to be 48 hr on average, based on the basal body temperature (BBT; Siegler, 1944). Studies based on BBT observed increased fecundity starting from 5 days before the peak temperature, reaching its maximum (.3 probability of pregnancy per sexual intercourse) 2 days after the peak temperature (Barrett & Marshall, 1969). Two other methods that can be efficiently conducted outside a laboratory setting are monitoring mucus characteristics and salivary ferning, yielding 48% and 37% accuracy, respectively (Guida et al., 1999). A more recent study showed that combining mucus observation with simultaneous monitoring of LH levels provides best possible accuracy, that is, 97–99%, with peak fertility occurring 24 hr from the first positive result of the LH test (Leiva et al., 2017). Another marker of ovulation is an abrupt decline in the ratio of urinary estradiol and progesterone metabolites (Baird et al., 1991). The hormonal ratio was found to indicate the exact day of ovulation with .65 probability (Dunson et al., 2001). The only accessible direct measure of releasing the follicle from the ovary is ultrasound scanning (even though it was initially suggested to potentially induce ovulation itself; Dunson et al., 2001). This most accurate method is also the most invasive one and virtually impossible to implement in large-scale, nonlaboratory setting studies (which describes most fertility-based studies of sexual preferences).
Following recent research aimed at establishing the most accurate methodology (Blake et al., 2016) and underlining the importance of replication and validation of previously established paradigms (Marcinkowska et al., 2017), I would like to offer additional insight into fertility-based studies of human sexual preferences based on the detailed database of menstrual cycles I gathered in south Poland between 2004 and 2008. I hope to complement and provide further support for previously published discussion (Bachofner & Lobmaier, 2018; Blake, 2018; Lobmaier & Bachofner, 2018; Roney, 2018; Wallen, 2018) with more examples of good practices and recommendations for future tests of cyclic shifts in mate preferences and mating-related behaviors.
The database is arguably unique due to the robustness of hormonal measurements conducted per cycle: 15 daily measurements of two sex hormones. All daily samples were assayed in duplicates to increase the robustness of hormone measures. Moreover, recruitment was not limited solely to university students (mean age = 28 years, SD = 4.6 years), which means the data and conclusions are arguably more generalizable to the population level. Creation of this database of hormonal measurements has been costly in terms of both time and finance; hence, it is worth sharing with a broader audience in the hope that it will prove useful. Multiple articles based on this data set have been published to date (Dixson et al., 2018; Marcinkowska et al., 2017, 2018, 2019; Reynolds et al., 2018; Richards et al., 2018). This data set provides an important insight into the hormonal underpinnings of any possible cyclical fluctuations among reproductive age, contemporary women from an industrialized country.
Method
Participating women (n = 102) were between 21 and 37 years of age (mean = 28.8, SD = 4.6), did not have any medical conditions that could affect levels of reproductive steroid hormones, had been neither pregnant nor breastfeeding in the 3 months before recruitment, and had regular menstrual cycles (i.e., a difference in length between consecutive cycles of 5 days or less). Participants were asked to collect saliva samples each morning starting from the first day of menstrual bleeding, until the end of the menstrual cycle (i.e., the day before the onset of the next menstrual bleeding). Women were verbally instructed by the principal investigator concerning collecting and storing the saliva and were given a set of 2-ml centrifuge tubes with the minimum amount of required saliva marked on a tube together with written instructions. All participants received LH kits. Each kit consisted of sterilized urine cups and 10 LH tests. Women were instructed to conduct the tests from the 10th until the 20th day of the cycle or until a positive result was obtained.
Saliva samples were collected in the morning, preferably before eating, drinking, or smoking, or not earlier than 30 min after eating, drinking, or smoking. Immediately after collection, samples were frozen in the participant’s home freezer. After the end of the cycle, samples were transported in portable freezers to the laboratory where hormonal assays for measurements of 17-β-estradiol (E2) and 17-α-hydroxy-progesterone (P) were conducted. Hormonal measurements were conducted using commercially available hormonal assays of DRG International, Inc. ELISA plates SLV4188 (sensitivity: 0.4 pg/ml, standard range: 1–100 pg/ml) for E2 and SLV3140 for P (sensitivity: 2.5 pg/ml, standard range: 10–5,000 pg/ml). All samples were assayed in duplicates. The quality of hormonal measurements was monitored for each plate separately by including samples of known concentrations with low and high E2 and P levels. Inter-assay variability was 10.1%, intra-assay variability was 7.5% for E2 and 14.1% and 4.9% for P, which is within acceptable values for steroid sex hormones assays (Schultheiss & Stanton, 2009).
Results and Discussion
Cycle Description
The mean duration of the cycle was 28.25 days (Min = 21, Max = 36, SD = 2.95). Peak fertility was assessed by two independent methods: the result of LH tests and daily measurements of E2. Positive LH test results were obtained in 75 of the cycles, and midcycle E2 drops were observed in 91 cycles. LH surge occurred, on average, 14.4 days before the onset of the next menses (Min = 8, Max = 23, SD = 2.43) and E2 drop occurred, on average, 13.2 days before the onset of the next menses (Min = 6, Max = 19, SD = 2.67).
LH Surge Verification
Although LH test producers claim that once the intensity of the test line reaches the control line ovulation is most likely to occur, a significant number of participants in our sample did not obtain a positive LH test result throughout the entire cycle. LH tests depend on average (i.e., “normal”) hormonal ranges, which may not correspond with those of individual participants (Direito et al., 2013). Of the 102 participants, 75 confirmed obtaining a positive LH result. Eleven of them reported that the test line appeared but never reached the intensity of the control line. Of that group E2 drop was not recorded for only one, meaning that for the remaining 10 cycles, although the results of LH tests were “negative” (defined by the producer), there may still have been ovulation, as signaled by the E2 drop. For further analyses, a total number of 75 women have been included in the “LH surge present” group (including all women for whom a pale control line appeared, Electronic Supplementary Material [ESM] 1).
There are two reasons why an LH test would not detect ovulation. The usual cutoff point (and one used in this study) for obtaining a positive result of the LH test is 25 mIU/ml. Sensitivity (true positive result) and specificity (true negative result) for a 25 mIU/ml test are 0.54 (0.29–0.77) and 0.97 (0.95–0.98), respectively (Leiva et al., 2017). Another cause of misdetection is variety in LH fluctuation patterns. Based on 43 regularly cycling women, the onset of urinary LH surge was categorized into rapid-onset type (within 1 day, 42.9%) and gradual-onset type (over 2–6 days, 57.1%). Configurations of LH surge can be categorized into three types: (a) spiking (41.9%); (b) biphasic (44.2%); and (c) plateau (13.9%), and two (4.3%) women demonstrated LH surge without ovulation. (Su et al., 2017).
LH Surge versus Estradiol-Based Fertility Peak

Averaged levels of estradiol (pg/ml) for cycles with positive luteinizing hormone (LH) test result (solid gray line), cycles with a positive LH test result and estradiol drop observed 48 hr after (solid orange line), and cycles without a positive result of LH test (dotted line, centered around −14 day of the cycle).
Interestingly, for 22 women, although LH surge was not recorded, E2 drop was observed during the cycle. This occurred in 81% of cycles from the group with negative results of the LH tests. It is possible that these women did experience ovulation, but based on results of the LH tests, their cycles could have been erroneously classified as nonovulatory. If a woman’s physiologically typical LH levels were lower than average, LH tests attuned to populational levels would not detect them: The amount of LH present in urine would not pass the threshold for color change on the test strip. Ovulation tests convert a continuous change in LH levels into a binary result (positive or negative), they do not track cyclical variation in LH, and a relatively large change in LH in an ovulatory cycle with overall low LH levels can be undetected. Such an explanation is further supported by the changes in E2 levels, averaged for all cycles where no positive LH test result was obtained, manifesting in the highest E2 drop 1 day after the −14 day of the cycle (Figure 1).
These findings are of importance in the light of studies that use only LH tests to determine the day of ovulation and schedule research procedures based solely on LH results. From the total sample of 102 healthy, regularly menstruating, reproductive age women, only about 32 experienced the E2 drop in the vicinity of the positive result of the LH test, that is, not more than 48 hr after. The mean time difference between a positive LH test result and E2 drop was 24 hr, as expected; however, the variation here was noteworthy (from 4 days before till 6 days after), further supporting the weaker than expected time relation between LH tests results and ovulation (Bachofner & Lobmaier, 2018).
Importance of the Estradiol Measurements
As described above, measuring the LH surge alone was not sufficient to determine the occurrence and timing of the peak fertility with high accuracy. Based on a large data set of daily collected saliva samples, it is possible to narrow post hoc analyses (as done in Marcinkowska et al., 2017) based on the participants’ segregation to various groups (e.g., women who did experience both LH surge and E2 drop in the right order for ovulation to occur). Without such post hoc extra examination, some participants may be misclassified as in the fertile phase when in reality they are not or may be excluded from the high-fertility group, while actually at their peak fertility.
Roney (2018) argues that by testing participants even 24 hr after the positive LH test result, one could in fact test participants in their low-fertility phase and that could lead to null findings due to phase misclassification. Author presented E/P ratios centered around ovulation day as defined by the highest E2 drop within the cycle (our measurements of mean E2 levels reflect a similar pattern; Figure 1). However, it is no surprise that E2/P ratio will echo E2 levels, and hence E2/P drop will mirror E2 drop. To show that studies might be misclassifying women as fertile when testing them 24 or 48 hr after the possible ovulation, one needs to present daily hormonal levels centered around ovulation as defined, for example, by the positive LH test result (which also seems to be the prevalent method of pinpointing ovulation).
Differences in Sex Hormones Between Ovulatory and Nonovulatory Cycles
As overall differences of sex hormones were suggested to be a marker of overall fertility (Blackwell et al., 2018; Jasienska & Jasienski, 2008), levels of estradiol and progesterone between nonovulatory and ovulatory (based on the LH test result) cycles were compared. In a medical setting, the timing of the ovulation has often been gauged by the occurrence of an abrupt decline in the ratio of urinary metabolites of E2 and P (Baird et al., 1995). Progesterone peak during the luteal phase is often presented as the best marker for the detection of the ovulation (reaching 97% of detection rate); however, it is not as precise for ascertaining the timing of the ovulation (O’Connor et al., 2006).
In this sample, ovulatory cycles did not differ significantly from textbook ones in any of the following hormonal measurements: average cycle level, minimum daily level, maximum daily level, and range (within-cycle-level changes; see Figure 2 and ESM 1). Lack of differences can be caused by the aforementioned interparticipant variation being significantly larger than the intraparticipant ones (for another example of the extent of intra- and interwomen variation, see Stricker et al., 2006).
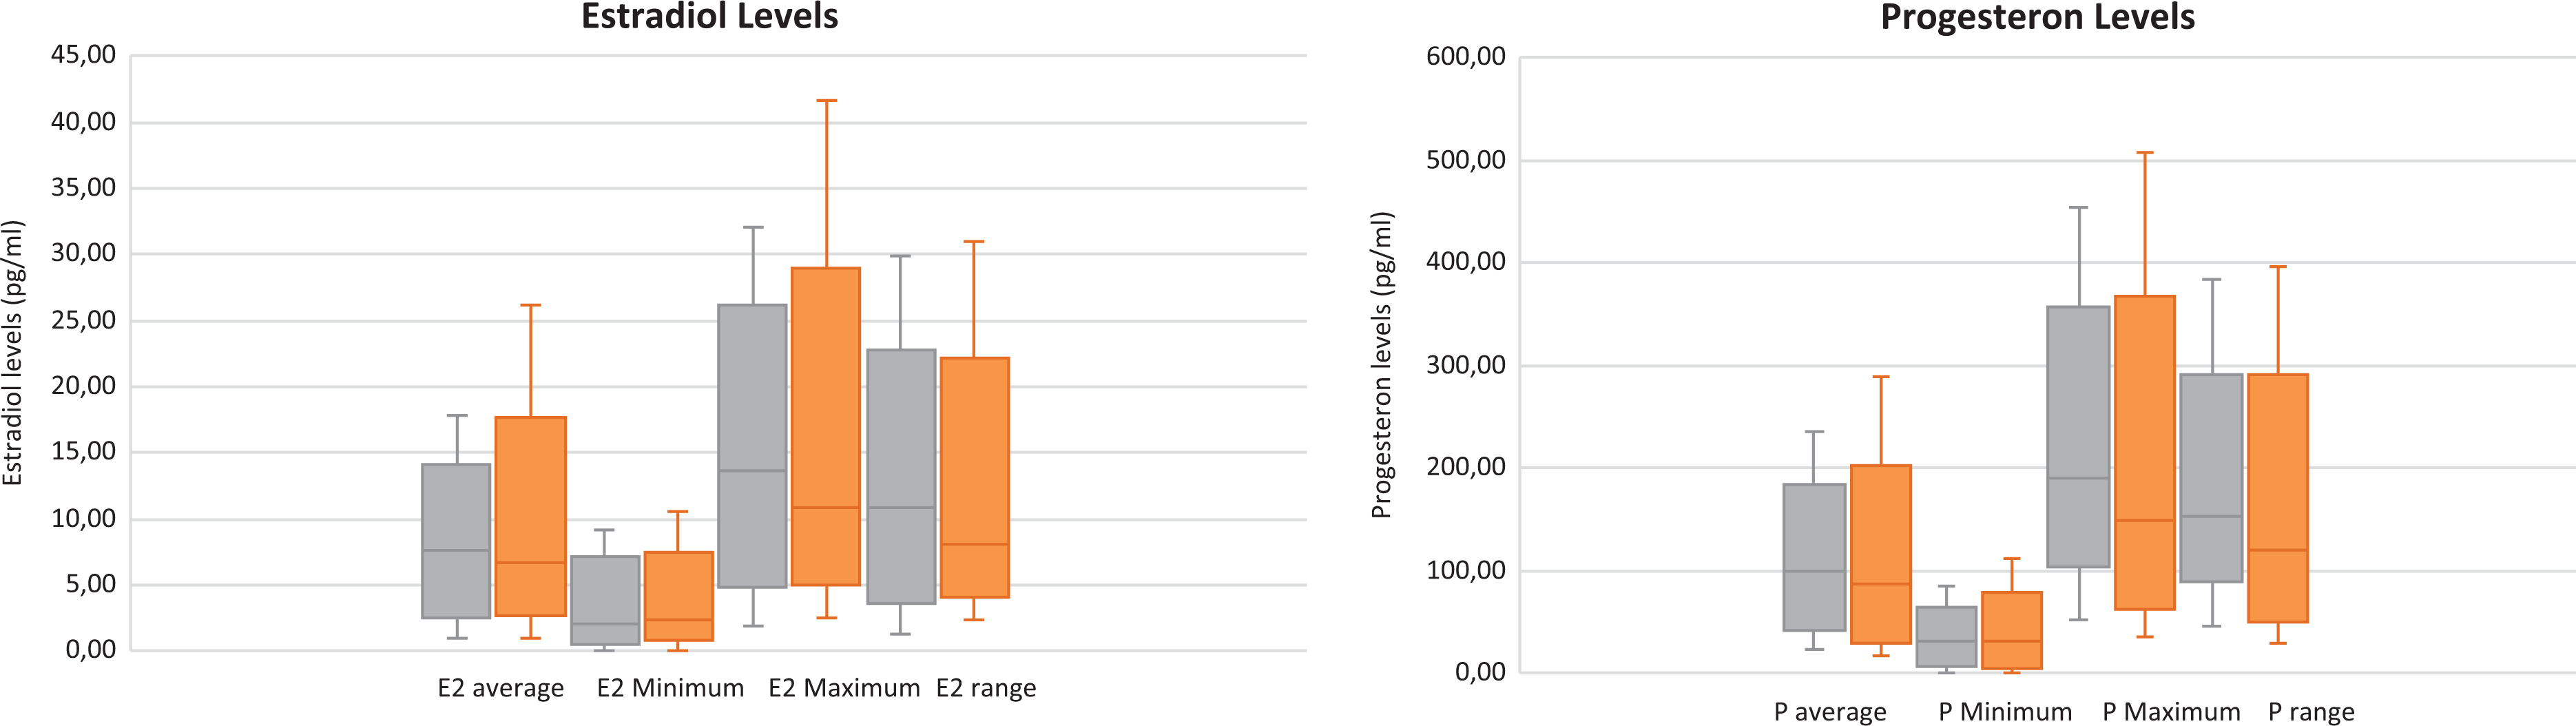
Hormonal characteristics averaged for textbook (orange) and nonovulatory (gray) cycles, the middle line of the box represents the median, the bottom and top line of the box represents the median of first quartile and third quartile, and the whiskers show minimum and maximum value.
Conclusions
Although hormonal assays are demanding (from both a time and a financial point of view), based on this data set, I suggest that they are the only way that future studies can define (and validate) fertile windows of participants more accurately (see also B. C. Jones et al., 2019). As demonstrated, solely using LH tests to determine ovulation leads to both false positives (where participants who did not experience E2 drop are classified as being in their fertile window) and false negatives (where participants who might have experienced ovulation, but did not obtain a positive LH test result, are excluded from the analyses).
Importantly, as there is significant interspecific variation in levels of sex hormones (Kol & Homburg, 2008; Figure 3 and ESM 2), the relative levels and the general, within-cycle trends, are of greater importance than any interspecific comparisons of daily hormonal levels (Bachofner & Lobmaier, 2018). This considerable variability can stem from the differences in genetic makeup and developmental and living conditions (Jasienska & Ellison, 2004; Jasienska & Jasienski, 2008; Jasienska, Kapiszewska, Ellison, et al., 2006; Jasienska, Ziomkiewcz, Lipson, Thune, & Ellison, 2006; Jasienska, Ziomkiewicz, Thune, Lipson, & Ellison, 2006). Conducting multiple measurements of sex hormones within one cycle seems to be crucial for possible post hoc analyses and gauging peak fertility. Reducing false negatives is essential to maximize the return on costly data collection by avoiding the unnecessary exclusion of subjects. Taking a broader perspective, it should be emphasized that the interindividual variations in hormonal levels are vast, and what we perceive as a physiological norm should be more comprehensive. I do not want to claim that no averages can be presented to the broader public, but this should always be accompanied by an example of naturally occurring variation from a contemporary population.

Daily levels of estradiol (pg/ml) from chosen cycles. (A) Ovulatory cycles centered around the day when a positive LH test result was obtained (“Day 0”). Although all cycles were “ovulatory” according to the luteinizing hormone (LH) test result, there is an array of E2 fluctuation patterns: midcycle E2 drop not present (dotted black line), E2 drop was present but relatively low (solid black line), textbook example of the E2 fluctuations (solid orange), and E2 drop present before the positive LH test result (dotted orange line). (B) Nonovulatory cycles with varying levels of estradiol centered around Day −14 of the cycle.
Another recommendation is to increase sample sizes in the peri-ovulatory shift hypotheses studies. As we have demonstrated, fewer than 40% of participants of the initial sample could have attended a meeting in the high-fertility window (i.e., experienced E2 drop not more than 48 hr after obtaining a positive result of the LH test). If we included a stringent criterion of meeting participants not more than 24 hr after the positive LH test results, as recently suggested by Lobmaier et al. (Blake, 2018; Lobmaier & Bachofner, 2018), this percentage would have decreased even more due to difficulties arranging the meetings. If we want to test the peri-ovulatory shift hypotheses reliably, both E2 drop validation and a possibility for post hoc participant exclusion from analyses have to be in place (see also Blake, et al., 2017, for an example of post hoc sensitivity analysis). This is even more important due to numerous recent reports of null findings in peri-ovulatory shift studies (B. C. Jones et al., 2018).
Additionally, increased sample sizes would allow for controlling of possible confounding variables (as done in Marcinkowska et al., 2017), as it is also possible that around-ovulation shifts appear only in certain environments (e.g., in short-term or long-term mating-oriented women, partnered or single, of high or low self-judged attractiveness; as also suggested by B. C. Jones et al., 2019). What is more, studies on this topic should not be conducted solely on students, as the number of nonovulatory cycles can be elevated in women younger than 20 years old (Collett et al., 1954). Daily sex hormone measurements and large sample sizes should be a gold standard in fertility-based studies of mating psychology, which examine these arguments in the future.
While designing fertility-based studies of human behavior, posing research questions, and stating hypotheses, we should be aware of the fact that we are searching for endocrine bases common in two communication streams: brain-behavior and brain-reproductive system axis. Following Roney (2018) and Bachofner and Lobmaier (2018), I underline that we should not treat conception probability solely as a dichotomous variable, but rather focus on the endocrine signaling, which provides exchange of information between the reproductive system and the brain.
Supplemental Material
Supplemental Material, ESM1 - Importance of Daily Sex Hormone Measurements Within the Menstrual Cycle for Fertility Estimates in Cyclical Shifts Studies
Supplemental Material, ESM1 for Importance of Daily Sex Hormone Measurements Within the Menstrual Cycle for Fertility Estimates in Cyclical Shifts Studies by Urszula M. Marcinkowska in Evolutionary Psychology
Supplemental Material
Supplemental Material, ESM2 - Importance of Daily Sex Hormone Measurements Within the Menstrual Cycle for Fertility Estimates in Cyclical Shifts Studies
Supplemental Material, ESM2 for Importance of Daily Sex Hormone Measurements Within the Menstrual Cycle for Fertility Estimates in Cyclical Shifts Studies by Urszula M. Marcinkowska in Evolutionary Psychology
Footnotes
Acknowledgments
Author wants to thank Grazyna Jasienska for her support of the study, Janek Lobmaier for providing helpful comments on this manuscript, Richard G. Bribiescas and Yale Reproductive Ecology Laboratory for the support provided during the creation of the manuscript, Andrew John Morgan for the linguistic support, and anonymous reviewers for constructive comments on the manuscript.
Declaration of Conflicting Interests
The author(s) declared no potential conflicts of interest with respect to the research, authorship, and/or publication of this article.
Ethical Statement
The study was conducted with the understanding and written, informed consent from each subject, with the approval of Jagiellonian University Medical College Ethics Board, and in compliance with national legislation and the Code of Ethical Principles for Medical Research Involving Human Subjects of the World Medical Association (Declaration of Helsinki).
Funding
The author(s) disclosed receipt of the following financial support for the research, authorship, and/or publication of this article: This work was supported to Urszula M. Marcinkowska by the Polish National Science Center (Grant Number 2014/12/S/NZ8/00722) the Polish-U.S. Fulbright Commission (Grant Number: PL/2018/42/SR), and by the structural funds of Jagiellonian University Medical College (Grant Number K/DSC/004283).
Supplemental Material
Supplemental material for this article is available online.
References
Supplementary Material
Please find the following supplemental material available below.
For Open Access articles published under a Creative Commons License, all supplemental material carries the same license as the article it is associated with.
For non-Open Access articles published, all supplemental material carries a non-exclusive license, and permission requests for re-use of supplemental material or any part of supplemental material shall be sent directly to the copyright owner as specified in the copyright notice associated with the article.