
Abstract
Previous studies suggest that human facial attractiveness is culturally universal. As they were conducted among Western populations and populations strongly influenced by the Western culture, it is not obvious if the preferences would also be the same in populations isolated from this culture. It is also not certain if the agreement would be the same in the case of attractive and unattractive faces. In the presented study participated 103 people from the Yali tribe (Papua, Indonesia) and 99 Poles. Their task was to choose the most attractive and unattractive face of the opposite sex from a set of 4 pictures (one attractive, one unattractive and two average faces of Polish people chosen in a pre-test). We showed significant cross-cultural differences in attractiveness preferences and similarities in choices of unattractive faces. We speculate that across cultures unattractiveness could be assessed on the basis of the same cues to health and biological quality. Attractiveness criteria seem to be more complex, specific to each population, and dependent on the population's ecological conditions and morphological characteristics.
Introduction
Perception of physical attractiveness is regarded as an evolutionary adaptation to enhance own reproductive success through mating with an appropriate partner (Buss, 1999; Symons, 1995). The most important component of physical attractiveness in humans is facial appearance (Currie and Little, 2009; Peters et al., 2007). Research conducted in industrial societies (mainly on people of European origin) showed that many features of the face, including geometric typicality, sex-typical characteristics, symmetry, skin condition, and fat amount, are cue to the individual's biological quality and influence its attractiveness (Coetzee et al., 2009; Fink, Grammer, and Thornhill, 2001; Fink and Penton-Voak, 2002; Fink et al., 2012; Gallup and Frederick, 2010; Kościński, 2007, 2008; Little, Jones, and DeBruine, 2011a; Perrett, 2012; Perrett at al., 1998, 1999; Rhodes, 2006). Theoretical and empirical research suggests that the relationship of facial characteristics with biological quality is not limited to a group of human populations and not even to humans (Andersson, 1994; Symons, 1995; Thornhill and Gangestad, 1993; Tybur and Gangestad, 2011). On these grounds, one may suspect that attractiveness criteria and evaluations of facial appeal would be universal across cultures (see Langlois et al., 2000).
On the other hand, several mechanisms can produce systematic inter-population differences in perception of facial attractiveness. First, if two human groups differ in facial proportions to some degree they will materialize the preference for typical facial proportions in a different way from each other (Symons, 1979; Jones, 1996). Second, preferences for some facial features may be adaptively related to ecological conditions, e.g., female preference for masculine male faces is stronger in populations of poor health and high threat of pathogens (DeBruine et al., 2010, 2012). Third, preferences of random origin can spread over a local population through social learning (Little et al., 2011b).
Many studies reported high inter-racial and inter-cultural agreement in perception of facial attractiveness (Langlois et al., 2000). However, most of the studies were conducted among populations highly exposed to Western culture. Such groups could have assimilated the European standards of facial attractiveness through social learning (Little et al., 2011b) or thanks to visual experience with faces of White people (Little et al., 2011a). Indeed, the level of agreement with the standards in Black people (Martin, 1964), Koreans (Lim and Giddon, 1991) and Mexicans (Mejia-Maidl et al., 2005) depends on the degree of exposure to the Western culture. Black people (Martin, 1964), Asians (Maganzini et al., 2000; Choe et al., 2004; Soh et al., 2005), and Amerindians (Husein et al., 2010) prefer faces of own races that possess proportions typical for White individuals. Brazilians from cities inhabited mainly by dark-skinned people prefer facial proportions characteristic for Europeans rather than natives (Jones and Hill, 1993). Non-White women endeavor to make appearance of their faces similar to faces of White women (Dobke et al., 2006; Sturm-O'Brien et al., 2010). And in the opposite direction, the longer a White man stays in a non-Western society, the stronger is attracted to physical features being typical for local people (Symons, 1995, p. 107).
In light of above, studying facial preferences in populations isolated from Western culture is highly desired, though data are scarce. Jones and Hill (1993) found that assessments of facial attractiveness made by Aché (Paraguay) and Hiwi (Venezuela) Indians are poorly associated with those by Americans, Russians, and Brazilians (average r = .13). Zebrowitz et al. (2012) observed a moderate agreement between Tsimané Indians (Bolivia) and Americans (average r = .40). Somewhat higher agreement was found in studies on less isolated populations: the correlation between assessments by Black people in Lagos (Nigeria) and Black and White individuals in USA averaged .54 (Martin, 1964), and correlation between assessments by peasants from south-western Senegal and American people was .60 (Silva et al., 2012).
Studies that concentrated on specific facial features showed that men from rural Borneo preferred feminine female faces (Scott et al., 2008), and Hadza, Tanzanian hunter-gatherers, preferred faces which were symmetric (Little et al., 2007) and possessed proportions typical for this population (Apicella et al., 2007). Additionally, women's preference for male-typical facial characteristics was affected by relationship context in Malaysians from Borneo (Scott et al., 2008) and in Matsigenka people from Peru (Yu et al., 2007). However, these studies do not examine the extent of inter-population agreement in perception of facial attractiveness.
More anecdotal evidence suggest that facial preferences may be universal to some degree: e.g., Ford and Beach reviewed ethnographic data and concluded that “a poor complexion is one feature that is considered sexually repulsive in a large number of societies” (Ford and Beach, 1951, p. 89), and Darwin cited opinions of some travelers that people worldwide agree with White people on who is attractive and who is not (Darwin, 1874, p. 582). But, the need for further, systematic research on this topic is clear-cut.
Surprisingly, existing literature has examined only cross-cultural differences in assessments of attractiveness. Meanwhile, the topic of unattractiveness has been neglected. To our knowledge, only Boski (2009) suggested that inter-population similarity in perception of unattractiveness or ugliness might be higher than similarity in perception of attractiveness or beauty in human faces. He did not conduct systematic research on that topic, but he observed that his Polish, Canadian and Nigerian students agreed more on unattractiveness of faces (Nigerian generals and politicians) than on their attractiveness.
At least two mechanisms can potentially explain higher agreement in the case of unattractiveness: one related to a preference for faces of a typical appearance and one related to a greater importance of low than high attractiveness.
First, people seem to prefer faces of appearance typical for their population. On the basis of previously seen faces they develop a mental prototype of a face which normally reflects a typical, or average, face (Tsao and Livingstone, 2008) and this prototype is then used to assess normality and attractiveness of subsequently seen faces. The preference for geometrically average faces is well documented (Kościński, 2007; Little, 2011a; Rhodes, 2006) and in multiracial societies a face's attractiveness is evaluated with regard to its proximity to the average face of its own race (Potter et al., 2007; Potter and Corneille, 2008). Because different facial forms are typical for different human groups, the neural prototype will vary among the group as well. Therefore, leaving other attractiveness determinants aside, a face of a person from population A, which is similar to the average face for this population, would be regarded attractive by members of the population but relatively unattractive by members of population B, if the latter is characterized by other facial proportions than population A. However, a face of a person from population A, which strongly departs from the average face for this population would probably substantially differ from the average face for population B as well. Then, again leaving other attractiveness determinants aside, an unattractive face for population A would usually be also unattractive for population B. A face from population A could be attractive for people from population B only in a rare case when it resembles faces typical for population B (i.e., it departs, in its shape, from the average face for population A just towards the average face for population B); in this case, however, the face will not be attractive for members of population A. These considerations lead to the prediction that people from populations that differ from each other in facial geometry should agree more on which faces are unattractive than which are attractive.
The second mechanism is related to greater importance of low than high attractiveness. Facial attractiveness is associated with health and intelligence only within the lower range of its variation (Zebrowitz and Rhodes, 2004) and therefore a better mating tactic is to avoid only lowly attractive candidates (not those moderately attractive) than to accept only highly attractive ones (Zebrowitz et al., 2003; Zebrowitz and Rhodes, 2004; Zebrowitz, 2004). Negative stimuli, in general, impact on humans more strongly than positive (Baumeister et al., 2001) and physical attractiveness fall under this rule: low attractiveness elicits stronger arousal in observers (Mehrabian and Blum, 1997) and raises stronger attributions on scales of altruism and intelligence (Griffin and Langlois, 2006) than high attractiveness. Analyses of evaluations of facial attractiveness suggest that observers rather avoid lowly attractive mates than pursue those of high attractiveness (Park et al., 2012) and attach more weight to the least attractive rather than most attractive feature of the face being assessed (Grammer et al., 2002). Whether attractiveness of a partner is low or moderate is more important for people than whether it is high or moderate (Li et al., 2002). Reproductive (Jokela, 2009) and professional (Hamermesh and Biddle, 1994) success is decreased by an individual's low attractiveness to a greater degree than they are increased by high attractiveness, at least in men. Abovementioned findings suggest that reliable cues to biological quality and mate value, such as skin condition, symmetry, and deformation, are more important for perception of low than high attractiveness. Recognition of faces as highly attractive may, in turn, depend to a greater degree on use of criteria specific for the population (e.g., ecological conditions, DeBruine et al., 2010) or the individual (e.g., own and parental appearance, Watkins et al., 2011). We then predict that inter-population similarity is higher in identifying lowly than highly attractive faces. It can be also predicted that intra-population agreement of judges is higher for the former task as well, but in this case the effect can arise only from factors specific for individuals, not for populations.
In the present study, women and men from Poland and a Papuan tribe were asked to choose the most attractive and unattractive face from a group of opposite-sex European faces. The study aimed to test the following predictions: (1) There is some similarity between Poles and Papuans in perception of facial attractiveness. (2) The similarity is higher for choosing the least than the most attractive face. (3) Intra-population agreement is higher for choosing the least than the most attractive face. (4) Intra-population agreement is higher among Polish than Papuan participants because of greater visual experience with faces of White individuals in the former group.
Materials and Methods
Stimuli
In the first phase of the study, we took 50 female and 50 male facial pictures of randomly selected people aged 19-24 from the university campuses (dormitories) in Wroclaw (Poland). Only 2 approached people did not agree for their picture being taken. Participants were familiarized with the aim of the research and they gave their informed, written consent for using their pictures in the subsequent part of the research. All the pictures had plain, gray background. Participants were asked to maintain neutral facial expression. In the pictures, the participants' hair was not altered, first, to maintain a natural appearance, and second, because hair is also an important element of facial attractiveness (Meskó and Bereczkei, 2004). In any case, hair color and style was lowly diversified among faces of a given sex, particularly in men. The presented faces did not have any deformations or signs of serious diseases.
All 100 pictures were assessed by 10 other students (5 females, 5 males) on a 1 to 7 scale (from 1 – very unattractive to 7 – very attractive). For the purpose of further study, we ranked the faces according to the average obtained attractiveness (female and male faces separately) and selected 4 faces of each sex: the most attractive face (further, A face), the least attractive face (further, D face), and two moderately attractive faces (rank 25 and 26, further, B and C faces). Mean ratings and their standard deviations for the selected faces were as follows: female faces, A face, M = 6.4, SD = 0.55; B face, M = 3.7, SD = 0.7; C face, M = 3.8, SD = 1.1; D face, M = 2.0, SD = 0.7; male faces, A face, M = 6.0, SD = 0.9; B face, M = 3.6, SD = 1.2; C face, M = 3.7, SD = 1.5; D face, M = 2.1, SD = 0.8.
Participants
The research was conducted among the Yali tribe (Papua, Indonesian province previously known as Irian Jaya). The Yali inhabit mountainous areas east of the Baliem valley (3.92 S, 138.73 E from Wamena – central part of Baliem valley). The Yali are one of many indigenous ethnic groups in Papua. Even though Christianity is present in this region, the Yali have preserved their traditional lifestyle. They are polygamic (21% of males who participated in our study had more than one wife), men live together in a separate household and wear traditional clothing (some wear only a koteka, which is a traditional wooden penis sheath). The Yali cultivate plots, hunt as well as breed pigs (which constitute a marker of a man's wealth and social position).
Yali tribe can be described as a population with a minor contact with Western culture; due to the remote location of their dwellings and difficult access very few tourists have visited their region (the only access routes to the Yali territory are via private or chartered aircraft or a several days long trek through the mountains). All the study sites were located along a mountainous route (from South-East to North–West) surrounding the Baliem Valley from the East. As was indicated by the participants themselves, the villages were visited by trekking groups from 10-15 trek groups yearly in Pilliam to approximately 1-3 times during the last five years in small mountain villages (according to the estimates of the participants, on average they saw 9 tourist groups, SD = 4.8 during the period of 5 years before the day of the study).
All the inhabitants of the visited villages (except for children and the elderly) were invited to take part in the study. The number of positive responses to the invitation was approximately 40–50%. In the end, 103 participants were recruited to participate in the study − 53 females and 50 males. The female participants were aged between 25 and 59 years (M = 38.3, SD = 8.7) and male participants between 19 and 50 years (M = 35.9, SD = 7.6). The age was self-estimated – majority of the participants did not know their exact age and relied on rough estimates. The participants were interviewed by a Papuan assistant (from the Dani tribe) fluent in English and the local Yali dialect. All participants were reimbursed for their participation by receiving the equivalent of 3USD.
The same research was conducted in Poland among 50 men and 49 women. The female participants were aged between 19 and 50 years (M = 34.5, SD = 8.8) and male participants between 19 and 53 years (M = 36.3, SD = 9.0). All raters were ethnic Poles, and were a diverse group recruited on bus and train terminals in Wroclaw (Poland). The study was conducted by one of the authors (P.S.). Poland is a country in Central Europe with a GDP of about 20,000 US$ per capita and is part of the European Union. It is representative of a modern industrialized society.
Procedure
Prior to the main experiment, each Yali participant was interviewed in order to make sure that the experimental question and certain concepts were clear and easily understood. Each interview lasted relatively long, as participants were asked a series of questions related to their concept of attractiveness (e.g., Sorokowski and Sorokowska, 2012); that is why we are fairly sure that each participant understood the task correctly.
Each participant was presented with 4 randomly arranged laminated images of opposite-sex faces, each sized 9×15 cm, and asked to choose the most attractive and, separately, the unattractive face in their opinion. The participants were surveyed individually. The procedure was easy and transparent to all participants - e.g., none of them indicated the same face as the most attractive and the most unattractive one. We repeated the same procedure, with the same set of stimuli in the Polish group.
Analysis of choices
To verify the formulated hypotheses, we required a measure of agreement among judges from a given group and a measure of similarity between two groups of judges. Because the variables of interest, i.e. the face that was chosen as the most attractive or unattractive, were categorical, popular measures of variation and association, like variance or coefficient of correlation, were not applicable here.
To assess the agreement level among judges from a group we used the Index of Qualitative Variation (IQV), which equals 1 minus the sum of squared percentages across categories, 1–Σpi2 (Swanson, 1976; Kader and Perry, 2007). Because IQV values are negatively related to the judges' agreement, we introduced an Intra-group Agreement Index (IAI) equaling 1 – IQV, or simply Σpi2.** *
To assess similarity level between two groups of judges we applied the Morisita Similarity Index (MSI). It is calculated as 2 · Σn1,i · n2,i/[(Σn12,i / N12 + Σn22,i / N22)· N1 · N2], where Ni = Σnj,i, and ** * nj,i is the frequency of i-th category in j-th group. Although it is one of the most complex indices of this sort, it is recommended in literature for its statistical properties (Wolda, 1981).
Because exact distributions of the applied indices are not known, we involved bootstrapping approach to establish the indices' distributions and then determining the statistical significance (p-values) for hypotheses being tested. Bootstrap analyses were run in Microsoft Excel with macros written in Visual Basic for Applications. Each bootstrap analysis involved 10.000 repeats of resampling.
To check whether agreement level among Polish judges was the same as for Papuan (for faces of given sex and the judged characteristic), resampling was conducted at each repeat from the Polish and Papuan sample defined by numbers of choices of each face (from A to D). The value of IAI was determined for each of the two resamples and the difference between the IAI values, ΔIAI, was further analyzed. According to the null hypothesis, i.e., assuming the same agreement in each population, the expected value of ΔIAI is 0. To determine p-value for this hypothesis, the number of cases where ΔIAI crossed 0 was divided by repeat count (10.000) and the resultant percentage multiplied by 2 so to obtain a two-tailed p-value. The analysis was conducted four times, separately for choices of the most attractive female or male face and choices of unattractive female or male face.
Equality of agreement levels between choices of the most attractive and unattractive face (for given facial sex and judges origin) was examined in a similar way. In this case, however, the compared variables were dependent (e.g. a judge could not choose the same face as the most attractive and unattractive). Hence, resampling was conducted on the contingency table for these variables (the most attractive × the unattractive face) rather than univariate distributions. The analysis was carried out four times, separately for choices of female face by Poles or Papuans and choices of male face by Poles or Papuans.
A hypothesis that no difference exists between choices made by Poles and Papuans (i.e. that they wholly agree with each other) was checked with the chi-squared test of independence, separately for each facial sex and judged characteristic. In case of rejecting of the hypothesis, we checked whether a statistically significant similarity between Poles and Papuans exists at all. To this end, we first determined the value of MSI characteristic for no agreement between groups (MSI0). Specifically, we established the MSI value for the actual distribution of choices made by Poles and a hypothetical, discrete uniform distribution of choices by Papuans, which depicts random choices. Next, we run a bootstrap analysis for actual choices by Poles and Papuans, separately for each facial sex and judged characteristic. The MSI value was calculated at each repeat, the number of cases where MSI exceeded MSI0 was divided by repeat count (10.000), and the resultant percentage multiplied by 2 so to obtain a two-tailed p-value. In addition, we calculated percentage inter-population similarities, %MSI, taking MSI0 as 0% and the theoretically maximum value of MSI, i.e. 1, as 100%.
Then, we checked whether the similarity level between Poles and Papuans was the same for choices of the most attractive and unattractive face, separately for female and male faces. The bootstrapping method was used again. Because choices of the most attractive and unattractive face were dependent, resampling was conducted on contingency tables for these variables, one table per judges' population. At each repeat the MSI value for choices of the most attractive and unattractive face was calculated and the difference between both values, ΔMSI, was then analyzed. According to the null hypothesis, i.e. assuming that inter-group similarity did not depend on which characteristic was assessed, the expected value of ΔMSI is 0. To determine p-value for this hypothesis, the number of cases where ΔMSI crossed 0 was divided by repeat count (10.000) yielding a one-tailed p-value. The use of the one-tailed test was warranted here because several lines of reasoning suggest inter-population similarity to be higher for perception of unattractiveness than attractiveness (see Introduction).
The above hypothesis was also tested on data for both sexes combined. To this end, the bootstrap analysis was conducted simultaneously on data for female and male faces and at each repeat the average MSI value was calculated from values obtained for both sexes, separately for choices of the most attractive and unattractive faces: MSIATTR = (MSIATTR-FEMALE + MSIATTR-MALE) / 2, and MSIUNATTR = (MSIUNATTR-FEMALE + MSIUNATTR-MALE) / 2. The p-value was established on the basis of difference values, MSIUNATTR – MSIATTR, obtained in 10.000 repeats.
Because tests for equality of inter-population similarity in choices of the most attractive and unattractive face are crucial for the present study, the respective bootstrap analyses for female faces, male faces, and both sexes combined, was conducted 10 times each so to gen up on reliability of the obtained p-values.
Finally, we used the Fisher's exact test to compare frequencies of choice of a given face by Poles versus Papuans, separately in attractiveness and unattractiveness conditions. The 2 × 2 contingency tables were filled with frequencies for the face and for the other faces pooled, as chosen by each group of judges.
Analysis of facial shape
We also ascertained whether geometrical proximity of the faces to a typical face of Poles or Yali influenced their attractiveness according to Polish and Papuan participants, respectively. To this end, we measured 15 distances on digital images of faces in frontal aspect using author-developed software (in Microsoft Visual Basic 6). Apart from the 8 faces used in the present study (the test faces), measurements were conducted on 192 female and 158 male faces of Poles, and on 12 female and 9 male faces of Yali (the reference faces; they were taken from the authors' photograph collections). The measured distances included the eye, nose, and mouth widths and heights, forehead height, eyebrow thickness, eyebrow-to-eye distance, interpupillary distance, facial width at levels of cheekbones and lips, chin height, nose-to-mouth distance, and horizontal distance from lip corners to the face's contour. Points defining the distances were located in agreement with anthropometric standards (Farkas, 1994). The measured distances were then corrected for the face's overall size, which was determined as the average distance of the points from their centroid.
Statistical analysis was conducted using Statistica StatSoft 8.0. Examination of 4 facial groups, female/male × Polish/Papuan reference faces, showed that the Mahalanobis distances between sexes were much smaller (on average, 2.81 times) than those between populations. Therefore, further analysis was conducted on faces of both sexes combined. A discriminant analysis was first run on two groups of reference faces (Polish and Papuan) and then the Mahalanobis distances of each of the 8 test faces from the typical Polish face and typical Yali face were established. The distances were then correlated with frequencies of choices of each face as the most attractive or unattractive by Polish and Papuan participants (the Pearson correlation coefficient was applied). We hypothesized that a face's distance to the typical Polish or Yali face would be negatively related to the frequency of being chosen as the most attractive and positively related to the frequency of being chosen as unattractive by Polish and Yali participants, respectively. Because of very small sample size (8 test faces) and non-independence of frequencies (they sum up to 1 for each sex) we did not perform a statistical test for the obtained correlations but only examined whether their direction was as expected.
Results
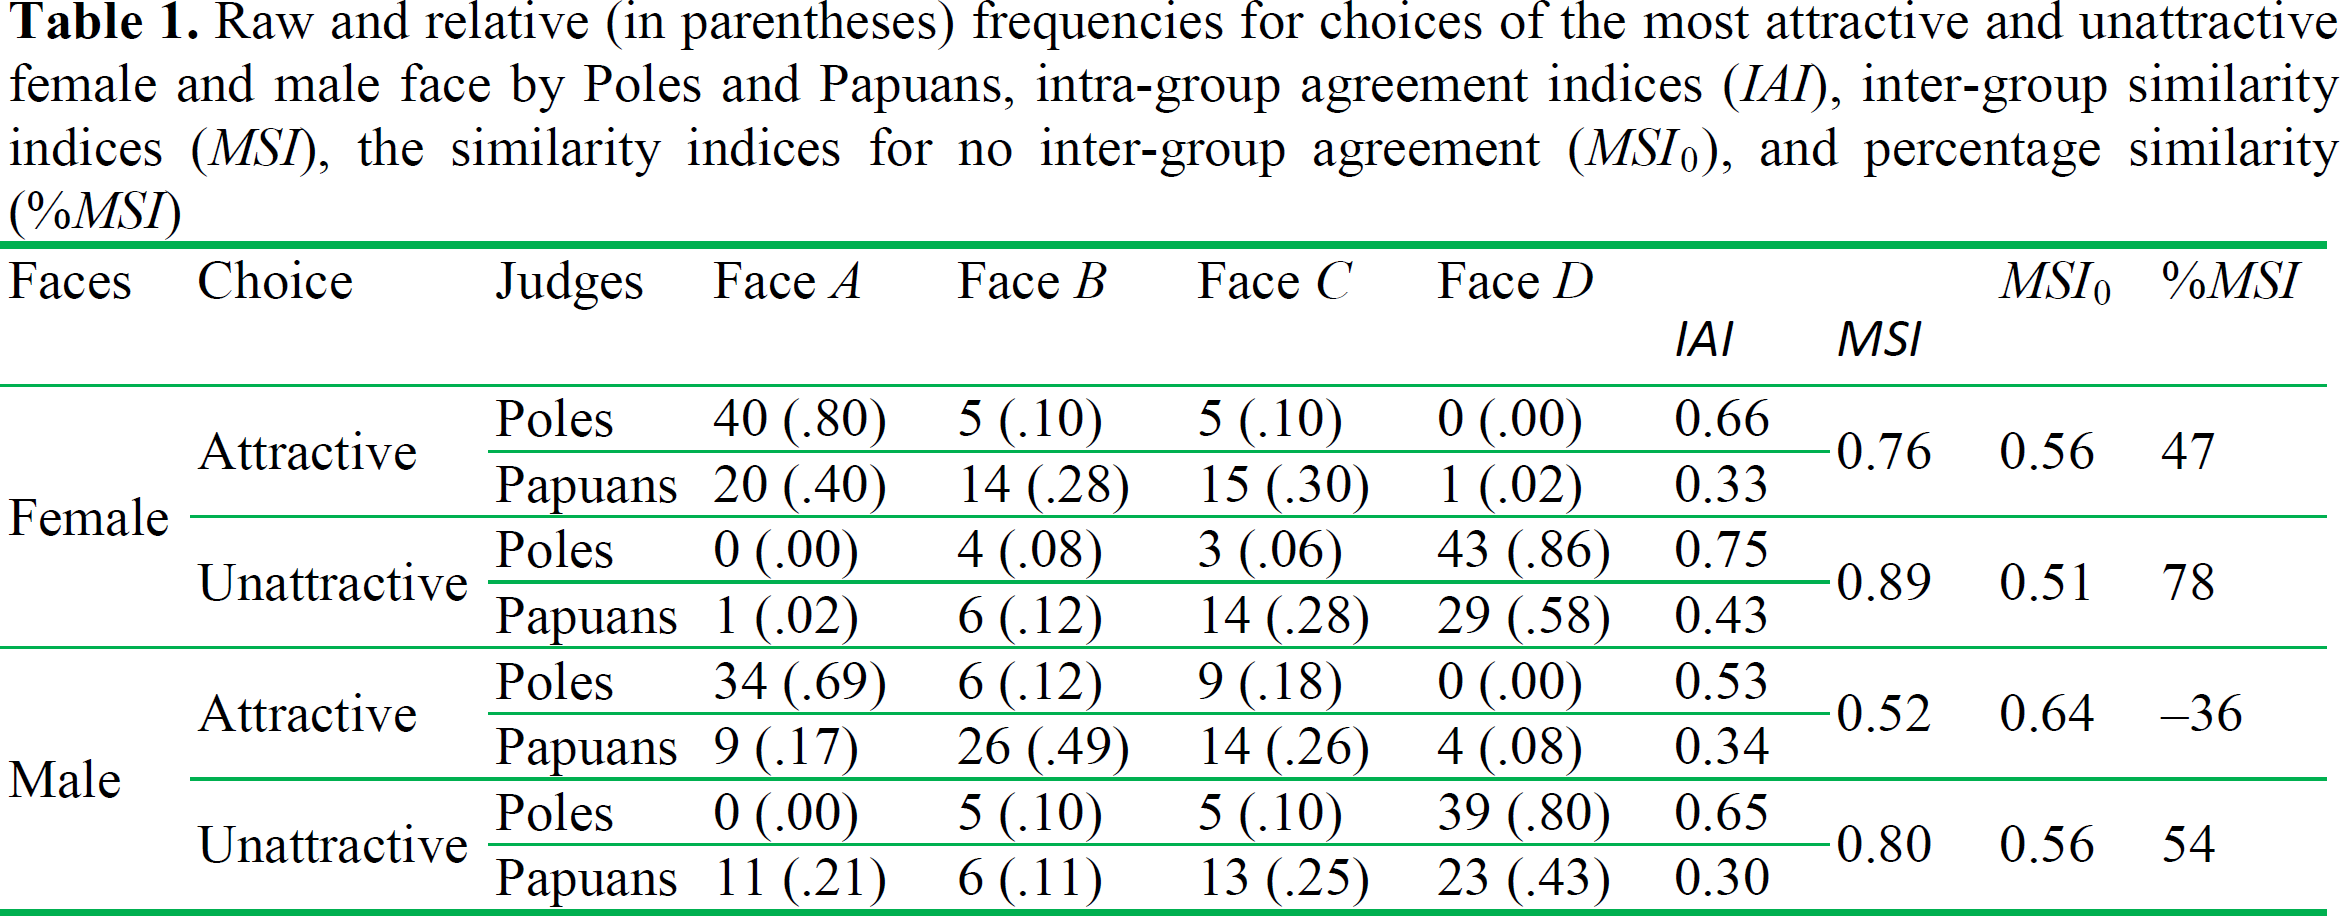
Table 1 provides frequencies for choices of the most attractive and unattractive female and male face by Poles and Papuans; distributions of the choices are shown on Figure 1. The table also gives values for intra-group agreement index (IAI), inter-group similarity index (MSI), MSI characteristic for no agreement between groups (MSI0), and percentage similarity (%MSI).
Raw and relative (in parentheses) frequencies for choices of the most attractive and unattractive female and male face by Poles and Papuans, intra-group agreement indices (IAI), inter-group similarity indices (MSI), the similarity indices for no inter-group agreement (MSI0), and percentage similarity (%MSI)
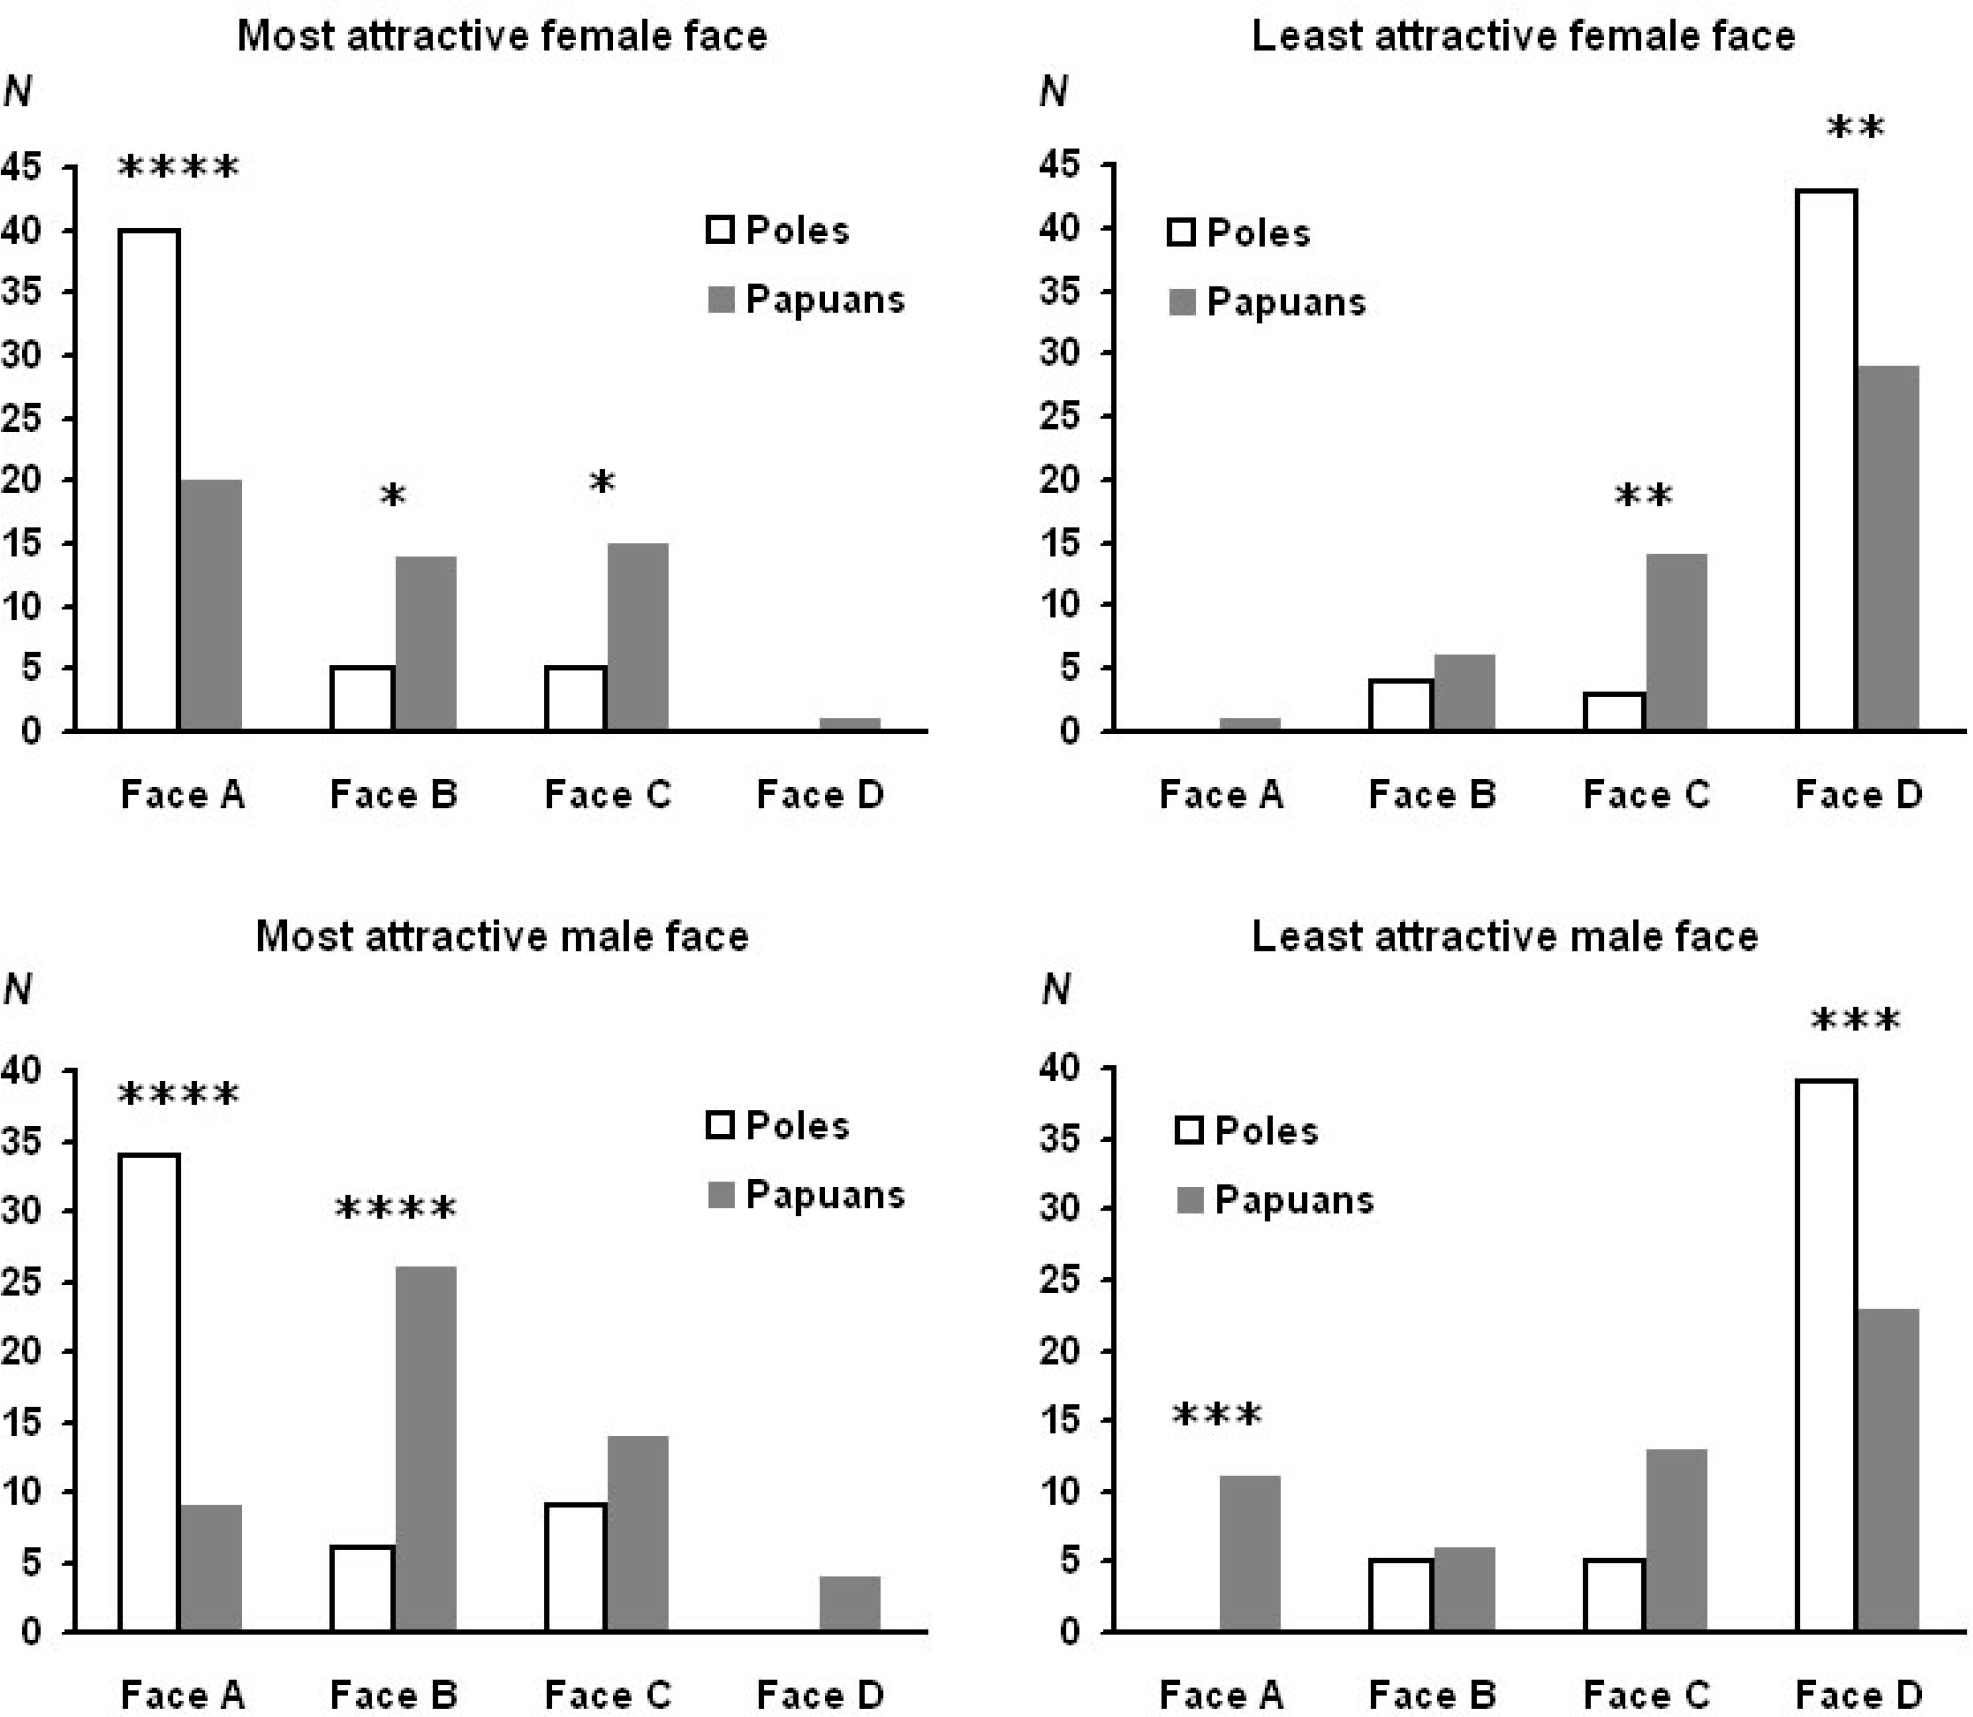
Distributions of choices for the most attractive and unattractive female and male face by Poles and Papuans
Intra-group agreement was higher in Poles (POL) than Papuans (PAP), irrespective of facial sex and judged characteristic: the most attractive female, IAIPOL = 0.66, IAIPAP = 0.33, p < 0.001; the unattractive female, IAIPOL = 0.75, IAIPAP = 0.43, p = 0.002; the most attractive male, IAIPOL = 0.53, IAIPAP = 0.34, p = .023; the unattractive male, IAIPOL = 0.65, IAIPAP = 0.30, p < .001 (all tests two-tailed).
On the other hand, no significant difference in intra-group agreement was found between choices of the most attractive and unattractive face: female chosen by Poles, IAIATTR = 0.66, IAIUNATTR = 0.75, p = .44; female chosen by Papuans, IAIATTR = 0.33, IAIUNATTR = 0.43, p = .078; male chosen by Poles, IAIATTR = 0.53, IAIUNATTR = 0.65, p = .30; male chosen by Papuans, IAIATTR = 0.34, IAIUNATTR = 0.30, p = .39 (all tests two-tailed).
The chi-squared test of independence uncovered significant differences between choices made by Poles and Papuans, irrespective of facial sex and judged characteristic: the most attractive female, ✗2 (3) = 16.93, p < .001; the unattractive female, ✗2 (3) = 11.24, p = .010; the most attractive male, ✗2 (3) = 32.01, p < .001; the unattractive male, ✗2 (3) = 18.65, p < .001 (all tests two-tailed).
We then checked whether a statistically significant similarity between Poles and Papuans exists at all. The hypothesis on lack of such similarity was rejected for choices of the most attractive female (MSI = 0.76, MSI0 = 0.56, %MSI = 47%, p = .023), the unattractive female (MSI = 0.89, MSI0 = 0.51, %MSI = 78%, p = .002) and the unattractive male (MSI = 0.80, MSI0 = 0.56, %MSI = 54%, p = .011) but not the most attractive male (MSI = 0.52, MSI0 = 0.64, %MSI = −36%, p = .110); all tests two-tailed. The lack of similarity for choices of the most attractive male face also manifested in that Poles most frequently chose the face A while Papuans the face B (Figure 1).
Although inter-population similarity in choices of the unattractive female face was higher than for the most attractive one (MSIUNATTR = 0.89, MSIATTR = 0.76), the difference was not statistically significant; the minimum, average, and maximum one-tailed p-value, as obtained from 10 courses of the bootstrap analysis, was 0.166, 0.172, and 0.177, respectively. The difference was however significant for male faces (MSIUNATTR = 0.80, MSIATTR = 0.52, pMIN = .030, pAVERAGE = .033, pMAX = .037), and for data for both sexes combined (MSIUNATTR = 0.84, MSIATTR = 0.64, pMIN = .020, pAVERAGE = .023, pMAX = .024); all tests one-tailed.
Yali faces proved quite different in shape from Polish ones: the t-test revealed a significant difference for 14 out of 15 facial distances being measured. First of all, Yali faces were distinguished by lowly placed eyebrows, wide nose, wide mouth, short chin, narrow jaw, and lip corners close to facial contour (Cohen's d > 2 for each of these features). The discriminant analysis correctly classified each reference face with a probability of 0.99998 or higher and each test face with a probability of 0.9999998 or higher. The Mahalanobis distances of the test faces from the typical Polish face and typical Yali face are given in Table 2. The distance to the Polish typical face correlated with frequency of being chosen as the most attractive by Polish participants at 0.51 and with frequency of being chosen as unattractive at −0.37. Equivalent correlations for distances from the typical Yali face and Yali participants were 0.55 and −0.58. All these correlations were in the direction opposite to the predicted.
Mahalanobis distances of faces from typical Polish or Papuan Yali face

Finally, we checked whether the geometric proximity to the typical Polish rather than Yali face is related to being more frequently chosen as the most attractive by Poles than Papuans and being less frequently chosen as unattractive by Poles than Papuans. The difference between Mahalanobis distance to the Yali and Polish typical faces correlated with the difference between frequency of being chosen as the most attractive by Poles vs Papuans at −0.51; again, this was opposite to the predicted direction. However, the former difference correlated with the difference between frequencies of being chosen as the unattractive by Poles vs Papuans at −0.19, which was in the predicted direction.
Discussion
As we discussed in the Introduction, few studies examined facial preferences in populations isolated from the Western culture and none compared perception of facial unattractiveness across cultures. In the presented study we found that Yali from Papua perceived attractiveness in a somewhat similar way as people from central Europe and the similarity was higher when they chose the least than when they chose the most attractive face. Below we discuss the results in detail.
Intra-group agreement in perception of attractiveness
Judges from Poland were more consistent than Papuans in the choice of the most attractive and unattractive face. This could have resulted from using only European faces, more familiar to Poles than Papuans in the study. Rich visual experience that Poles had in their lives with faces of White individuals surely enhanced their efficiency in neural processing of such faces. Visual experience with faces is required for development of their efficient processing (Le Grand et al., 2001) and the efficiency is highest for faces of the race that was seen most frequently (Sangrigoli et al., 2005; Pascalis et al., 2011). Poles' facial processing can be superior also because they saw much more faces altogether than Papuans (Pascalis et al., 2011; Zebrowitz et al., 2012). Furthermore, Polish participants might learn Western attractiveness standards for European faces from mass media and through other means of social learning (Little et al., 2011b). Low experience of Yali people with faces of White people and ignorance of the attractiveness canons can explain their low consistence in the present study.
The level of intra-group agreement in choice of the most attractive face did not differ significantly from agreement in choice of the unattractive one, irrespective of sex of a face and the judges' group. No support was therefore obtained for the prediction that people are more consistent in perception of low than high attractiveness. However, the reason for the null result could be that numeric attractiveness of D faces (selected as lowly attractive) was relatively close to the attractiveness of B and C faces (selected as moderately attractive), whereas A faces obtained much higher evaluations (see Materials and Methods). This could make the choice of the unattractive face relatively difficult, and in consequence lower the intra-group consistence in this choice to the level characteristic for choice of the most attractive face. Nevertheless, the observed independence of the judges' agreement level from the evaluated characteristic will be important for interpreting of inter-population similarities in perception of attractiveness (see below).
Inter-group similarity in perception of attractiveness
In the present study we found some similarity in perception of facial attractiveness between Europeans (Poles) and the Yali people isolated in mountains of Papua. This agrees with results of previous studies conducted in societies that were highly (Jones and Hill, 1993; Zebrowitz et al., 2012) or partly (Martin, 1964; Silva et al., 2012) isolated from Western culture. The similarity was high for choice of the unattractive female face and moderate for choice of the most attractive female face and the unattractive male face; no similarity was however observed for choice of the most attractive man. The similarity between Poles and Papuans was greater for choice of the least than the most attractive face; we were not however able to settle unambiguously whether the effect applied to faces of both sexes or only to females.
Because intra-group agreement in choice of the unattractive face was not higher than for the most attractive face (see above), the reason of the greater inter-group similarity in choice of the unattractive than the most attractive face could not be an ease of identifying the face of the worst look. To determine probable reasons of the observed effect, 4 people, including authors, examined faces involved in the present study for geometric averageness, masculinity/femininity, symmetry, skin condition, fattiness, facial expression and makeup. Then, drawing on these observations, the quantitative analysis of the faces' shape and scientific knowledge about determinants of facial attractiveness, we endeavored to identify features responsible for the judges' choices.
One observation proved clear-cut: the faces that were regarded the unattractive (D faces) possessed the worst skin condition from faces of their sex, the skin had blemishes, erythema, and, in the man, some swellings. The faces were not characterized by any conspicuous asymmetry or disproportion and the female face had the most pleasant expression, and yet, they were categorized as unattractive by judges from both populations. Although the male face had the nose of above-average size, this cannot be the reason for its low attractiveness for Yali observers since Yali themselves possess huge noses. The facialmetric analysis confirmed that the shape of D faces was not atypical when compared either to the average Polish or Yali face (Table 2). It appears, therefore, that cues to poor health present on skin has a decisive and negative influence on perceived attractiveness, irrespective of the observer's place of origin (compare Ford and Beach, 1951, p. 89).
Criteria for choosing the most attractive faces are less clear. The A faces had nice skin but it was not unquestionably healthiest from all faces of their sex. According to Papuans, the most attractive male face was the B face, which had worse skin than faces A and C (a number of blemishes). It is not clear why Papuans did not prefer the C face, which was quite similar to the B face with respect to geometry and hair but had a clean skin. The facialmetric analysis did not show that similarity to the typical Papuan face increased the perceived attractiveness. What is more, the male face that was regarded the most attractive by Papuans (the B face) was the least similar in its shape to the typical Yali face (Table 2).
The male A face was clearly masculine: possessed a strong chin, prominent nose, and thick eyebrows. Because female preference for male-typical facial features is stronger in populations of poor health and high threat of pathogens (DeBruine et al., 2010, 2012), and the populations of New Guinea are examples of them (World Health Organization, 2012), one might expect Yali women to prefer the A face, which however was not the case. Unlike the male B face, the A face was slightly asymmetric (slanting lips) and its appearance suggested a lower body fattiness as compared with the B face (see Coetzee et al., 2009). These properties might have contributed to the preference of the B face over A face by Papuans because symmetry (Little et al., 2007) and body fat (Brown and Konner, 1987) are preferred more strongly in traditional than industrial populations.
The aforementioned characteristics do not explain why the most attractive female face was the A face and why this was particularly true for Polish judges. In comparison to B-D faces, it was not characterized by high geometric similarity to the typical Polish face or low similarity to the typical Yali face (Table 2). The reason of its appeal could be that it was decisively the most feminine female face. Because hard living conditions make men prefer relatively more masculine faces in women (Pettijohn and Jungeberg, 2004; Pettijohn and Tesser, 1999), the Papuan males might not be attracted to a conspicuous femininity.
Limitations
One of the limitations of our research is the fact that it was conducted only with the use of pictures of Polish participants, because, unfortunately, not enough Papuan respondents agreed for their photographs being taken in order to conduct a replication of this research in Europe. Another limitation of this study was also a simple methodology (choice of the most attractive and the most unattractive picture); however, during the experiment we observed that the Yali were not able to assess attractiveness of provided faces on a numeric scale (as it is commonly done in studies involving Western populations). They are illiterate and not used to participation in scientific studies. This simple methodology enabled us to collect more reliable data – it is possible that some Papuan participants would perform their task randomly if the procedure was too difficult. Additionally, such methodology enabled us to polarize the assessments and examine the perception of attractiveness and unattractiveness.
Another limitation is a low number of photographs used in the study. A different set of faces might generate different levels of agreement. But, low number of faces made the task much easier and more comprehensible for Yali people – too many faces could be too confounding for them and might discourage them from participation in the study. Also, low number of photographs makes it harder to determine the influence of particular facial features on general attractiveness. However, the primary aim of the study was to compare the general assessments of attractiveness and unattractiveness in Polish and Papuan people.
Further studies could also test perception of facial attractiveness regardless of sex of target/judge. Such a methodology would help to examine perceptions of attractiveness outside of mating contexts.
Finally, we compared results only from two cultures. This might not be enough to draw a conclusion that perception of facial unattractiveness is culturally universal.
Conclusions
Intra-group agreement in choice of the most attractive and unattractive female and male face was higher for Europeans (Poles) than indigenous Papuans (Yali tribe), which probably resulted from the scant visual experience of Papuans with European faces and ignorance of Western standards of beauty. Despite these, Yali perceived attractiveness somewhat similarly to the Polish judges and the similarity was higher for choice of the least than the most attractive face. The latter finding cannot be attributed to a greater ease in choosing the lowly than highly attractive face because intra-group agreement in choice of the unattractive face was not higher than for the most attractive one.
It seems that skin condition indicative of a poor health is a cross-cultural criterion of low attractiveness. It is understandable in light of the universal character of skin cues to health and disease (Fitzpatrick, Wolff, Johnson, and Suurmon, 2005) and importance of the partner's health for reproductive success of the choosing person (Buss, 1999). This claim conforms with Ford and Beach's analysis of ethnographic data that “a poor complexion is one feature that is considered sexually repulsive in a large number of societies” (Ford and Beach, 1951, p. 89) and Symons' conjecture that “tendencies to pay close attention to skin condition and to be attracted by a clear, clean complexion probably are innate human dispositions” (Symons, 1979, p.187). Poor health status reflected in skin condition may have a genetic origin (see the bad genes hypothesis, Zebrowitz and Rhodes, 2004) or result from non-genetic factors, like infections or diet (Tybur and Gangestad, 2011). On the other hand, criteria for recognizing highly attractive faces seem to be more complex, specific to each population, and dependent on the population's ecological conditions and morphological characteristics (even though we found no empirical support for the latter factor). Skin look may weigh less here than for perception of low attractiveness, which was evident for Papuan judges who strongly preferred a bad-skinned male face.
Further studies on perception of facial attractiveness in societies isolated from Western culture are needed. The perception of unattractiveness also deserves greater scientific interest than has been shown thus far. We predict that the higher inter-group similarity in perception of low than high attractiveness can be replicated in studies on other populations, both those culturally isolated from and those closer to the West, as well as on different groups (e.g., age groups within one population). The effect may be even stronger if people are to assess a group of very attractive and very unattractive faces (e.g., those of beauty contest winners and seriously ill individuals).
Footnotes
Acknowledgements
We would like to thank the Editor Elizabeth Cashdan and anonymous reviewers for all valuable comments. This research was supported by funds of Polish Ministry of Science and Higher Education for science (research grant #IP 2011 051571 to P.S.; years 2012-2014; scholarships to A.S. and P.S.), and Foundation for Polish Science START scholarship and National Science Centre ETIUDA (#2013/08/T/HS6/00408) scholarship to A.S.