
Abstract
Recent studies indicate that more men than women run fast relative to sex-specific world records and that this sex difference has been historically stable in elite U.S. runners. These findings have been hypothesized to reflect an evolved male predisposition for enduring competitiveness in “show-off” domains. The current study tests this hypothesis in non-elite runners by analyzing 342 road races that occurred from 1981–2006, most in or near Buffalo, NY. Both absolutely and as a percentage of same-sex finishers, more men ran relatively fast in most races. During the 1980s, as female participation surged, the difference in the absolute number of relatively fast men and women decreased. However, this difference was stable for races that occurred after 1993. Since then, in any given race, about three to four times as many men as women ran relatively fast. The stable sex difference in relative performance shown here for non-elites constitutes new support for the hypothesis of an evolved male predisposition for enduring competitiveness.
Introduction
Scientists have long been intrigued by sex differences in athletic performance, especially differences in male and female running world records (e.g., Furlong and Szreter, 1975; Jokl and Jokl, 1968; Sparling, O'Donnell, and Snow, 1998; Whipp and Ward, 1992). These differences decreased throughout the 20th century, as women's athletic opportunities approached those of men's, at least in some athletic domains in some nations (Gotaas, 2009; Noakes, 2001; Whipp and Ward, 1992). Recent studies show, however, that sex differences in world-class running performance have stabilized at roughly 10–12% across all commonly contested distances, from sprints to the marathon (Cheuvront, Carter, Deruisseau, and Moffatt, 2005; Coast, Blevins, and Wilson, 2004; Noakes, 2001; Sparling et al, 1998). These remaining differences are thought to chiefly reflect hormonally regulated male advantages in aerobic capacity, muscular strength, and body fat deposition (Cheuvront et al., 2005; Joyner, 1993; Shephard, 2000).
Recently Deaner (2006a, 2006b, 2011; see also Frick, 2011) demonstrated a second kind of sex difference in running: In similar sized populations, substantially more men than women run fast relative to sex-specific world records or similar standards. For instance, in the 10,000 m run in 2005, 25 U.S. men recorded times that were less than 110% of the then-current male world record, whereas only six women performed within 110% of the corresponding female record (Track & Field News, 2006). This sex difference in performance depth—about two to four times as many men running relatively fast—was demonstrated in U.S. populations for all commonly contested distances, for Open (i.e., mainly professional), NCAA Division 1 collegiate, and high school runners. A similar pattern was shown in large U.S. road races that occurred in 2003 (Deaner, 2006b) and in international elite distance running events that occurred from 1973 to 2009 (Frick, 2011). The sex difference in performance depth is also indicated by the apparently “easier” female qualifying standards for elite competitions. For instance, the 2008 Olympic “A” qualifying standard for the marathon was 2:15:00 for men (10:33, 8.4% over then-current men's world record) and 2:37:00 for women (21:35, 15.9% over then-current women's world record; The XXIX Olympic Games, 2008).
In contrast to persistent sex differences in world records, there is no general consensus regarding the cause(s) of the sex difference in performance depth. Deaner (2006a, 2011) considered several possible explanations, however, and concluded that, at present, only one had empirical support, at least for distance running. This explanation is remarkably straightforward: More men are motivated to engage in the kind of dedicated, high-volume training that is necessary for fast running performances. Evidence for this conclusion comes from studies showing that the relations between training volume and relatively fast performances are highly similar in men and women (Deaner, Masters, Ogles, and LaCaille, 2011) and that men generally report greater training volumes (Callen, 1983; Clement, Taunton, Smart, and McNicol, 1981; Ogles, Masters, and Richardson, 1995; Running USA's State of the Sport 2010 – Part I, 2010).
Deaner (2011; see also Deaner, 2006a) further hypothesized that the apparent sex difference in motivation to train might reflect an evolved male predisposition for enduring competitiveness in display or “show-off” domains. More specifically, distance running may function as a reliable indicator of quality to potential mates, competitors, and allies, and enduring competitiveness may be necessary to best display one's quality. Similar arguments have been put forth for sex differences in displays of food acquisition and the arts and sciences (Hawkes and Bliege Bird, 2002; Kanazawa, 2000, 2003; Miller, 1999, 2000).
The crucial evidence for Deaner's claim (2006a, 2011) that the sex difference in performance depth reflects an evolved male predisposition for enduring competitiveness is its historical stability in the U.S. In particular, the sex difference in relative performance has been stable in the U.S. for roughly 25 years, despite the fact that distance running opportunities and incentives (e.g., collegiate scholarships) for women increased dramatically in the 1970 and 1980s and apparently reached parity with men in the 1990s (Deaner, 2006a, 2011). A limitation of this historical evidence, however, is that it is based only on elite runners (i.e., best or near-best performers in high school, collegiate, and professional populations).
It is therefore possible that substantial changes may have occurred among runners who are competitive but fall short of elite standards. This possibility seems especially worthy of exploration because the historical patterns of participation among U.S. running populations have been heterogeneous. In particular, in the past two decades the number of high school and collegiate male and female distance runners has increased by 30–100%, while the number of recreational road participants has increased by 60% for men and nearly 500% for women, a pattern which means that, at present, more women than men participate in road races (see Table 1).
Increased male and female running participation in U.S., 1989–2009
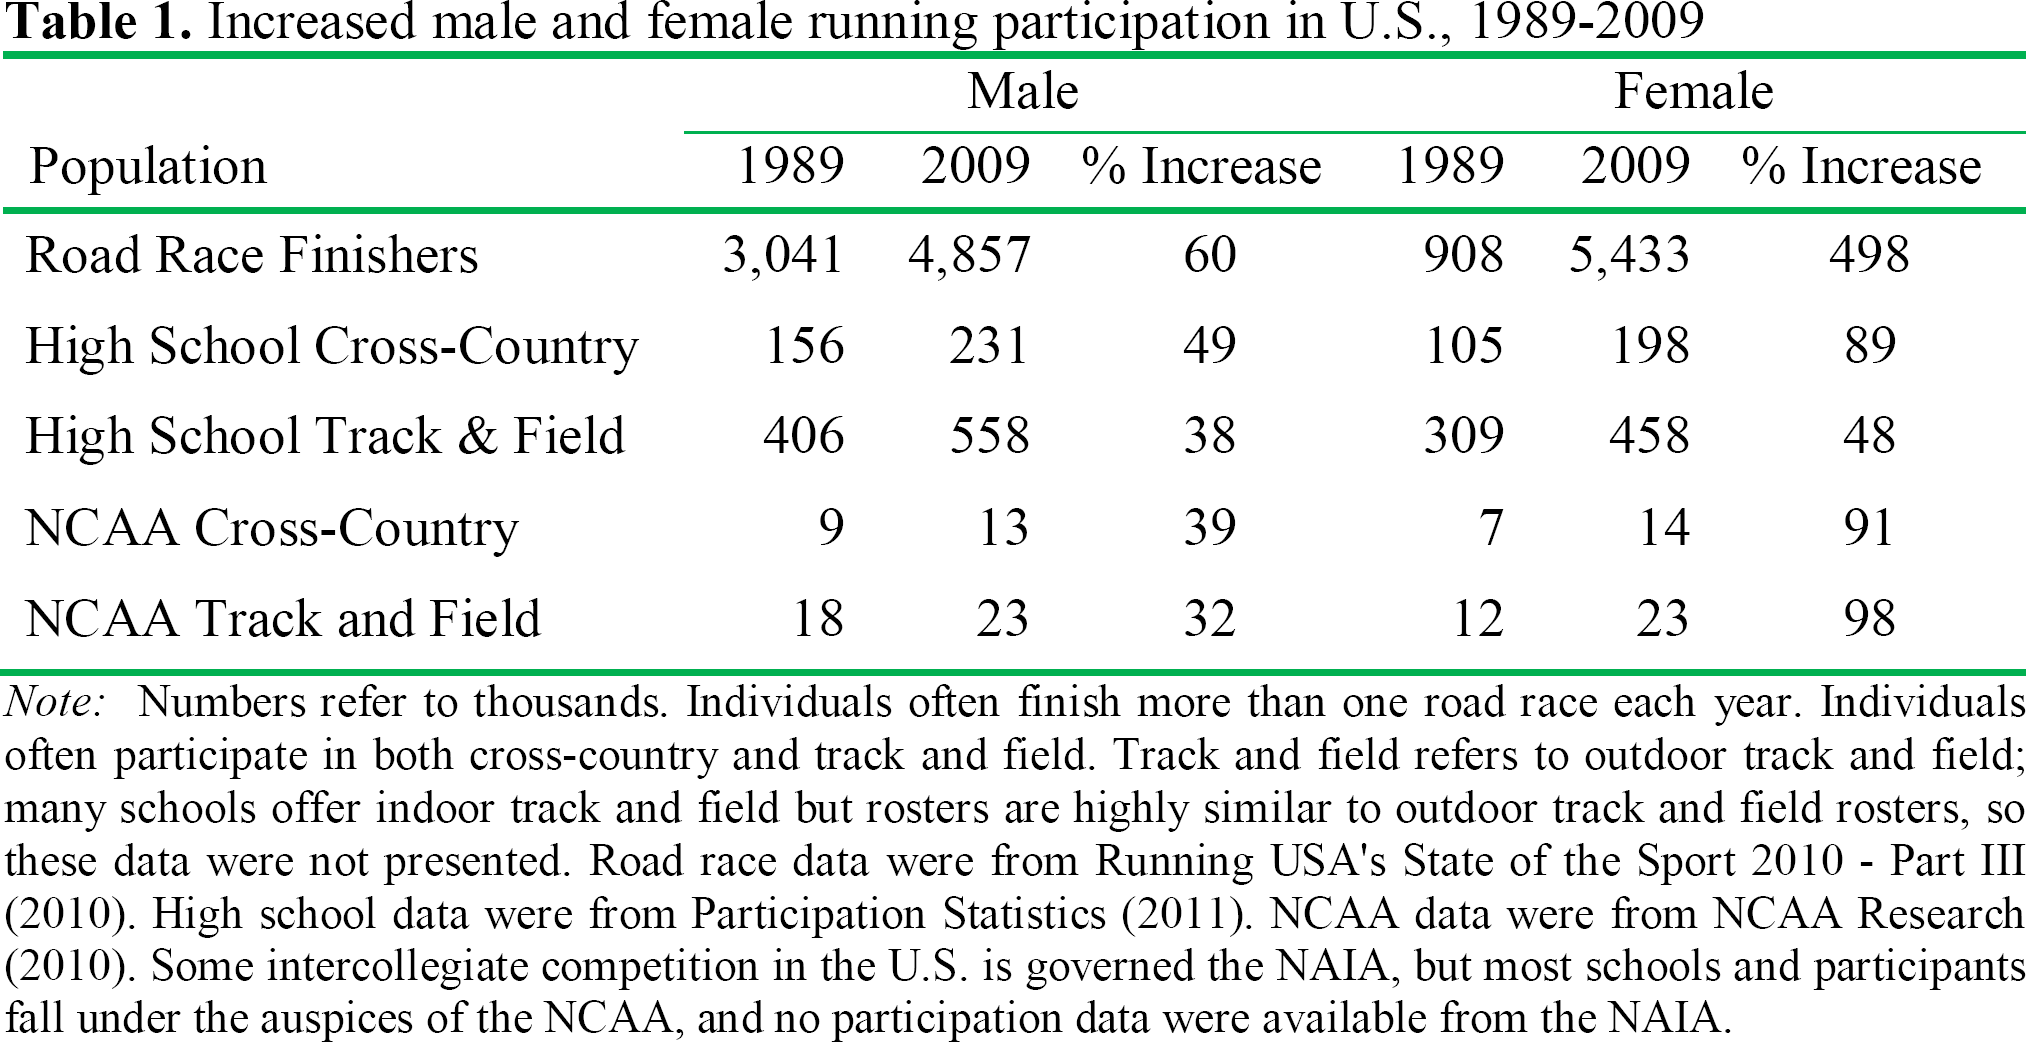
Note: Numbers refer to thousands. Individuals often finish more than one road race each year. Individuals often participate in both cross-country and track and field. Track and field refers to outdoor track and field; many schools offer indoor track and field but rosters are highly similar to outdoor track and field rosters, so these data were not presented. Road race data were from Running USA's State of the Sport 2010 - Part III (2010). High school data were from Participation Statistics (2011). NCAA data were from NCAA Research (2010). Some intercollegiate competition in the U.S. is governed the NAIA, but most schools and participants fall under the auspices of the NCAA, and no participation data were available from the NAIA.
The substantially greater increase in women's road race participation in the U.S. might seem, prima facie, to falsify the claim of an evolved male predisposition for enduring competitiveness. This interpretation would be incorrect, however, because distance running participation does not automatically equate with distance running competitiveness. In fact, studies of distance running motivation have consistently found that most non-elite runners, both male and female, report little competitive inclination and instead run for a variety of other reasons (e.g., affiliation, health orientation, weight concern, life meaning; see Masters, Ogles, and Jolton, 1993; Ogles and Masters, 2003).
Although it is difficult to gauge precisely what proportion of non-elite distance runners train and race with the aim of optimizing their performances, three points suggest it is low. First, Ogles and Masters (2003) conducted a cluster analysis of self-reported motivations with the “motivation of marathoners” scales (Masters et al., 1993) and found that only 17% of runners fell into the group “competitive achievers,” rather than into other groups such as “lifestyle managers.” Second, the mean training volume reported by habitual runners in most samples is typically only 30–50 km/week (Callen, 1983; Clement et al., 1981; Ogles et al., 1995; Running USA's State of the Sport 2010 – Part I, 2010), and most experts believe that distance runners cannot approach their true potential unless they are consistently running at least 100 km/wk (Berg, 2003; Noakes, 2001). Even given conservative assumptions, this would suggest that, at most, one-third of runners are maintaining sufficient training volumes to be optimizing their performance (Deaner, 2011). Third, estimations of the relation between relative running performance and training volume in recreational runners indicate that running roughly 75–100 km/wk (i.e., in a manner consistent with trying to approach one's true potential) typically is associated with finishing within 125% of a sex-specific world-class standard (Deaner et al., 2011; see also Williams, 1998). Deaner (2006b) found that, across a sample of large road races, this standard was only achieved by 1–3% of male finishers and by fewer than 1% of female finishers.
These considerations suggest that the tremendous increase in female road race participation conceivably might have occurred without an increase in the number of fast female runners. This possibility would provide new support for Deaner's hypothesis (2006a, 2011) of an evolved male predisposition for enduring competitiveness. By contrast, if the number of fast female runners in U.S. road races has substantially increased and now approaches or equals the number of fast males, this would support some kind of socialization hypothesis (e.g., Eagly and Wood, 1999), as well as claims that female athletic motivations are converging with (or are equivalent with) those of males (Dowling, 2000; McDonagh and Pappano, 2007; Messner, 2002). The current study tests these competing hypotheses by analyzing a sample of 342 road races that took place between 1981 and 2006.
Materials and Methods
Sample
The sample of races was taken from the archives of the second author who, for 25 years, operated a road race timing business (Runtime Services). Although this archive included roughly one thousand races, this study focused on 342 races that met two criteria. First, races must have had at least 40 male and 40 female finishers between the ages of 20 and 39 years. Runners outside this age range might require somewhat different standards, unnecessarily complicating our analysis (Deaner, 2006b). Thus, all analyses in this paper are based on runners in this age range. Second, races must have been part of an annual series, and data must have been available from at least three occurrences of the race.
The base of operations for the timing business was Buffalo, NY, USA. Most races in the sample occurred within 20 km of Buffalo, although some race series occurred substantially farther away. Eighteen races were included that occurred in Ontario, Canada, because the participants overlapped substantially with those who participated in the races in the nearby Buffalo area. Races of all distances were included, ranging from 5K (5 km) to the marathon. Appendix A lists the races included in the sample and summarizes their key characteristics.
One analysis compared races that awarded large prizes (and thus would attract elite, professional runners) to races that did not. To make a strong comparison, race series that showed a consistent yearly pattern of awarding substantial prize money (e.g., “money races” where winner receives > $500 or equivalent in non-monetary awards) were compared to similar race series that consistently did not (e.g., winner receives an apple pie or a trophy). Because information about prizes for individual races occurring many years ago generally was not available, we focused on seven race series where we had many years of data and that were known to consistently award substantial prizes or else were known not to do so. These seven race series included 152 of 322 races in our sample (47%). The classifications were made by the second author prior to analysis. The race series that were classified as consistently having large prizes were: Boilermaker 15K, Lilac 10K, Run for the Shamrocks 5 Mile, and Subaru Chase 4 Mile. The race series that were classified as consistently not providing large prizes were: J.Y. Cameron Buffalo Turkey Trot 8K, Nickel City 5K, and Old First Ward Shamrock Run 8K.
Measures of relatively fast performance
In calculating the relative performance of each finisher, the “10-Fastest” standard was generally used as the denominator or standard, rather than the world records. This was done because there is some evidence that world records may artificially inflate the sex difference in relative speed (Deaner, 2006a; see also Cheuvront et al., 2005; Seiler, De Koning, and Foster, 2007). The 10-Fastest standard was defined as the mean best time of the 10 fastest all-time performers at a distance, with only one performance counted per individual. Because only road races were analyzed in this study, only road race performances in calculating the 10-Fastest standard were used, not track times. These data were obtained from the Association of Road Racing Statisticians (All-Time Lists, n.d.) on 10 November 2010, although the lists had last been revised on 10 January 2010. To investigate the robustness of the results, some analyses were repeated using the fastest ever performance recorded at the distance in a road race (“world record”; All-Time Lists, n.d).
Because some race distances are infrequently contested, some 10-Fastest standards (and world records) indicated a slower mean speed than did the 10-Fastest standard of a longer but more frequently contested distance. For example, the 10-Fastest standard in the men's half-marathon (21.098 km) is 5.98 m/sec, whereas the corresponding speed in the 10 mile (16.08 km) is 5.95 m/sec. In such cases, it can be safely assumed that the shorter distance standard would be at least as fast as the longer distance standard if it was contested frequently, and thus the 10-Fastest Standard (or world record) was calculated according to the speed of the longer race. The 10-Fastest standards and world records for all distances assessed in this study are presented in Appendix B.
Races that are longer in distance and duration are reliably associated with relatively slower performances (Deaner, 2006a). For example, although the majority of male players on a decent high school soccer team could probably run within 25% of the male world record in the 100m dash (12 seconds), on most high school cross country or track teams in the U.S. there would not be a single male runner who could run within 25% of the male world record in the 5K (16:15). This phenomenon could spuriously produce a sex difference in relative performance because female performances are longer in duration than comparable male performances. Therefore, male performances were duration-corrected following Deaner (2006a). This procedure amounts to adding roughly 0.02% to each measurement of relative male performance, which corresponds to about 15 seconds to each male 5 km performance or about 150 seconds to each male marathon performance. Not performing this adjustment would have resulted in slightly larger estimates of the sex difference in performance depth.
The authors initially tabulated the percentage of finishers running faster or equal to each succeeding 25% increment of the 10-Fastest standard, e.g., 100–125%, 126–150%, 151–175%, etc. However, the analyses presented below focused on finishers that ran ≤ 125% of the 10-Fastest standard because a previous study (Deaner, 2006b) indicated a sex difference was most pronounced there, among the fastest runners.
Measures of sex difference
Two measures of a potential sex difference in relative performance were considered, the first referred to as “percent-percent sex difference.” To obtain this, the authors initially calculated, for each race, the percentage sex difference in the percentage of male and female finishers that ran
In 20 of the 342 races in the original sample (6%), there was not a single man or woman who achieved the
The second measure of a potential sex difference in relative performance is referred to as “percent-absolute sex difference.” It was calculated by first tabulating the number (not percentage) of male and female finishers that ran
The 20 races where no individuals achieved the
Analyses
Analyses were conducted using two-tailed statistical tests, and α was set at 0.05. All analyses were conducted with Statistica 6.1 (Statsoft Inc., Tulsa, OK USA). To test whether the percent-percent sex difference or the percent-absolute sex difference differed significantly from 0, one sample t-tests were employed. To examine the relationships between these measures of sex difference and other variables of interest (e.g., number of finishers, percent female finishers, race distance), linear multiple regression was used, rather than correlation, so that the effects of several potential predictors could be simultaneously assessed and the intercepts could be calculated. To better meet assumptions of normality, the number of finishers was log transformed prior to analysis.
Results
As predicted, in most races a higher percentage of men than women achieved or ran faster than the ≤ 125% 10-Fastest standard (see Figure 1). In particular, in the 322 races with at least one man or one woman achieving this standard, the male percentage was greater in 254 (79%) of the races. Even more dramatically, among these 322 races, 141 showed a sex difference of greater than 100%, and in 127 (90%) of these cases, there were more relatively fast men. The mean percent-percent sex difference for all 322 races was 99% and the median difference was 73%. This pattern departs significantly from zero, t(321) = 9.80, p < .0001.

Histogram showing the frequency of percent-percent sex difference in 322 road races
Although the greater percentage of relatively fast men is clear in this sample, this sex difference is somewhat smaller than reported in Deaner (2006b) where, across 40 large road races occurring in the U.S. in 2003, approximately two to four times (i.e., 100–300%) as many men as women ran relatively fast. To explore whether the comparatively modest sex difference found in the present sample reflects the increased participation of women over the past few decades (see Introduction), percent-percent sex difference was regressed on the percentage of finishers in the race that were female. As expected, the percentage of female finishers was a significant predictor (β = 0.24, R2 = 0.06, p < .0001), and the intercept indicated that there would be 170% more men than women running relatively fast in a given race if 50% of finishers were female. Figure 2 displays how, since 1981, the percentage of female finishers and the percent-percent sex difference both increased.

The relations between year and percent-percent sex difference (left ordinate) and percentage of female finishers (right ordinate)
Another approach to assessing historical trends is to examine the percentage difference in the absolute number (rather than percentage) of men and women in each race who achieve the
The percent-absolute sex difference decreased over all years in our sample (β = −0.36, R2 = 0.13, p < 0.0001). Nevertheless, visual inspection of scatterplots (not shown) indicated that this trend ended in the early 1990s. In fact, regressions using only races from the last 14 years (i.e., 1993–2006) or less revealed no significant decrease in this ratio (all ps > .14). Moreover, the regression coefficients were positive in sign for most years after 1996 (e.g., 1996–2006, 1997–2006). Figure 3 shows how the percent-absolute sex difference decreased from the 1980s to early 1990s and then stabilized.

The relation between year and the percent-absolute sex difference
A key point is that the percent-absolute sex difference stabilized at a point where relatively fast men still greatly outnumber relatively fast women. For example, the mean percent-absolute sex difference for the 200 races occurring from 1993–2006 was 335% and the median was 300%; nine of the races had more fast female than male finishers, nine had equal numbers, and 182 had more fast men; of these 182 races with more fast men, the percent-absolute sex difference was greater than 400% in 54 of them.
Alternative standards
One question that arises is the extent to which these results depend on the sex-specific relative standard employed. This issue was initially explored by repeating the previous analysis using world records. Results were highly similar: For the 312 races with at least one man and one woman meeting the
Another way to explore the robustness issue is to lower the female standard so that more women achieve it. In doing this, the goal was to explore a standard that could meaningfully affect the results yet be considered a plausible estimate of female performance limits relative to men's. The median percentage difference between male and female 10-Fastest standards for the race distances in the study was 12.7%, and the largest difference was 13.2% (see Appendix B). Complementing this pattern are previous investigations reporting that the percentage difference in male and female world class running performances typically range from 10 to 12%, with an outer limit of roughly 13% (Cheuvront et al., 2005; Coast et al., 2004; Noakes, 2001; Sparling et al., 1998). Thus, fixing the standard at all distances at 13.2% seemed reasonable. This was calculated by taking the male 10-Fastest standard at each distance and making the corresponding female standard 13.2% greater. Employing this standard, highly similar results were again obtained. For example, in the 323 races with at least one man or one woman meeting the standard, regression analysis indicated that there would be 128% more men than women running relatively fast if there were equal numbers of male and female finishers. With this standard, the percent-absolute sex difference decreased from 1980–2006 (β = −0.37, R2 = 0.13, p < 0.0001), but again there was no significant decrease after 1994. Thus, this study's results appear robust to the sex-specific relative standard employed.
Non-elite competitors
Although the present results clearly show a sex difference in relative performance, one possibility is that this difference is limited to professional or elite runners (for a fuller discussion, see Deaner 2006b). This issue was addressed in two ways. First, four race series (85 races) which consistently awarded large prizes were compared to three other race series (67 races) which consistently did not. There was a substantial difference between these kinds of races in percent-percent sex difference, although it was the races that did not award substantial prizes where the sex difference was more pronounced (large prize races: M = 60, SD = 101; small/no prize races: M = 211, SD = 199; t(150) = 6.1, p < .00001). The same pattern was obtained for percent-absolute sex difference (large prize: M = 384, SD = 262; small prize: M = 623, SD = 457; t(150) = 4.0, p < .00001). To explore whether this result might reflect some other difference between the prize and non-prize races, a general linear model was employed; offering large prizes was entered as a categorical predictor and year, log finishers, and percent female finishers were entered as continuous predictors. The large difference between prize and non-prize races was not substantially diminished for either measure of sex difference.
A second way this issue was addressed was by testing for sex differences among slower, yet still reasonably fast finishers, those in the > 125% but
Number of finishers
Another question is whether the greater percentage of relatively faster men is limited to races with either many or few finishers. To address this, we regressed percent-absolute sex difference on log number of finishers. We found there was a significant positive relation (β = 0.159, R2 = 0.03, p = .004), indicating that larger races tend to show a larger sex difference in relative performance. However, the regression equation indicated that even in a race with only 100 total finishers, there would be 310% more men than women running relatively fast.
A further approach to addressing the number of finishers is to repeat analyses while weighting races by their number of finishers. We did this, considering every 80 finishers (our minimum for a race's inclusion in the sample) as one case, and found that our key results remained largely unchanged: The mean percent-percent sex difference was 105% (compared to 99% unweighted); the mean percent-absolute sex difference for races occurring from 1993–2006 was 329% (335% unweighted); and the percent-absolute sex difference decreased over all years in our sample, but the relations weakened in the early 1990s and the regression coefficients were positive in the majority of years after 1996. Thus, our results were robust to the number of race finishers.
Discussion
The current study demonstrates that substantially more men than women run relatively fast in a sample of 342 U.S. road races that spans 26 years (1981–2006). It thus constitutes another line of evidence for the robustness of this phenomenon, which had previously been shown for elite runners (Deaner, 2006a, 2011; Frick, 2011) and in a sample of 40 U.S. road races occurring in 2003. In addition, the current study provides new insight into the increased popularity of distance running in the U.S. and many other nations (Gotaas, 2009; see also Deaner, 2011), especially among women in the 1990s and 2000s. Previous accounts of this so-called “2nd running boom,” have noted that many participants, both male and female, report little motivation to compete (Masters et al., 1993; Ogles and Masters, 2003). However, the present study provides the additional insight that massive increases in female participation (see Table 1) have not come close to eliminating the sex difference in relative performance: Since approximately 1993, in any given race, whether men substantially outnumbered women or whether there was approximate parity, there were typically three to four times as many men who ran relatively fast.
Before considering the explanations for these results, three issues regarding their robustness should be considered. First is whether the sex difference in relative performance could be an artifact of the 10-Fastest standard being somehow biased against women. In fact, this is not a major concern because the general results reported above were insensitive to the particular standards employed (i.e., 10-Fastest, world record, 13.2%), and similar patterns of robustness have been shown previously (Deaner, 2006a, 2006b). Moreover, the sex difference in relative performance phenomenon has been shown to exist entirely independent of sex-specific standards. In particular, within large populations of runners, the variability of the best male performances is reliably less than that of the comparable female performances, a pattern consistent with the idea that within any given population size, substantially fewer women than men engage in the kind of training needed to truly optimize performance (Deaner, 2006a; Frick, 2011).
A second issue is whether the sex difference in relative depth documented in this study at road races truly represents a sex difference in non-elite runners. In particular, one might ask if the focus on finishers who achieve the
A third issue is the representativeness of our sample, which was comprised of 342 road races occurring between 1981 and 2006, mostly in western New York. For two reasons, it is reasonable to expect that the present study's results will generalize to other U.S. road races occurring during this time period. First, the increasing proportion of female runners in this sample (see Figure 1) parallels national trends (see Table 1). Second, the sex difference in relative depth found in this sample—about three to four times more relatively fast men in any given race—is highly similar to what was found in a sample of 40 large races that occurred in 2003 across the U.S. (Deaner, 2006b). Despite this evidence, it is certainly desirable that other researchers conduct additional studies of U.S. road races. Similar studies in other nations might be even more valuable.
In sum, the current study's main result—that, among non-elite runners, relatively more men than women run fast in U.S. road races and this pattern, after decreasing in the 1980s and 1990s, has held stable for roughly 14 years—is likely to be reliable. The next section considers the various factors that might contribute to this sex difference in performance depth.
Proximate explanations for the sex difference
So why do more men run relatively fast in most U.S. road races? Achieving fast running performances undoubtedly requires talent, but another requirement is extended periods of consistent and demanding training, including the maintenance of running volumes of at least 100 km/wk (Berg, 2003; Midgley, McNaughton, and Jones, 2007; Noakes, 2001). There are several reasons to believe that a higher proportion of male than female runners engage in such training (reviewed in Deaner, 2011). First, male runners generally report greater competitiveness (Callen, 1983; Johnsgard, 1985; Ogles and Masters, 2003), and competitiveness is associated with maintaining larger running volumes (Masters et al., 1993; Ogles and Masters, 2000, 2003; Ogles et al., 1995). Second, the relations between training volume and relative performance are extremely similar in men and women, and there is no indication that training volume underestimates female performance (Deaner et al., 2011; see also Williams, 1998); thus, because more men are running relatively fast, more are probably maintaining high training volumes. Third, and most crucially, studies consistently find that, on average, men do report maintaining greater training volumes than do women (Clement et al., 1981; Callen, 1983; Ogles et al., 1995; Running USA's State of the Sport 2010 – Part I, 2010; for review, see Deaner, 2011).
These findings strongly suggest that the sex difference in performance depth can be largely attributed to more men being motivated to engage in the training necessary to run relatively fast. Nonetheless, alternative explanations are possible. For example, “training constraint” hypotheses allow that there is a substantial sex difference in training but that this is due to some kind of inability or opportunity to train, rather than to a difference in motivation. For example, one possible training constraint hypothesis is that female runners might be more susceptible to injuries. The available data contradict this, however, because, once experience is controlled, there is no apparent sex difference in injury rates among runners (Macera, 1992; van Gent et al., 2007; van Mechelen, 1992). Deaner (2006a, 2006b, 2011) considers other alternative explanations for the sex difference in performance depth (e.g., sex-differentiated effects of exogenous anabolic steroids) and concludes that none have any substantial empirical support at present, although some warrant further investigation.
Ultimate explanations for the sex difference
So why would more men be motivated to engage in the dedicated, high-volume training necessary for fast running performances? Deaner (2006a, 2011) posited that this apparent sex difference in motivation could be viewed as a manifestation of sexual selection for male competitiveness. In this framework, men's cultural displays in artistic, athletic, and scientific domains function to demonstrate a given man's mental and behavioral talents relative to those of other men, and these displays thus serve as reliable indicators of quality to potential mates, competitors, and allies (Deaner, 2011; de Block and Dewitte, 2009; Kanazawa, 2000, 2003; Miller, 1999, 2000); although many display domains must have arisen fairly recently, men's subsistence behavior in modern hunter-gatherer societies suggests that there were ample opportunities for display during the course of human evolution (Hawkes and Bliege Bird, 2002; Bliege Bird and Smith, 2005). These displays of male quality depend on both talent and enduring competitiveness, which can be defined as motivation to engage in dedicated training for an extended period to improve one's performance in a domain (Deaner, 2011).
Although women may benefit by displaying their talents relative to those of other women, it is expected that they will be predisposed to do so in different ways than men, given the potential costs and benefits that would have prevailed during human evolutionary history (Campbell, 1999; Cashdan, 1996). In particular, whereas men's long-term achievement motivation is expected to be greater in display or “show-off” domains, women's long-term achievement motivation may be equal to (or greater than) men's in domains more relevant to resource acquisition or its contemporary equivalents, such as school or job performance (Deaner, 2011).
A variety of findings from large contemporary societies support the general hypothesis that men's cultural displays signal quality (reviewed in Deaner, 2011). For example, men's creative activity in the visual arts and poetry is positively correlated with mating success (Nettle and Clegg, 2006), and men employ cultural displays in situations consistent with the hypothesis: They are more creative in their writing when they have been romantically primed (Griskevicius, Cialdini, and Kenrick, 2006) and attempt more challenging skateboarding tricks in the presence of an attractive female observer (Ronay and von Hippel, 2010). The line of evidence that is most relevant to the current paper is men's persistent dominance in many cultural domains (chess: Howard, 2005; jazz: Miller, 1999; technological innovation: Frietsch, Haller, Funken-Vrohlings, and Gruppa, 2009). However, it is exceedingly difficult to rule out alternative explanations for these sex differences, such as men enjoying greater achievement opportunities (Battersby, 1989; Miller, 1999; Russ, 1983).
Deaner (2011) argued that distance running is an ideal domain for making a strong claim for an evolved male predisposition for enduring competitiveness in “show-off” domains because alternative explanations for the sex difference in performance depth do not appear viable, at least in the U.S. For example, the argument that men enjoy greater opportunities to develop their running abilities seems implausible because running is a true meritocracy: No special equipment or facilities are necessary, and specialized training during youth is thought to be unhelpful (Greene and Pate, 2004). Another possible argument is that men have greater economic incentives to achieve in this domain. However, this argument also seems weak because men and women compete for similar shares of prize money at professional track and field meets and road races around the world (Prize Money, 2011), and there is no indication that open U.S. road races award men more prize money (personal observation, 2nd author). The only apparent difference in the U.S. is that among NCAA collegiate Division 1 and Division 2 runners, females receive 50% more athletic-related aid than do their male counterparts (NCAA Research, 2008). Finally, one might argue that perhaps distance running is more popular among men than women or is considered to be inappropriate for women. Participation data from the U.S. (see Table 1) contradict this, and studies of sport stereotyping conducted in several countries find that distance running is considered a gender-neutral activity (Italy: Lauriola, Zelli, Calcaterra, Cherubini, and Spinelli, 2004; Sweden: Koivula, 1995; U.S.: Matteo, 1986; U.K.: Colley, 1987).
In contrast to such explanations, the evolved male predisposition hypothesis apparently accounts for all aspects of the sex difference in performance depth. Perhaps most impressively, it predicts the stability of this sex difference in the U.S. among both elite (Deaner, 2006a, 2011) and non-elite runners (present study). This stability is especially remarkable given the well documented increases in opportunities and incentives for women in the U.S. beginning in the 1970s (Shulman and Bowen, 2001; U.S. Department of Education, 2003; Suggs, 2005; Stevenson, 2007). These increased opportunities and incentives have given rise to claims that girls' and women's interests and motivations in athletics are converging with those of men's (Dowling, 2000; McDonagh and Pappano, 2007; Messner, 2002). However, it appears that the only empirical data bearing on such claims are the historical studies of the sex difference in relative running performance, which clearly contradict them.
In conclusion, two final points should be stressed. First, although it has been argued that the stable sex difference in performance depth for U.S. runners is best explained by the evolved male predisposition hypothesis, this conclusion should be taken as provisional, and more work remains to be done. For instance, scientists should explore explanations for the sex difference in performance depth besides differences in the motivation to train. Similarly, even if it turns out that the sex difference in performance depth in running is best accounted for by the evolved male predisposition hypothesis, it would be unwise to assume that this hypothesis will apply to all domains and contexts. Scientists should investigate whether the sex difference in performance depth in running holds in other nations (see Frick, 2011); they should explore possible sex differences in performance depth in other easily quantifiable athletic domains, such as swimming and biking; they should explore sex differences in enduring competitiveness in non-athletic domains, such as chess (de Bruin, Smits, Rikers, Henk, and Schmidt, 2008); and they should study the factors that affect individual decisions to pursue achievement in particular domains (e.g., Lubinski and Benbow, 2007).
The final point is that the ultimate benefit of studying sex differences in enduring competitiveness is not to dogmatically support an essentialist position (e.g., “Men, but not women, compete.”) The payoff, instead, should be insight into the various factors that affect long-term achievement motivation. The current study only considered gender, but Deaner (2011) highlighted how achievement motivation should be affected by whether achievement in the domain yields relatively greater status or resources, and other studies taking an evolutionary perspective have shown how achievement motivation can be affected by the prioritizing of mating or parenting (Kanazawa, 2003; Farrelly and Nettle, 2007; see also Ceci and Williams, 2010). As research better characterizes sex differences in motivation and how these interact with environmental and social conditions, it should be possible to craft policies to better achieve desirable outcomes, including policies that provide men and women with genuinely equal achievement opportunities (Ceci and Williams, 2010).
Footnotes
Acknowledgements
For helpful comments on previous drafts of this paper, the authors thank Kevin R. Peters, William Rogers, and two anonymous reviewers.
Appendix A. Race Sample and Key Characteristics

| Mean | Mean | Mean | |||
|---|---|---|---|---|---|
|
|
|||||
| Name, Distance, & Location | Years | Years with data | Finishers | M:F | % Sex difference |
| Around the Bay 30K Hamilton, ONT a | 86–94 | 8 | 638 | 4.1 | 0.38 |
| Boilermaker 15K Utica, NY b | 85–06 | 22 | 3022 | 2.3 | 0.26 |
| Buffalo Marathon (42.195K) Buffalo, NY | 89–98, 01–05 | 2 | 353 | 3.2 | −1.47 |
| Buffalo State College Bengal Run 5K Buffalo, NY | 98–00, 03–04 | 0 | - | - | - |
| Depew-Lancaster Boys Club 10K Lancaster, NY | 83, 85–88, 92–06 | 12 | 255 | 3.0 | −0.17 |
| Erie County Fair 5K Hamburg, NY | 98–04 | 3 | 171 | 1.3 | −0.52 |
| Fisher-Price 5K East Aurora, NY | 95–00, 01–03 | 2 | 214 | 1.2 | 1.15 |
| Hamburg Bun Run 5K Hamburg, NY | 88, 90–92, 94–95 | 2 | 207 | 2.7 | 0.07 |
| Heart Run 5K Amherst, NY | 91–95 | 0 | - | - | - |
| Hillside Run for Kids 5 Mile (8.04K) Rochester, NY a | 91–98 | 8 | 374 | 2.4 | 0.63 |
| J.Y. Cameron Buffalo Turkey Trot 8K Buffalo, NY | 81–05 | 25 | 1644 | 2.1 | 1.78 |
| Lebros Fall Classic 5K Amherst, NY | 90–94 | 3 | 286 | 2.2 | 0.00 |
| Lilac 10K Rochester, NY a | 82, 84–97, 99–04 | 21 | 1021 | 2.5 | 0.55 |
| Linda Yalem 5K Buffalo, NY | 91–97, 99–04 | 10 | 523 | 1.1 | 2.07 |
| N.F. YMCA Festival of Lights 5K Niagara Falls, NY | 95–00 | 2 | 188 | 1.5 | 0.53 |
| Nickel City 5K Buffalo, NY | 86–04 | 17 | 755 | 1.7 | 1.87 |
| Old First Ward Shamrock Run 8K Buffalo, NY | 84–06 | 22 | 1139 | 2.2 | 2.31 |
| Pit Run 10K Oneonta, NY b | 99–02 | 2 | 274 | 1.2 | 0.85 |
| Police Chase 5K Buffalo, NY | 87–04 | 14 | 226 | 2.0 | 1.39 |
| Praxair 10K Tonawanda, NY | 92–97 | 6 | 207 | 2.8 | 0.56 |
| Run for Hospice 10 Mile (16.08K) Rochester, NY a | 02–04 | 1 | 130 | 1.2 | 1.69 |
| Run for Grapes 10 Mile (16.08K) St. Catharines, ONT a | 84–88, 98 | 5 | 311 | 3.9 | −0.08 |
| Run for Grapes 5K St. Catharines, ONT a | 92–99 | 5 | 299 | 1.5 | 1.75 |
| Run for Shamrocks 5 Mile (8.04K) Rochester, NY a | 85–97, 00–05 | 17 | 520 | 2.6 | 1.02 |
| Sallie Mae 10K Washington, DC b | 95–02, 04 | 9 | 975 | 1.2 | 0.75 |
| Skylon International Marathon (42.195K) Buffalo, NY | 81–86 | 2 | 666 | 8.2 | 0.04 |
| St. Gregory the Great 5K Williamsville, NY | 96–04 | 3 | 399 | 1.2 | 0.79 |
| Subaru Chase 4 Mile (6.44K) Buffalo NY | 82–04 | 23 | 457 | 2.4 | 0.36 |
| WBEN Run for Your Life 20K Buffalo, NY | 82–84, 86–90 | 5 | 304 | 4.8 | −4.56 |
| Wegmans 5K Rochester, NY a | 93–95 | 3 | 576 | 2.3 | 0.07 |
Note: Data on years with data, finishers, m:f ratio, and percentage sex difference are based only on races where at least 1 male and 1 female achieved the
50–120km from Buffalo
>300km from Buffalo. For definition of % sex difference, see Methods.
Appendix B. 10-Fastest and World Record Gender-specific Standards

| 10-Fastest | World Best | |||||
|---|---|---|---|---|---|---|
|
|
||||||
| Distance | Male | Female | % Difference | Male | Female | % Difference |
| 5K | 13:13.8 | 14:52.2 | 12.4 | 12:59.5 | 14:46 | 13.7 |
| 4 mile (6.44K) | 17:28.1 | 19:46.4 a | 13.2 | 17:07 | 19:28 | 13.7 |
| 8K | 21:47.9 | 24:34.5 | 12.7 | 21:36 | 24:16.56 a | 12.4 |
| 10K | 27:14.9 | 30:43.1 | 12.7 | 27:01 | 30:20.7 | 12.4 |
| 15K | 41:55.9 a | 47:21.7 | 13.0 | 41:28.8 a | 46:27.7 | 12.0 |
| 10 mile (16.08K) | 44:57 a | 50:52.5 a | 13.2 | 44:23 a | 50:02.66 a | 12.8 |
| 20K | 55:24.5 a | 1:03:16.6 a | 13.2 | 55:02.1 | 1:02:14.6 a | 12.1 |
| Half marathon (21.098K) | 58:58.6 | 1:06:45 | 13.2 | 58:35 | 1:05:39.6 | 12.1 |
| 30K | 1:28:45.9 a | 1:37:57.9 a | 11.5 | 1:28:00 | 1:36:16.4 a | 9.4 |
| Marathon (42.195K) | 2:04:50.9 | 2:19:11.7 | 11.5 | 2:03:58.2 | 2:15:24.6 | 9.2 |
Note: None of the races in our sample were half marathons, but half marathon standards are provided here because they were often the basis for calculating other standards.
Standard based on speed from longer distance standard.