
Abstract
Although much recent attention has focused on identifying domain-specific taxonomic differences in cognition, little effort has been directed towards investigating whether domain-general differences also exist. We therefore conducted a meta-analysis of published nonhuman primate cognition studies, testing the prediction that some taxa outperform others across a range of testing situations. First, within each of nine experimental paradigms with interspecific variation, we grouped studies by their procedures and the characteristics of their study subjects. Then, using Bayesian latent variable methods, we tested whether taxonomic differences consistently held within or across paradigms. No genus performed especially well within particular paradigms, but genera differed significantly in overall performance. In addition, there was evidence of variation at higher taxonomic levels; most notably, great apes significantly outperformed other lineages. These results cannot be readily explained by perceptual biases or any other contextual confound and instead suggest that primate taxa differ in some kind of domain-general ability.
Introduction
A major goal for many comparative psychologists of previous generations was to identify taxonomic differences in overall intelligence (e.g., Köhler, 1925; Warden, 1951; Harlow, 1958; Bitterman, 1965). Few current workers, however, believe it is still profitable to pursue this line of research. For one thing, there is now compelling evidence that individuals possess many distinct cognitive abilities, including specific types of learning, memory, and timing (e.g., Sherry & Schacter, 1987; Gallistel, 2000). In addition, investigators taking a comparative evolutionary approach have identified domain-specific abilities that were apparently selected to increase an animal's fitness in its taxon-typical environment (e.g., Rozin, 1976; Kamil, 1988; Shettleworth, 1998).
Although the notion of ranking taxa on a uni-dimensional scale of intelligence is flawed, there could be instances where one taxon possesses better domain-general cognition than another. Specifically, although taxon A might share many abilities with taxon B or lack some of B's domain-specific abilities, if A possessed an ability or abilities that allowed it to excel in a wide variety of contexts requiring behavioral flexibility (cf. fluid intelligence: Cattell, 1971), the claim of some sort of domain-general cognitive difference would be appropriate. Demonstrating the existence of such a difference will clearly be difficult, but we suggest that progress can be made with the following steps: (1) focusing on a taxonomic group where species have similar motor and sensory capacities; (2) considering all paradigms (i.e., general kinds of problems) where interspecific variation has been identified; (3) and testing whether some taxa consistently perform better than other ones across the paradigms.
This meta-analysis approach has two important advantages. First, it largely resolves the performance-ability conundrum (i.e., the fact that performance differences may arise because animals differ in motivation, adaptability to the testing situation, or ability or preparedness to perceive or respond to the experimental stimuli: Bitterman, 1965; Warren, 1974; MacPhail, 1982). If the same taxonomic difference is found in a range of situations, the likelihood diminishes that the differences merely reflect a particular testing variable (Kamil, 1988). Second, considering performance in a number of paradigms explicitly addresses the issue of domain-generality: if one taxon truly has better domain-general cognition than another, it should perform better in a variety of unrelated situations. In contrast, investigations attempting to test for uni-dimensional intelligence have often searched (unsuccessfully) for a single “holy grail” paradigm (Schrier, 1984).
Here we apply this approach to the order primates, a group that is ideal for three reasons. First, much relevant information has already been collected, meaning that it is possible to conduct an analysis with a reasonable degree of statistical power. Second, despite all of the research, there are few demonstrations of taxon-specific, domain-limited cognitive abilities in primates (e.g., Platt, Brannon, Briese, & French, 1996; Stevens, Hallinan, & Hauser, 2005). The paucity of such demonstrations (if truly indicating few specializations), should increase the possibility of detecting domain-general differences, the existence of which has been repeatedly suggested in primates (e.g., Köhler, 1925; Jolly, 1966; Parker & Gibson, 1977; Byrne, 1995; van Schaik, Deaner, & Merrill, 1999; Reader & Laland, 2002). Third, although primates are behaviorally diverse, most taxa are highly dependent on visual processing and possess considerable manual coordination. Hence, the same testing procedures should be applicable for most subjects.
Several previous studies have surveyed primate cognition and reached a range of answers to the question of whether there are overall taxonomic differences across paradigms (e.g., Rumbaugh, 1970; Ehrlich, Fobes, & King, 1976; Tomasello & Call, 1997). The divergent conclusions can be attributed to the fact that none of the surveys have been performed systematically. In particular, they combined data that were collected with substantially different procedures, compared subjects of differing ages and experience, and based their overall conclusions on qualitative impressions, rather than statistical tests.
Therefore, in the present study, we (1) attempt to exhaustively search the literature for all relevant data, (2) restrict comparisons to subjects with similar backgrounds and studies conducted with extremely similar procedures, (3) use explicit criteria for deciding if there is a taxonomic difference within a type of study procedure, and, finally, (4) employ a recently developed hierarchical Bayesian model (Johnson, Deaner, & van Schaik, 2002) to test if taxa perform especially well across all paradigms or instead excel in particular paradigms. By systematically addressing these issues in a well-studied lineage, this paper provides a strong test of the hypothesis that there are taxonomic differences in domain-general cognition.
Materials and Methods
We began by searching published reviews of primate cognition (e.g., Rumbaugh, 1970; Ehrlich et al., 1976; Fobes & King, 1982; King & Fobes, 1982; MacPhail, 1982; Tomasello & Call, 1997), looking for indications of inter-specific variability within experimental testing paradigms that were deemed relevant to issues of “learning”, “cognition”, or “intelligence”. We eliminated from consideration paradigms where animals were not rewarded for their performance because, in this situation, poor performance could be indicative of an animal being unmotivated or misunderstanding the experimenter's expectations. Examples of this are investigations of object manipulation, gaze-following, and mark tests of “self recognition” (see Tomasello & Call, 1997).
After identifying potentially useful paradigms, we went to the relevant research articles, searched these for other relevant citations and then repeated the process several times. We also employed the “PsychLit” computer database, searching with several keywords relevant to each paradigm. For instance, for the reversal learning paradigm we considered all articles that contained this phrase, “transfer learning”, or “intra-dimensional shift learning.” Although we attempted to exhaustively search the relevant literature, our survey is likely biased towards reports in English. We completed our literature survey in February of 2001.
A variety of procedures have been used to investigate most paradigms. For example, some studies of object discrimination learning sets employ six trials per problem, whereas others administer trials until a criterion level of performance is reached. In most cases, procedural differences are known or expected to affect performance. Thus, we only pooled data from separate studies if they were conducted with extremely similar or identical procedures. Rather than rating one type of study procedure as better than the others, we retained data from all suitable procedures. Therefore, for most paradigms, several separate taxonomic rankings were obtained. We refer to these separate taxonomic rankings as procedure rankings within paradigms.
To make statistical treatment more tractable, and because most behavioral variation in primates occurs at higher-order taxonomic levels (e.g., Harvey, Martin, & Clutton-Brock, 1987), we used the genus, rather than the species, as the minimal taxonomic unit. The data on the various macaque species, for example, were all grouped into Macaca. Because most proposed differences occur at even higher-order taxonomic levels than the genus, we also conducted some analyses after placing genera into the following groups: prosimians (Eulemur, Galago, Lemur, Microcebus, Nycticebus, Phaner, Varecia), New World monkeys (Aotus, Ateles, Callithrix, Cebus, Lagothrix, Saimiri), Old World monkeys (Cercocebus, Cercopithecus, Macaca, Mandrillus, Miopithecus, Papio, Presbytis), lesser apes (Hylobates) and great apes (Gorilla, Pan, Pongo). To further keep the study manageable in scope, we only considered paradigms where comparisons involved at least three genera. In several cases, a single procedure only allowed a comparison between two genera, but this information was included if there were other procedures within the paradigm. Thus, if there were two procedures within a paradigm and both involved comparing two taxa, we retained data from both procedures.
Taxonomic comparisons would ideally occur among a random sample of subjects that each had species-typical rearing histories, similar maturity levels, motivation, and experience relevant to the testing situation. Towards this end, we took the following steps. First, we omitted subjects that were drawn from a larger pool because they were thought to have unusually poor or excellent abilities. Second, we omitted all subjects that were reared in social isolation or had undergone neurosurgery (although control subjects from neurosurgery studies were considered). We did not omit great ape subjects that had extensive language or symbolic training because there is no indication that this experience affects performance on tasks involving non-social cognition (Call & Tomasello, 1996), and all data were drawn from non-social paradigms. Third, we excluded infants, operationally defined as animals whose age at testing was indicated to be less than 1/5 the age at first reproduction (AFR; data from Ross & Jones, 1999). In most great apes, for example, this corresponds to less than about two years, whereas in most Old World monkeys it corresponds to less than about one year. Because performance may improve considerably after 1/5 AFR (e.g., delayed response: Harlow, Uehling, & Maslow, 1932; Maslow & Harlow, 1932; object discrimination learning sets: Fobes & King, 1982; patterned-string problems: Mason & Harlow, 1961), we also repeated all tests after excluding animals that were less than 1/2 AFR. In many studies, ages were not provided: to be conservative, if no information was available or if subjects were described as “juveniles”, “immatures”, or “adolescents”, we considered them to be at least 1/5 AFR but less than 1/2 AFR; if animals were described as “late adolescents”, “late juveniles”, “subadults” or “adults”, we considered them to be at least 1/2 AFR. Fourth, we frequently omitted subjects that were known to differ from others in experience known to be relevant to the task (see Appendix A). Fifth, one study was omitted where investigators noted that animals were not tested with a favored or preferred food (Riopelle & Moon, 1968). Finally, in one case, we omitted subjects that did not attempt to solve the problem (Davis & Leary, 1968).
In ranking genera within procedures, we had to consider two opposing concerns. On one hand, we did not wish to rank one genus over another based on extremely small performance differences, because such differences are likely to reflect various sorts of error, rather than intrinsic differences. On the other hand, because most studies employed modest sample sizes, if we only assigned rankings when taxa differed significantly or dramatically, there would be very little data left to analyze. In an effort to balance these two concerns, we used the following guidelines.
For qualitative comparisons, we considered taxa to be different if they met either of two criteria. First, at least half of the subjects of one taxon performed positively (i.e., met some qualitative distinction), and none of the subjects of the other taxon performed positively; there had to be a minimum of two subjects in the taxon with no positive performance. Second, all subjects of one taxon performed positively, and less than half of the subjects of the other taxon performed positively; there had to be a minimum of two subjects in the taxon with all positive performance.
We also used two criteria for making quantitative distinctions. First, in cases where there was a single relevant performance measure, either the original investigators or we had to demonstrate statistically significant taxonomic variation. For establishing taxonomic variation within study procedures, we set significance at a = 0.05 and used two-tailed tests. Second, in procedures where multiple measures were available, we sought evidence of significant taxonomic variation in at least one measure or consistent taxonomic variation across all measures (i.e., one taxon doing better than others did across all types of problems, or problem blocks).
Employing these quantitative criteria was sometimes difficult because in procedures where data were available for three or more taxa, there were often problems of intransitivity in significance or consistency. For instance, genus A might have a significantly (or consistently) higher overall mean score than genus C but only a slightly (and non-significantly) higher score than genus B; genus B, however, might not have a significantly higher score than genus C. We generally resolved intransitivities by assuming that once significant or consistent overall variation had been demonstrated across all taxa, all differences among taxa were meaningful. So, in this example, we would rank genus A first, genus B second, and genus C third, rather than considering them all tied or representing the information in some other way. Another complication was that in some cases where overall taxonomic variation was demonstrated among three or more taxa, two taxa might differ on measures that could not be quantitatively collapsed. For instance, one taxon might score higher score on one problem type, the other taxon might score higher on another, and collapsing the scores into some sort of grand mean would be unjustified. In such cases, we generally regarded the taxa as tied. In the specific procedures where this issue arose, it is addressed in more detail.
The sample: paradigms, procedures and rankings
This section briefly describes and reviews each of the paradigms employed. Under each paradigm are subsections providing details on each of the procedures that allowed taxonomic rankings. We attempt to provide enough detail on each procedure to give a flavor for the research and to make clear the reasoning for the grouping the studies as we did. In doing so, we make it possible to repeat this study using slightly different decision rules.
Within each procedure, we list the number of subjects for each genus that were considered to be at least 1/5 AFR. We also note whether they participated in other studies included in the data set, allowing us to address the possible impact of pseudo-replication. We generally do not discuss subjects' pre-training or prior experience because, if it differed substantially from that of others within the procedure, the exceptional subjects were excluded or grouped with other, similarly experienced subjects in other procedures. We state the criteria used in ranking the genera and the evidence that indicated meaningful taxonomic variation. For quantitative measures, we only provide details of statistical tests if there was no documentation of meaningful variation in the original publications. We also note if any subjects were excluded because of evidence of poor motivation. Finally, we note if comparisons could be made among subjects greater than 1/2 AFR. The overall rankings for all procedures across all paradigms are presented in Table 1.
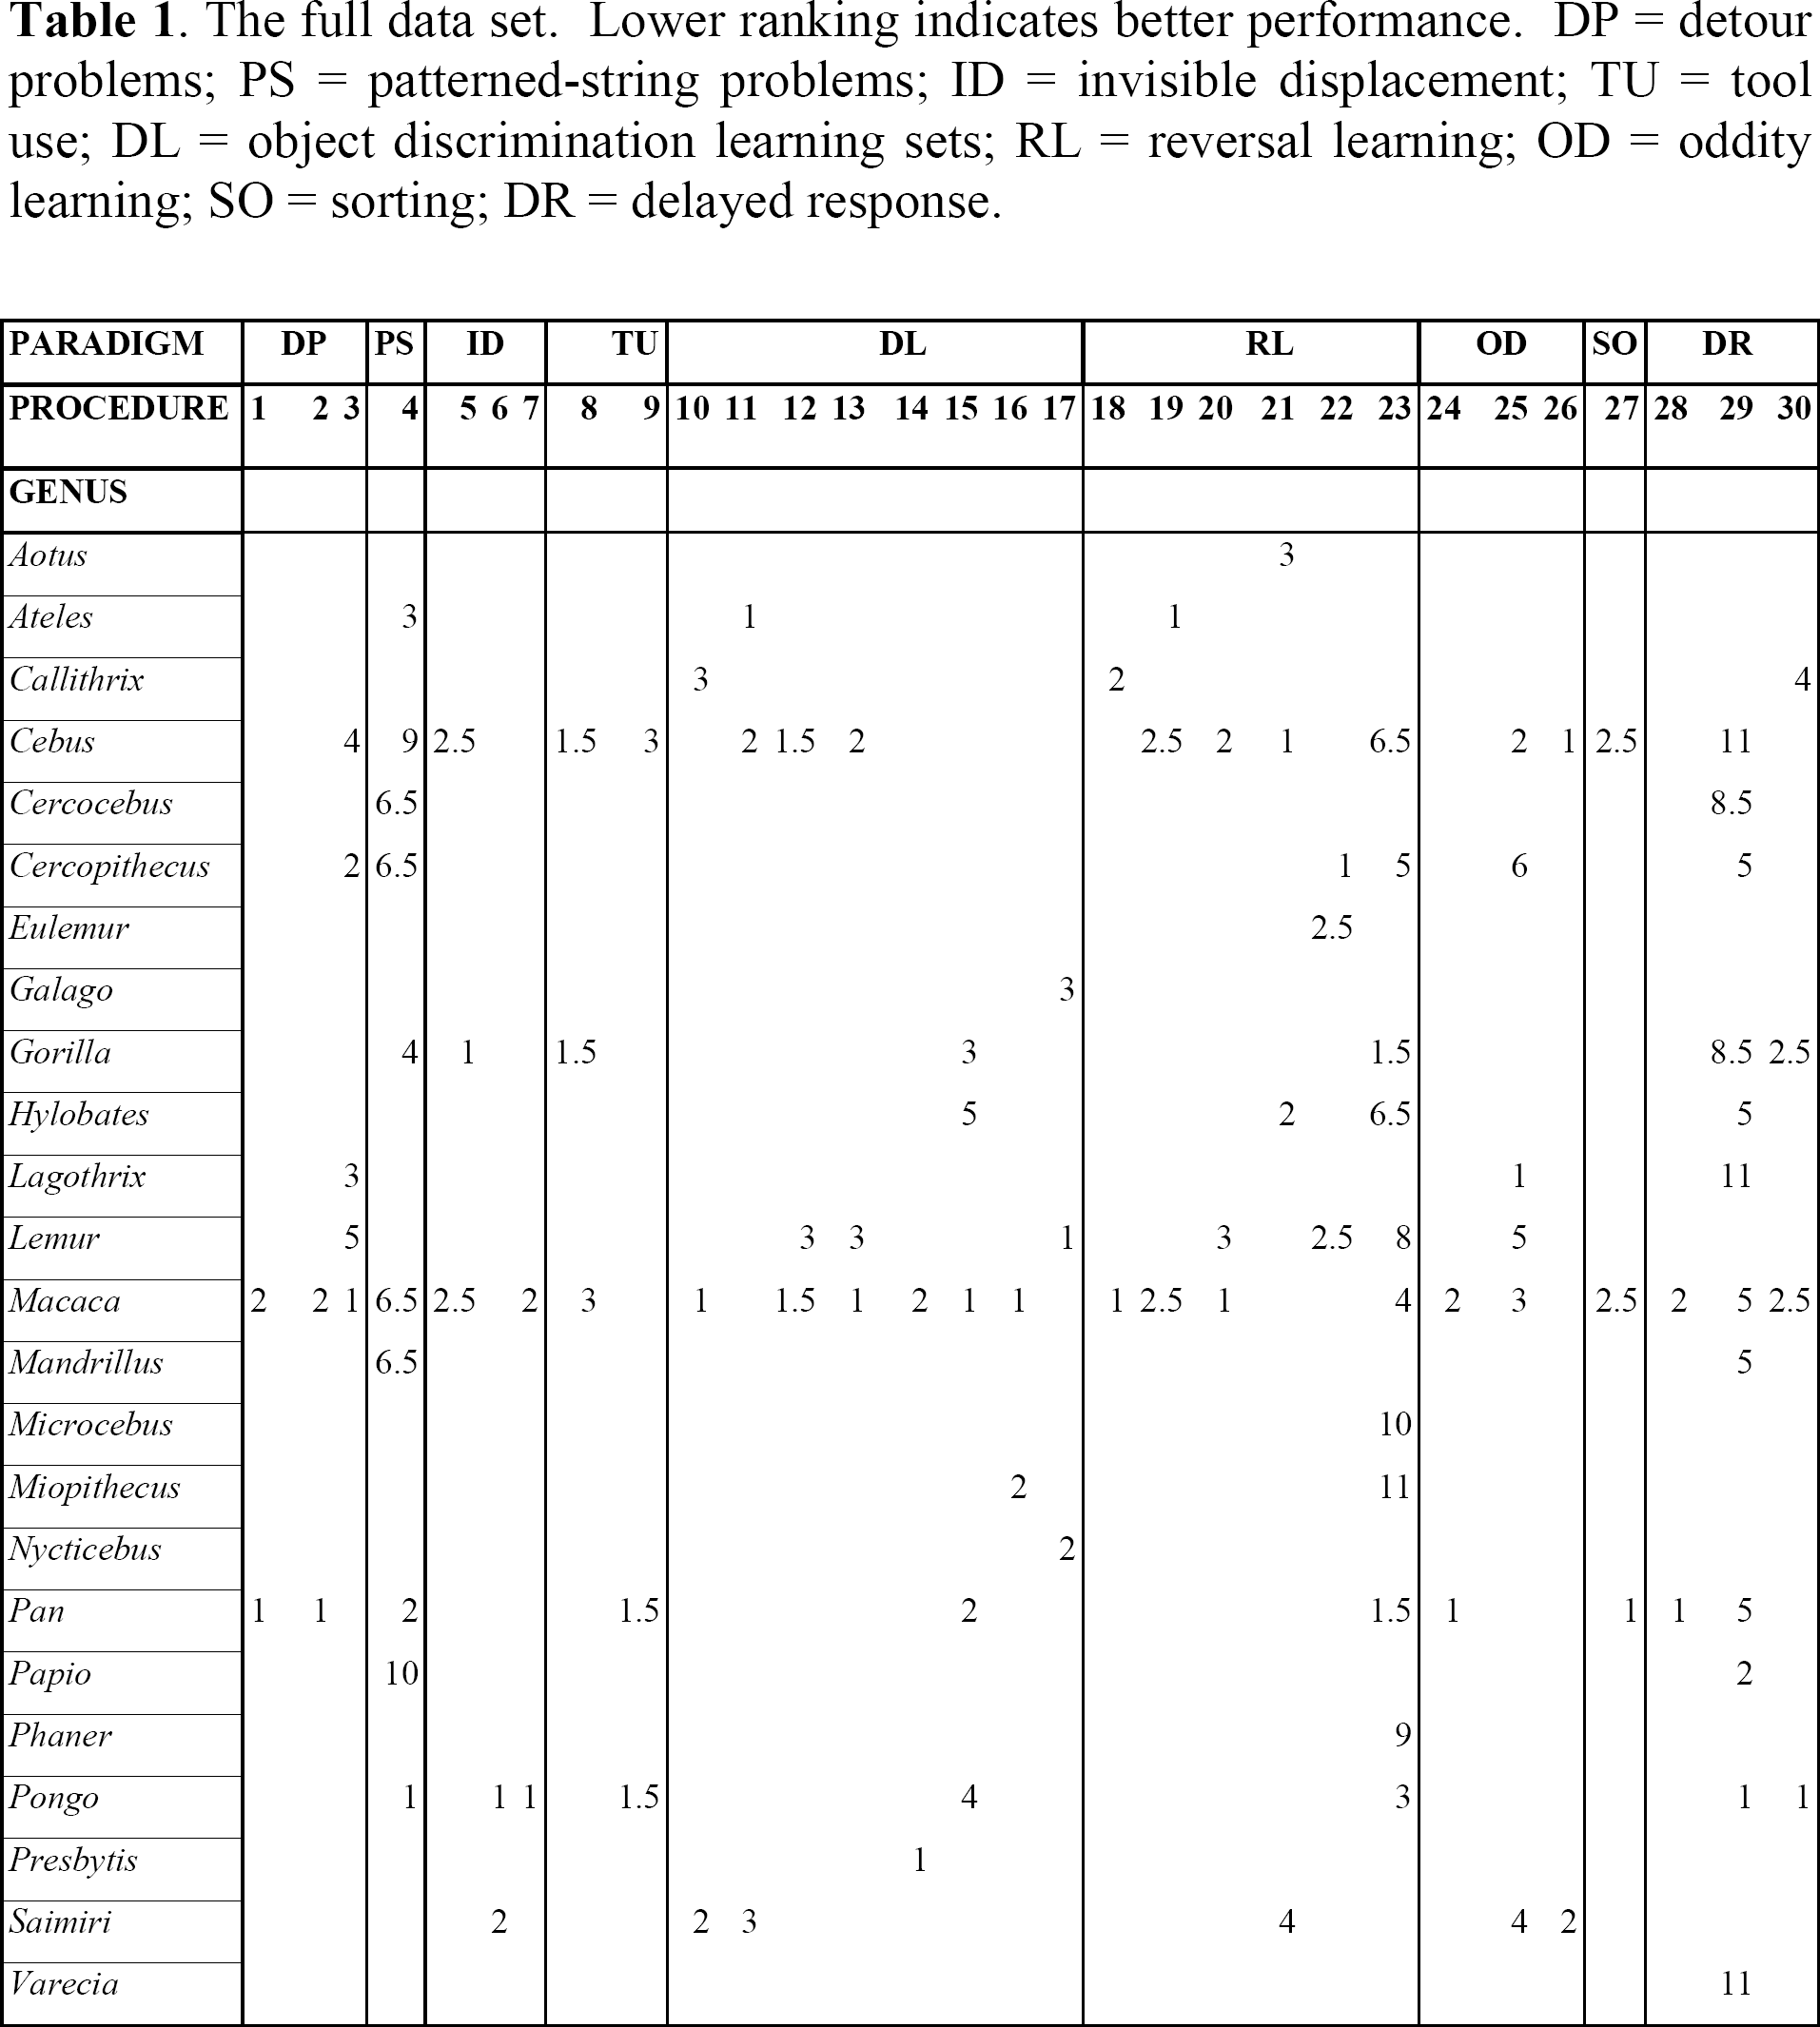
The full data set. Lower ranking indicates better performance. DP = detour problems; PS = patterned-string problems; ID = invisible displacement; TU = tool use; DL = object discrimination learning sets; RL = reversal learning; OD = oddity learning; SO = sorting; DR = delayed response.
Despite the details presented above, there may still be questions regarding why we did not include particular studies in the analysis. To more fully explain these decisions, we have provided two appendices. Appendix A discusses particular studies that do fit within the paradigms we employed but that, nevertheless, could not be incorporated in our analysis. Generally, these studies could not be used because they did not provide data on multiple taxa, did not reveal significant taxonomic variation, or, because of procedural differences, could not be combined with other studies within their paradigm. Appendix B lists paradigms from which researchers have drawn, or might consider drawing, taxonomic distinctions and clarifies why these paradigms could not be included in our sample. Appendices A and B are not intended to serve as a comprehensive guide to all primate cognition studies that were not included; they are meant only to clarify our decision making for the studies about which readers are most likely to be curious.
Detour Problems
Detour problems investigate the ability to form and act on spatial representations. Although detour problems frequently focus on subjects' locomotion through mazes, primates have mainly been investigated on problems where they are required to manually move an object through a spatial field that contains one or more obstacles.
procedure 1. Davis, McDowell, & Nissen (1957) tested seven Pan and 16 Macaca on problems where a preferred food was impaled on a bent wire. For instance, in one problem the subject had to first move the food to her right before pulling it towards her, whereas in another problem, the subject had to move the food to her left and then push it away from her. There were 40 different kinds of bent wire problems in all. Across all problem blocks and all problem types, Pan performed better than Macaca, and hence was ranked lower (i.e., superior). Because no data were presented on Macaca that were greater than 1/2 AFR, this study only applies to greater than 1/5 AFR analyses.
procedure 2. McDowell & Nissen (1959) tested 24 Macaca and five Pan in a series of problems where subjects worked to free a food-containing stylus. (Most subjects had participated in procedure 1.) The stylus was positioned behind a short ladder, so that it could only be obtained by alternately using two hands to bring the stylus to the top of the ladder. On all variations of the problem, Pan performed better than Macaca and hence was ranked lower. All subjects were greater than 1/2 AFR.
procedure 3. Davis & Leary (1968) tested 19 Macaca, two Cercopithecus, four Cebus, four Lagothrix, four Lemur and seven Saimiri on three kinds of bent wire detour problems (similar to procedure 1). Data were presented on mean success rate at seven separate time blocks, for each species. After calculating weighted mean scores for all Macaca (three species were included), we used analysis of covariance (ANCOVA) on the log-transformed test scores to confirm that there was significant variation across genera across time blocks (F(10,24) = 5.40; p < 0.0005). We then calculated a grand mean for each genus and ranked them from lowest to highest, as follows: Macaca, Cercopithecus, Lagothrix, Cebus, and Lemur. We omitted Saimiri from the rankings because most subjects did not attempt to solve the problem. Because the subjects' ages were not provided, this study was only incorporated in the greater than 1/5 AFR analyses.
Patterned-string problems
Patterned-string problems investigate the ability to represent spatial representations among objects. In this paradigm, a subject is shown an array of strings (or wires), one of which is tethered to a desirable food. The subject is allowed to pull only one of the strings, and hence must determine before pulling which string is actually attached to the food. The difficulty is that many patterned-string problems consist of strings that cross or are otherwise misleading.
Cha & King (1969) presented evidence indicating that Saimiri may solve patterned-string problems by simply learning which perceptual configurations have been previously rewarded. If this is true generally, taxonomic differences in patterned-string problems might reflect differences in perception and discrimination learning rather than spatial representation (Tomasello & Call, 1997). Nevertheless, a learning strategy cannot explain why many non-Saimiri subjects perform virtually perfectly from the onset of trials, and why, across subjects, these superb performances tend to occur on the same “easy” problems (see papers cited in procedure 4). Thus, patterned-string problems probably do reflect the ability for spatial representation, at least for subjects that perform well.
procedure 4. Harlow & Settlage (1934) first employed the method of giving subjects 10 standardized patterned string problems for approximately 100 trials. Subsequent investigations (Finch, 1941; Riesen, Greenberg, Granston, & Fantz, 1953; Fischer & Kitchener, 1965; Balasch, Sabater-Pi, & Padrosa, 1974) employed extremely similar methods, allowing us to pool data for 20 Macaca, three Cercocebus, two Cercopithecus, one Papio, six Mandrillus, two Cebus, one Ateles, four Pan, five Gorilla, and two Pongo. We first calculated the mean error score for each genus on each problem and then conducted a two-way analysis of variance (ANOVA) to confirm that there was significant variation across genera across all problems (F(18,80) = 10.44, p < 0.0001). We then ranked genera according to their mean score across all problems and obtained the following ranking, from least to most errors: Pongo, Pan, Ateles, Gorilla, Mandrillus, Cercocebus, Macaca, Cercopithecus, Cebus, and Papio. Tomasello & Call (1997) suggested that taxonomic comparisons may be most meaningful if only the most difficult problems are considered. Because the error rates on the rates on the last two problems are 1.7 to 10 times higher than on the first eight problems, we re-ranked the taxa based only on the means on these last two problems. The first four and last two rankings remained unchanged, but the ranks of Mandrillus, Cercocebus, Macaca, Cercopithecus differed, and we therefore considered these genera tied. Finally, we repeated the analysis after omitting all subjects (n = 11) that were not at least 1/2 AFR. The rankings were very similar and, furthermore, did not change when we repeated the analysis using only the two most difficult problems. In this case, the rankings were Pan, Ateles, Cercocebus, Mandrillus, Macaca, Cercopithecus/Papio (tied), and Cebus.
Invisible displacement
The invisible displacement paradigm is best understood as an extension of the visible displacement paradigm, a paradigm where virtually all species studied so far succeed (reviewed in Doré & Dumas, 1987; Tomasello & Call, 1997). In the visible displacement paradigm, a subject views an object moving towards and then disappearing behind one or more barriers. If the subject searches the barrier behind which the object disappeared, this suggests the subject can represent the existence of unperceived objects or possesses object permanence. By contrast, in most variations of the invisible displacement paradigm, the subject views an object being placed into a container, the container is moved behind one or more barriers, and then the subject is shown that the container is empty. If the subject searches only the barriers behind which the container passed, it indicates the subject can represent the existence and spatial movements of unperceived objects.
Numerous studies of invisible displacement have been conducted, but unfortunately most of them cannot be used for making taxonomic comparisons. One problem is that early studies did not employ adequate controls to ensure that successful searching was actually mediated by a representational strategy, rather than a spatial or associatively learned rule (reviewed in Natale, Antinucci, Spinozzi, & Poti, 1986; Gagnon & Doré, 1992). A second problem is that, although the capacity to represent the existence and movements of unperceived objects has been traditionally viewed as a monolithic entity (i.e., a subject is or is not capable), recent research indicates that performance is dependent on the specific requirements of the problem and/or a subject's previous experience (Filion, Washburn, & Gulledge, 1996; de Blois, Novak, & Bond, 1999). Thus, as for other paradigms, comparisons must be restricted to studies conducted with the same procedures. Because of the number and complexity of the test conditions in each study, we have not provided procedural details. For these, we urge readers to consult the original publications.
procedure 5. Natale & Antinucci (1989; see also Natale et al., 1986) tested one Gorilla, four Macaca and two Cebus, and after employing a variety of control procedures, showed that only the Gorilla used a representational strategy to solve the task. Because several of the subjects, including the Gorilla were less than 1/2 AFR, this data only counts towards greater than 1/5 AFR analyses.
procedure 6. de Blois, Novak, & Bond (1998) tested seven Pongo and nine Saimiri in a variety of conditions and found that most or all Pongo subjects used a representational strategy to solve some kinds of invisible displacement problems. In contrast, there was no evidence that any Saimiri subjects were capable of solving problems in this way. All subjects were greater than 1/2 AFR.
procedure 7. de Blois et al. (1999) tested seven Pongo (all had participated in procedure 6) and five Macaca (see de Blois & Novak, 1994) on a series of problems that were designed to detect if memory demands affect invisible displacement performance. There was no evidence that any of the Macaca spontaneously employed representational strategies, whereas there was such evidence for four Pongo subjects. All subjects were greater than 1/2 AFR.
Tool Use
Tool use addresses abilities to understand and manipulate how one's actions affect an intermediate object (the tool), and how the intermediate object affects another object or substrate. It thus involves aspects of causal reasoning, spatial representation, and motor coordination. Although many aspects of primate tool use have been well-studied (reviewed in Beck, 1980; Tomasello & Call, 1997; van Schaik et al., 1999), there are remarkably few experimental studies that indicate taxonomic differences in the abilities which underlie tool use.
procedure 8. Natale (1989) studied the development of one Gorilla, three Macaca, and four Cebus in “the stick problem”. (All subjects had participated in procedure 5). Here food is placed beyond a subject's reach, and a stick is placed in one of several positions near the food; the subject's task is to employ the stick as a rake to access the food. All of the subjects readily manipulated the stick and, at least occasionally, succeeded in accessing the food. Furthermore, the gorilla and three of four Cebus learned to systematically make contact between the stick and the reward. In contrast, the three Macaca and one of the Cebus did not develop this strategy, instead manipulating the stick without reference to the reward, a practice that was less successful. Hence, Gorilla and Cebus were ranked tied and superior to Macaca. The gorilla subject was less than 1/2 AFR, as were one Cebus and one Macaca. Of the remaining subjects, two of three Cebus learned to make systematic contact and none of the three Macaca did. Hence, Cebus was ranked superior to Macaca in the greater than 1/2 AFR analysis.
procedure 9. Visalberghi, Rumbaugh, & Fragaszy (1995) tested six Cebus, five Pan, and one Pongo in a task where a food reward was placed inside a transparent tube. After subjects had shown the ability to use a dowel to push the food free, they were provided with a bundle of sticks that was too wide to insert into the tube. All but one of the Cebus repeatedly made the error of attempting to insert the entire bundle into the tube. In contrast, all Pan and Pongo subjects consistently unbundled the sticks before attempting to insert one in the tube. Thus, Pan and Pongo can be ranked below Cebus. All of the Cebus, one Pan and the one Pongo were greater than 1/2 AFR, so this ranking also applies to that analysis.
Object Discrimination Learning Set
In the object discrimination learning set paradigm, the subject is first confronted with the problem of discriminating between two “junk” objects. One of the objects is arbitrarily designated correct, and the subject is rewarded for selecting it. The subject is given several trials under these conditions and usually will learn to consistently make the correct choice (regardless of the object's spatial position). The learning set phenomenon refers to the observation that if the subject is given another discrimination problem, with two novel stimuli, it will tend to learn this second discrimination problem more quickly than it did the first one. Over the course of several hundred problems, a subject's performance on trial 2 might improve from about 55% to 80%. (Trial 1 performance must be at chance levels, because there is no basis for discrimination.) Beginning with Harlow (1949), numerous investigations of the learning set phenomenon have led to the consensus that it truly indicates the use some type of abstract rule or hypothesis (e.g., “win-stay, lose-shift”) that goes beyond discrimination learning (reviewed in Miles, 1965; Fobes & King, 1982; Schrier, 1984).
Although there is a vast amount of published data on learning sets in different primate species, it is difficult to make meaningful quantitative comparisons because investigations usually differ in many ways that are known to affect performance. These include the amount pre-training and/or previous experience, the number of trials per problem, the use of a correction procedure, and the position of the objects relative to the food wells (reviewed in Miles, 1965; Fobes & King, 1982). Although improvements across trials (i.e., the learning set phenomenon) have been shown for many types of learning, we only present information in this section on object discrimination learning sets. Taxonomic comparisons for other types of learning improvements are included in other paradigms (e.g., detour problems, reversal learning, oddity learning).
procedure 10. Miles & Meyer (1956) & Miles (1957a) tested three Saimiri, three Callithrix, and four Macaca with six trials per problem after minimal pre-training. For trial 2 performance across all problem blocks, Macaca consistently outperformed Saimiri, which in turn consistently performed better than Callithrix. Rumbaugh Sammons, Prim, & Philips (1965a) tested four Saimiri with extremely similar procedures. Although Rumbaugh et al. (1965a) presented data on smaller problem blocks (50 vs. 200 problems), through interpolation, we were able to make some direct comparisons. In all cases, the Saimiri of Rumbaugh et al. (1965a) were also intermediate between Macaca and Callithrix. All Callithrix, and the Saimiri from Rumbaugh et al. (1965a) were greater than 1/2 AFR, allowing this ranking to be counted in the greater than 1/2 AFR analysis.
procedure 11. Shell & Riopelle (1958) tested three Ateles, six Cebus, and three Saimiri. Subjects had blocks of six trials per problem, alternated with blocks of problems that were learned to a criterion. On trial 2 of all problem blocks, Ateles performed better than Cebus, which, in turn, consistently performed better than Saimiri. Because all subjects were listed as adolescents, this data only counts for greater than 1/5 AFR analysis.
procedure 12. Stevens (1965) tested five Macaca, four Cebus, and three Lemur with six trials per problem after subjects had previously worked in studies of reversal and concurrent and successive discrimination learning. Across all problem blocks, Macaca and Cebus consistently performed better than Lemur on trials 2–6; however, Macaca and Cebus did not differ consistently or significantly from each other. Because the subjects' ages were not provided, this data only counts towards the greater than 1/5 AFR analysis.
procedure 13. Stevens (1965) tested five Macaca, four Cebus, and two Lemur (different subjects than in procedure 12) in problems where subjects worked on a particular discrimination until they reached a criterion of eight consecutive correct responses. Subjects had previously worked in studies of reversal and concurrent and successive discrimination learning. Across all problem blocks, Macaca consistently performed better than Cebus, which, in turn, consistently performed better than Lemur. Because the subjects' ages were not provided, this data only counts towards the greater than 1/5 AFR analysis.
procedure 14. Manocha (1967) tested four Presbytis and six Macaca with six trials per problem. This study was unusual because stones were used as discrimination objects, and data were presented on performance across all six trials, rather than just for trial 2. Across all problem blocks, Presbytis performed better than Macaca. All subjects were greater than 1/2 AFR.
procedure 15. Rumbaugh & McCormack (1967) tested six Pan, three Pongo, seven Gorilla, five Hylobates, and seven Macaca in several conditions. Subjects first were given 500 problems of six trials each; then they were given 25 trial problems until they scored 20 correct for 10 out of 12 consecutive problems (inter-problem criterion); finally, they were given 50 problems of two trials each. There was very little variation in the second condition but, in the first and third conditions, there was variation, and rankings were consistent: Macaca, Pan, Gorilla, Pongo, and Hylobates. When we removed subjects that were less than 1/2 AFR (n = 17), the rankings on phase 1 one were Gorilla, Macaca, Pan, Hylobates, Pongo. On phase two the rankings were Macaca, Pan, Gorilla, Hylobates, and Pongo. Because we consider taxa with inconsistent rankings to be tied, the final ordering for subjects greater than 1/2 AFR was Macaca/Gorilla/Pan (tie), Hylobates, and Pongo.
procedure 16. Schrier (1972) tested six Macaca and four Miopithecus in a higher-order type of object discrimination learning set study. Subjects first learned a series of 24 color or form discrimination problems to criterion and then learned 24 problems of the opposite type (e.g., if color first then shift to form). The question was how well subjects would do when shifting to a new type of problem (i.e., how much their previous experience would help them). Macaca and Miopithecus did not differ in learning their original of the 24 problems, but Schrier (1972) showed that Macaca performed significantly better than Miopithecus when shifted to the new kind of problem. It might be argued that this difference mainly reflects Macaca's slightly (and non-significantly) better performance on the original learning and hence advantage in these particular kinds of discrimination. Nevertheless, Schrier's (1972) Table 2 shows that, although both Macaca and Miopithecus were nearly perfect discriminators on the final day of original learning, Macaca performed far better on the first day of shift learning. Thus, we ranked Macaca below Miopithecus. Because the ages of Miopithecus were not provided, this data only counts for greater than 1/5 AFR analysis.
Comparison of the predictive ability of 8 variations of a hierarchical Bayesian model.

procedure 17. Ohta (1983) and Ohta, Ishida, & Matano (1984, 1987) tested six Nycticebus, five Lemur, and five Galago with six trials per problem after 32 training problems with 50 trials per problem. Lemur achieved the highest mean trial two score across all problem blocks, indicating the existence of meaningful taxonomic variation (see also Ohta et al., 1987). Nycticebus achieved the second highest grand mean across all problem blocks, and hence is ranked below Galago. All subjects were greater than 1/2 AFR.
Reversal Learning
The reversal learning or intra-dimensional shift paradigm investigates the ability to reverse a previously learned discrimination. Most commonly, over the course of several trials, a subject learns to make one object discrimination in order to get a reward (e.g., picking one object rather than another). Then, without warning, the values of the objects change so that the previously unrewarded object is rewarded for a run of trials. As in the discrimination learning set paradigm, reversal learning is thought to reflect a subject's ability to form and use abstract rules or “hypotheses” (Gossette & Inman, 1966; Gossette & Slonim, 1969; Rumbaugh, 1970). Typical questions include “how quickly do subjects learn to reverse a previously acquired discrimination?” and “does better acquisition learning lead to faster or to slower reversal learning?” The expectation is that if subjects can employ abstract rules, better acquisition should lead to better reversal. On the other hand, if subjects are more limited to associative learning, then better acquisition should lead to poorer performance when reward values are reversed. The major advantage of the reversal learning paradigm is that taxonomic comparisons can be made after equating subjects for baseline acquisition learning. In other words, taxonomic differences are unlikely to simply reflect artifacts such as one species' predisposition for certain kinds of perceptual-motor functioning (Bitterman, 1965; Rumbaugh & Pate, 1984).
procedure 18. Meyer (1951) and Cotterman, Meyer, & Wickens (1956) tested nine Macaca and two Callithrix (both Callithrix participated in procedure 10) on a series of problems consisting of a six, eight, or 10 acquisition trials and eight reversal trials. Direct comparisons could be made for three problem blocks, and in all cases, on trial 2, Macaca performed better than Callithrix. Because no ages were provided for the Macaca subjects, this data cannot be included in the greater than 1/2 AFR analysis.
procedure 19. Crawford (1962) tested three Macaca, three Cebus, and three Ateles (the same Cebus and Ateles probably participated in procedure 11) in reversal learning with spatial cues. The apparatus allowed four possible object locations, left lower, left upper, right lower, and right upper. At the beginning of a problem, for example, the rewarded object would be in left lower, a non-rewarded object would be in left upper, and the two right positions would be empty. After three or eight consecutive correct trials, the reward values were reversed for the objects, and the objects also shifted to a new spatial orientation, e.g., right upper rewarded object, left upper non-rewarded object, and two lower positions empty. Thus, this was an object discrimination reversal problem with spatial cues indicating the onset of reversal. We ranked Ateles first because it had the highest mean score across problem blocks for all trials. Macaca performed better than Cebus on reversal trial 1, but Cebus did better overall; hence these taxa were considered tied. Because subjects were described as immatures, this study cannot be included in the greater than 1/2 AFR analysis.
procedure 20. Stevens (1965) tested 12 Macaca, 10 Cebus, and five Lemur (all subjects had participated in procedure 12 or procedure 13). Each day subjects were given trials on an object discrimination problem until they chose the correct object for 12 consecutive trials or had received 50 trials. After subjects had performed correctly for 12 consecutive trials on two consecutive days, on the following day, the values of the objects were reversed. Subjects were given the reversal problem until they had reached the same criterion used in the acquisition phase. On the two error score measures, Macaca performed better than Cebus, which in turn performed better than Lemur. On one of these measures, the “reversal perseveration score”, Stevens (1965) demonstrated the taxonomic variation was statistically significant. Hence, we ordered the taxa as Macaca, Cebus and Lemur. At least some of the subjects in each genus were apparently less than 1/2 AFR, so this data only counts for greater than 1/5 AFR analysis.
procedure 21. Gossette and colleagues (Gossette & Inman, 1966; Gossette & Slonim, 1969; Gossette, 1970) tested three Aotus, four Hylobates, three Saimiri, and four Cebus on a series of spatial reversal problems. Subjects experienced daily sessions of 20 discrimination trials where either the left or right object was consistently rewarded. Once a subject had reached the criterion of 18 or more correct choices in a session, the rewarded position was reversed and the subject had sessions of 20 trials under this new condition; once the criterion of 18 correct was reached the rewarded position was again reversed. Subjects had a total of 20 position reversals and Gossette (1970) provided data on the mean error scores for each genus for the first 20 trials after each reversal. Gossette (1970) showed that there was significant taxonomic variation across the 20 position reversals, and the overall rankings for grand mean error scores were Cebus, Hylobates, Aotus, and Saimiri. Ages were not provided for Cebus and Saimiri, but all Aotus and Hylobates were adults, and hence their rankings apply to the greater than 1/2 AFR analysis.
procedure 22. Rumbaugh & Arnold (1971) tested four Cercopithecus, one Eulemur, and two Lemur in a reversal task where subjects had to choose between a green circle and a white circle. For 51 trials one color was rewarded and then, for the next 51 trials, the other color was rewarded; a total of 200 reversals were presented to each subject. The authors pooled results for Eulemur and Lemur as “Lemur” and this group did significantly worse than Cercopithecus by several criteria. Most strikingly, in cases where “Lemur” subjects had achieved a high acquisition score on the last 20 pre-reversal trials, they did very poorly when they had to reverse the discrimination. In contrast, Cercopithecus showed the opposite pattern, performing better on reversal after performing well in acquisition. Although data on Lemur and Eulemur are not presented separately, Rumbaugh & Arnold (1971) indicated that there was little difference between them. Hence, we considered Cercopithecus to rank below Lemur and Eulemur and consider the latter two genera tied. Subjects were “late juveniles or young adults,” and thus this data is included in the greater than 1/2 AFR analysis.
procedure 23. Rumbaugh (1997; see Rumbaugh, 1970; Rumbaugh & Pate, 1984; Rumbaugh, Savage-Rumbaugh, & Washburn, 1996; Cooper, 1980; De Lillo & Visalberghi, 1994) compiled data for 11 genera on series of reversal problems that collectively yield a “transfer-of-learning” score. The subject first receives visual discrimination problems where, for each problem, reversal occurs after the subject has achieved 67% performance on the acquisition trials; the subject then receives 11 reversal trials. Over a series of problems, the ratio of percentage correct in the reversal trials (omitting the first trial) to percentage correct in the acquisition trials (approximately 67%) yields a transfer index at 67% (TI-67). This technique is then repeated with an 84% criterion for acquisition trials, and a TI-84 is produced. Finally, the TI-67 value is subtracted from the TI-84 and the remainder is the “transfer-of-learning” score. A negative score indicates a subject is better able to reverse a learned response if the original learning was weak, whereas a positive score indicates a subject can better reverse a learned response if the original learning was strong. Thus, a positive “transfer-of-learning” score can be taken as evidence that the subject relies more on an abstract rule about the potential relationships between elements, rather than simply associating their outcomes. Although variances are not available of “transfer-of-learning” scores, the ranges for various genera on the TI-67 and TI-84 are provided in Rumbaugh & Pate (1984), and indicate that some taxa do not overlap others at all. Hence, it can be assumed that there is substantial variation. We ranked genera according to the mean scores presented in Rumbaugh (1997), except that we combined the scores for all Pan (including language-trained subjects) and excluded Saimiri because the five subjects tested were the best performers in a colony of 40 (Rumbaugh & Pate, 1984; Rumbaugh, pers. comm.). The rankings were Pan/Gorilla (tied), Pongo, Macaca, Cercopithecus, Cebus/Hylobates (tied), Lemur, Phaner, Microcebus, Miopithecus. Because some subjects in Rumbaugh's compilation were juveniles (Rumbaugh, pers. comm.), this data only counts towards the greater than 1/5 AFR analyses.
Oddity Learning
The oddity learning paradigm addresses the ability to use a relational or abstract concept. Most commonly, a subject is simultaneously provided with three visual stimuli, two of which are identical, and one that differs; the subject is rewarded for choosing the differing or odd stimulus. One difficulty is that with several of the procedures that have been employed, subjects could succeed in the task without using a true oddity concept. For instance, for various reasons, investigators frequently omitted stimulus configurations where the middle object was odd; thus, subjects could have succeeded using the rule, “pick the end stimulus that differs from the middle stimulus” (King & Fobes, 1982). Although the fact that some procedures may not necessarily reveal the use of an oddity concept is of interest (e.g., Thomas & Noble, 1988), this issue is not crucial for the present comparisons, provided the subject must use some other type of conceptual strategy or, at the very least, must employ learning sets. In the procedure previously mentioned, for example, subjects would at least have to use some kind of same-different concept. Hence, we included nearly all procedures that allow taxonomic comparisons. The only exception is that we did not consider studies that use the same few stimulus configurations throughout the entire study (i.e., one-odd, two-odd procedures: Bromer, 1940; Vatsuro & Kashkay, 1965) because it is known that in such studies subjects may memorize the rewards associated with different configurations. Hence, the entire study may only require learning a handful of pattern discriminations (King & Fobes, 1982) and so may not provide a discriminating cognitive task.
procedure 24. Strong & Hedges (1966) tested three Pan and three Macaca on problems where the odd stimulus never appeared in the middle position. Nine wood objects were used in 72 different configurations to test a subject until they scored 90% within a session of 48 trials. Pan reached criterion in significantly fewer sessions than Macaca. Because subjects were not greater than 1/2 AFR, this study only applies to greater than 1/5 AFR analyses.
procedure 25. Davis, Leary, Stevens, & Thompson (1967) tested 24 Macaca, nine Cebus, eight Saimiri, four Lagothrix, two Cercopithecus, and four Lemur on problems where the odd stimulus never appeared in the middle position. (Most subjects probably also participated in procedure 3.) Each problem included 12 shaping or training trials and 12 test trials, all based on four related stimulus configurations. After pooling the data from the three Macaca species, we used ANCOVA to confirm that across the 15 eight-problem blocks, there was significant variation across genera (F(15,70) = 80.62, p < 0.0001). We then calculated the grand mean score for each genus and obtained the following ranks: Lagothrix, Cebus, Macaca, Saimiri, Lemur, Cercopithecus. The data were not presented in a manner that allowed subjects that were more than 1/5 AFR to be distinguished from those that were more than 1/2 AFR; hence, this data only counts towards the greater than 1/5 AFR analyses.
procedure 26. Thomas & Boyd (1973) tested Saimiri and Cebus on three types of oddity problems. First, four subjects of each genus were given a series of five trial problems where each problem presented the same stimulus configuration for all trials. Second, four of these subjects (two per genus) were given a similar series of five trial problems, but on trials two to four, the configuration was altered so that the stimulus that had been odd became common. Finally, four of the subjects were given one-trial oddity problems. Although all subjects performed fairly well, Cebus performed better than Saimiri on all three types of problems and hence was ranked lower. All subjects were greater than 1/2 AFR.
Sorting
The sorting paradigm examines the ability to form abstract concepts and to use them to categorize stimuli accordingly. Numerous approaches have been used to investigate sorting in primates (reviewed in Tomasello & Call, 1997), but apparently only one study has employed formal training (i.e., providing rewards) to investigate multiple genera.
procedure 27. Garcha & Ettlinger (1979) tested five Pan, six Macaca, and three Cebus in a task wherein subjects were presented with three exemplars of three different kinds of objects (nine objects total) and three jars. To be rewarded, subjects had to place the similar objects in the same jar. Pan can be ranked first in this procedure, because four of five Pan subjects but none of the others performed above chance within the first 100 trials. In later stages of testing (trials 880–2418), two Cebus and one Macaca performed above chance. Thus, although Cebus performed slightly better than Macaca, this does not meet our criterion of a meaningful difference and so these taxa were considered tied. Because it is unclear whether any of the Cebus or Macaca subjects were greater than 1/2 AFR, this test only counts for greater than 1/5 AFR analyses.
Delayed Response
The delayed response paradigm investigates a subject's memory or ability to maintain a representation of an item when it is no longer available to immediate perception. In most studies, the subject observes a reward being hidden in one of two spatial locations, there is a delay, and then the subject is allowed to search one of the locations. The questions of interest are “for any given time interval, what percentage of first searches are correct?” and “what is the maximum delay at which a subject can still score above chance?” Since its introduction by Hunter (1913), many investigators have questioned the validity of the paradigm on the grounds that experimental procedures, contextual variables, and previous experience can dramatically alter a subject's maximum delay (e.g., Maier & Schneirla, 1935; Fobes & King, 1982; Macphail, 1982; Shettleworth, 1998). Nevertheless, if one restricts comparisons to subjects with similar experience, operating in the same conditions, fruitful taxonomic comparisons can be made (Tinklepaugh, 1928; Fletcher, 1965). Fletcher (1965) provides an excellent review of the delayed response paradigm and the variables known to affect performance.
procedure 28. Tinklepaugh (1932) tested two Macaca and two Pan subjects in tests of multiple delayed response. In one variation, subjects were led into a series of rooms and in each room they witnessed a reward being hidden in one of two similar containers; after a delay, they were allowed to revisit the rooms and search one of containers in each room. A second variation of the study was conducted entirely in one room; the subject witnessed a series of paired containers being baited (one of the two containers with reward); after a delay, they were allowed to search one of the containers in each paired set. In both variations, Pan generally showed such greater proficiency in pre-training that they were given more difficult tests. Despite the greater difficulty, however, they invariably performed better than Macaca. For instance, in the first version of the study, Pan obtained a mean score of 90% when tested with 10 rooms whereas Macaca scored 80% when being tested with only five rooms. A direct comparison could be made in the case where both genera witnessed eight pairs of containers being baited in the same room. Macaca achieved a mean score of 61% whereas Pan scored 87%. Hence, Pan was ranked below Macaca. All subjects were greater than 1/2 AFR.
procedure 29. Harlow et al. (1932) and Maslow & Harlow (1932) provided data on delayed response for one Pongo, one Pan, one Gorilla, one Hylobates, six Papio, five Mandrillus, nine Macaca, three Cercopithecus, one Cercocebus, five Cebus, one Lagothrix, and one Varecia. (Several of these subjects also participated in procedure 4.) Subjects were tested with delays of zero, five, 15, 30, 60, 120, and 180 seconds; once they had demonstrated proficiency on one delay, they began receiving problems with the next longest delay. Subjects typically received 60 to 200 problems with each delay, but if they demonstrated exceptional performance, they were sometimes advanced to the next delay after fewer problems. We first computed mean scores for each genus at each interval, although we omitted two scores that were based on only one or two trials. Calculating mean scores for genera with multiple subjects was complicated by the fact that subjects that performed poorly on one interval were usually not tested on longer intervals. This could have biased scoring towards better-represented genera, as their scores on longer intervals would be based on their best subjects. We avoided this problem by assuming that if a subject had performed below chance on one interval (as determined with chi-square tests; Deaner unpublished), they could be assigned a score of 50% (chance) on longer intervals. We were thus able to calculate a meaningful mean score for each genus at each interval. In using these scores for rankings, we looked for evidence that a taxon performed consistently better or worse than others across all intervals or at least across relatively long intervals. Because Pongo was the best performer at each interval and Papio was consistently second best, we ranked these genera first and second, respectively. The remaining genera were more difficult to rank, because they sometimes reversed ranks according to the time delay. Hence, we considered the longest interval at which the generic mean was above chance. This was 120 seconds for Pan, Macaca, Mandrillus, Hylobates, and Cercopithecus, 30 seconds for Gorilla and Cercocebus, and 15 seconds for Lagothrix, Cebus, and Varecia. Pan, Gorilla, and two of the Mandrillus subjects were less than 1/2 AFR. Using the same logic as above, we reconsidered the data without these younger subjects and obtained the following rankings: Pongo, Papio, Mandrillus, Hylobates/ Macaca/ Cercopithecus (tied), Cercocebus/ Varecia/ Lagothrix/ Cebus (tied).
procedure 30. Miles (1957b) tested three Callithrix and three Macaca. After 100 pre-training trials with zero second delays, subjects were given 900–1200 problems where randomly occurring delays were one, two, four, or 16 seconds. Macaca performed consistently better than Callithrix at all comparable delays. Fischer & Kitchener (1965) conducted a very similar study with two Pongo and two Gorilla (subjects participated in procedure 4) although in this case, delays of 32 and 64 seconds were also interspersed with the shorter delays. (This modification could depress performance on shorter delays: see Fletcher, 1965.) When comparisons are restricted to comparable delays where subject have comparable experience (see Fischer & Kitchener's figure 3), Pongo performed consistently better than all other taxa and Callithrix consistently performed the worst. The grand mean for Gorilla was higher than for Macaca, suggesting that Gorilla should be ranked lower, but, because Macaca actually performed slightly better on the longest comparable delay (arguably the most crucial measure), we considered Gorilla and Macaca tied. Because none of the subjects in these studies were greater than 1/2 AFR, this test only counts for greater than 1/5 AFR analysis.
Statistical methods
Factor analysis has proven useful in characterizing the abilities underlying human performance in IQ and related testing batteries (reviewed by Child, 1970; Mackintosh, 1998). Although the structure of the present data set is somewhat similar, we did not use factor analysis because there were numerous missing values in the data matrix, and because we wished to avoid the assumption of a linear effect underlying trait variables between paradigms (Bartholomew, 1987).
Instead, we employed a Bayesian latent variable model of multi-study rank data, which was designed to assess whether there is a global variable that explains taxonomic variation in rankings across paradigms and procedures (Johnson et al., 2002; for a potential non-Bayesian approach to analyzing this data, see Yu, Lam, & Lo, 2005). The model is based on the assumption of a latent ability Zij satisfying
Zij = θ i + η i,g(j) + ɛ ij ,
where Zij denotes a latent variable representing the perceived performance of the ith genus in the jth procedure. The variable Zij is related to the observed ranking of the procedure by making the assumption that Yij, the rank of the ith genus in the jth procedure, is greater than Ykj, the rank of the kth genus in the jth procedure, only when Zij > Zkj. The variable θ i denotes the global variable of the ith genus and estimates its general cognitive ability. Paradigm-genus biases are denoted by η i,g(j) and represent bias of the jth procedure in the gth paradigm for showing the ability of the ith genus. Random errors associated with the observation of θ in the jth procedure are represented by ɛ ij .
The model assumes, therefore, that any given ranking derives from two underlying, continuous latent variables: a global variable for the cognitive ability of the genus and a paradigm-genus bias effect which represents variations in the observed rankings due to the genus-paradigm interaction. More simply, the global variable for each genus represents its overall score across all procedures and paradigms (i.e., corresponding to domain-general ability), whereas the paradigm-genus bias effect indicates the extent to which a genus performs better or worse on one paradigm compared to other paradigms (domain-specific abilities). Significant paradigm-genus bias effects indicate that the assumption of a uni-dimensional global variable is violated. Likewise, the greater the proportion of variation explained by the paradigm-genus bias effects, the smaller the proportion of variation potentially explained by the global variable. We have previously demonstrated that this model is capable of detecting paradigm-genus bias effects (Johnson et al., 2002).
In order to establish a scale of measurement for the global variables, these variables are assumed a priori to have a standard normal distribution. Similarly, the paradigm-genus bias effects are assumed to have a mean zero normal distribution, and both the procedure variance (i.e., error) parameters and the paradigm-genus variance parameters are assumed drawn from a common inverse-gamma distribution. Further details concerning this hierarchical specification are provided in Johnson et al. (2002).
Two additional points deserve mention here. First, the model considers tied rankings to be indicative of similarity in underlying parameters, θ i and η i,g(j) , rather than indicative of insensitive tests. This assumption is warranted because we only included procedures in the meta-analysis that yielded clear rank differences among at least some genera. Thus, these procedures can be considered sensitive enough to permit the conclusion that tied rankings reflected similar abilities, rather than poor tests. Second, the probabilities of the model parameters can be readily assessed using Markov chain Monte Carlo methods. This allowed us to determine the probability that genera differed from each other in their estimated global variables and to assess whether paradigm-genus bias effects were significantly different from zero.
To examine differences between taxonomic groupings above the genus (see above for taxonomic groupings), we also examined the probability that the mean of each taxonomic grouping's global variable differed from the global variable of each of the other taxonomic groupings. To compute these probabilities, we compared the sample means of the global variables for each taxonomic grouping using 1,000,000 simulated values of each genus's global variables obtained from the Markov chain Monte Carlo algorithm that was used to sample from the posterior distribution over these variables. In other words, we estimated the probability that the mean value of the global variable for the great apes (Pongo, Pan, and Gorilla) was less than the mean value of global variable for the lesser apes (Hylobates), and so on for all other comparisons among all groupings.
Results
General patterns
None of the posterior means of the paradigm-genus bias effects were found to be statistically significant, meaning there was no indication of domain-specific abilities. In fact, the posterior mean of the paradigm-genus bias precision parameters was approximately seven times larger than the posterior mean of the procedure-precision (error) parameters, suggesting that the paradigm genus-bias effects accounted for less than 1/7 of the variation attributable to the procedural variation (see Johnson et al., 2002). Only two of the paradigm-genus bias effects, both in the object discrimination learning sets paradigm, exceeded 0.5, but neither of these could be reliably distinguished as being either positive or negative (see Johnson et al. [2002] for details). The first paradigm-genus bias effect refers to Presbytis's performance in procedure 14; because Presbytis is not represented in any of the other procedures, its performance cannot meaningfully be attributed to a paradigm-genus bias effect. Second, in procedure 15, Macaca outperformed the three great apes, Gorilla, Pan, and Pongo, which was unexpected based on its performance in the rest of the data set. In this case, the paradigm-genus bias effect did not reach significance because Macaca's strong performance in other procedures within this paradigm was achieved primarily against taxa that it also outperformed in other paradigms. These examples illustrate the general pattern that, although there were some outlying procedures in this data set, they were not concentrated in particular paradigms. Hence, because paradigm-genus bias effects were unimportant, we fit a reduced model without these effects.
The global variables for the genera in the reduced model varied substantially, as they did in the full model (figure 1). In fact, pair-wise comparisons indicated that, in several cases, genera differed significantly (figure 2). Although Bayesian models, such as the one we employed, do not readily lend themselves to inferences regarding the amount of variation explained (but see Menard, 2000), a simple way to investigate the power of the hypothesized global variables is to ask how often they correctly predict rankings in the data set. It turns out that out of 229 genus-by-genus comparisons, 194 (84.7%) were predicted correctly with the reduced model. The complete model (i.e., incorporating estimates of paradigm-genus bias effects) also predicts 194 of the 229 comparisons (table 2). Hence, the hypothesis of differing domain-general cognitive abilities, estimated by a uni-dimensional global variable, is strongly supported.
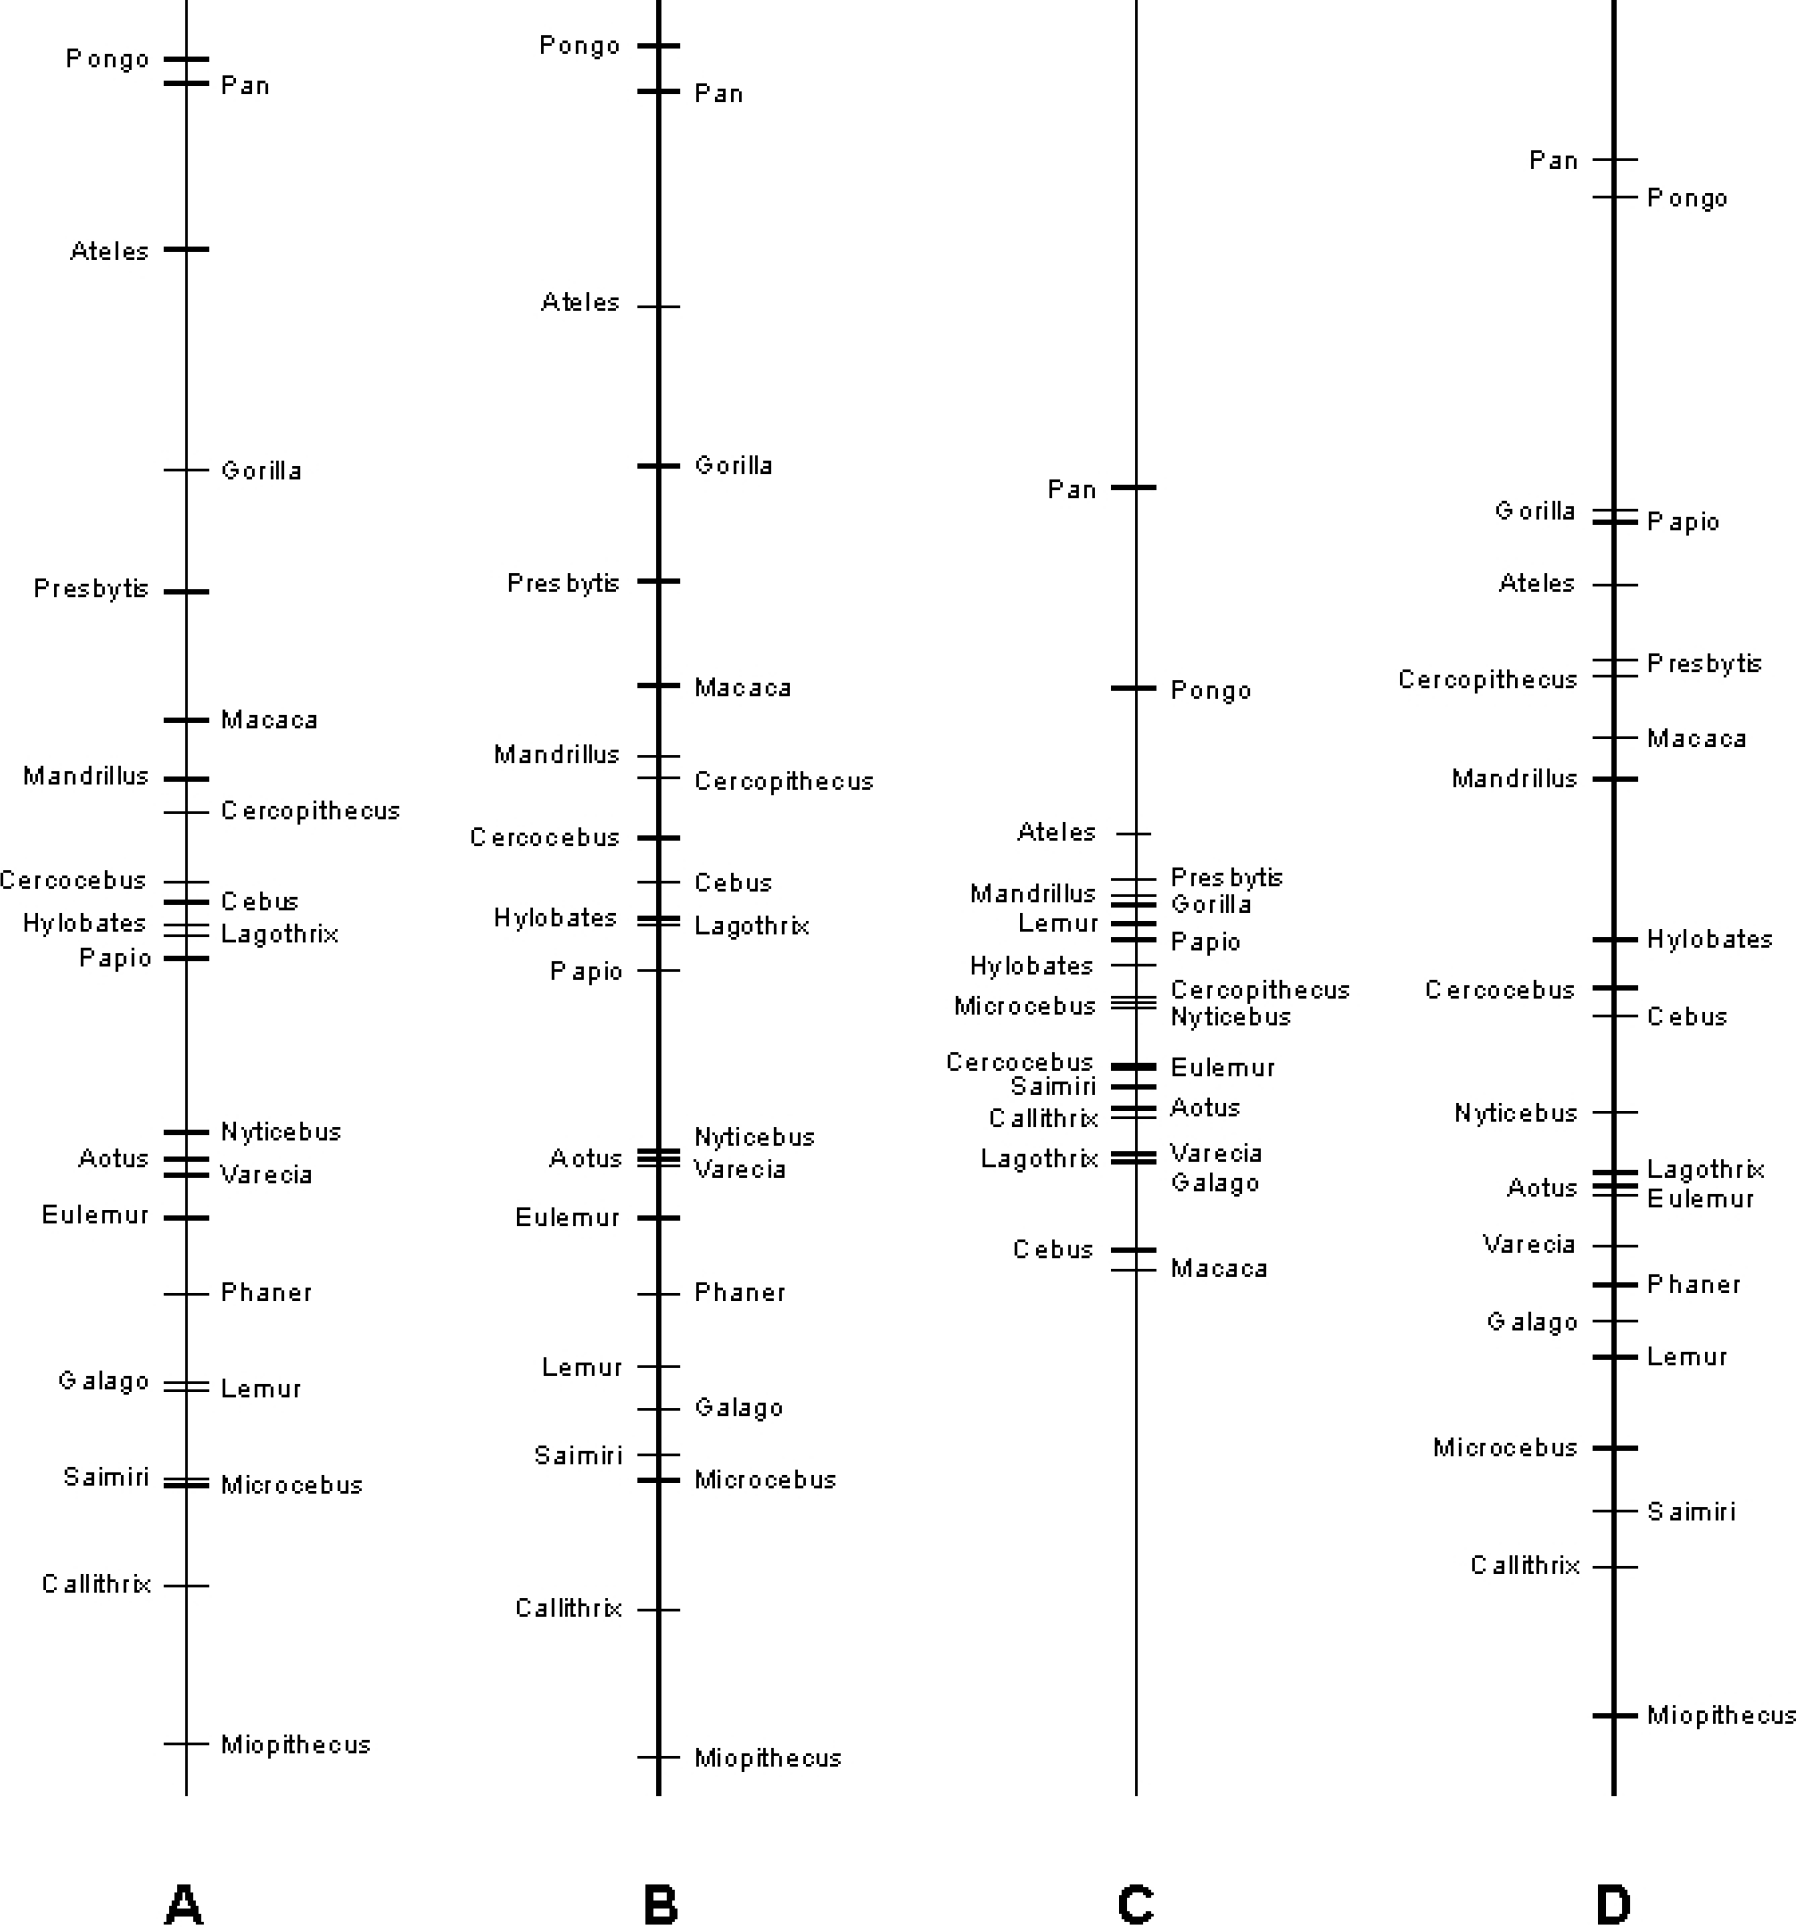
Global variable means for each genus as estimated with four variations of a hierarchical Bayesian model: (A) all data, with paradigm-genus bias effects; (B) all data, reduced model; (C) restricted to subjects >1/2 AFR, with paradigm-genus bias effects; (D) restricted so subjects only used once, with paradigm-genus bias effects; subjects ≥ 1/5 AFR.

Genus global variable means and matrix showing probability of genera differing from others. Based on reduced model with all data. For global variables, θ, lower scores indicate better performance. For the probability matrix, black boxes indicate genera differ at p < 0.025; dark-gray boxes indicate genera differ at p < 0.05; light-gray boxes indicate that genera differ at p < 0.10; unmarked boxes indicate that differences are not significant at p < 0.10.
Visual inspection of figures 1 and 2 suggests a pattern of taxonomic variation, with the great apes performing better than the other taxonomic groupings. When we explored this possibility more formally with simulations, we found that great apes did indeed have significantly lower global variable means than any other taxonomic grouping (table 3), indicating that they were generally the best performers. Among the other comparisons, the only other significant difference was that Old World monkeys had lower global variable means than did prosimians, although New World monkeys tended to outperform prosimians as well. Although these results imply, for example, that the “average Old World monkey” outperforms the “average prosimian”, our data set did not include information on all genera in these groupings and thus these results should be viewed cautiously.
Pair-wise comparisons of the mean global variables for taxonomic groupings. Entries denote the probability that the row grouping had a higher mean global variable (i.e. performed worse in the procedures) than the column grouping. Results are based on the full data set, reduced model.

Indeed, there is a trend in the Old World and New World monkeys for smaller-bodied (and usually smaller-brained) genera to perform poorly, and thus the overall poor performance of the prosimian group could be due to the fact that there was no information available on the relatively large-bodied genera, Daubentonia, Propithecus, and Indri. Likewise, it is worth emphasizing that some genera performed markedly better (Ateles) or worse (Callithrix, Miopithecus) than others in their taxonomic grouping. Another reason these taxonomic comparisons should be viewed cautiously is that the large number of comparisons (10) inflates the type 1 error rate. If the conventional a of 0.05 is adjusted to 0.005, the Old World monkeys and prosimians no longer differ significantly, although great apes remain distinct from every other taxonomic group.
Tests of robustness
One reason that paradigm-genus bias effects might not have been detected is that bias effects may span several paradigms and were masked because the paradigms were treated separately, rather than grouped according to underlying task demands. For instance, if a genus performed extremely well in five theoretically similar paradigms but performed rather poorly in the other four paradigms, it would be unlikely that the model would detect any paradigm-genus bias effects because effects in each paradigm would be assessed relative to the eight other paradigms, three or four of which would exhibit similar rankings.
The simplest way to explore the possibility of masking is to group paradigms into “superparadigms” based on a priori similarity. Tomasello & Call's (1997) review of primate cognition suggests the following superparadigms: (1) space and objects: detour problems, patterned-string problems, and invisible displacement; (2) features and categories: object discrimination learning sets, reversal learning, oddity learning, sorting, and delayed response; (3) discrimination learning: object discrimination learning sets, reversal learning, and oddity learning; and, finally, (4) learning sets: object discrimination learning sets and reversal learning. Hence, we repeated our analyses four times, testing for different superparadigm-genus bias effects in each case. In other words, in the first replication, all procedures in detour problems, patterned-string problems, and invisible displacement were grouped as the space and objects paradigm, and all other procedures remained assigned to their original paradigms. However, contrary to the idea of underlying superparadigms, we found no significant superparadigm-genus bias effects in any of these analyses. Furthermore, the explanatory power of these superparadigm models was nearly identical to that obtained with the reduced model (table 2) and the global variables of the genera were nearly identical.
Another reason that we might not have detected paradigm-genus bias effects is that our analysis included all subjects greater than 1/5 AFR, and it is conceivable that such a broad age range somehow obscured the effects. Hence, we repeated our analysis using the data restricted to subjects greater than 1/2 AFR. In this analysis, we again found that global trait values often differed significantly and no evidence for significant paradigm-genus effects. Although the explanatory power of this greater than 1/2 AFR model was slightly less than that of the reduced model based on all data, it was still quite high (table 2). More notable is the fact that the global variables of the genera are substantially more compressed than in the other analyses (figure 1).
This, however, is attributable to the fact that there was little data in this analysis and, under the Bayesian model used here, all genera begin with global measures of zero and only become differentiated as rankings are incorporated. Because of the limited data, the ordering of the global variables is also somewhat different than in other models (figure 1), although Pongo and Pan remain the best performers.
A third potential problem with our analysis is that several individuals are represented twice in the data set. Thus, what we have interpreted as consistent taxonomic differences might instead reflect consistent differences among individuals that happen to belong to different genera. Of course, these interpretations are not mutually exclusive (i.e., consistent individual differences are likely to be at least partially due to taxonomic effects). The crucial question is whether taxonomic differences remain once the data set is restricted such that each subject may contribute to it only once. Hence, we repeated the initial analysis after omitting procedures and thus any potential “double counting”. In deciding which procedures to omit when two employed the same subjects, we retained the one that included more genera; in cases where both procedures included the same number of genera, we retained the one that came first in chronological order. Thus, we omitted procedures 2, 4, 8, 11, 20, and 25. The model that was refit without these procedures again had no significant paradigm-genus bias effects, several significantly differing global variables, and explanatory power and global variable orderings that were extremely similar to those of the reduced model based on all data (table 2, figure 1). Thus, the taxonomic differences in our analysis are not merely the product of a few exceptional subjects.
Discussion
This study's primary finding is that some primate taxa performed consistently better than others across a wide range of cognitive paradigms. In contrast, there was no evidence that some taxa performed especially well in particular paradigms. Furthermore, these results proved robust when paradigms were grouped into various superparadigms and when the potential effect of pseudo-replication of individuals was eliminated. The possibly confounding effect of age was examined by excluding small juveniles (between 1/5 and 1/2 AFR), and this result differed most clearly from the others (figure 1). Importantly, however, paradigm-genus bias effects remained small and insignificant, suggesting that the poor differentiation among the genera was due to the small size of the remaining sample, rather than to the presence of specialized abilities.
Taken together, these results imply the existence of taxonomic differences in some sort of domain-general cognitive ability. It is important to stress, however, that differences in a domain-general ability are fully compatible with the existence of other differing abilities, including domain-specific ones. In fact, it is probable that as more data accumulate, including on additional paradigms, future studies will detect paradigm-genus bias effects and other higher dimensional factors. Nonetheless, because the factor identified here already predicts approximately 85% of the rankings, it is likely to re-emerge as the primary factor in future studies, at least in primates.
Objections
Comparative learning reviews commonly argue that claims of taxonomic differences are weak because within species variation often exceeds between species variation so that individuals of “low-achieving” taxa sometimes outperform those of “high-achieving” taxa (e.g., Ehrlich et al., 1976; MacPhail, 1982; Essock-Vitale & Seyfarth, 1987; Tomasello & Call, 1997). Nonetheless, the apparent absence of the predicted taxonomic variation could have several causes besides the absence of underlying cognitive differences. First, upon close inspection of the evidence, it is clear that some claims of taxonomic overlap are misleading. For example, Tomasello and Call (1997, p.103) cite evidence from Cooper (1974) that black lemurs (Eulemur macaco) perform better than or equal to most monkeys and apes in object discrimination learning sets. However, the lemurs generally had between five and fifteen times more trials per problem than did subjects in other studies, a difference that should have dramatically improved their performance (Levine, Levinson, & Harlow, 1959). Second, because tests directly measure performance, not intrinsic abilities, contextual confounds can obscure true differences. In procedure 15, where several apes performed poorly, the relevant objects were encased in plexi-glass bins, a situation which was later shown to be highly distracting for some species (Rumbaugh & McCormack, 1967; see also Ternes, Abordo, & Rumbaugh, 1965). The final, and most important, reason that taxonomic overlap does not weaken our claim of taxonomic differences is that evolutionary theory fully expects that developmental and genetic differences will produce substantial phenotypic variation. Although this variation is worth emphasizing, it is fully compatible with the significant overall taxonomic differences we demonstrated.
The second issue alluded to in the previous paragraph—the maxim that differences in performance do not automatically indicate differences in ability—deserves further attention. As noted in the Introduction, the meta-analysis approach should generally resolve the performance-ability conundrum because, if consistent differences are found across varying situations, it is unlikely that the difference merely reflects an unconsidered variable that biases testing towards particular taxa (Kamil, 1988). Nevertheless, it is conceivable that, although the paradigms in the data set involve a variety of testing contexts and materials, they might share some underlying bias that allows certain taxa (e.g., great apes) to do better than others. There are two likely candidates: manual skill and visual ability.
Manual skill of some kind is required for almost all of the testing procedures, and there is a strong relationship between overall global indices and manual skill (Deaner, unpublished; van Schaik et al., 1999). Nevertheless, in most of the procedures, differences in manual skill per se cannot explain performance differences (but see Beck, 1967). For instance, in object discrimination learning sets, reversal learning, oddity learning, and delayed response paradigms, animals must choose which food well to uncover. In preliminary trials, virtually all subjects master this task; pronounced differences emerge only after the manipulation of certain variables (e.g., length of delay) unrelated to reward recovery.
Visual ability is also required in all of the tests, and it could be argued, for instance, that prosimians performed poorly because of their relatively low acuity (Neuringer, Kosobud, & Cochrane, 1981; Langston, Casagrande, & Fox, 1986). This argument is sensible for prosimians in detour problems and patterned-string problems but does not accommodate results in other paradigms where baseline levels of performance must be demonstrated initially, such as object discrimination learning sets, reversal learning, oddity learning, and delayed response. Furthermore, differences in visual ability cannot readily explain the differing performances of great apes and monkeys. Most relevantly, Macaca, although performing worse than the great apes in most procedures, is thought to possess visual capabilities that are virtually identical to those of great apes and humans (Berkley, 1976; Jacobs, 1995).
Although visual processing requirements cannot account for most taxonomic differences, the ubiquity of visual requirements is potentially relevant to the interpretation of these differences. In particular, it could be argued that rather than implying differences in some kind of “domain-general” cognition, this study's results only indicate differences in general cognition in the visual domain. At present, there simply is no relevant data to test this interpretation (e.g., whether prosimians perform better than anthropoids in learning set problems if olfactory rather than visual stimuli are employed). Nonetheless, even if it turns out that the differences we identified are restricted to the visual problems, these differences would still be very important, as vision is the dominant sensory modality for most primates (Martin, 1990; Allman, 1999).
Similarly, none of the paradigms in our data set involve social problems, and it is possible that the taxonomic differences we have detected will not hold in this potentially specialized context (see Humphrey, 1976; Cheney & Seyfarth, 1990; Tooby & Cosmides, 1992). Although there is little data available to address this question, recent experimental work suggests that the differences might hold. Chimpanzees, mangabeys, and ringtailed lemurs have all been tested in versions of Menzel's (1973) deception paradigm, and the sophistication of performance in this situation corresponds with the results of the present study (Menzel, 1973; Coussi-Korbel, 1994; Deaner, 2000; Hirata & Matsuzawa, 2001; Güzeldere, Nahmias, & Deaner, 2002). Similarly, chimpanzees have been shown to take the visual perspective of conspecifics in a competitive foraging paradigm, whereas capuchin monkeys failed to show this ability (Hare, Call, Agnetta, & Tomasello, 2000; Hare, Adessi, Call, Tomasello, & Visalberghi, 2003; for a similar conclusion based on a different task, see Povinelli, Nelson, & Boysen, 1992; Povinelli, Parks, & Novak, 1992).
Implications
The fact that some genera perform better than others across a range of paradigms challenges current thinking that taxonomic difference in cognitive abilities are manifest only in specific contexts (e.g., Tooby & Cosmides, 1992; Shettleworth, 1998; Gallistel, 2000). Nevertheless, our results actually provide little insight into the nature of the underlying cognitive ability (or abilities) that produce these performance differences. Indeed, the contentious field of human intelligence testing demonstrates all too clearly that the meaning of a primary statistical factor, g, is open to numerous interpretations (reviewed by Mackintosh, 1998; Brody, 2000).
The number of potential explanations is perhaps even greater for the comparative primate data because cross-species studies raise unique issues. For instance, rather than accepting that the results found here reflect taxonomic differences in a single mechanism (or group of inter-related mechanisms), one might argue that taxa perform well across paradigms because they do in fact have distinct, restricted abilities, but happen to possess these for most or all of the paradigms in the data set. The extreme form of this argument—that each paradigm involves a distinct ability—seems unlikely, but it is quite plausible that there might be a few abilities, each of which supports excellent performance in a few related paradigms. In this view, the reason that we did not detect superior performance in particular paradigms or superparadigms is that the same taxa that possess a cognitive ability that allows them to excel in one paradigm also tend to possess another cognitive ability that allows them to excel in other paradigms; hence performance is uniformly excellent. Although this scenario requires that distinct cognitive abilities have generally undergone correlated evolution, there are theoretical reasons to think that this could be true (Deaner, Nunn, & van Schaik, 2000; van Schaik & Deaner, 2003). To test this possibility, data could be gathered on within species variation across tasks; if the same individuals do well across all tasks, it would support the notion of a primary domain-general ability (see Crinella & Yu, 1995; Anderson, 2000). Alternatively, if individuals were shown to have particular domains of expertise, this would be more consistent with the notion of distinct abilities with distinct mechanistic bases.
Although our result fits with the intuitive, traditional idea that some taxa, especially great apes, are “more intelligent” than others, our results do not suggest that we should re-embrace the outdated notion of a scala naturae, wherein species can be viewed as evolving in a pre-ordained progression, ultimately leading to humans (Hodos & Campbell, 1969). Instead, they suggest that under some conditions, there can be selection for fairly generalized cognitive abilities (Balda, Kamil, & Bednekoff, 1996; Schusterman & Kastak, 1998; Reader & Laland, 2002; Emery & Clayton, 2004) or else a suite of independent but consistently co-evolving ones. Although this type of cognitive evolution may have occurred more frequently in some radiations than in others (i.e., those with slow life history: Deaner, Barton, & van Schaik, 2002; van Schaik & Deaner, 2003), there are no compelling theoretical reasons to assume that domain-general cognition is restricted to primates or even mammals (Balda et al., 1996; Emery & Clayton, 2004).
If taxa do indeed differ in domain-general cognitive abilities, then this could help explain the distribution of spontaneously occurring complex behavior. Thus, in primates, the great apes, the best performers across the cognitive paradigms, show relatively high rates of deception, highly complex manipulation, population-wide tool use in the wild, and robust mirror self-recognition (Byrne & Whiten, 1992; Tomasello & Call, 1997; van Schaik et al., 1999; de Veer & van den Bos, 1999; Inoue-Nakamura, 1997). By contrast, prosimians, which had the overall lowest scores, exhibit little manual dexterity and no tool use, deception, or mirror self-recognition (ibid). Future studies will be necessary to determine the robustness of these taxonomic differences and to test if the global variables also explain variation within great apes, monkeys, and prosimians.
Finally, the global variables generated in this paper should be useful for testing the assumptions of comparative neuroanatomical investigations. Such investigations generally take for granted that a relative measure of the size of the brain or of a brain structure corresponds with some overall level of information processing capacity or “intelligence” (Deaner et al., 2000; van Schaik & Deaner, 2003). Researchers can now test which, if any, neuroanatomical measures correspond to an objective standard, namely the global variables generated in this study.
Footnotes
Acknowledgements
We thank Dave Higdon for facilitating our collaboration, and Leslie Digby, Peter Holland, Rich Kay, Chris Kirk, James Lee, Steve Nowicki, Duane Rumbaugh, Kathleen Smith, and two anonymous reviewers for helpful discussion and comments on previous versions of this paper.