
Abstract
England has a language education crisis: fewer people are studying languages at school and university language programmes are closing. This study analyses data from the Universities and Colleges Admissions Service (UCAS), the UK admissions service for higher education. The study quantifies how entry tariff and socioeconomic background affect access to language degree programmes. The results show that (1) the number of students studying languages and number of languages offered correlate with entry tariff and (2) the probability of a university offering languages and probability of it offering a range of at least five languages correlate with entry tariff and the percentage of students from less privileged socioeconomic backgrounds. Thus a widening participation crisis is highlighted: while many young people are unable to access language degree programmes, a small proportion, with the highest tariffs, can choose from a range of at least five languages. To combat the crisis, a Widening Participation Languages Network has been launched, supporting universities offering languages at below-average entry tariffs.
Introduction
The language education crisis
Language education – the learning and teaching of (modern foreign) languages – is widely considered to have been in crisis in England for the last two decades. So say academics (Evans, 2007; Godsland, 2010; Lanvers et al., 2021), politicians (All-Party Parliamentary Group on Modern Languages, 2019; Dearing and King, 2007), and journalists (Asthana, 2006; Boffey, 2013; Dean, 2016; Ratcliffe, 2013b), as well as organisations including the British Academy (British Academy et al., 2019, 2020), the British Council (Collen, 2020; Tinsley and Doležal, 2018), the Higher Education Funding Council for England (Worton, 2009), the Higher Education Policy Institute (Bowler, 2020), the Languages National Steering Group (2002) and the Nuffield Foundation (Nuffield Foundation, 2000).
The crisis in language education affects schools and universities. For GCSEs, the national exam taken at age 16, the percentage of students in England taking a language fell from 76% in 2002 to 40% in 2011, growing only slightly to range between 47% and 49% between 2013 and 2017 (Tinsley and Doležal, 2018: 3). For A level, the national exam taken at age 18, the number of students in England taking a language fell from around 40,000 in 1996 to around 27,000 in 2005, remaining roughly at that level since (Collen, 2020: 5; Tinsley and Doležal, 2018: 4). For universities, the total number of undergraduate students enrolled on language degrees in the UK fell from over 160,000 in 2003 to 84,520 in 2014 (HESA, 2021a; Wyburd, 2018: 174), falling again to 75,145 in 2019 (HESA, 2021b). This has resulted in the closure of language programmes and departments in the UK: variably reported as a decrease from 105 universities offering languages in the year 2000 to 62 in 2013 (Boffey, 2013); 10 closures and nine universities who ‘downsized their undergraduate provision’ between 2007 and 2017 (British Academy, 2018: 14); and a ‘dramatic’ drop from 69 to either 62 or 64 universities between 2018 and 2019 (Polisca et al., 2019: 9).
The crisis in language education is a social justice issue: it does not affect everyone equally. Forty seven percent of young people in England took a language GCSE in 2017 (Tinsley and Doležal, 2018: 3). In selective schools this was higher at 76% (Tinsley and Doležal, 2018: 3). At the other extreme, more than a third of English state schools do not even teach languages in year 9 (13–14 year olds). These schools tend to have a high proportion of children eligible for free school meals – an indicator of high social deprivation – and to be located in urban areas in the North of England (Tinsley and Doležal, 2018: 5). In Middlesbrough, for example, only 29% of pupils took a language GCSE in 2017 (Tinsley and Doležal, 2018: 3). At university level, 28% of applicants for European languages in 2013 in the UK were from private schools compared with 10% of applicants overall, making languages ‘the most “elitist” subject’ (Lanvers et al., 2018: 780).
The UK has poor language skills compared to EU countries. Only 39% of people can have a conversation in an additional language, lower than all EU countries bar two (European Commission, 2012a: 15) and only 32% of 15–30 year olds can read and write in an additional language, compared with 71%–99% in EU countries (Bowler, 2020: 13; European Commission, 2018: 42). These figures include languages other than English spoken in the home; according to Dobson (2018) even fewer – only 9% – of 14–15 year olds learning French at school achieve B1 Independent User level on the Common European Framework of Reference compared to an average of 42% for 14–15 year olds learning English in the EU (Dobson, 2018: 82, summarising data from European Commission, 2012b).
These poor language skills cause economic and social harm. People in the UK benefit from being able to speak English, the global language of business. However, many people around the world speak not only English but another language as well (Graddol, 2006). UK businesses have tended to rely on EU labour for language skills (Holmes, 2018). Even so, the lack of linguistic and cultural knowledge in the UK is estimated to cost 3.5% of GDP in lost export trade (Foreman-Peck and Wang, 2014): English may be ‘vital for success,’ but speaking only English is ‘a huge disadvantage’ (Coussins and Harding-Esch, 2018: 2). As Van Parijs (2004: 130) explains, ‘Anglophones […] face competition on their home labour markets with everyone else in the world, while having no real access to those labour markets in which another language remains required.’ And the effects are not just economic: ‘Learning additional languages facilitates access to multiple cultures and worldviews […]. A national lack of linguistic awareness […] risks cultural apathy, insularity and even intolerance’ (Bowler, 2020: 18).
Various governments have contributed to the language education crisis. The Labour Government removed compulsory language study after the age of 14 in 2004 (Dobson, 2018: 76). Estelle Morris, Secretary of State for Education at the time, explained that she wanted to give schools more flexibility over the curriculum (Morris, 2006), a decision which may have been driven by a language teacher shortage (Koglbauer, 2018: 222). However, this resulted in the drop in GCSE entries from 76% in 2002 to 40% in 2011 (Tinsley and Doležal, 2018: 2). The Conservative-Liberal Democrat Coalition Government (2010–2015) closed the internationally renowned Centre for Information on Language Teaching and Research and transferred funding previously earmarked for languages to general school budgets (Dobson, 2018: 78). And the current Conservative Government, despite a stated ambition for 75% of young people to take a language GCSE by 2022 and 90% by 2025 (Department for Education, 2019), withdrew funding from Routes into Languages, which promoted the take up of languages in schools and universities (Routes into Languages, 2021). Instead, these governments have focussed on language teaching in primary schools (Hagger-Vaughan, 2016: 364), first through Labour’s National Languages Strategy in 2002, which promised to ‘deliver […] an entitlement to language learning so that every pupil […] is offered the opportunity to study at least one foreign language by the end of the decade’ (Languages National Steering Group, 2002: 15), and later through the Conservative Government’s inclusion of languages in the Primary School National Curriculum from 2014 (Ratcliffe, 2013a, 2013b).
Introducing languages into primary schools cannot, however, overcome the many barriers to language take up post-14, such as: a poor transition between primary and secondary school (Collen, 2020: 9); the fact that GCSE grades are lower in languages than in other subjects (Thomson, 2019); young people’s feelings of low motivation, low enjoyment and low self-efficacy (Lanvers, 2017a: 521–522); tight budgets requiring minimum class sizes to run (Tinsley and Doležal, 2018: 15); difficulty recruiting and retaining teachers (Tinsley and Doležal, 2018: 8); and few opportunities to study home languages formally (Lanvers, 2017b: 54). That good GCSE grades are harder to achieve in languages than in other subjects dissuades young people from studying languages (Collen, 2020: 15) and dissuades schools from offering them, due to their detrimental effect on schools’ league table positions (Lanvers, 2017b: 52). In addition, although the government target is for 90% of young people to take a language GCSE by 2025 (Department for Education, 2019), the UK has a ‘vicious cycle of language teacher supply’ (Koglbauer, 2018: 223): even if every single language graduate were to enter the teaching profession, compared to the current rate of just 6%, there would still be a teacher shortage (Koglbauer, 2018: 222).
Many young people do not feel that language study is useful or important (Tinsley and Doležal, 2018: 15; Lanvers, 2017a: 521), given English’s status as a global language (Lanvers, 2011: 71–72; Lanvers et al., 2021: 5). Employers may hold this view too – despite economic analyses showing that a lack of linguistic and cultural knowledge costs the UK 3.5% of GDP in lost export trade (Foreman-Peck and Wang, 2014), and that UK small and medium enterprises (SMEs) ‘embracing language capabilities are 30% more successful in exporting than those which do not’ (Tibrewal, 2021), employers do not always recognise a need for language skills. As a result, language graduates are not as sought after in the workplace as might be expected. Foreman-Peck and Wang (2014), analysing survey data from UK SMEs, show that that those claim not to experience any cultural or linguistic difficulties when using English to export overseas ‘don’t know what they don’t know’ (Foreman-Peck and Wang, 2014: II) – if these SMEs ‘incorrectly do not see profit opportunities from exploiting language skills, then they will not demand them, and […] wages for those with such skills […] will be lower’ (Foreman-Peck and Wang, 2014: 7). This resonates with the anecdotes of frustrated language graduates described in White (2012): one ‘left university feeling assured his skills would be in demand after hearing how valuable languages expertise is. […] But, a year on from graduation and numerous job applications later, he was still unable to move on from the job he had while studying at university’; another said ‘I studied Chinese […] I’m stuck doing a crap job while everyone tells me that China is the future and I could be earning loads’. The other side of this is that clerical and admin roles requiring language skills go unfilled (Coussins and Harding-Esch, 2018: 2); while this might appear contradictory, it is consistent with the claim by Foreman-Peck and Wang (2014: 7) that wages for language skills are low. It appears that the benefit of language skills is more apparent to economists than to young people or their employers.
Research questions
As outlined above, there are cultural, financial, political and structural barriers to language study in England. Crucially, these do not affect everyone equally: young people from less privileged socioeconomic backgrounds are less likely to study languages. So what does this mean for access to language degree programmes at English universities?
Lanvers (2017b) analysed 2012–13 HESA data on students enrolled to programmes coded under the principal subject of ‘languages.’ She looked at the percentage of students of lower socioeconomic background (SES) at the universities with the 11 biggest and 15 highest-ranked language departments in the UK and concluded that ‘the larger and more reputable their language department, the less likely the university is to have students from poorer SES backgrounds’ (Lanvers, 2017b: 64). This suggests a relation between entry tariff/student socioeconomic background and the number of students on language degrees. However, Lanvers (2017b) only looked at a small number of large and highly-ranked universities. More recently, a joint report by the University Council of Modern Languages and the British Academy (UCML and British Academy, 2021) analysed UCAS data for the years 2012–2018 and reported a 12% fall in the number of language programmes, a 17% fall in the number of applications to study languages, and a 13% fall in the number of number of students accepting their places to study languages. They compared different university types, reporting that ‘applications fell in each mission group category, but faster among University Alliance institutions, in pre-92 HEIs outside the Russell Group, and in other post-92 institutions except the Million Plus group’, while Russell Group universities ‘weathered the storm better’ (UCML and British Academy, 2021: 4). Russell Group universities are likely to have higher entry tariffs and students from more privileged socioeconomic backgrounds, but this is not analysed explicitly, nor is the reason for any difference between the Million Plus group and other university types. Investigating the relation between entry tariff/student socioeconomic background and the number of students studying languages forms the first research question of this study.
Lanvers et al. (2018: 780) inferred from the data presented in Lanvers (2017b) that ‘students whose A level results do not match the high entry tariffs of selecting universities have limited choices’ to study a language at university. This suggests a relation between entry tariff/student socioeconomic background and whether or not a university offers languages. However, their conclusion seems premature, since Lanvers (2017b) only analysed a small number of large and highly-ranked universities. More recently, Liddicoat (2020) analysed university websites regarding their language provision in 2017. He compared two groups of universities: 22 of the 24 ‘elite’ research-intensive universities in the Russell Group and 32 ‘less prestigious’ universities which appear to have been selected because they once belonged to a group called the Coalition of Mainstream Universities (CMU; Liddicoat, 2020: 117). He showed that all Russell Group universities, but only a third of the CMU universities, offered languages for credit. Again, the Russell Group universities are likely to have higher entry tariffs and students from more privileged socioeconomic backgrounds, but this is not analysed explicitly. Investigating the relation between entry tariff/student socioeconomic background and whether or not universities offer languages forms the second research question of this study.
Liddicoat (2020) also showed that a wider range of languages were offered at the Russell Group universities, with each university offering at least five languages. In contrast, only five of the 32 CMU universities that he looked at offered five or more languages. This raises two further questions. What is the relation between entry tariff/student socioeconomic background and the number of languages offered? And what is the relation between entry tariff/student socioeconomic background and whether or not a range of languages is offered? These form the third and fourth research questions of this study.
UCML and British Academy (2021) start their joint report by stating that whereas the ‘prevailing narrative in UK higher education is one of decline in modern languages’, their aim is to ‘nuance this narrative’. Building on this, the final research question of this study will identify those universities that are widening access to language degrees, bucking the trend of decline and department closures.
In summary, this article will investigate how access to language degree programmes at universities in England is affected by (a) entry tariff and (b) student socioeconomic background. Drawing on this analysis, universities that are widening access to language degrees will be identified.
Scope
Education policy is devolved in the UK. For languages, Scotland has committed to the European Union’s ‘1 + 2 model’ of teaching two languages in addition to English; Wales has a policy of ‘bilingualism +1’, with Welsh compulsory from 3–16; and Northern Ireland has compulsory languages 11–14 but not in primary schools (Lanvers et al., 2018: 779; Jones, 2016: 1). Analysing the impact of these different language education policies on university provision is an important question, but beyond the scope of this article. To make this explicit, this study investigates access to language degrees in English universities only.
The research described in the previous section has methodological implications for this study. Lanvers (2017b) analyses European languages and classics (Latin and Ancient Greek); UCML and British Academy (2021) analyse European and non-European ‘modern foreign’ languages but not ancient languages; Liddicoat (2020) includes British Sign Language and Welsh but not ancient languages. In order to gain a complete picture of language degree provision, this study takes the approach of including all languages other than English: signed and oral, ancient and modern.
UCML and British Academy (2021) report that acceptances on programmes with a single named language (e.g., French) or two named languages (e.g., French and Spanish) declined by 22% between 2012–2018, but acceptances to language programmes in combination with history, business and law remained steady, and acceptances to language programmes with politics, linguistics, TESOL and translation increased (UCML and British Academy, 2021: 4). Interestingly, their updated report analysing UCAS trends 2012–2021 shows that this trend is only observed in Russell Group universities; in other universities, acceptances have fallen irrespective of programme type (British Academy and UCML, 2022: 13). Nonetheless, it is important not to confuse changing patterns of programmes titles, such as the Russell Group trend of moving away from single language programme titles to ‘language and/with x’ programme titles, with an overall decline in language provision. This study will therefore define language programmes broadly: taught alone, with another language, or with another subject.
Method
A licence fee was paid to UCAS to allow the reporting of up to 100 data points for research. UCAS count ‘acceptances,’ that is, the number of students accepting their places at university. UCAS data was chosen over HESA data, which counts enrolments, because more recent UCAS data was available. Data from 2020 entry was used for this study. First year undergraduate acceptances were analysed, excluding foundation year entry and top-up programmes.
A list of 97 English universities was taken from the Guardian main league table 2022 (Guardian, 2022). R (R Core Team, 2021) was used to search the UCAS data for each university for language programmes, using these criteria: (1) a named language or (2) a programme name which indicates a language (e.g., Classics, Modern Language, Translation) or (3) a programme name which might include a language (e.g. including Ancient, Asia, Deaf, Hispanic) confirmed with a web check for compulsory language up to at least level 5 or (4) any other programme with a language-related UCAS code (e.g., ‘Y Comb[ination]s of social studies/bus/law with languages’) that has a compulsory language to at least level 5. Compulsory languages up to level 5 (second year undergraduate), rather than 6 (final year undergraduate), was used as the criteria in order not to exclude programmes that had languages as optional after the year abroad. Once all language programmes were identified, the number of students who accepted a place on a language programme at each of the universities in 2020 was identified.
Each university was then coded as ‘yes’ or ‘no’ according to whether or not they offer language degree programmes in 2022. Initial coding was done with reference to the 2020 acceptances data. This was updated to 2022 using the publicly available UCAS website (https://www.ucas.com/explore/unis), which has a search function for all courses related to languages, and each university website. Note that both Aston University and Hull University had acceptances in 2020 but were coded as ‘no’ as they no longer offer language degrees (Hull Live, 2019; UCU, 2021).
Next, the number of languages offered to degree level at each university in 2022 was identified. Initially this was done with reference to the 2020 acceptances data. This was updated to 2022 using the publicly-available UCAS website and university websites. All languages offered on their own (e.g., French) or with another non-language subject (e.g., German and Politics) were counted. Some languages are only offered in combination with others, such as Classics (Ancient Greek and Latin), Anglo-Saxon, Norse and Celtic, and language combinations such as Spanish and Portuguese. A decision was made to count the first two as ‘Classics’ and ‘Norse’ and to only count Portuguese where it was offered alone or with other non-language subjects. The number of languages offered at each university in 2022 was then used to code each university as ‘yes’ or ‘no’ for offering a range of languages. Following Liddicoat (2020), five or more languages was coded as ‘yes’; four or fewer was coded as ‘no’.
The average entry tariff for each university was taken from the Guardian main league table (Guardian, 2022). The entry tariffs are from 2019 entry, which is the most recent year available, and ranged from 96 points (Canterbury Christ Church University, University of East London) to 206 points (University of Cambridge). Note that these are the average tariffs of students joining the university, not the entry requirements as advertised.
The measure for student socioeconomic background used in this study was the percentage of students from POLAR quintiles 1 and 2, which is publicly available (Office for Students, 2021). POLAR classifies local areas into five quintiles based on the proportion of young people who enter higher education age 18–19, with quintile 1 showing the lowest rate of participation and quintile 1 the highest. For 2019 entry, the most recent year available, the percentage of students from POLAR quintiles 1 and 2 ranged from 7% (City, University of London) to 56% (Teesside University).
Lastly, as a measure of university size, the number of first year undergraduate students enrolling at each university in 2020 was taken from HESA (2022). Bigger universities might be expected to have more language students and to offer more languages. This was included in the analysis to ensure that any trends relating language provision and entry tariff/percentage of students from POLAR quintiles 1 and 2 were not confounded with university size.
Note that the most recent data available was used for each metric. Entry tariffs and the percentage of students from POLAR quintiles 1 and 2 are for 2019, the number of student acceptances and overall first year enrolment numbers are for 2020, and the remaining data (‘yes’ or ‘no’ for offering languages, number of languages available, ‘yes’ or ‘no’ for offering a range of at least five languages) are for 2022. This gives us the most up-to-date picture possible of the current state of the sector.
Results
Number of students
Figure 1 shows the number of students who accepted a place in 2020 to study a language degree at each university in England – for universities where this is greater than zero – plotted against the entry tariff (left) and the percentage of students from POLAR quintiles 1 and 2 (right). The latter is plotted with a reversed x-axis to illustrate the similarities between the plots, since, in general, lower tariff universities have a higher proportion of students from POLAR quintiles 1 and 2, and higher tariff universities have a lower proportion (r (95) = −0.5, p < .001). Number of language students versus entry tariff and POLAR quintile.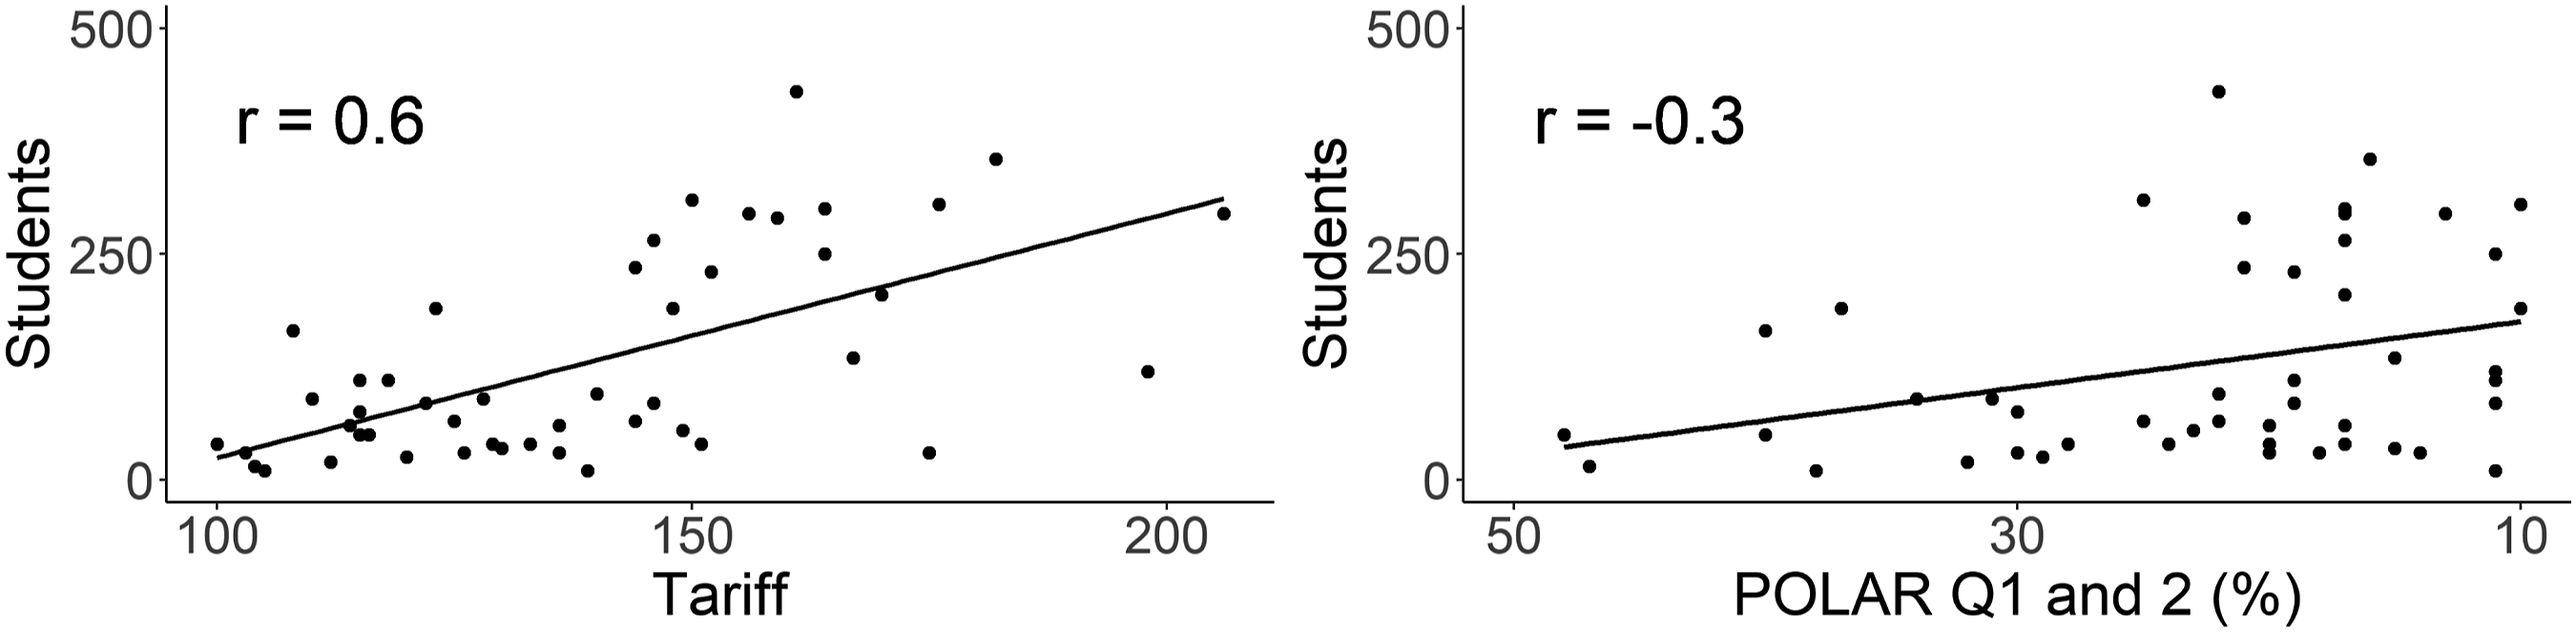
There is a strong positive correlation between student number and entry tariff (r (45) = 0.6, p < .001): universities with higher tariffs have more language students. There is a moderate negative correlation between student number and the percentage of students from POLAR quintiles 1 and 2 (r (45) = −0.3, p = .03): universities with more students from POLAR quintiles 1 and 2 have fewer language students.
Linear regression was used to model the relation between student number, university size, entry tariff and the percentage of students from POLAR quintiles 1 and 2. University size was included because larger universities might be expected to have more language students. Modelling was carried out in R (R Core Team, 2021) following Winter (2020). Including university size as a predictor significantly improved the model fit compared with an intercept-only model (F (1, 45) = 6, p = .02), explaining 11% of the variance. Including entry tariff as an additional predictor significantly improved the model fit (F (1, 44) = 34, p < .001) and the percentage of variance explained (50%). Including the percentage of students from POLAR quintiles 1 and 2 as an additional predictor did not further improve the model fit (F (1, 43) = 0.2, p = .64) nor the percentage of variance explained (50%).
The best model was therefore ‘student number ∼ university size + entry tariff’. For each increase of 8 tariff points – the difference between a B and an A in one A level – there were 22 more students. At an average-sized university with an entry tariff of 100 you would expect 24 language students, compared to 313 students at an average-sized university with an entry tariff of 206. Bigger universities, who have more first year undergraduate students overall, accepted more language students. However, entry tariff was a better predictor of the number of language students than university size: a model with only entry tariff as a predictor explained more variance (38%) than a model with only university size as a predictor (11%).
Languages: ‘yes’ or ‘no’
Figure 2 shows the universities that do (‘yes’) and do not (‘no’) offer language degree programmes in England in 2022, plotted against the entry tariff (left) and the percentage of students from POLAR quintiles 1 and 2 (right). Whether universities offer languages versus entry tariff and POLAR quintile.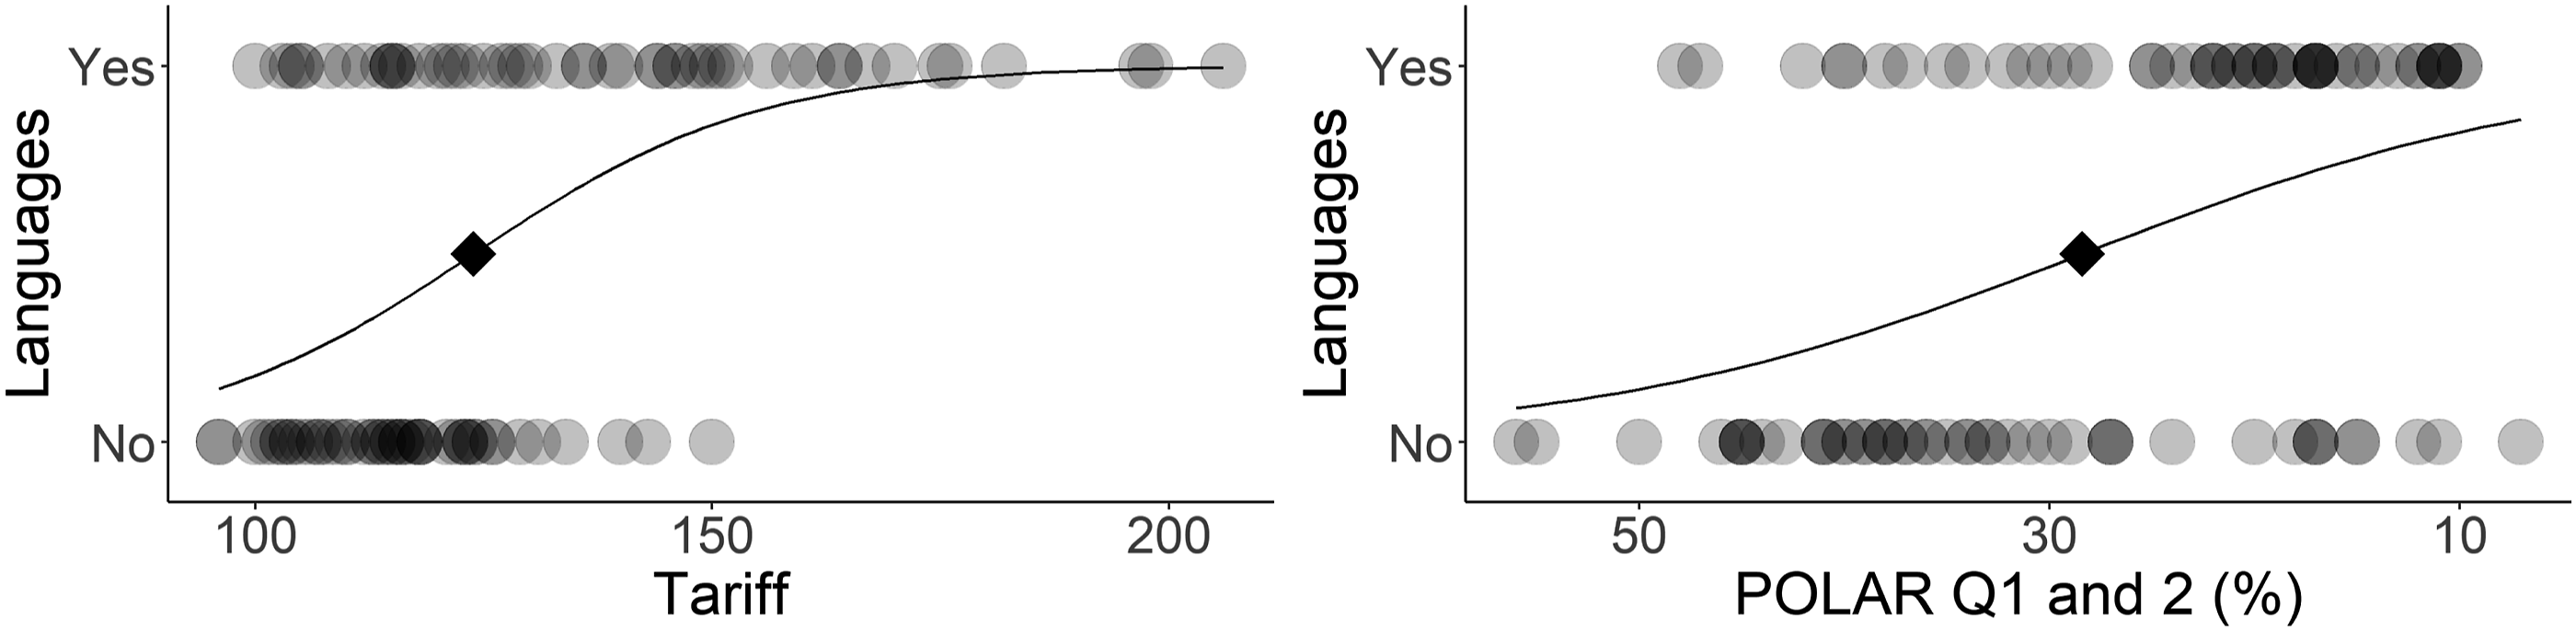
Logistic regression showed that most universities above 124 tariff points offer language degrees; most below 124 tariff points do not (z = 4, p < .001). Most universities with less than 28% of students from POLAR quintiles 1 and 2 offer language degrees; most with more than 28% do not (z = −4, p < .001). The crossover points above which most universities offer languages are marked with diamonds in Figure 2.
Logistic regression was used to model the relation between the probability of a university offering languages, university size, entry tariff and the percentage of students from POLAR quintiles 1 and 2. University size was included because larger universities might be expected to be more likely to offer languages. Including university size as a predictor significantly improved the model fit compared with an intercept-only model, reducing the deviance by 10 (p < .002). Including entry tariff as an additional predictor further improved the model fit, reducing the deviance by 26 (p < .001). Including the percentage of students from POLAR quintiles 1 and 2 as an additional predictor further improved the model fit, reducing the deviance by 7 (p = .01).
The best model was therefore ‘probability of a university offering languages ∼ university size + entry tariff − percentage of students from POLAR quintiles 1 and 2’. Raising the entry tariff by 8 points – the difference between a B and an A in one A level – increases the probability that a university will offer languages from 56% to 66%. Increasing the percentage of students from POLAR quintiles 1 and 2 by 10 percentage points decreases the probability of a university offering languages from 56% to 41%. Bigger universities, who have more first year undergraduate students overall, are more likely to offer languages. However, entry tariff and the percentage of students from POLAR quintiles 1 and 2 are better predictors than university size of the probability of a university offering languages: a model with only entry tariff as a predictor reduces the deviance by 29, a model with only the percentage of students from POLAR quintiles 1 and 2 reduces the deviance by 20, and a model with only university size reduces the deviance by 10.
Number of languages
Figure 3 shows the number of languages offered to degree level in 2022 at each university in England – for universities where this is greater than zero – plotted against the entry tariff (left) and the percentage of students from POLAR quintiles 1 and 2 (right). Number of languages versus entry tariff and POLAR quintile.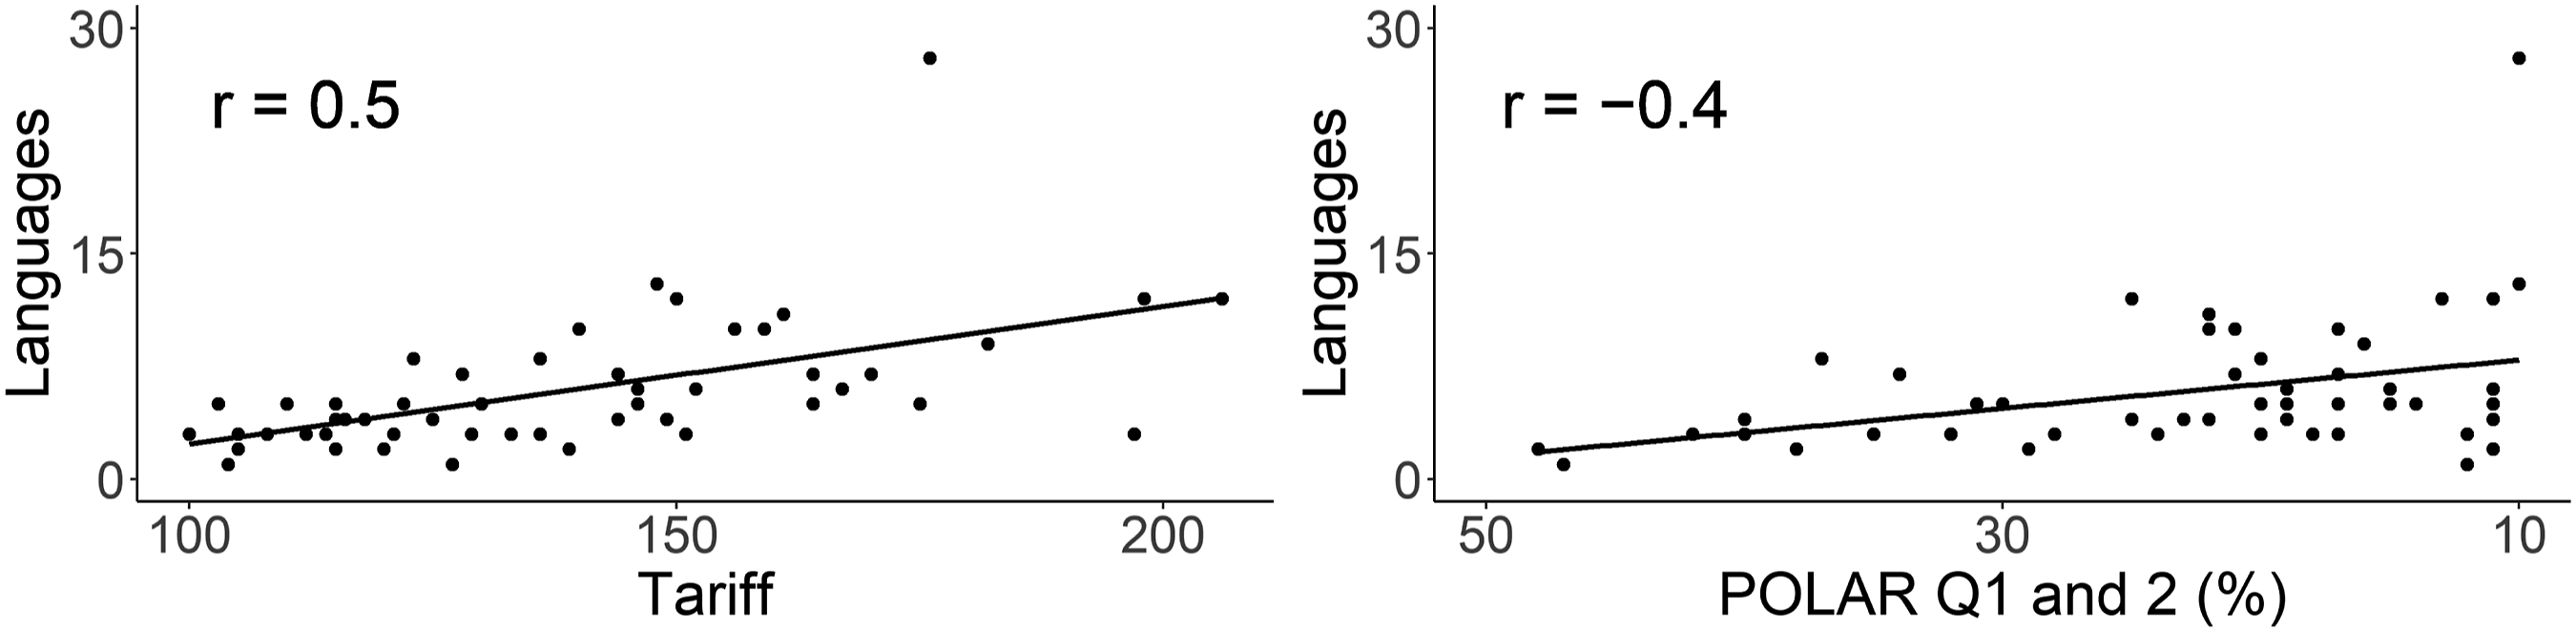
There is a strong positive correlation between language number and entry tariff (r (48) = 0.5, p < .001): universities with higher tariffs offer more languages. There is a moderate negative correlation between language number and the percentage of students from POLAR quintiles 1 and 2 (r (48) = −0.4, p = .01): universities with more students from POLAR quintiles 1 and 2 have fewer language students.
Linear regression was used to model the relation between language number, university size, entry tariff and the percentage of students from POLAR quintiles 1 and 2. University size was included because larger universities might be expected to offer more languages. However, including size as a predictor did not significantly improve the model fit compared with an intercept-only model (F (1, 48) = 2, p = .21). Including entry tariff as a predictor significantly improved the model fit compared with an intercept-only model (F (1, 48) = 20, p < .001), explaining 30% of the variance. Including the percentage of students from POLAR quintiles 1 and 2 as an additional predictor did not further improve the model fit (F (1, 47) = 0.5, p = .49) or the percentage of variance explained (31%).
The best model was therefore ‘language number ∼ entry tariff’. One additional language is offered, on average, for each increase of 11 tariff points. A university with an entry tariff of 100 is likely to offer two languages compared with 12 languages at a university with an entry tariff of 206.
Range of languages: ‘yes’ or ‘no’
Figure 4 shows the universities that do (‘yes’) and do not (‘no’) offer a range of at least five languages to degree level in England in 2022, plotted against the entry tariff (left) and the percentage of students from POLAR quintiles 1 and 2 (right). Whether universities offer a range of languages versus entry tariff and POLAR quintile.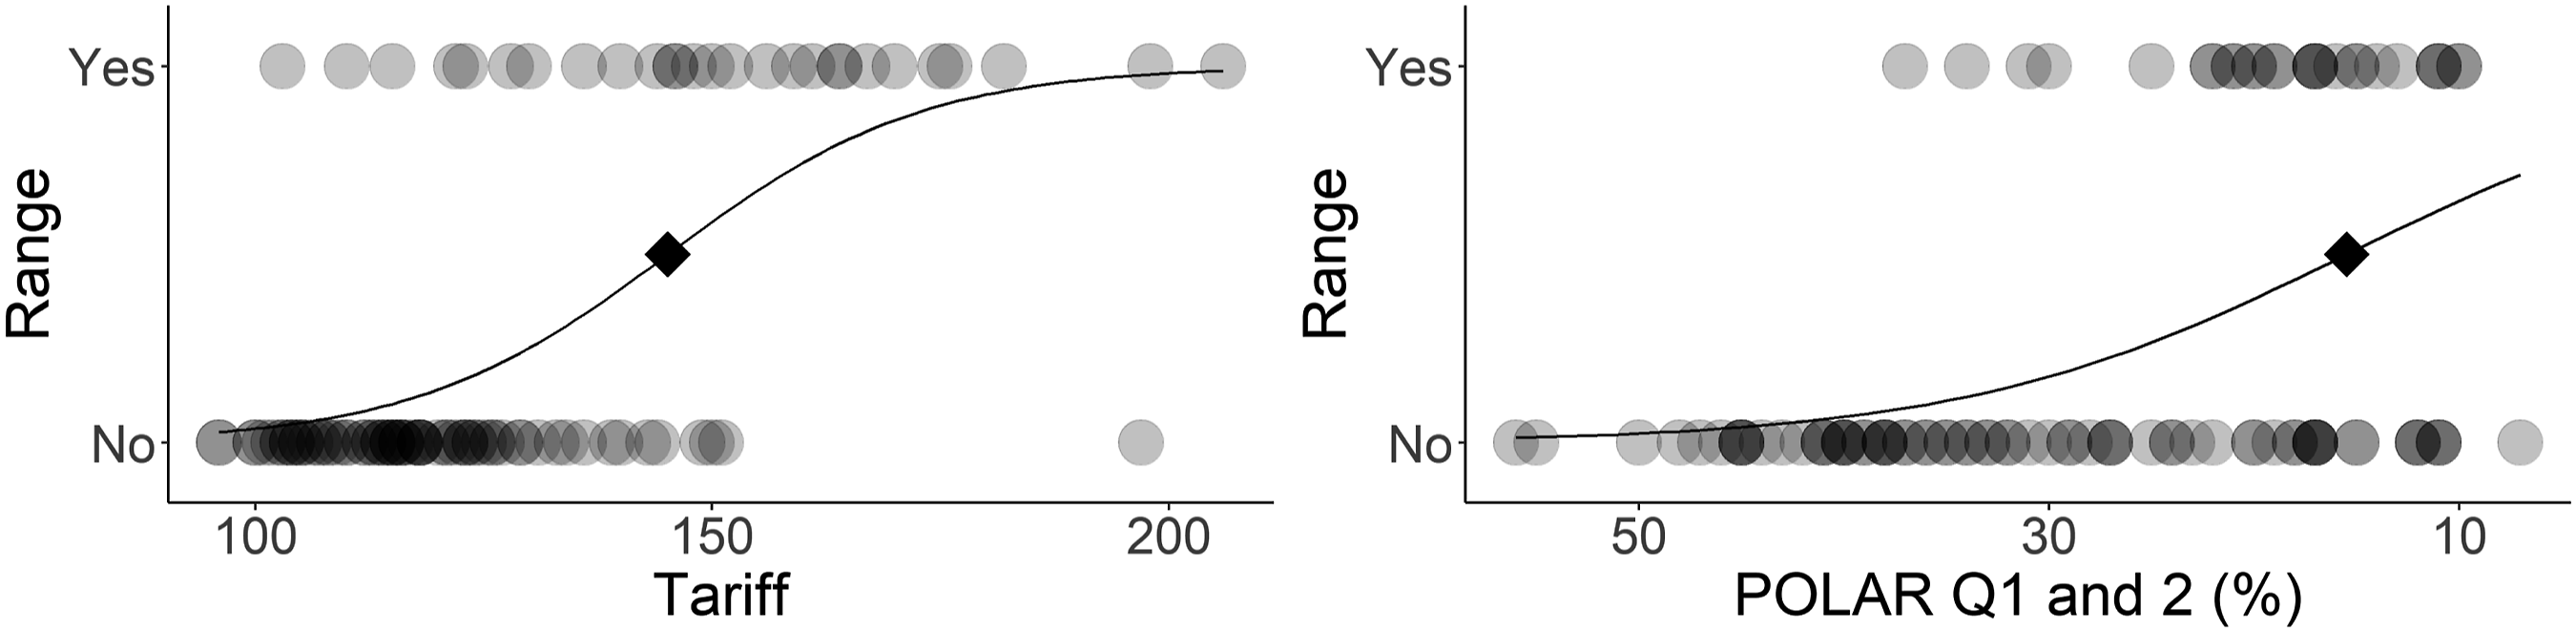
Logistic regression showed that most universities above 145 tariff points offer a range of at least five languages to degree level; most below 145 tariff points do not (z = 5, p < .001). Most universities with less than 15% of students from POLAR quintiles 1 and 2 offer a range of languages to degree level; most with more than 15% do not (z = −4, p < .001). The crossover points above which most universities offer a range of at least five languages are marked with diamonds in Figure 4.
Logistic regression was used to model the relation between the probability of a university offering a range of languages, university size, entry tariff and the percentage of students from POLAR quintiles 1 and 2. University size was included because larger universities might be expected to be more likely to offer a range of languages. Including university size as a predictor significantly improved the model fit compared with an intercept-only model, reducing the deviance by 8 (p = .004). Including entry tariff as an additional predictor further improved the model fit, reducing the deviance by 34 (p < .001). Including the percentage of students from POLAR quintiles 1 and 2 as an additional predictor further improved the model fit, reducing the deviance by 6 (p = .02).
The best model was therefore ‘probability of a university offering a range of languages ∼ university size + entry tariff − percentage of students from POLAR quintiles 1 and 2’. Raising the entry tariff by 16 points – the difference between a B and an A in two A levels – increases the probability that a university will offer a range of at least five languages from 16% to 30%. Increasing the percentage of students from POLAR quintiles 1 and 2 by 10 percentage points decreases the probability that a range of languages will be offered from 16% to 8%. Bigger universities, who have more first year undergraduate students overall, are more likely to offer a range of languages. However, entry tariff and the percentage of students from POLAR quintiles 1 and 2 are better predictors than university size of the probability of a university offering a range of languages: a model with only entry tariff as a predictor reduces the deviance by 37, a model with only the percentage of students from POLAR quintiles 1 and 2 reduces the deviance by 22, and a model with only university size reduces the deviance by 8.
Widening participation
Which universities are bucking these trends and widening access to language degrees? There is more than one way to answer this; three will be considered here.
Figure 5 shows those universities that accepted more students to study languages in 2020 than expected for their entry tariff (left) and those universities that offer more languages to degree level in 2022 than expected for their entry tariff (right). Universities that accept more students or offer more languages than expected are represented by lighter dots; those that accept fewer students or offer fewer languages are represented by darker dots. Those universities whose residuals are above the 80th percentile are named. UCL, which offers 28 languages, is not shown to scale in order to make the remaining universities easier to see. Universities widening access to language degrees.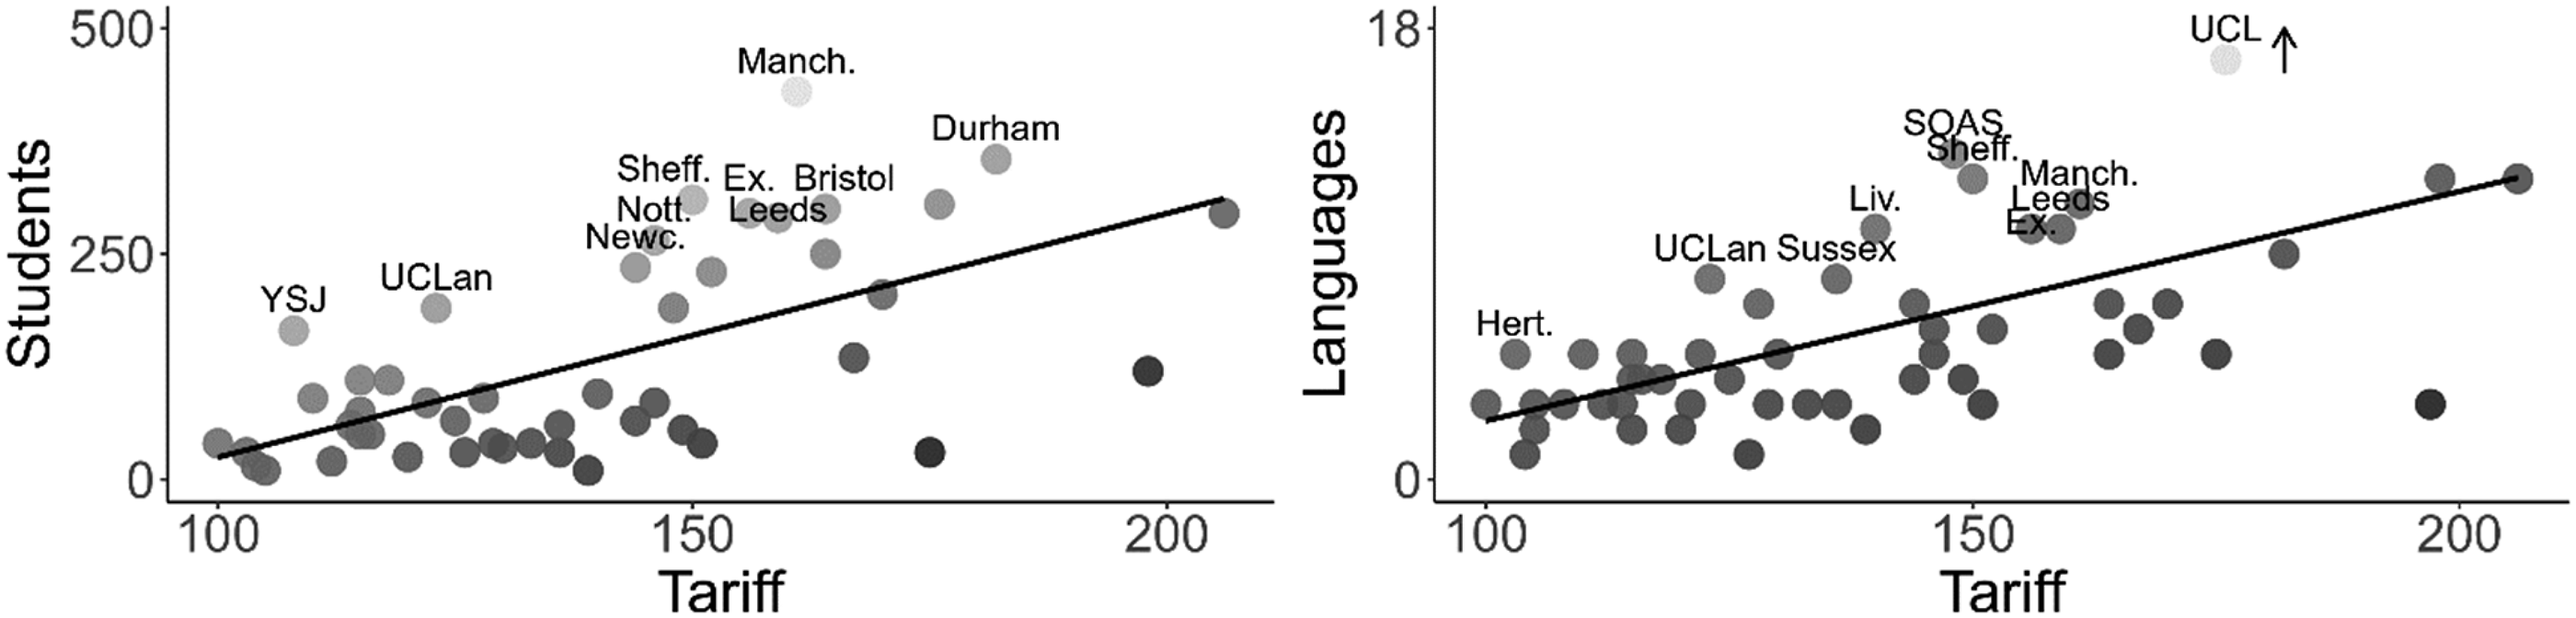
It can be seen from Figure 5 that the universities of Bristol, Durham, Exeter, Leeds, Manchester, Newcastle, Nottingham, Sheffield, UCLan and York St John stand out as accepting more language students in 2020 than expected for their entry tariff, and the universities of Exeter, Hertfordshire, Leeds, Liverpool, Manchester, Sheffield, SOAS, Sussex, UCL and UCLan stand out as offering more languages to degree level in 2022 than expected for their entry tariff. Notably, the universities of Exeter, Leeds, Manchester, Sheffield and UCLan are on both lists, accepting more language students in 2020 and offering more languages in 2022 than expected.
Another way to answer the question of which English universities are widening access to language degrees is to identify which universities offer languages with entry tariffs below 124 points and over 28% of students from POLAR quintiles 1 and 2, since the analysis showed that these were the crossover points beyond which most universities do not offer languages. The universities that do offer languages are Chester, Coventry, De Montfort, Essex, Huddersfield, Nottingham Trent, Portsmouth, Sheffield Hallam, UCLan, Wolverhampton and York St John. None of the remaining universities with entry tariffs below 124 points and over 28% of students from POLAR quintiles 1 and 2 (Anglia Ruskin, Bath Spa, Birmingham City, Bolton, Bradford, Brighton, Canterbury Christ Church, Chichester, Cumbria, Derby, Gloucestershire, Keele, Leeds Beckett, Leeds Trinity, Lincoln, Liverpool Hope, Newman, Northampton, Solent, Staffordshire, Suffolk, Sunderland, Teesside, UWE Bristol, Winchester, Worcester) offer languages.
Discussion
Comparison with previous research
This study builds on the following previous research: Lanvers (2017b) and UCML and British Academy (2021) which suggested a relation between language student number and entry tariff/student socioeconomic background; Lanvers et al. (2018) and Liddicoat (2020) which suggested a relation between whether universities offer languages and entry tariff/student socioeconomic background; and Liddicoat (2020) which suggested a relation between whether universities offer a range of at least five languages and entry tariff/student socioeconomic background. The current study extends these by considering all universities in England, rather than a subset, and by considering entry tariff and the percentage of students from POLAR quintiles 1 and 2 directly, rather than using university mission groups such as the Russell Group as a proxy measure.
Entry tariff was found to be a statistically significant predictor of (a) the number of students accepted to study languages to degree level (b) the probability of a university offering languages to degree level c) the number of languages offered to degree level and d) the probability of a university offering a range of at least five languages to degree level. For each increase of 8 tariff points – the difference between a B and an A in one A level – you can expect to find 22 more language students, and one additional language is offered, on average, for each increase of 11 tariff points. Remarkably, entry tariff explained more of the data than university size: the number of language students and languages offered at a university can be predicted more accurately from its entry tariff than from its size, despite it seeming obvious that bigger universities would have more languages provision. Interestingly, there is no correlation between entry tariff and the number of first year undergraduate students overall (r = −0.02); instead, the strong correlations between entry tariff and the number of language students (r = 0.6) and languages offered (r = 0.6) are characteristic of the elite nature of the languages provision in English universities. Note that Lanvers (2017b), the first study to highlight this eliteness, perhaps took the relation between tariff and student number for granted, stating ‘the larger and more reputable their language department, the less likely the university is to have students from poorer SES backgrounds’ (Lanvers, 2017b: 64).
This brings us to the relation between a university’s language provision and the socioeconomic background of its students. While the percentage of students from POLAR quintiles 1 and 2 correlated statistically significantly with (a) the number of language students (r = −0.3) and (b) the number of languages offered (r = −0.4), it was not a statistically significant predictor to models with entry tariff included. Since entry tariff correlates with the percentage of students from POLAR quintiles 1 and 2 (r = −0.5), it is likely that the observed correlation between student/language number and the percentage of students from POLAR quintiles 1 and 2 is mediated by entry tariff: universities with low entry tariffs (and, therefore, high number of students from POLAR quintiles 1 and 2) have few language students and offer few languages. The finding is therefore not inconsistent with previous research showing that young people are less likely to study languages post-14 in areas of higher social deprivation (Tinsley and Doležal, 2018).
The percentage of students from POLAR quintiles 1 and 2 was found to be a statistically significant predictor of (a) the probability of a university offering languages to degree level and (b) the probability of a university offering a range of at least five languages to degree level. That POLAR quintile contributed statistically significantly here and not to the modelling of student/language number may be due to greater statistical power, since all English universities, not just those that offer languages, were included. But it may also be explained by decision making within universities: perhaps universities with higher proportions of students from POLAR quintiles 1 and 2, i.e., socioeconomically less privileged students, are more likely to close, or less likely to open, language programmes compared to universities with students from more privileged socioeconomic backgrounds. The fact that the Universities of Hull and Aston have closed their language programmes since the 2020 data was collected (Hull Live, 2019; UCU, 2021) could be supportive of this hypothesis: 50% of students at the University of Hull are from POLAR quintiles 1 and 2, much higher than most universities (98th percentile), and 30% of students at the University of Aston are from POLAR quintiles 1 and 2 (56th percentile). Also supportive is that fact that, in a recent workshop on developing a tool kit to support language provision at UK universities, the first and largest topic of discussion was ‘What can you do to help keep senior leaders on side to support languages in an institution? (UCML, 2019: 1).
In summary, this research shows that the language education crisis is manifesting in English universities as a widening participation crisis. Most universities with an entry tariff below 124 do not offer languages; nor do most universities with more than 28% of students from POLAR quintiles 1 and 2. Since the average entry tariff for English universities is 128 points, and there is a strong negative correlation between entry tariff and the percentage of students from POLAR quintiles 1 and 2 (r = −0.5), this can be summarised as follows: universities with above-average entry tariffs generally offer languages to degree level, whereas universities with below-average entry tariffs generally do not. At the other extreme, most universities with an entry tariff higher than 145 offer a range of five or more languages to degree level. Such is the widening participation crisis: many young people are unable to access a language degree programme, yet a small proportion, with the very highest tariffs, can choose from a range of at least five languages.
Future avenues
Much has been written on the language education crisis by academics, journalists, politicians and organisations such as the British Academy and the British Council. We know that numbers of young people studying languages at GCSE, A level and university are falling due to cultural, financial, political and structural barriers: a poor transition from primary to secondary school, language teacher shortages, harsh marking of language GCSEs, global English making other language study appear redundant, removal of infrastructure such as Routes in Languages, and low wages for language skills. Suggestions to improve the crisis tend to focus at the primary and secondary school level, assuming that higher take up of languages in schools is needed to fix the ‘pipeline’ to university. The 25-page joint report from the British Academy, the Arts and Humanities Research Council, the Association of School and College Leaders, the British Council and Universities UK, for example, proposes a UK-wide national languages strategy whose main suggestion regarding Higher Education is to increase government funding to safeguard languages in the event of further falls in student numbers (British Academy et al., 2020: 11).
The current study, however, reminds us that falling student numbers and language department closures are not inevitable. Rather than – or as well as – fixing the leaky pipeline, universities can learn from those that are widening access to languages, accepting more language students or offering more languages than expected for their entry tariff: the universities of Bristol, Durham, Exeter, Hertfordshire, Leeds, Liverpool, Manchester, Newcastle, Nottingham, Sheffield, SOAS, Sussex, UCL, UCLan and York St John. UCML and British Academy (2021) recommend that ‘language departments re-examine their course offerings with a view to both expanding the range of courses in combination with other […subjects and…] a greater range of non-European languages’. Future research will allow us to better understand what aspects of these universities’ programme design and other practices can be replicated elsewhere.
Crucially, this study also highlights 11 universities who are offering languages ‘against the odds’ with low entry tariffs and high proportions of students from POLAR quintiles 1 and 2: Chester, Coventry, De Montfort, Essex, Huddersfield, Nottingham Trent, Portsmouth, Sheffield Hallam, UCLan, Wolverhampton and York St John. The vital work that these universities are doing to widen access to language degrees should be applauded and supported. Motivated by the current study, a new Widening Participation Languages Network has been launched to support these, and other, universities offering languages at below-average entry tariffs (https://university-council-modern-languages.org/2022/06/07/widening-participation-languages-network-to-become-ucml-special-interest-group/). Supporting lower tariff universities is vital for the health of the languages sector, complementing broader work on widening participation to higher education (see, for example, Moore et al., 2013), which considers a wider range of under-represented populations (e.g., care-experienced, disabled, part-time and mature students, students from ethnic minority groups) and stages of the university journey (e.g., retention and student success, progress to postgraduate study, employability).
Lastly, it is important to note that university size was only included in the modelling to ensure that effects were not attributed to entry tariff or socioeconomic background that could more simply be explained by university size. However, university size itself could affect access. Research shows that over 50% of students attend university less than 57 miles from home (Donnelly and Gamsu, 2018: 11), and are more likely to commute if they are from less privileged socioeconomic backgrounds, ethnic minority backgrounds, or from the North of England (Donnelly and Gamsu, 2018: 17). If languages are concentrated in bigger universities, it may be that there are ‘cold spots’ – parts of the country where there is no university in commutable distance offering languages to degree level, negatively impacting under-represented groups. British Academy and UCML (2022: 14) started this work by mapping falls in acceptances to language programmes 2012–2021 by region, but more research is needed to identify cold spots.
Conclusion
This study highlighted the widening participation crisis in language degree provision at English universities. The number of students accepted to study languages to degree level in 2020 and the number of languages offered in 2022 were shown to correlate strongly with entry tariff, giving concrete evidence for the elite nature of languages degree provision. The probability of a university offering languages and the probability of a university offering a range of at least five languages both also correlated with the percentage of students from less privileged socioeconomic backgrounds: universities may be more likely to close, or less likely to open, language programmes if their students have less privileged socioeconomic backgrounds. Universities bucking these trends and widening access to language degree provision were identified. Two future research avenues were proposed – a study identifying those aspects of programme design or other practices that are widening access to languages, and a geographic cold spot analysis identifying areas of the country where there are no universities offering languages in commutable distance. Motivated by the current study, a Widening Participation Languages Network was launched to support the vital work of those universities offering languages at below-average tariffs.
Footnotes
Acknowledgements
I am grateful to the School of Education, Language and Psychology at York St John University for internal funding towards a licence allowing UCAS data to be used for research, and to UCAS for making this data available.
Declaration of conflicting interests
The author(s) declared no potential conflicts of interest with respect to the research, authorship, and/or publication of this article.
Funding
The author(s) received no financial support for the research, authorship, and/or publication of this article.