
Abstract
There are various styles to visually represent relational data in the form of node-link diagrams. In particular, for planar graphs we can find orthogonal node-link diagrams consisting of links bending only at ninety degrees a successful and prominent variant. One of the benefits of such drawings is the tracking of longer paths through a network with the eyes due to their limited number of link orientations, changes, and variations, but on the negative side the links can have arbitrary bending shapes. In this article we developed a novel way to visualize such orthogonal planar drawings by making use of mazes that look more natural to the human eye due to the street-like visual metaphor that many people are familiar with. Tracking paths is one of the major tasks in such graph visualizations, similar to orthogonal node-link diagrams, however, we argue that mazes are a more natural way to find paths. To get insights in the visual scanning behavior when reading graph mazes we conducted a comparative eye tracking study with 26 male versus female participants of different experience levels while also alternating between orthogonal node-link drawings and graph mazes as well as different graph size levels. The major result of this comparative study is that the participants can track paths in both representation styles, including a geodesic path tendency in their visual search behavior, but typically have a longer fixation duration at branching nodes and locations in the mazes that lead to opposite directions to the geodesic path tendency, maybe the viewers had to start a reorientation phase in their visual scanning behavior. We also found out that the size, that is the number of graph vertices has an impact on the visual scanning behavior for both orthogonal node-link diagrams as well as street-like maze representations, but for the mazes we found this impact to be less strong (in terms of the eye movement data metrics fixation durations and saccade lengths) compared to the node-link diagrams. To conclude the article, we discuss limitations and scalability issues of our approach. Moreover, we give an outlook and future work for possible extensions.
Introduction
Visualizing relational data has been in focus of research for a long time, starting with the work by Euler. 1 Until today, various visual encodings have been investigated to represent objects/persons with weighted or unweighted relations among them. 2 The many variations in the visual variables for these encodings have also been evaluated in user experiments 3 but the favorite visualization technique is typically given by the users’ tasks-at-hand and the size and properties of the graph data as well. Typical visualization techniques can be based on node-link diagrams, adjacency matrices, adjacency lists, or even hybrids4,5 thereof. Even more, the individual visual variables in each of the visualization techniques cover a large design space and create a huge repertoire of possible graph visualization candidates.
In this article we present yet another visual encoding for relational data which is based on mazes, a popular technique that we typically find in newspapers or magazines as some kind of strategic way finding task serving as entertainment game and the shortening of waiting times. We found this approach very promising as a novel visualization technique for a special kind of graph data in a given link encoding style: planar orthogonal drawings. 6 We argue that the used straight and orthogonally bending lines can be modified into something which the users are more familiar with: graph mazes (see Figure 1). The graph mazes are some kind of “enclosure” approach in contrast to the well-known “connection” approach as used in node-link diagrams. Hence, the major research question in this work is whether the “enclosure” encoding has any benefits compared to the traditional “connection” approach for graph drawings. The enclosure approach is known from hierarchical graphs but we are able to extend it to planar graphs as well since those are crossing-free representations and hence allow an enclosure drawing approach similar to cities, city regions, and districts with all the contained streets and those that connect the districts and parts of the city. A planar graph is consequently a special type of hierarchical graph, one that we can layout without link crossings in the plane, hence allowing the street-like visual metaphor that would only be possible for non-planar graphs when introducing “bridges” in the street-like visual metaphor.
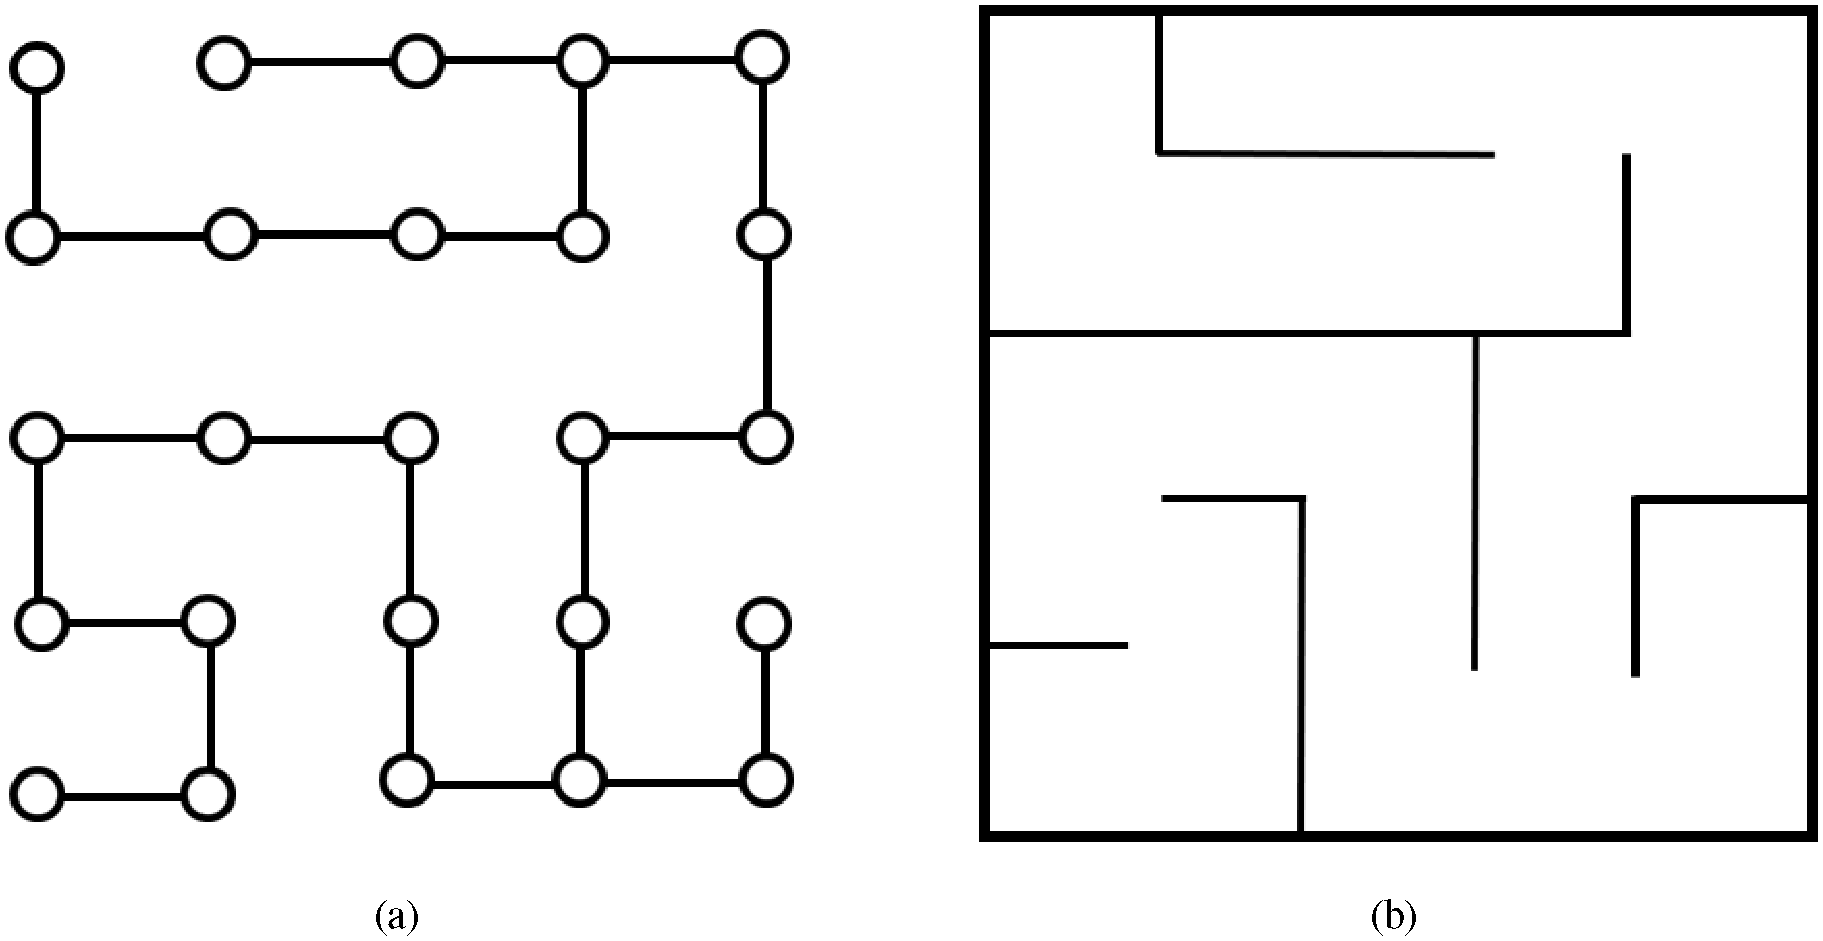
Orthogonal planar graph drawings (a) can be transformed into graph mazes (b) that provide a more natural visual appearance of the graph.
The focus and research question of this work could even be regarded as being two-fold: It actually introduces a novel visual encoding for graph data that is called graph mazes (based on the “enclosure” principle), a street-like visual metaphor for which we expect that it will have benefits when reading and interpreting the graph data, in particular for way-finding tasks. As a second contribution we designed and conducted a comparative eye tracking study with 26 participants to analyze whether the graph mazes have any benefits compared to the traditional orthogonal node-link diagrams (based on the “connection” principle) with respect to graph size, gender, and prior experience of the participants. Our study is based on formerly stated hypotheses that incorporate the sizes (difficulty levels) of the graphs (H1), the gender (H2), the experience level (H3), as well as the visual encoding (node-link diagram vs graph maze; H4).
To reach our goal we start with algorithms that artificially create planar orthogonal graph drawings from a given relational dataset with suitable properties for the visual stimuli in our eye tracking study. As a second step we transform the resulting node-link drawing into graph mazes (here we use the simplest form of a maze as stimulus in the study). To investigate whether such graph mazes are perceptually understandable and useful for graph analysts we conducted a comparative eye tracking study with 26 participants and evaluated the strategic visual scanning behavior of the participants when confronted with a way finding task in both, orthogonal node-link diagrams and mazes. As further independent variables in the study we varied the sizes of the graphs, that is number of vertices as well as the gender and experience levels of the participants. Finally, we discuss limitations and scalability issues of the new approach and describe options for future research in this domain.
Related work
Graph drawings have interested researchers for many years initiated in the work by Euler 1 investigating a solution to the mathematical problem of the “Seven Bridges of Königsberg.” To present its solution he used an abstract visual way in the form of a node-link diagram. These kinds of visual metaphors for relational data are popular until today, however, including many esthetic graph drawing criteria.7–11 Not only the esthetics plays a crucial role for the readability of the graph but also other aspects regarding link representation styles that can come in various forms 3 such as straight, curved, orthogonal, tapered, 12 or even partially drawn links.13,14 Also edge bundling has been studied as an alternative way15,16 to get rid of visual clutter 17
In recent years the analyzed and visualized graph data has become that large that the traditional node-link representations cause problems from a perceptual perspective, 18 hence including matrix-based visualizations 2 and list representations 19 as alternatives, as well as hybrid representations.4,5 Even combinations of several metaphors 20 in some kind of multiple coordinated view 21 have been investigated to show the graph data in several perspectives, all having benefits and drawbacks depending on the users’ tasks at hand. The multiple representations can uncover patterns that a single visualization could not show, however, showing more visualizations of the same data at the same time also creates a cognitive burden for the viewers since they cannot focus and concentrate on just one, mental map preserving, visualization.
Despite the bad scalability aspects, node-link diagrams are still in use today due to their strengths when following paths, for example based on the geodesic path tendency.22,23 This path tendency has been investigated as well in hierarchy visualizations using node-link diagrams. By using eye tracking, a level-wise visual scanning strategy is observable when solving the task of identifying least common ancestors in tree diagrams.24,25) Three variants based on traditional, radial, and orthogonal drawings have been studied while the orthogonal one is somewhat related to the variant we use in this line of research. However, we do not compare different layouts but we compare node-link diagrams with graph mazes. In particular, when searching for a common node in a graph diagram the participants had to follow a common goal which creates some kind of visual search strategy, already investigated by increasing the number of distractors in a virtual world search task. 26 In our work we do not include distractors but the size of the graphs and the increased number of edge bends can as well be regarded as some kind of graph-induced distractors. It is also known that the gender has an impact on such navigation tasks, in particular in the famous Morris Water Maze task, 27 a finding that we also investigate in our study.
In traditional node-link diagrams the path tracing can still be a problem, in particular when the graph data gets larger and denser, 18 orthogonal graph drawings seem to be a bit clearer due to their many parallel running links, which is caused by the ninety degree bends creating horizontal and vertical lines only. However, the parallel lines might still be hard to follow if there are just traditional straight links which might cause the eyes to lose track and hence, lead to graph data misinterpretations. A more natural street-like visual metaphor could have benefits although the visual metaphor is very similar to the standard orthogonal drawings, but the eyes get more “guided” by some kind of street instead of just one straight line. Consequently, we investigate graph mazes as another alternative to the traditional orthogonal graph drawings, in particular for planar graphs, 6 that is those that can be laid out without link crossings in the plane. To understand whether they are useful alternatives to the traditional orthogonal graph drawings we designed and conducted an eye tracking study. 28 To reach this goal we recorded visual attention data, that is spatio-temporal scanpath data that requires advanced analysis and visualization techniques 29 to fully understand the study participants’ visual behavior over space and time.
Relational data and layout
Relational data can be modeled as a graph

consisting of a finite set of vertices

where
Data generation
We artificially generate graphs to get a sufficient number of drawings that serve as stimuli for the eye tracking study. To create a graph composed of
It may be noted that the goal of the planar graph generation algorithm is not to create esthetically pleasing or even symmetric graphs, the goal is more to allow the creation of arbitrary graphs on demand, that is on button press, that serve as stimuli in the eye tracking study. In the current version, we can only vary the number of vertices, that is the size of the planar graph and hence, the size of the mazes that serve as independent variable in the eye tracking study. For future work we plan to add more variable parameters in the created graphs to get more independent variables for our eye tracking study. Some of those parameters that serve as independent variables in the study could be the number of edge bends, the average, minimum, or maximum lengths of the paths, the region covered by the solution path, and many more. However, it may be noted that those parameters are dependent on the size (number of vertices) parameter but they are not explicitly controlled in the current study.
Orthogonal planar drawing
In this work we focus on orthogonal node-link drawings. To reach this goal we adapted the incremental layout algorithm proposed by de Fraysseix 30 who embed planar graphs on a grid. This algorithm gets a graph as input and outputs a corresponding planar orthogonal drawing. We count the number of vertices the graph has and use this to categorize the graph into a class being small, medium, or large which serves as independent variable in our eye tracking study.
Typical user tasks
To this end we identified several user tasks that are particularly solvable by using orthogonal planar graph drawings. To create a list of possible supported tasks we investigate the street visual metaphor in towns that are based on an orthogonal-like street system in case an intersection or roundabout allows up to four directions, similar to Manhattan, also prominent for the Manhattan distance. 31
Typical tasks that we consider as being beneficial for using graph mazes are:
Wayfinding: One of the most prominent tasks in graph visualization is to find a way by walking through a connected set of nodes. In a maze we can use streets to find such paths.
Understanding overall graph structure: Each graph describes some kind of structure, for example consisting of symmetrical parts or containing dense and sparse subgraphs. This can be seen as well in a street metaphor like in a maze by differently large blocks with streets around due to the fact that the encoding into a graph maze does not change the layout of the original node-link layout to be compared, just the principle is changed from “connection” to “enclosure.”
Identifying dead-ends: Some nodes might be the “end of a road,” that is they can be walked in and only the direct way back is the only way out. This phenomenon gets clear in a maze by identifying discontinuous streets.
Path lengths: Some paths might consist of a long sequence of nodes without allowing to step into other branching nodes, or paths might be quite short, only consisting of a few nodes. This feature is visible in mazes by looking for long or short roads.
Detecting loops: A path in a graph starting at a node and ending at the same node again is a loop. In a maze we might identify that by a street around a block.
There are many more tasks that might be supported by graph mazes, however, as a first attempt we focus on these prominent ones. The naive design of the graph mazes is actually focusing on these standard tasks while in the future we plan to extend the graph mazes by additional visual features, also including graph aspects like edge directions, edge weights, multiple edges, vertex categories, and the like which might be visually encoded by the visual variables color, street widths and thicknesses, different street lanes, as well as color coded blocks, and the like.
Graph mazes
In this line of research we focus on the most prominent tasks in graph interpretation and only include traditional and simple planar graphs into our design, that is simple, undirected, and unweighted graphs in which vertices do not carry any additional categorical or numerical information. We describe an easy transformation of such graph data into graph mazes, that is some kind of street-like metaphor. The eye tracking study provides insights about the readability of such mazes in which further design ideas can be integrated in the future.
Modifications from node-link to graph mazes
When visually encoding planar orthogonal drawings into graph mazes we only need to modify a few visual features from the original node-link diagrams into maze-related ones.
Nodes: The nodes from a node-link diagram are represented by short street segments of a given width.
Links: Links are actually connected street segments that consequently stretch over longer horizontal or vertical display space due to the fact that each link connects two nodes in the node-link diagram.
Branchings: If more than two links are connected to a node we typically have a branching option in a graph which is shown as street intersections and junctions in a graph maze.
Paths of length
Empty graph spaces: Regions in a node-link diagram that are located between paths are visually encoded as separating walls, buildings, or blocks, to allow the human eye to better follow the created streets.
Maze generation algorithm
The maze generation algorithm needs a planar orthogonal node-link diagram as input. Each node gets replaced by a quadratic area while the links in-between stretch this area to the connecting areas, that is the nodes to which a link exists. If no link exists between two neighbored nodes, a borderline gets introduced which actually models a wall in the street-like visual metaphor, later this wall can be extended to complex buildings or blocks.
Additional visual enhancements
There are various options to enhance the original graph mazes. In the eye tracking study we take into account the original “plain vanilla” form of a graph maze to investigate whether the study participants are able to understand the visualization and to solve relevant tasks, before we extend our research into more advanced graph mazes at a later stage.
Node/Link properties: Each node and each link can have additional properties like directions, weights, attributes, and many more. Visual variables like color gradients, sizes, or textures might be useful to add extra information.
Path properties: Each path has a certain length, it can be a loop, or it has a number of bends. All of this information can be encoded in addition. For example, if a path is a dead-end, this can already be indicated, just like for streets, to avoid viewers to search along the wrong paths, a fact that would cause longer response times.
Structural properties: A graph could be symmetric in some parts, or it could be sparse or dense, a property that could be indicated by color codings or textures, a visual feature oftentimes used in information visualization to depict regions with crowded point clouds.
Branching properties: The number of linked nodes to each node is an additional information that can help to show in how many subgraphs we might search a possible path solution. If a path is not branching at all, there is just one way to search.
Eye tracking study
We describe a comparative eye tracking study focusing on solving graph mazes. First of all, we present hypotheses that we plan to check based on the visual attention behavior of several study participants. We design the eye tracking study focusing on independent and dependent variables, that is we vary the number of graph vertices, gender, experience levels, as well as visual encodings “enclosure” and “connection” and try to find out the impact of changes to the independent variables on the eye movement behavior, the response times, and the error rates.
A pilot study is set up first to test whether our study design is well-chosen or if it requires some modifications. We conducted the pilot study and the real eye tracking study by using a Tobii Eye Tracker 5. One major outcome of the study is that if the graph mazes become more difficult, people change their task solving behavior which can be extracted from the eye movement behavior. At a certain point, they even changed the visual scanning direction of the path to solve the maze, that is starting from the end (see Figure 2 for an example graph maze overlaid with visual attention data).
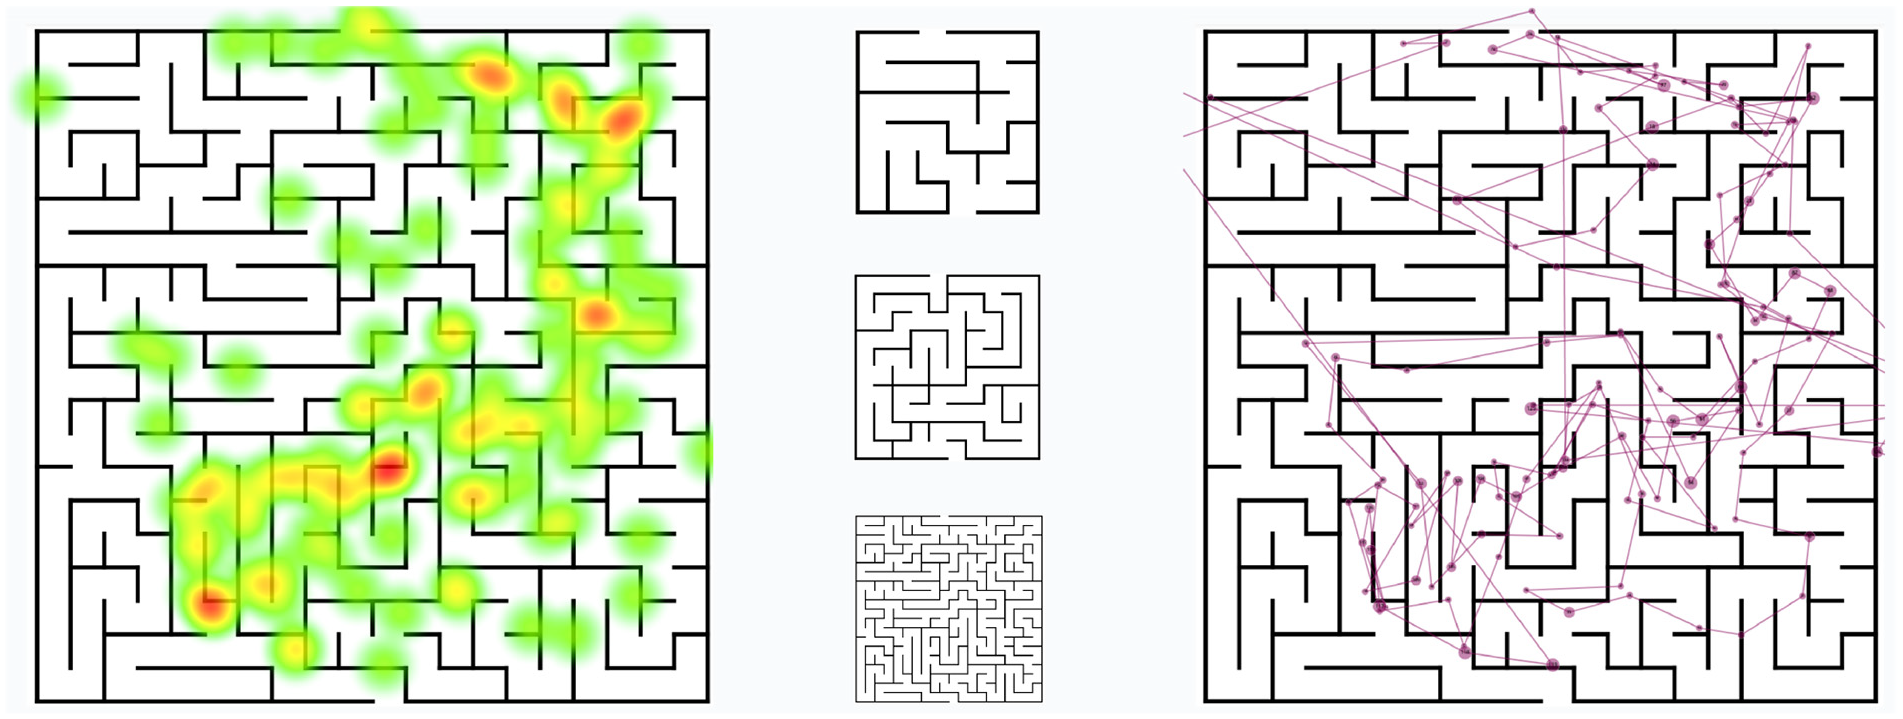
The eye tracking study setup: Visualization of mazes in different difficulty levels, accompanied by heatmaps and gaze plots for analyzing various visual attention strategies.
Mazes and visual attention
A maze can be an exciting leisure activity suitable for all ages. The level of difficulty can be self-selected and the challenge adapted individually using one’s preferred difficulty level. In the eye tracking study we are explicitly interested in some general research questions like:
What kinds of visual scanning strategies are used by the study participants to solve the given tasks?
How do the visual scanning strategies look like exactly, over space and time, fixation durations and saccade lengths, and how much do they deviate from the optimal solution path?
How do the visual scanning strategies change with the increase of the difficulty levels?
These and other questions are frequently discussed in research, in particular when investigating visual attention patterns of a certain number of people to identify differences in the visual scanning behavior. 25 For this reason, we came up with the idea of using eye tracking to understand how the graph mazes are read and if there are any problems and challenges, in particular with a higher difficulty level.
Humans possess an innate and remarkable ability for spatial orientation and navigation.26,27 This becomes evident when they are facing the challenge of solving a maze. A maze is a complex spatial puzzle, often depicted as a network of pathways and walls, with the objective being to find the exit.
The process of finding a solution typically commences with a visual analysis of the maze, wherein the eyes explore the maze’s structure. During this phase, individuals endeavor to construct a mental model of the maze by memorizing the positions of walls, intersections, and potential paths. Throughout the navigation process, individuals often employ their attention and concentration to focus on their current location and the subsequent sequence of steps. It is also common for them to direct their gaze toward specific features within the maze to maintain their orientation. 32
In the end, the step-by-step exploration and informed decision-making lead to the attainment of the maze’s exit. This can evoke a satisfying sense of achievement and spatial mastery. 33 This might be one reason why they are popular in newspapers and magazines as some kind of entertainment task.
Overall, solving mazes serves as a captivating illustration of how humans can tackle intricate spatial challenges. It underscores their capabilities in visual perception, spatial imagination, decision-making, and concentration. By recording and analyzing the eye movements and visual fixations of subjects while navigating mazes, we can gain insights into the mechanisms of visual information processing involved in the accomplishment of complex spatial tasks. 34
Research question and hypotheses
We conducted an eye tracking study to determine visual attention trends when using graph data of different difficulty levels in two representation styles as node-link and maze representations that serve as independent variables in the study. The mazes are a novel way to visually encode planar orthogonal graph drawings by using a street-like visual metaphor instead of the more abstract node-link visual metaphor. We also investigate differences in genders and experience levels.
In our eye tracking study focusing on mazes, we explored the following research question, actually asking whether graph mazes and node-link diagrams can be read, understood, and interpreted in different sizes, from different genders, and by people with varying experience levels:
RQ: How do visual scanning methods to solving a path-finding task in graphs look like in terms of different levels of difficulty, between genders, based on prior experiences or not, and between “enclosure”-based graph mazes and the traditional “connection”-based orthogonal node-link diagrams?
From the research question, we derived the following four hypotheses:
H1 (Graph size): The visual scanning methods change depending on the level of difficulty that is the number of nodes in the graphs.
H2 (Gender): There are different visual scanning strategies for male and female participants.
H3 (Experience level): People who frequently solve riddles can solve maze tasks faster than those not solving riddles. The eye movements for the experienced ones are less chaotic, that is shorter fixation durations and longer saccades.
H4 (Visual encoding): The participants can solve the path-finding task in the graph mazes faster and with less errors than in the orthogonal node-link diagrams. Also the eye movements deviate less from the optimal solution path and the fixation durations are shorter while the saccades are longer compared to the node-link diagrams.
For all hypotheses, it is essential to have eye movement data to confirm or reject them. It is worth mentioning that the shorter fixation durations and the longer saccades indicate a less chaotic visual scanning behavior, that is people are more familiar with a visual scene when solving a given task. 35
Participants
All 26 participants (13 male and 13 female) were aged between 18 and 43 years at an average age of 24.2 years. All of them had different educational backgrounds ranging from students of computer and data science, teachers, waiters in a restaurant, and the like, actually covering a wide range of non-experts in graph visualization. Nine participants mentioned that they solved riddles, puzzles, or mazes in their free time and all of them participated voluntarily in the study. To divide them into experience levels we let them solve six mazes each (two simple ones, two medium ones, two difficult ones, all of them were not used as stimuli in the eye tracking study) and recorded the time it took them to solve the tasks. Based on the average task completion times we put them into 3 experience level categories. This resulted in 10 experts, 7 semi-experts, and 9 non-experts.
Before the study was conducted, participants were asked about their demographic data by filling out a questionnaire with personal details such as age, gender, prior experiences, and so on. A total of 16 participants wore glasses or contact lenses, meaning they had corrected-to-normal vision. To further set the obtained visual scanning results in a context and for reasons of completeness, they were also asked about their method of solving the puzzles and riddles.
Creation and design of the stimuli
For this study, mazes ranging over three difficulty levels (easy, medium, and difficult) were generated. For the easiest level the algorithm always created graphs with 20–30 vertices, for the medium level it created graphs between 31 and 60 vertices, and for the most difficult level it created graphs between 61 and 100 vertices. For all mazes, the start was artificially added to the top and the finish was artificially added to the bottom, following some kind of top-to-bottom reading strategy and to allow the participants to faster find the start and the finish, to avoid longer response times and chaotic eye movements due to the unwanted search task. At the easiest level, the way out should be found in the shortest possible time. The main purpose of this maze was that the method can be compared with the medium and most difficult variants. For the variant with the medium difficulty level, we wanted to show whether a difference could already be seen in this scenario if the solving strategy got a little bit more complex than for the easiest level (for more detailed results on the incorporated variables read the exact values in Table 1).
Average fixation durations, saccade lengths, completion times, and ideal path deviations for all 26 participants (split for gender and experience levels) for all three difficulty levels and two visual encodings.
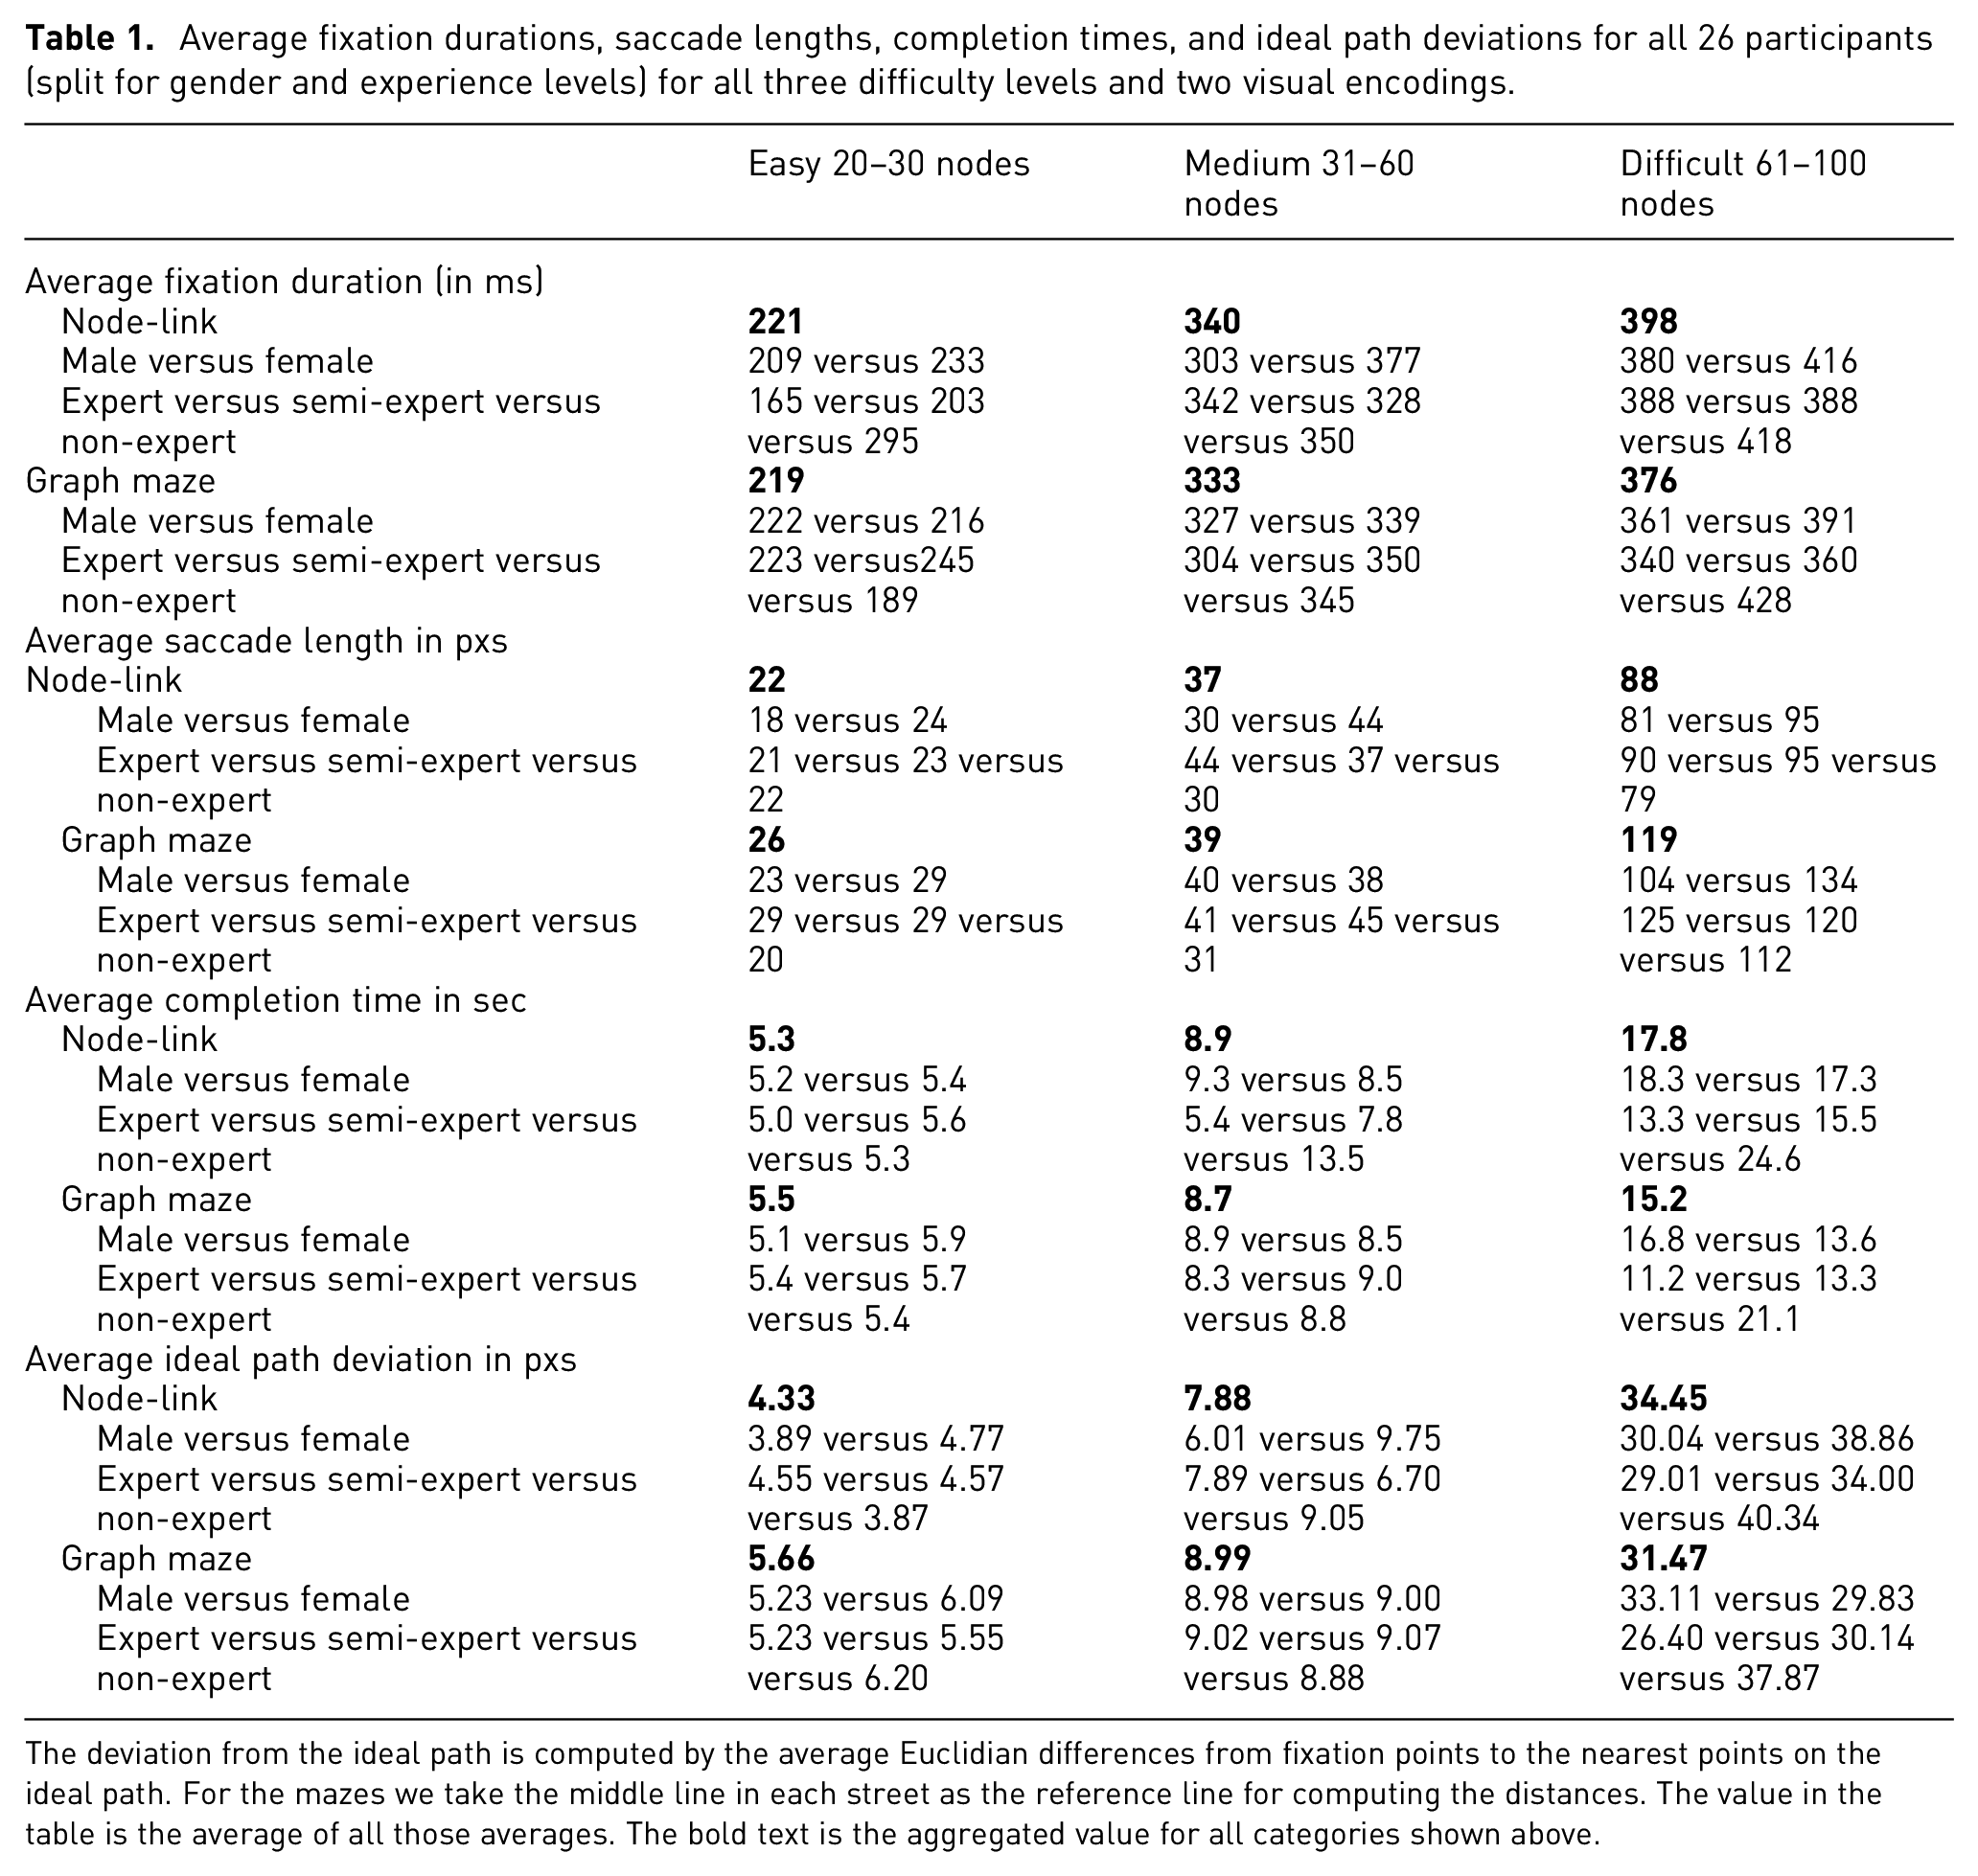
The deviation from the ideal path is computed by the average Euclidian differences from fixation points to the nearest points on the ideal path. For the mazes we take the middle line in each street as the reference line for computing the distances. The value in the table is the average of all those averages. The bold text is the aggregated value for all categories shown above.
In order to avoid additional influences on the results, the mazes were only generated in the colors black and white. This allows for the greatest contrast and thus is easily visible to all when conducting the study. The background is white and the walls are black (see Figure 3). This also allows to only check two visual independent variables which are the number of graph vertices, that is difficulty levels and the visual encoding, that is orthogonal node-link diagrams (“connection”) and graph mazes (“enclosure”). Based on their variations we investigate their impact on the dependent variables in the form of eye movements, response times, and error rates.
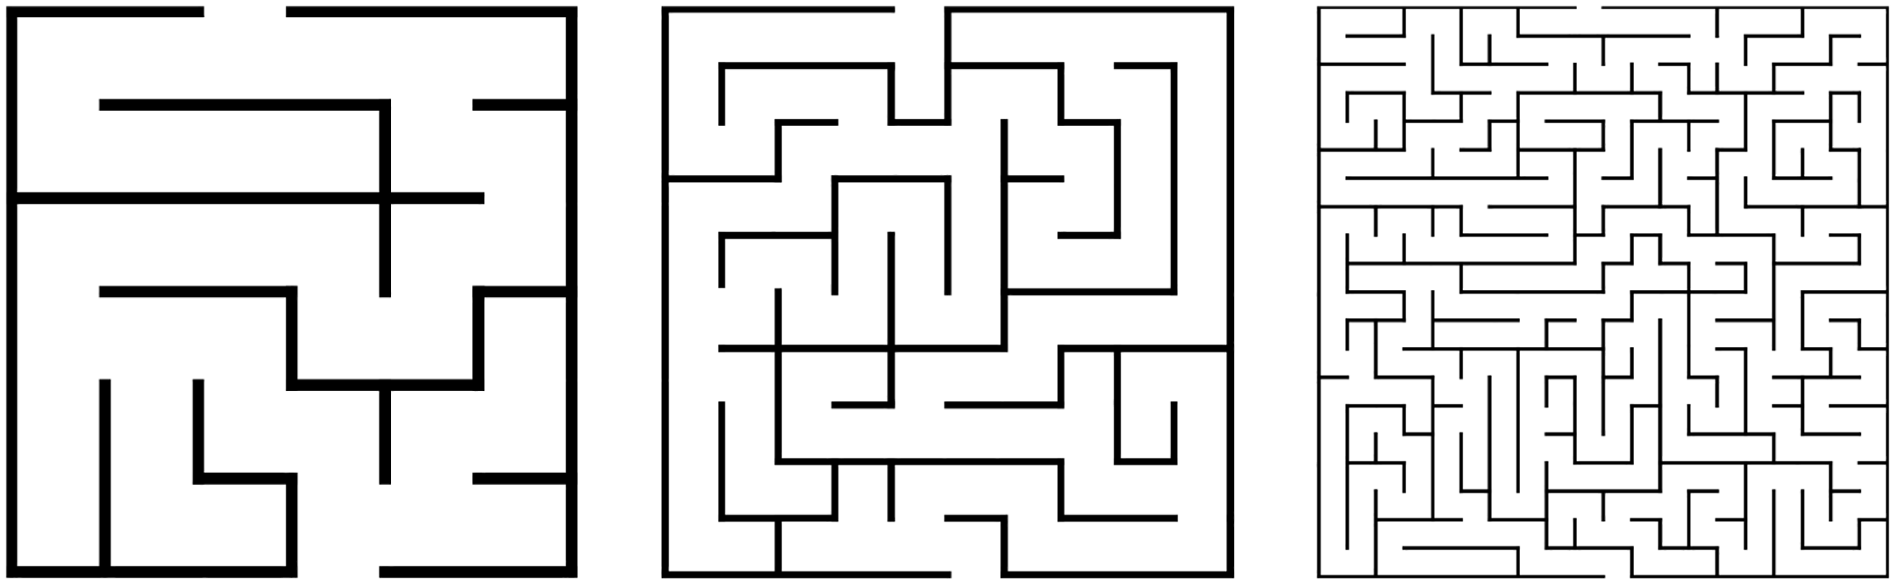
All three mazes in a different difficulty level (graph size), on the left hand side we can see a maze in the easiest level, followed by medium and difficult levels.
Path drawing task
In this study, the task was the same for all participants. In each difficulty level, they had to draw the path from the start at the top to the finish at the bottom as quickly as possible using a pen controlled by the mouse cursor on the computer monitor of the remote eye tracking device. There was no time limit, but it was also not a race, because the time to solve the maze was actually not that relevant, we were more interested in the eye movement behavior, that is the visual scanning and the task solution strategy. 25 The actual instruction for the participants was to draw the solution path as fast as possible by keeping a high task accuracy, actually two contradicting, conflicting goals in some kind of trade-off behavior.
Pilot study
Before running the experiment, we conducted a pilot study with four participants to verify that the real study could be run as expected. The pilot study showed that before the first maze, another slide has to be included where the procedure is clarified and especially how to choose the right tool in the program to draw the path. In addition, a slide for a note of thanks was added at the end so that the gaze does not jump directly to the ESC key to stop the recording after the last maze has been solved. This would otherwise negatively influence the evaluation of the gaze plot.
Furthermore, we have found that it is not necessary to set a time limit for the experiment, because the participants want to find their way out of the maze as quickly as possible anyway and are always eager to solve the task. None of the participants felt bored or gave up in the eye tracking study. What we also learned in the pilot study was the fact that people are typically not familiar with drawing paths in a maze by using a computer mouse or pen. However, we actually did not further include this hand-drawn path in our analyses, we focused more on the analysis of the eye movement data. The hand-drawn lines were only important to guide the eyes of the participants and to carefully let them follow a solution path in the mazes or in the node-link diagrams.
Study design
As already mentioned in the pilot study, we used different slides per level. These slides were provided by the program “Google Drawings.” The individual drawings were connected with a linked arrow and the test person had to master a clear and simple user journey. The experiment started with an explanation of the study procedure and how to draw a path in a maze.
The technical reason for choosing this program was that, on the one hand, the slides could be easily divided and thus inserted into the Tobii Pro Lab software and, on the other hand, the path could be drawn in the graph mazes with the mouse, thanks to the pen feature. Finally, the graph maze with its way out could also be downloaded for each test person.
We used a within subjects study design in which we also focused on randomization, permutation, and replication. Each variant has been shown five times which means we had three difficulty levels and two visual encodings that result in 30 trials per participant, that is a total number of 780 results in the whole study. For each of the 26 participants we permutated the order of the visual encodings as well as the difficulty levels to compensate for learning and fatigue effects.
Environment and technical setup
The study was conducted in a laboratory isolated from outside distractions, while the eye tracking device was provided at this place making it easily reachable by our study participants. The laboratory was a quiet place and artificially illuminated allowing the participants to concentrate well while solving the path finding task in the node-link diagrams and the graph mazes. The operator was present in the room at all times to guide the participants in cases there were unclear scenarios.
We used a Tobii Eye Tracker 5 and a laptop on which the Tobii Pro Lab software was installed to analyze the recorded eye movement data later on.
Qualitative feedback was already collected during the study because the cursor and eye movements could already anticipate what the participants’ method was.
Conducting the study
The study was carried out over 2 weeks without any major problems. Due to the fact that an operator was sitting next to a study participant during the entire study for support, it was possible to intervene directly in the case of small unclear points and to solve the problem quickly, however we are aware of the fact that the operator could be a confounding variable in the study and hence, he behaved as quiet and as similar as possible. Most of the small problems occurred when the drawing tool had to be selected for the first time and when it was needed to change to the next stimulus. From the second stimulus on, however, the principle was clear to all participants and the study could be successfully completed.
All participants found their way out, that is the error rate was 0% while some were faster than the others. This was not a limitation, because this study only investigates which visual scanning strategies the participants chose.
Results
Since the study was only conducted with 26 participants, we focused on a spatio-temporal visualization of the generated eye movement data replacing a pure statistical analysis, but we also looked into additional gaze metrics. For this purpose, we generated a visual attention map and a gaze plot for each participant (see Figure 4) and interpreted the visual scanning behavior by looking at the hot spots of visual attention, the fixation, and saccade data, as well as the drawn path line.
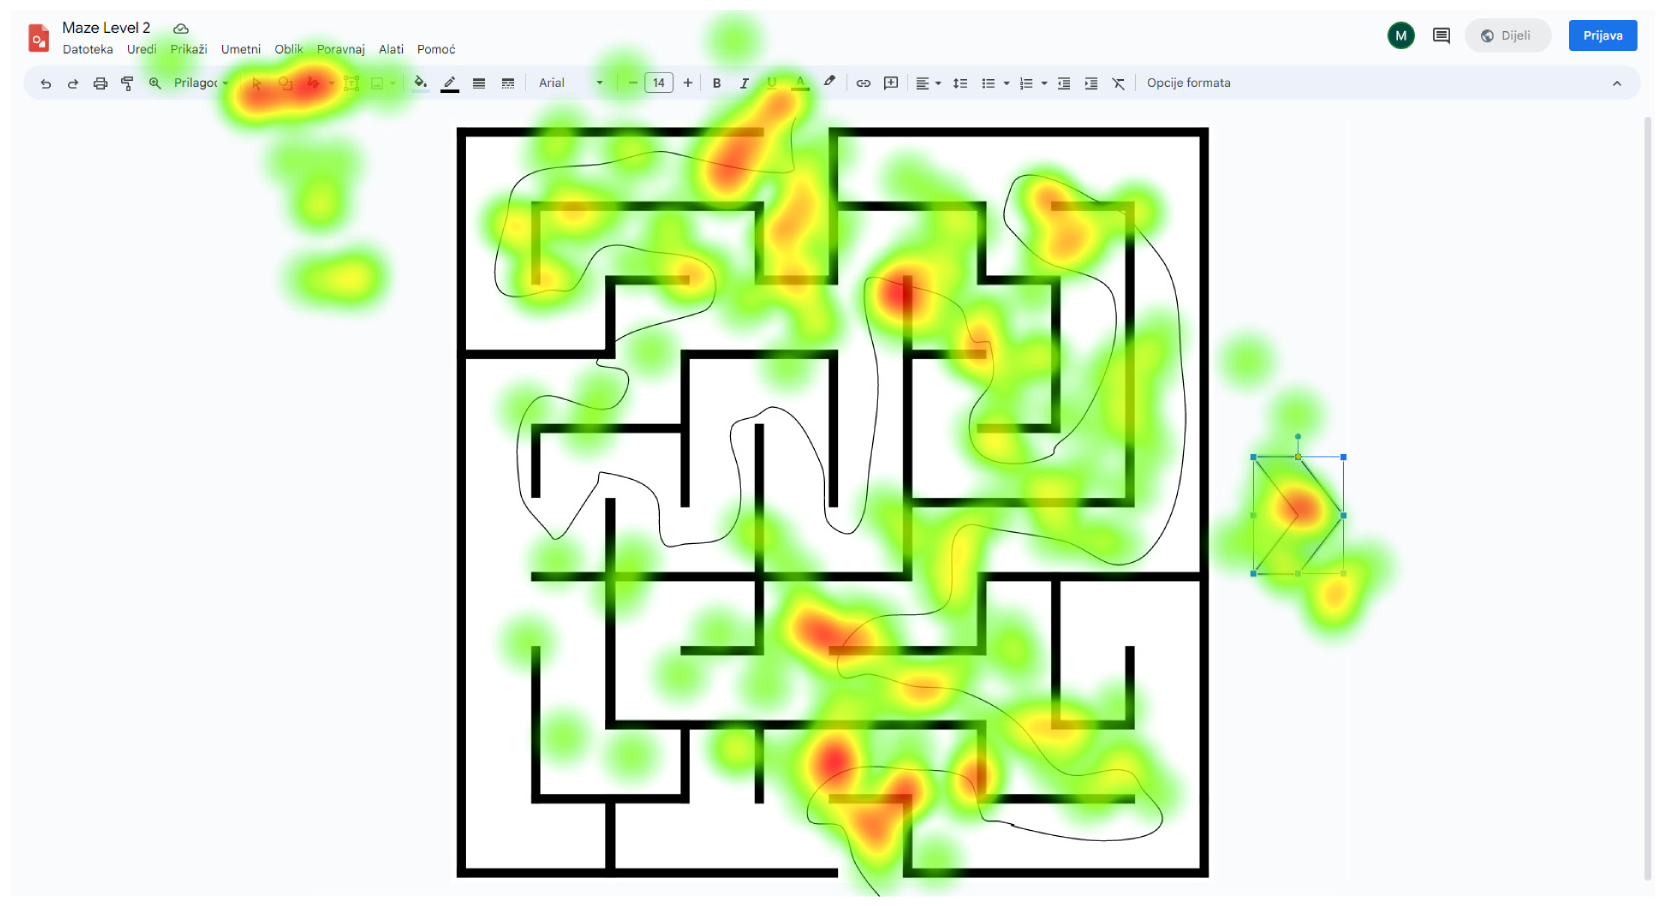
Heat map of one graph maze stimulus of the medium difficulty level with the path drawn in the background. We can see where the subject’s gaze stopped for a longer time.
In general, the eye movement data visualizations already give indications for the gaze patterns of the participants and their differences. All study participants were given the same task of finding the exit of the graph maze as quickly as possible, however it turned out that they did not solve the tasks in a homogeneous and continuous way, but they rather stopped in-between sometimes, maybe to re-orientate. Still, the graph mazes were readable for typical path-related tasks and the solutions could always be found.
Impact of difficulty level
The independent variable was given by the number of vertices in a graph and we tried to figure out any impact on the eye movement behavior. In general, the participants applied similar strategies. They started at the top of the graph maze, that is at the beginning of a path. However, there was a big difference in the dependent variable that was given by the spatio-temporal eye movement behavior.
For the lowest level of difficulty the participants did not visually analyze the graph maze a lot. They more or less started directly at the top. Without any difficulties and mistakes they were able to smoothly find the correct path that led them out of the maze. Our hypothesis is that this kind of graph maze only covers a small region and can hence be visually observed at once without actually looking around a lot.
For the medium difficulty level we notice a change in the participants’ visual scanning strategies. As with the lowest difficulty level they started without visually analyzing the maze but shortly after they have started they stopped for a while before they continued following the path out of the graph maze (see Figure 4). This effect can be seen in the visual attention maps as well as in the gaze plots. Maybe the maze was already that large that it cannot be inspected completely, consequently it is split into two major visual scanning strategies: visual orientation and visual task solution.
At the third level of difficulty, the participants’ approach changed again. Before they started with the path, they first analyzed the whole maze. After they could find a possible way out, they started with the path. As in the second level of difficulty, they stopped in the middle of the path to figure out the next steps. This visual scanning strategy is similar to the geodesic path tendency, always trying to walk in the direction of the target, even if some short ways in opposite directions have to be chosen first.22,23 The third difficulty level also took the participants the most time. This means we can confirm hypothesis H1 that the visual scanning strategies change depending on the level of difficulty.
We can observe an increasing task completion time for increasing difficulty levels for both, node-link diagrams and mazes as well (see Table 1). Not only the completion times are affected by this but also other dependent variables like average saccade length and the fixation duration. For the average ideal path deviation we see an immense increase for the most difficult level, indicating that people might have problems to follow the paths or they have to re-orientate all the time which also causes such large deviations.
A general finding about the drawing and the eye movement behavior was that for all participants and in every difficulty level there is a tendency that the participants’ eyes always look ahead. This means that the eye is always already further ahead than the participant’s path drawing. This is similar to the well-known leave-before-click effect in user interfaces which means that the eye has already left a user interface component while the mouse click has still to be done, for example to press a button or move a slider.
Impact of gender
One of our hypotheses addresses the question of whether there is a difference between genders, specifically between females and males, when it comes to solving a graph maze. One study investigated this assumption and tried to find out the differences between male’s and female’s visual scanning strategies. 36 Clear distinctions between genders can be observed in this study, however it is quite hard to generalize their results to our own visual scanning problem. One result of the aforementioned study was that women tend to focus more on landmarks during navigation, but these fixations also increase the task completion time. Additionally, women tend to maintain their focus on landmarks for a longer duration, a behavior that diminishes over time for men.
In our eye tracking study we can summarize that the female participants actually did a similar visual scanning strategy but considering the fixation durations and saccades of the eye movement data we can say that the fixation durations of the female’s eye movement data are longer in average than the male’s ones which is inline with previous research on Morris Water Mazes. 27 For the saccades, the female participants make longer jumps in average from one fixation point to the next one than the male participants (see Table 1). We conclude that the female participants more carefully check for the correct path in the graph maze and in the node-link diagrams while they also jump with their eyes over longer distances and get faster to the solution. This partially confirms hypothesis H2. There are no real different visual scanning strategies but the eye movement granularity is somewhat different between male and female participants.
Impact of prior experience
A confounding variable in a user study can be the prior experience of the study participants. In the case of the graph mazes we checked whether the participants frequently solve riddles which we consider as gaining a higher experience level than participants without this kind of prior knowledge. We also checked their experience level by making test run throughs and recorded the completion times to find a solution path. When inspecting the visual attention maps and the gaze plots of the recorded eye movement data for the participant group with and the one without experience we actually do not find any great differences in the visual scanning strategies. However, looking at Table 1 and in particular to the difficult level we can see that the experience seems to play a crucial role for the task completion times, also the average deviation from the ideal path metric shows that the experience has an impact on the solution. For the fixation durations and the saccade lengths this effect is not that prevalent, but still we argue that the experience level has an impact on the solution efficiency, hence we (at least) partially confirm hypothesis H3.
Impact of visual encoding
Finally, we can compare both visual encodings, that is node-link diagrams that follow the principle of “connection” and graph mazes that follow the principle of “enclosure.” Looking at Table 1 we can see that there seems to be some kind of impact on all metrics, at least for the most difficult level. The average fixation durations are shorter for graph mazes, the average saccade lengths are longer for graph mazes, the average completion time is lower for graph mazes, and the average deviation from the ideal path is lower for graph mazes. Consequently, all four metrics indicate a favorite variant which are the graph mazes. Hence, we confirm hypothesis H4.
Limitations and threats to validity
Although we designed and conducted an eye tracking study to figure out if graph mazes can be understood and interpreted better or at least equally well as their node-link counterparts and how the visual scanning strategies look like we are aware of the fact that there are various points that cannot be covered in such a study. In particular, the parameter space is that huge that the impact of all independent variables on the dependent ones cannot be checked, at least not in just one eye tracking study. We can vary the graph data itself but we can also vary the visual output of the graph data in form of a graph maze. In the current scenario we only evaluate the most traditional form of a graph maze, using black lines on a white background, without additional visual enhancements, however these might be options for extending this line of research in future scenarios.
Graph stimuli
The artificially generated data can be based on certain well-defined characteristics, however we cannot include and vary all of the involved characteristic data features. For the purpose of this eye tracking study we only vary the number of graph vertices and randomly add all other features. The number of vertices and the computed layout has a direct impact on the number of edge bendings and how they occur, however we do not explicitly control the edge bends in this study. Although this is a naive but useful strategy we admit that the artificially created data might have a bias. It is not possible to create that many stimuli that all possible characteristic features are covered. Otherwise the number of experiments in the eye tracking study would be that high that each individual study would last for quite a long time, including fatigue effects for the participants. As an alternative we might consider a longitudinal study, but this again might add a bias due to learning effects, in the end such a study setup would be too complex.
Visual enhancements in graph mazes
In the current version we just evaluate the “plain vanilla” form of graph mazes consisting of black colored separation lines on a white background. In the future we might even add more visual features in the form of visual variables that add more graph data properties about the vertices, edges, structures, or paths. Those could be based on color coding, thicknesses, textures, icons, and many more. Visually encoding them is not a big issue from an information visualization perspective but integrating all of them in an eye tracking study would require an extended study design, requiring many participants and much more time. The current research question about whether graph mazes are understandable can be investigated by the naive and most traditional way of graph mazes just using black lines on a white background.
Study participants
There are various confounding variables in a study that have to be controlled. The participants are in most cases such a variable and controlling them is quite difficult. One big issue here is the experience level the participants bring into the study as well as learning and fatigue effects. Randomization, permutation, and replication of the individual experiments can help to average out those effects but still, the experience and prior knowledge can be a problem since we do not really know who is familiar with the stimuli and the tasks, even if we checked the participants before taking part in the study, but the judgment of the experience can vary itself and hence, might create a bias in the results. In the case of the graph mazes the participants could have some experience in solving riddles or even mazes. Those are popular in newspapers or magazines, for example for entertainment purposes.
Data recording and evaluation
Eye tracking data has a spatio-temporal nature. This kind of data cannot be evaluated by statistical approaches in the standard way. More advanced data analysis and visualization techniques are required to dig deeper in the data and to find more insights about the visual scanning strategies. Visual analytics is a popular field 29 that applies interactive data analysis and visualization supporting analytical reasoning with the goal to find insights and knowledge in the data. 37 Visual analytics in eye tracking 35 is attracting more and more researchers due to the fact that it can uncover data patterns in eye movement data that cannot be found by applying traditional statistical approaches. However, it is a multi-disciplinary field and requires profound knowledge in many scientific areas like programming, information visualization, visual analytics, algorithmics, data science, mathematics, and many more. The recording of the eye movement data is actually not the challenging issue, the analysis of the spatio-temporal data is the bigger problem.
Conclusion and future work
We described an approach that visually encodes planar orthogonal graph drawings into graph mazes, a street-like visual metaphor that people might better understand due to its real-life character. The graph data is artificially generated and a grid-based planar orthogonal graph drawing is created. An eye tracking study with 26 participants was conducted to investigate the visual scanning strategies of the participants while we explored three difficulty levels and two visual encodings as independent variables. Male and female participants showed slightly different eye movements in the sense that they differed in the fixation durations and saccade lengths but not in the overall scanning strategy. People who are considered experts show faster visual scanning strategies in the graph mazes compared to the node-link diagrams. For future work we plan to also include more visual features in the graph mazes to also show additional graph properties for vertices, edges, graph structures, paths, and the like, although this would make the graph mazes more visually complex. We also plan to visually encode arbitrary graphs (non-planar ones) into graph mazes, however, the clear street-like structure must be extended a lot to reach this goal while it is questionable whether those new graph visualizations can still be understood or not.