
Abstract
Keeping abreast of current trends, technologies, and best practices in visualization and data analysis is becoming increasingly difficult, especially for fledgling data scientists. In this paper, we propose
Introduction
Data science is still a nascent and emerging discipline, which makes it challenging for analysts to learn and keep up with new tools and techniques. There is already a dizzying array of libraries, such as Scikit-Learn, Pandas, and TensorFlow, and best practices and workflows change often. Furthermore, few standardized methods exist for data analysis: many times, the exact data transformations, computations, and analyses needed depends on the data, task, and user. This means that cookbook methods or simple templates are insufficient to teach fledgling analysts how to tackle realistic and ever-changing data science problems. 1
We present
The Lodestar system shows a sequence of analysis steps in the form of Python code cells (see Figure 1), like in a computational notebook interface (such as Jupyter notebook 2 ), but enables the user to initially select from and interact with self-contained code cells without having to write any code. The user merely selects which data-frame to analyze, and the system displays a ranked list of recommendations of analysis steps to be executed on that data. Each analysis step is represented by an interactive visualization in the notebook interface, giving the user insights into its output and behavior. Furthermore, users can view the corresponding code for any analysis step, and even export the resulting notebook from Lodestar, providing flexibility in how users learn from and interact with Lodestar’s analysis recommendations.
Lodestar provides recommendations for the user’s next analysis step based on the current state of the analysis and the dataset being analyzed. Recommended analysis steps and workflows are derived from two sources representing current best practices in data science: (1) existing data science tutorials from online academies and training materials (i.e. expert recommendations), and (2) common analysis patterns mined from a large corpus of publicly available Jupyter notebooks 3 (i.e. crowd recommendations). The code cells extracted from each source are manually curated, then programmatically clustered into synonymous analysis steps, and inserted into a large directed graph of connected cells representing common analysis workflows. The Lodestar recommendation engine can then identify and rank the most relevant analysis steps given the user’s current position in the graph.
We developed Lodestar using an iterative design process through three separate user studies. In the first study, we used early feedback from six novice data scientists to improve the interface design in a formative user study. Once we made improvements to the interface design, we asked three returning participants and seven new participants to evaluate the improved version of the interface in a summative user study. Our findings show that key Lodestar interactive features, such as automated recommendations, a visualization of the full analysis workflow, a code review pane for suggested analysis steps, and support for Jupyter Notebooks, provide significant value to those who are learning data science. Finally, in a third study, we invited three professional data scientists to evaluate Lodestar recommendations and its recommendation engine. This evaluation showed that Lodestar recommendations provide an easy way to explore data and analysis techniques.
In this work, we make the following contributions: (1) a recommendation system involving two sources of data analysis practice: crowd-based and expert-based; (2) a sandbox interface design integrating visualizations, interactions, and code to facilitate learning about new data analysis techniques; (3) results from formative study and a summative study evaluating the Lodestar interface; (4) results from a study evaluating Lodestar recommendations and recommender engine; and (5) a novel data analysis architecture that integrates a recommender system with an interactive interface. All our materials have been made available on OSF:
Motivating scenario
Chewie is a recently retired journalist, and is hoping to devote his retirement to his true passion: traveling the world. He owns a condo in a nice downtown area, and is now trying to decide whether selling or subletting his house is the better choice given the changing market. What will yield him the most funds to travel in the long run? Unfortunately, while Chewie has long experience finding the facts, he has no training in data science or temporal forecasting. He turns to Lodestar for help.
Chewie talks to his realtor, who is able to quickly get him a dataset of recently sold homes in the neighborhood. The resulting CSV file contains approximately 500 homes sold in the last 5 years, including the price, address, square footage, date sold, the income of the house owners, and school statistics. The realtor also provides him with another dataset of 1000 rentals in the city for the last 10 years, including monthly rent, address, size, and year.
Chewie first creates a Lodestar notebook and loads the 500 sold houses. The first few recommendations include several descriptive statistics that give an overview of the dataset. He chooses
Satisfied, he creates a new Lodestar notebook and repeats the process for the rental dataset. Again, the parameters of his house will yield him a suggested rent—$1200 per month – as well as its market increase over the 5 years. He takes his figure and manually deducts his monthly mortgage payment, and realizes that his rental income over those 5 years will be close to $5000 more than selling the condo now. His decision made, Chewie contacts his realtor and tells him to list the condo for rent, and then turns to planning his escape to warmer clime.
Background
Lodestar was architected to encourage best practices in sensemaking. Richard Hamming described sensemaking as “the process of searching for a representation and encoding data in that representation to answer task-specific questions.” 4 Dubbed the sensemaking loop, 5 each sensemaking iteration works to refine and build on the previous insights – ultimately enabling the analyst to address less specialized audiences.
In combination, these iterations make up the data science workflow. Analysts often use visualizations or other types of intermediate results to guide further analysis. However, these results can sometimes be dead ends. Kandel et al. 6 found that analysts will commonly overcome dead ends by backtracking and exploring new branches.
Interactive visualization design environments
Many visualization systems and toolkits are designed around specific data analysis tasks, making the analysis process easier to perform. Excel supports basic visualization and data transformations. Shelf-based visualization environments such as Tableau (née Polaris 7 ) allow easy configuration of visualizations through drag-and-drop of data attributes and metadata onto “shelves” representing visual channels. This approach is flexible enough for even novice users to construct a wide range of visualizations. Interactive visual design environments such as Lyra, 8 iVoLVER, 9 and iVisDesigner 10 utilize direct manipulation to allow users to bind data to visual representations. More recently, Data-Driven Guides, 11 Data Illustrator, 12 DataInk, 13 and Charticulator 14 provide advanced tools for representing data items as visual elements and mapping their attributes to data dimensions. Keshif, 15 a faceted visualization tool, generates grids of predefined charts to support visual exploration by novices. ExPlates 16 uses fluid drag-and-drop interaction to support spatialized data analysis.
Visualization development toolkits such as D3 17 and Protovis 18 provide fine-grained control over designing interactive visualizations, but require significant programing expertise to use. Visualization grammars, such as ggplot2, 19 Vega, 20 and Vega-Lite, 21 abstract away implementation details, but still require programing knowledge to use. Furthermore, even advanced visualization tools, toolkits, and grammars offer only limited functionality for manipulating the data, and only support a small number of statistical functions.
Visualization recommendation
The purpose of visualization recommendation is to suggest relevant visualizations to the user to facilitate data analysis 22 where the visualizations are fully designed in advance and therefore directly accessible to the user. It was first proposed by Mackinlay 23 in 1986 with automatic design of effective presentations based on input data. The work combines expressiveness and effectiveness criteria from studies such as those by Bertin 24 and Cleveland and McGill. 25 to recommend appropriate visualizations. In 2007, Tableau’s Show Me feature 26 revealed a commercial product with the implementation of these ideas. Following the idea of Mackinlay’s automatic visualization, Roth et al. 27 enhances user-oriented design by completing and retrieving partial design graphics based on their appearance and data contents. The rank-by-feature framework 28 ranks histograms, scatterplots, and boxplots over 1D or 2D projections to find important features in multidimensional data. SeeDB 29 generates all possible visualizations given a query and identifies the interesting ones. Perry et al. 30 as well as van den Elzen and van Wijk 31 propose generating small multiple visualizations shown as thumbnails using summary statistics.
In the last few years, recommender systems have become widely used for visualization. Voyager 32 generates a large number of visualizations given a user-specified partial specification, and organizes them by data attributes. The generated visualizations are rendered as cards on a scrolling view. Saket et al. 33 propose the Visualization-by-Demonstration framework, which allows users to provide incremental changes to the visual representation. The system recommends potential transformations such as data mapping, axes, and view specification transformations. Zenvisage 34 automatically identifies and recommends desired visualizations from a large dataset. Voyager 2 35 extended the original Voyager through wildcard functionality that explores all possible combinations of attributes. Draco 36 automates visualization design itself using partial specifications and a database of design knowledge expressed as constraints. VizML learns what visualizations to recommend by training neural network models on millions of visualization designs made using Plotly. 37 Similarly, Qian et al. 38 uses learning-based approaches to generate relevant visualizations based on data. Most recently, and uniquely, Solas 39 learns to provide visualization recommendations using a user’s analysis history.
Several tools extend these ideas to recommending analytical insights and data processing steps. “Top-K insights”
40
provides a theory for generating top
Our proposed Lodestar system combines these ideas from visualization recommendation with an analytical perspective, and allows stringing together such analytical steps into a sequence. There are some existing efforts on recommending data analysis techniques and workflows. Yan and He. 44 demonstrate that online repositories of computational notebooks can be a valuable resource for modeling and testing a recommendation system for data cleaning techniques. Bar El et al. 45 take this a step further by automatically generating entire data exploratory workflows using deep reinforcement learning techniques. Our system builds on these works by presenting a holistic model and code mining pipeline for deriving new recommendation features in a data-driven way, whether for data visualization, data preparation, or data analysis workflows. Essentially, Lodestar extends the idea of automated recommendations to the entire data science pipeline, rather than visualizations only.
Interactive notebooks
Donald Knuth’s notion of a “literate” form of programing, 46 which merges source code with natural language and multimedia, has extended to the concept of literate computing in the form of computational notebooks, 2 that combine executable code, its output, and media objects in a single document. This has proven to be very useful for rapid prototyping and exploration as well as for replicability and communication in data science. 3
Because of their success, with adoption even at the level of entire organizations, 47 notebooks have enjoyed significant progress in recent years. The new generation of computational notebooks, such as Google Colaboratory and Codestrates, 48 enable synchronous collaboration. The JavaScript-based Observable notebook also supports reactive execution flows.
Visualization in particular has recently begun to adopt computational notebooks. Altair 49 builds on Vega 20 and Vega-Lite 21 to provide statistical visualizations in Python, and thus in Jupyter Notebooks as well. Idyll 50 supports a notebook-like markup language to create interactive data-driven document for communication. Vistrates 51 provides a collaborative visualization workflow in a notebook. Observable leverages computational notebooks to also provide a collaborative visualization platform. Literate visualization 52 integrates the visualization design process with the choices that led to the implementation.
End-user and live programing paradigms have proven useful in creating intuitive interactions with visualizations found in computational notebooks. For example, Wrex 53 and Mage 54 leverage user interactions on data visualizations to automatically generate exemplar code. Both tools demonstrate the link between code and visual interactions. Torii 55 uses a live programing model to enable easy maintenance and reuse of source code for building tutorials. These systems not only add to the number of ways users can interact with their literate document, but also connect code and visualization so as to facilitate iterative analysis.
Design Requirements: Formative Study
Our goal is to make Lodestar an interactive and visual sandbox environment for learning and experimenting with new data science methods in a data-driven way. We also wanted to make data science universally accessible to fledgling data analysts and enthusiasts alike. These core ideas helped us compile a set of design requirements and some preliminary prototypes. In this section, we outline our major design requirements, and report on a formative study conducted to validate and refine our approach to the Lodestar interface design and system development processes.
We conducted a formative user study to evaluate the usability of an early prototype of the Lodestar system, which we used to validate our initial design requirements and refine the design. Questions posed to the participants in the formative study protocol can be found in the supplemental material.
While we refer to Lodestar as a computational notebook, we note that building a fully-fledged notebook system from scratch is a vast engineering effort. Our goal in this research project was to focus on novel aspects of recommendation for data science and visualization, so our resulting notebook lacks significant features normally associated with such systems.
Study Design
The study was conducted over a period of 1 month in which we interviewed six fledgling analysts and data scientists; all undergraduate university students. We focused on recruiting university students, since they are generally learning data science methods for the first time and thus could provide helpful insights in our design process. Each student had demonstrated knowledge of data science fundamentals through attending a university-level introductory data science course and/or other relevant machine learning/data science experience. Although not a prerequisite of the recruitment process, some students also had experience performing analysis on platforms such as Excel and Tableau.
Method
Each interview lasted for 60 min and was divided into three phases. Prior to the interview, each participant signed a consent form, allowing us to record audio and screen capture throughout the duration of the interview. The first phase consisted of questions, delivered verbally, that assessed the participant’s recent experience in learning data science techniques and tools through classes, side projects, research, and other such activities.
The second phase of the interview was dedicated to introducing an early prototype of the Lodestar system in which participants were given a brief 2-min description of Lodestar and associated goals. The next 5 min were spent giving the participant a cursory tutorial of the system. For each participant, the tutorial was given using a pre-written script and with the same sample dataset to give each of them equal knowledge of the system prior to their exploration. The participants then spent the next 15–20 min using the Lodestar system to conduct exploratory data analysis on a dataset of their choosing. We restricted their choices to two datasets; the Boston House dataset from a Udacity tutorial and the Cars dataset (The Udacity tutorial is available here: https://github.com/sajal2692/data-science-portfolio/blob/master/boston_housing/boston_housing.ipynb). During this exploratory session, participants verbalized their thought process, questions, and comments with a think-aloud protocol. We encouraged participants to “to use any and all features of the Lodestar system” and to “explore whatever aspects of the data [they found] interesting.” Participants were allowed to end the session before the allotted time expired if they were satisfied with their results.
The third and final phase of the interview consisted of a post-exploration questionnaire that asked participants to describe the utility of Lodestar for their common data analysis tasks. Participants were specifically asked if they would adopt Lodestar to learn new data science techniques.
All sessions were held in a lab environment using Google Chrome on a Macbook Pro with a 15-inch Retina display. Audio was recorded using the built-in voice recording application on a mobile device. Screen capture was done using Apple’s QuickTime Player. Observational notes from the study coordinators, text responses from our questionnaires, and audio and video recordings were collected for further analysis and prioritization of design requirements and functional features of the existing prototype. We used the the participant responses from the think-aloud and questionnaire portion of the study to illustrate the themes with respect to the Lodestar enhancements.
Results
Our formative study found that a majority of participants were in favor of using Lodestar in their daily work, but suggested several modifications to make the system more useful. For the sake of brevity, we focus primarily on summarizing their constructive feedback below (participant IDs start with “FP”):
There were many questions specific to the meaning of recommendations. For example, FP3 said “I think the names [are] misleading... there were some really complicated names for just a simple linear regression. [It] should just be changed [to more] obvious names.” Similarly, FP2 suggested that there should be “a longer description [...] [or] some way to show their effectiveness without the user having to Google search them.” These misconceptions indicate that better documentation is needed to help new users understand the interface.
Further refinement of Lodestar
Though participants could see promise in providing automated recommendations (design requirement
These points of feedback served as motivation for additional iteration on the Lodestar feature design. Specific features that were added as a result of this study included the ability to export the user’s notebook to an .ipynb file for use outside of the system, a visual tracker that displays the progress of the user’s analysis in each output cell, showing which recommendations have been chosen so far, and descriptive tool-tips of the different analysis techniques in each output cell.
The Lodestar system
System overview
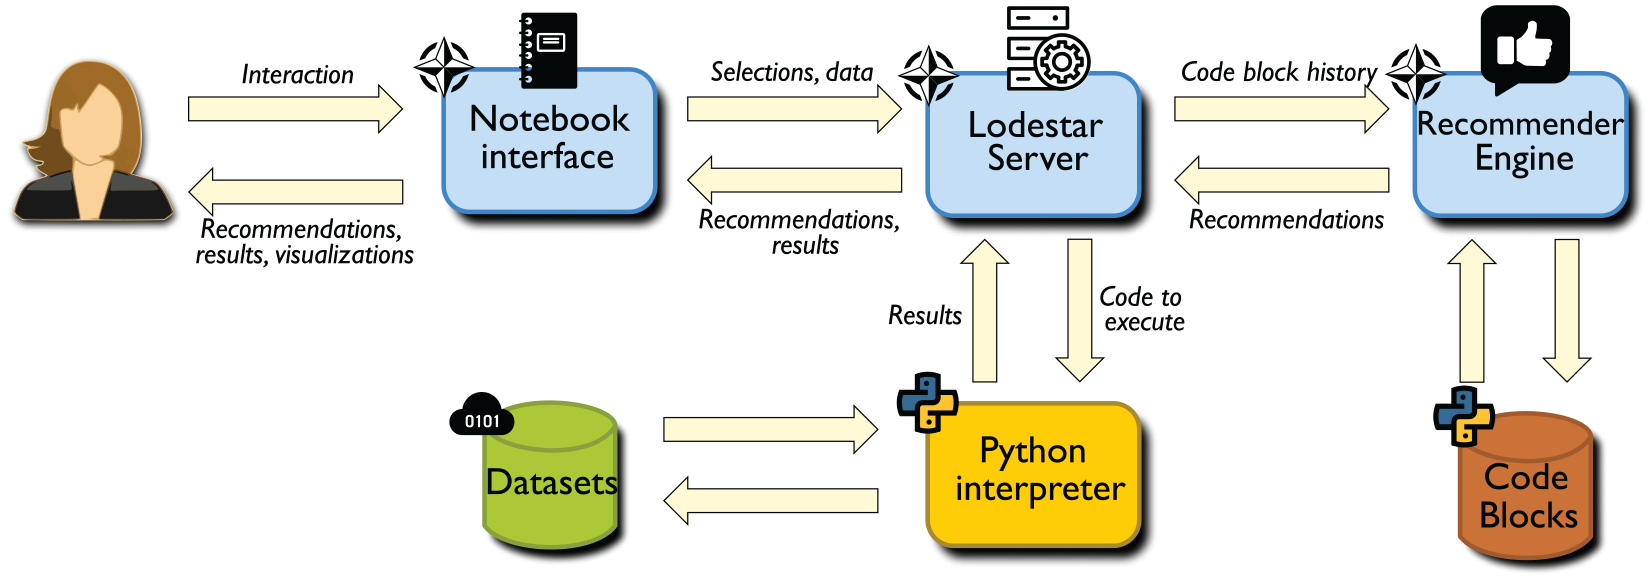
Lodestar consists of four main components, shown in Figure 2: a browser-based notebook interface, an interactive computing protocol, a recommendation engine to suggest analysis steps, and a server-side kernel to execute analysis steps. The protocol manages communication between the client and server (commands as well as computational results), and the kernel on the server side runs each analysis step that the user selects using an interpreter. The Flask server handles all of the client requests for data processing, analysis, and recommendations, with different endpoints.
Lodestar emphasizes an iterative workflow design where analysis steps are added progressively, one at a time, providing fine-grained control to the user (D3). To help users focus more on analysis steps and best practices (D1, D2) rather than low-level code, Lodestar allows the user to rapidly choose from a list of recommended analysis steps. These recommendations are displayed in the form of buttons, so a user can easily select and execute an analysis step of interest with a single click. Furthermore, these recommendations are mined from recent Python tutorials and active GitHub repositories of Jupyter Notebooks, enabling the user to construct new analysis workflows based on best practices in a data-driven way.
Notebook Interface
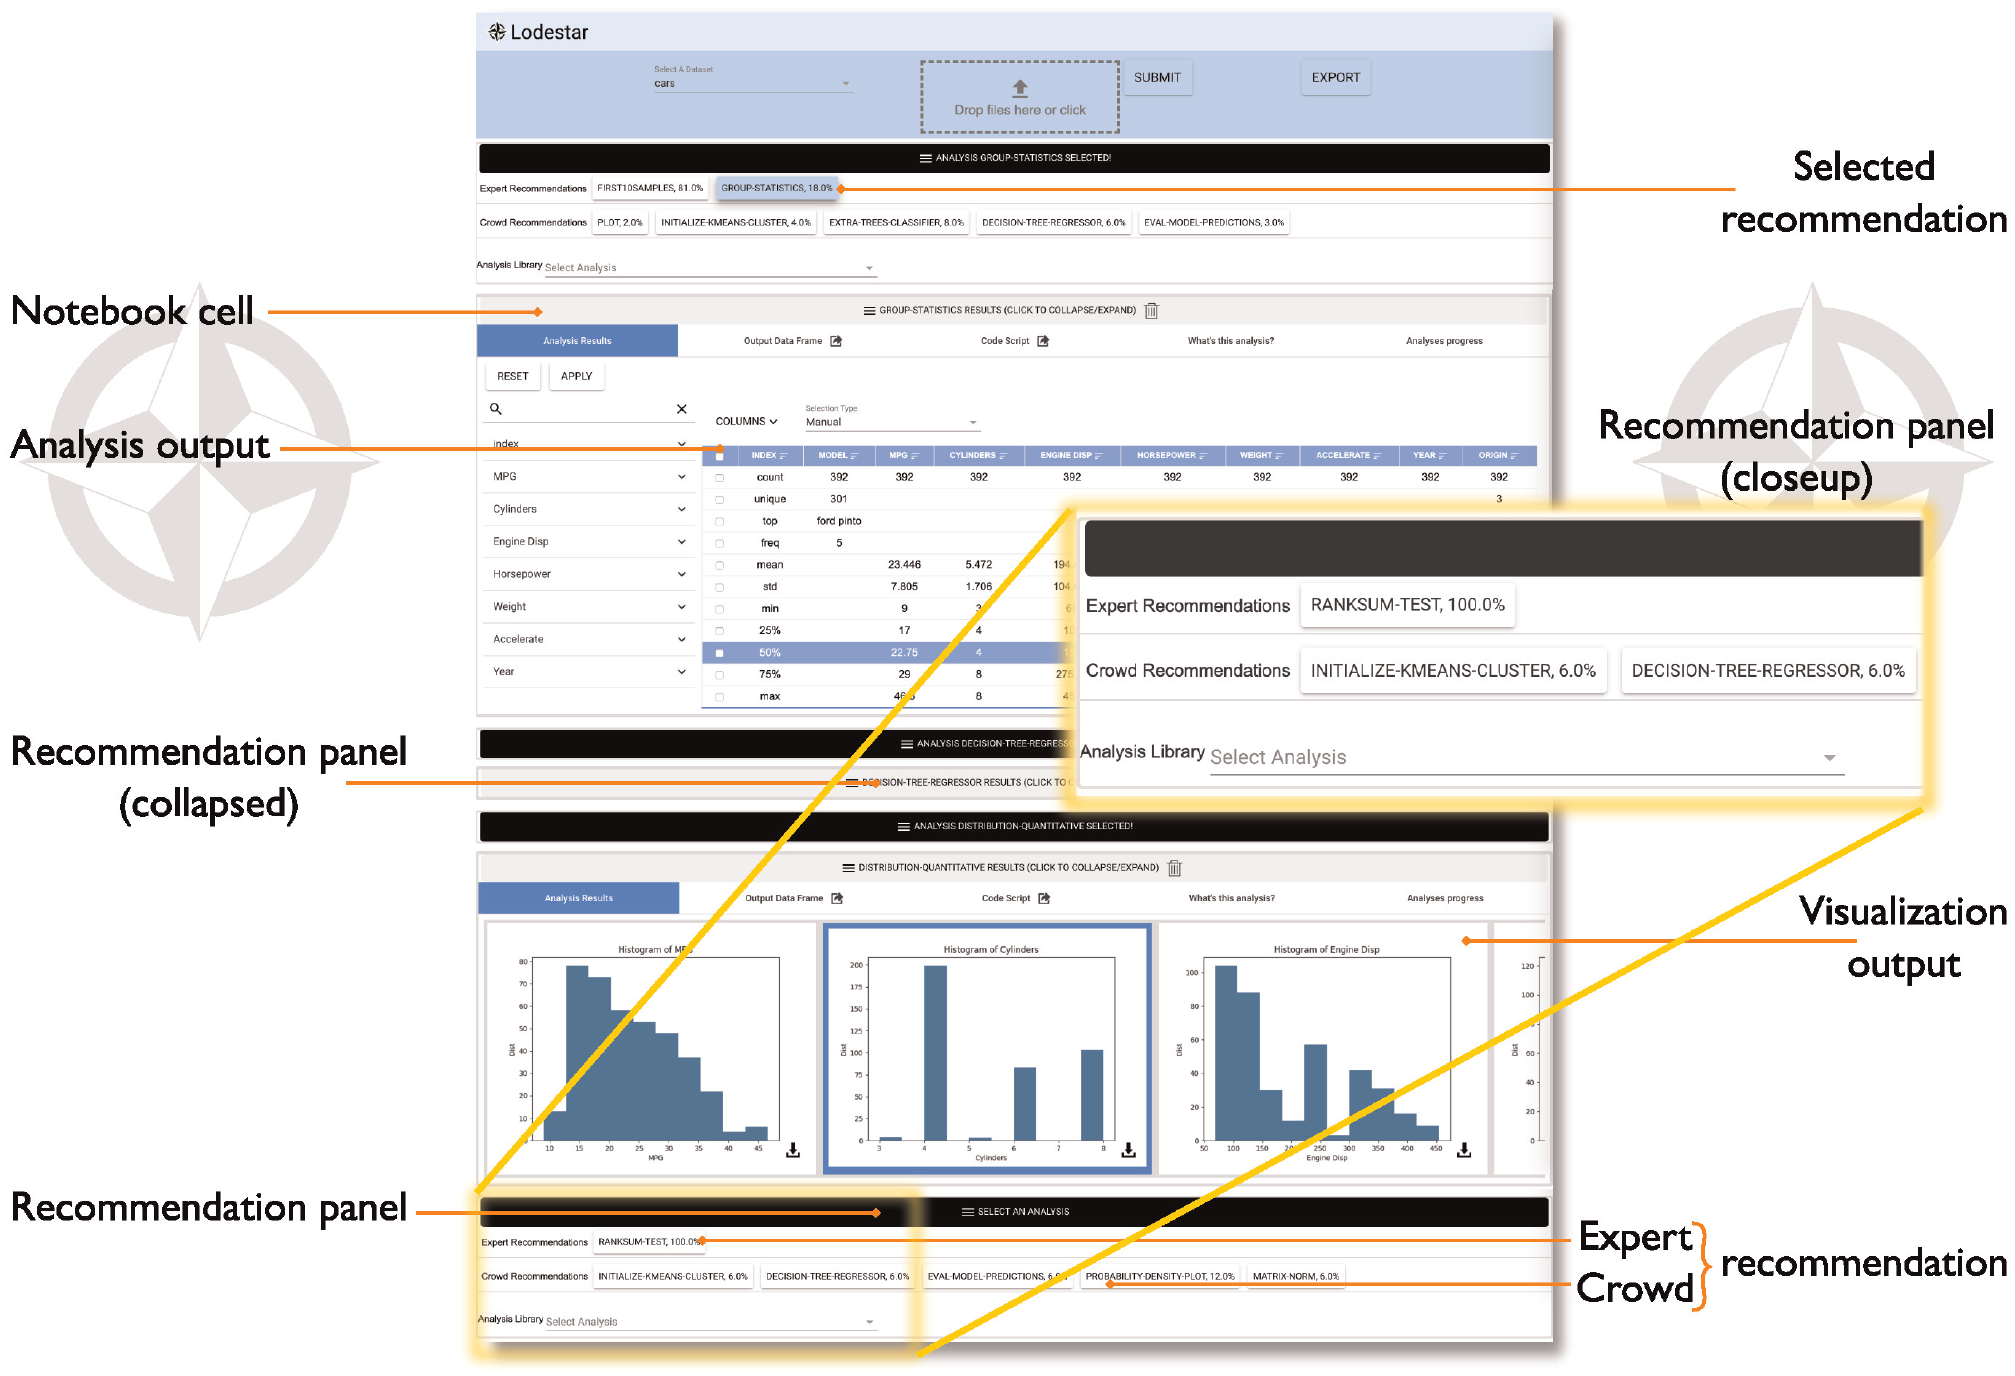
The Lodestar interface (shown in Figure 1) is an interactive notebook providing a literate computing environment 46 that runs in a web browser on the client. Similar to existing computational notebooks, the Lodestar notebook is a linear document that the user can selectively edit and execute. The interface contains three major components: a menu panel at the top, one or more notebook cells, and recommendation panels for each cell. The notebook cells and recommendation panels dynamically appear and update within the notebook interface in response to user interactions.
The user begins their analysis using the menu panel to load an existing dataset or a new dataset (in CSV format) into the system. Once a dataset has been loaded, Lodestar generates a recommendation panel within the notebook interface, providing the user with an initial set of recommended analysis steps. We refer to the actual code behind each analysis step as an analysis block, and the displayed result of executing the analysis step as a notebook cell. From this point onward, the analysis process forms a cycle that repeats until the user is satisfied with their new workflow:
The user
The kernel
The notebook
The notebook
When the user is ready to migrate their workflow to a complementary tool, for example to iterate on the code directly within a code editor, they can export the Lodestar workflow as a Jupyter notebook file.
Recommendation panel
Every notebook cell in the Lodestar interface has an accompanying recommendation panel, allowing the user to extend their latest analysis step by one cell. When the user selects an analysis step from a recommendation panel, a new notebook cell is generated for the selected recommendation, along with a new recommendation panel underneath. Lodestar uses the output of the preceding notebook cell as the input for executing any analysis step selected in this recommendation panel. Each panel provides two sets of recommendations, one from a crowd advisor and one from an expert advisor. The crowd advisor sources recommendations from online data analysis repositories such as GitHub. The expert advisor sources recommendations from educational resources such as textbooks, online classes or online tutorials. Crowd and expert advice are presented separately as a way to highlight a data point the user can take into consideration while choosing a recommendation. We believe that this type of transparency betters independent exploration (design requirement D3).
If a user is unsatisfied with a given set of recommendations, they can choose from Lodestar’s full catalog of analysis steps in a drop-down menu at the bottom of each recommendation panel. This list is available in the supplementary materials.
Notebook cell
Once a selection is made in a recommendation panel, the selected analysis step is highlighted and the results are displayed in a new notebook cell, allowing the user to review their past selections and the corresponding results with each subsequent step. Furthermore, the user is able to go back and update the results at any time by selecting a different analysis step in any of the previous recommendation panels. Any cell can also be deleted, which triggers the removal of all downstream cells that depend on the deleted cell. In this way, Lodestar maintains a linear structure in the notebook, making it easier for users to navigate within the analysis.
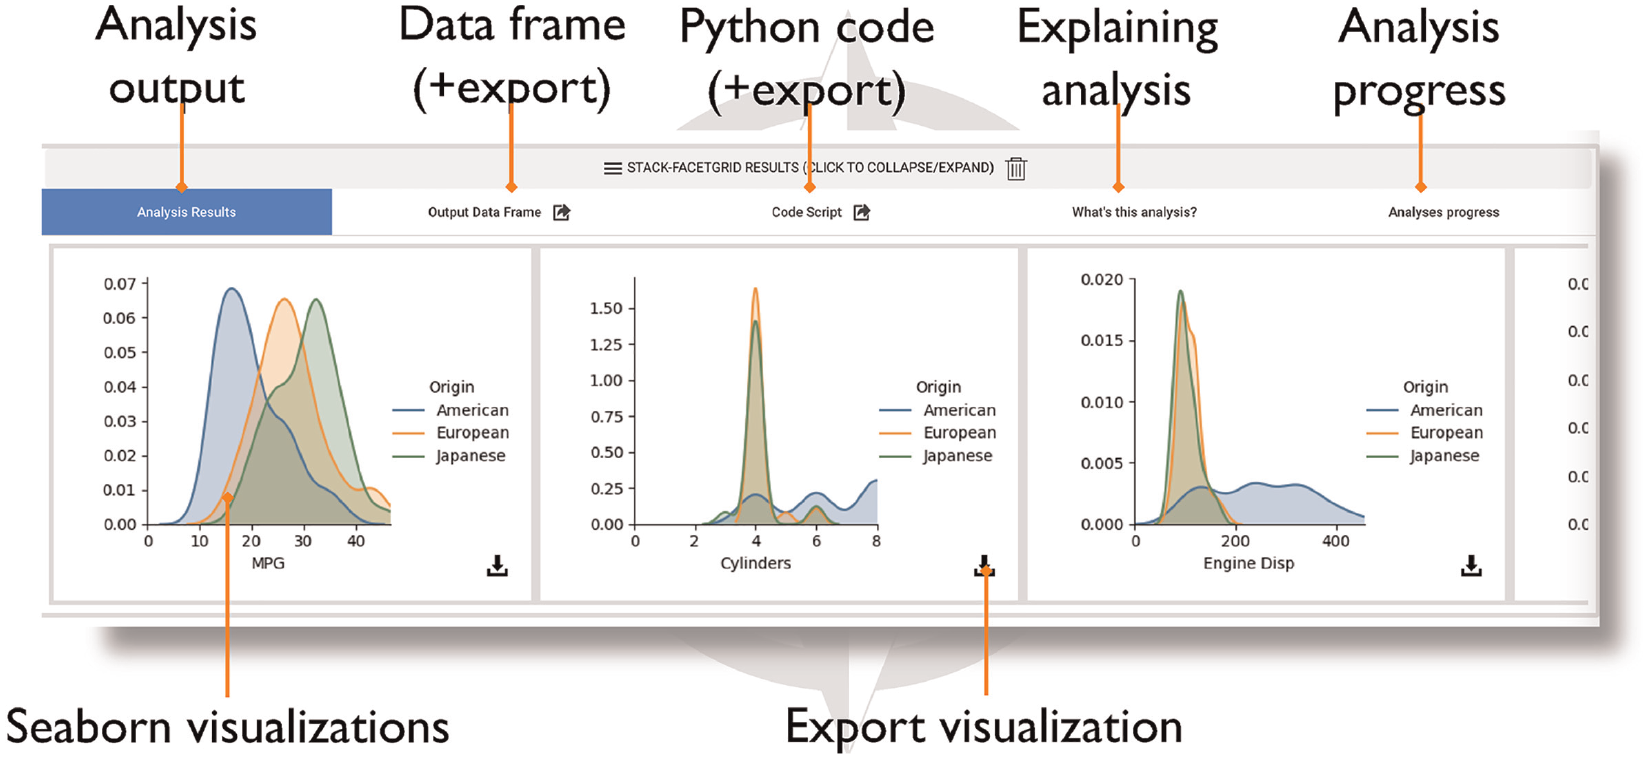
To help users understand the functionality of each recommended analysis step and its purpose within the context of the larger data science process, notebook cells consist of five tabs (Figure 3). Each tab describes the behavior of the analysis block represented by this notebook cell. We refined the design of each tab based on the feedback we received from the formative study:
Exporting code and results
When the user is ready to migrate their analysis workflow to a related tool, they can export content directly from Lodestar. To export the code for a specific analysis step into an independent Jupyter notebook file, the user can click on the export button next to the Code Script tab of the corresponding cell. To export the entire analysis workflow, the user can click on the export button on the menu panel at the top of the interface. Similarly, Lodestar enables users to export the output data of any displayed notebook cell as a CSV file. To do this, the user clicks on the export button next to the Output Data Frame tab. The user can also download the visualizations displayed in any notebook cell as PNG files.
Advisors and recommendations
The Lodestar recommendation engine is based on the notion of an advisor: a source of analysis recommendations. Lodestar supports multiple advisors, each consisting of a library of analysis steps and a set of advisor-recommended transitions between analysis steps (i.e. a recommendation graph). In our current implementation, we use two advisors: a “crowd” advisor drawn from our semi-automatic code analysis, and an “expert” advisor drawn from the manual code curation. For each advisor, the recommendation panel will show a list of up to five recommendations, ordered by probability, or how frequently this analysis came next in the recommendation graph.
In this section, we describe how we build our recommendation graphs for the expert and crowd advisors, and how we enable Lodestar to identify equivalent or related states across both graphs.
Recommendation graph
Lodestar models transitions between analysis steps by treating analysis workflows (e.g. existing tutorials or computational notebooks) as paths taken through a network graph. Each node in the graph is an analysis step, and a directed edge appears in the graph for each pair of consecutive analysis steps observed in a workflow. Lodestar leverages the relative frequency of these transitions to predict which analysis steps are likely to occur next. The particular graph structure used in Lodestar is a Markov chain, and the final computed graph we refer to as a recommendation graph. We believe this to be a good initial step toward modeling analytical decisions but, acknowledge that more complex factors influence their construction. We hope to explore this further in future work.
Lodestar traverses the recommendation graph one state at a time for each user input (i.e. choice of analysis step). As a result, our recommendation approach does not require maintaining specific state about the analysis itself. Instead, the location in the Markov chain serves as state, and transitions (e.g. recommendations) thus depend only on the current state. In this way, recommendations are agnostic of the data being analyzed, thus allowing users to draw from a wider range of tools and techniques (D3).
We can infer these recommendation graphs programmatically by mining analysis blocks (i.e. code snippets) from existing computational notebooks. In this case, the analysis blocks are used as the graph states, in place of their corresponding analysis steps. Figure 4 shows the general approach for mining analysis blocks into this recommendation graph. We extract the analysis blocks from existing computational notebooks and recover the transitions between states from the sequences observed in each notebook, with the weights signifying the frequency of observed transitions. Analysis blocks become nodes
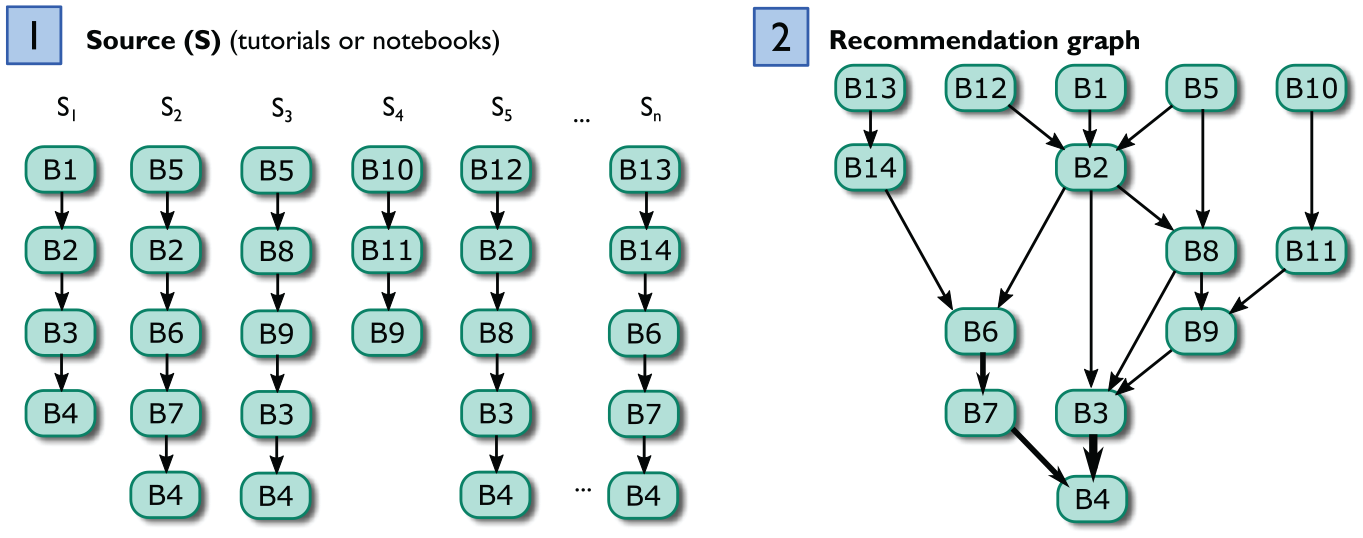
To infer the full recommendation graph, we first construct a separate Markov chain for each notebook (or tutorial) identified as a source for our advisors. Specifically, we model each notebook as a Markov chain with one state per block and the transition probability to move from block
We can then merge the resulting sequences into a single graph (e.g. merging
Specifically, the transition probability
Extracting analysis blocks for the expert advisor
We extracted analysis blocks for our expert advisor from online tutorials (Our supplemental materials includes a detailed report of the full process for extracting and curating analysis block s for the expert advisor :
While there exist many data science resources online, their focus and depth vary widely, from simple hands-on learning for beginners to expert-level guides on deep learning, sensitivity analysis, and model building and tuning. As a rule, we picked guides focused on teaching a specific analysis task (D2). We narrowed our search to end-to-end data science examples, which provide concrete sequences of analysis steps along the data science pipeline. Specifically, we selected examples that have an explicit purpose for the data analysis, step-by-step explanations and results, and runnable code. These requirements helped to ensure that the extracted analysis blocks will have similar types of functionality and were high-quality.
Formatting analysis blocks for the expert advisor
To ensure that the extracted analysis blocks are executable in Lodestar, we also apply a separate code curation process. From our experience, each source has a specific analysis goal, and the blocks across different sources may use different libraries, data attributes, and variables to achieve it. For example, a tutorial using the Boston housing dataset, may generate a scatter to examine a linear relationship between four housing attributes, while in a school test-scores dataset it only makes sense to examine a linear relationship in between two attributes. This is useful nuance for manual analysis, but cannot be directly used in a generic data analysis system such as Lodestar. In other words, the analysis blocks must be curated – typically generalized – to be applicable across multiple applications.
The block curation process is idiosyncratic, but consists of the following steps: (1) adding missing dependencies, (2) replacing data-specific labels and attributes, (3) setting appropriate default parameters, and (4) generalizing code to operate on general data frames and output data frames too. This process is very similar to our curation strategy for recommendations from our “crowd” advisor. We manually compared new blocks to exiting blocks within the library, to ensure there were no duplicates. Upon completion of the curation process, each new analysis block is added to the library for the recommendation graph.
Managing analysis blocks for the crowd advisor
We extracted analysis blocks for our crowd advisor from a corpus of approximately 6000 Jupyter notebooks, originally collected by Rule et al. 3 We filtered out notebooks that did not contain import statements and API calls using common data science libraries, such as Numpy, Scikit-Learn, or Pandas. We first partition each notebook into discrete analysis blocks. For Jupyter notebooks, the code is often already partitioned by the notebook authors through the use of Jupyter notebook code cells. Our straightforward approach is to identify existing cells in the Jupyter notebook corpus as separate analysis blocks for Lodestar. Please see our supplemental materials for a detailed report on our full process for extracting and curating analysis blocks for the crowd advisor.
Our key insight for this process is that similar data analysis steps often use similar API calls in the code. For example, notebooks that leverage sklearn.linear_ model to build a linear regression model using the LinearRegression() module could be characterized as performing the same analytical step. Using this idea, we construct a term vector to represent each analysis block, where the vector represents the normalized frequency of each API call that appears within the block. Each cell in the vector represents a unique API call observed in any notebook in the dataset, allowing the vectors for the block to be compared with any other block.
We use these term vectors to cluster the analysis blocks. Specifically, the normalized vectors are passed to a
Of the 200 representatives (one for each cluster), we ultimately selected 22 blocks as a starting set for the Lodestar library. For any given cluster, Lodestar needs a way of recommending a single analysis block to users. We use code-line count as a heuristic to pick a representative analysis blockfrom each cluster. Specifically, we pick the blocks which have a median number of lines relative to all other blocks within a cluster. We posit that this will yield the “average” code unit.
Blocks for both the crowd and expert advisors are formatted to follow the same consistent structure assumed by the Lodestar system. We format each analysis block to be a Python function, include necessary imports, convert the function’s input and output to a data frame, and remove print statements and irrelevant comments.
Identifying synonymous states across advisors
Of course, managing multiple advisors means that the system must track the state of the analysis in the recommendation graph for all advisors when the user selects a recommendation from a specific advisor. Our current solution uses a multi-level tagging mechanism where each block is manually tagged given its functionality; for example, a decision tree block could be tagged with train-model and test-model. Tags correspond to steps in the data analysis workflow. We developed an understanding of these steps using previous studies.44,59,60 Much like Yan and He,
44
we cast particular Python APIs to specific analysis steps. For example, Pandas dropna function was cast as a data-cleaning operation since dropping empty elements is a common way to clean data. Our tags include:
In tagging analysis in this way, we allow for matching the new state of the specific advisor, chosen by the user, to relevant states in the other advisors. More specifically, if the user chooses a recommendation from the expert advisor that suggests running a specific decision tree block, the Lodestar engine will advance the crowd advisor to a state in its recommendation graph that corresponds to the
The same functionality is used when the user eschews all of the recommendations and instead selects directly from the library through the drop-down box in the recommendation panel. In this case, all of the advisor models will be advanced to the appropriate state matching the block that the user executed. This allows the user to iterate on techniques unhindered by a guided system.
Summative evaluation
We conducted a second user study to evaluate the improvements we made to Lodestar after receiving formative feedback from the first user study. While the formative study evaluated the usability of the early prototype, this summative study evaluated the viability of Lodestar for learning data science practices.
The summative study was conducted over a period of 1 month. We interviewed 10 fledgling data scientists. Seven of these participants were new to Lodestar and three were part of our formative study. All participants were undergraduate university students who demonstrated knowledge of data science fundamentals through a university-level introductory course or other relevant experiences. Again, some students had experience with performing analysis on platforms like Excel and Tableau, but this was not a prerequisite for the recruitment process. Similar to the formative study, we chose undergraduate students for our user study population because they were learning data science principles for the first time. This study was approved by our home institution’s IRB.
Method
Each interview lasted for 60 min and was divided into four phases. Unlike the formative study, this study was conducted exclusively online with video conferencing software. Prior to the interview, each participant gave us explicit consent to record audio and screen capture throughout the duration of the interview.
In our formative study, participants did not use Lodestar before completing the data exploration task, making it difficult to tease apart design challenges with the Lodestar prototype from a lack of user training. As a result, we included a separate training session where participants were given an overview of system features and then trained to use the system with an initial demo dataset. The training session was then followed by a think-aloud data exploration session that lasted for 15–20 min. Questions posed in the formative study can be found in the supplement. Afterward, participants were asked to verbally respond to a post-exploration questionnaire that assessed their view on the viability of the system. Questions included:
What do you like about Lodestar? What do you dislike? Why?
Would you use Lodestar outside of this study? Why/why not?
If so, in what situations could you see yourself using Lodestar?
We analyzed participant responses from the think-aloud and questionnaire portion for themes regarding the usability of Lodestar. We present the participants’ quotes which represent common themes.
Results
Here, we summarize both the strengths of our design as well as opportunities for future improvements as noted by participants. Identifiers for new participants begin with “N,” whereas returning participants have the same identifiers as before.
Lodestar Strengths
Intuitive and Supportive UI Features. Many participants said that they found the (new) Lodestar interface design to be intuitive. For example, participant NP4 said they “liked [a lot] of the different UI features like the tooltips and collapsing [views].” Participant NP4 also liked that they were able to verify different analyses all on one page. FP2, FP3, and NP6 echoed this sentiment. Thus, the new learning widgets in Lodestar (e.g. tooltips and tabs) seem to help users learn how to use the interface and verify their work.
Integrates with existing tools and workflows
Participants particularly liked the ability to export their workflow as a Jupyter Notebook file for editing outside of Lodestar. For example, NP4 said they “like the integration with Jupyter Notebook and [the] exporting functionality.”
Eases data science tasks
NP3, NP4, FP2, and NP5 appreciated how Lodestar “recommends what to do with the data, and based on that result, [recommends] something else” (NP4). Overall, they found Lodestar helpful for guiding their analysis.
Lodestar also seemed to be helpful for specific data science tasks. For example, participants liked that Lodestar allowed them to quickly familiarize themselves with a particular dataset, which helped them determine what kinds of patterns or trends to analyze later on. This familiarization process is part of data profiling, an important and early task in the data science process. 6 Participants also valued the features in Lodestar for data exploration, for example participant FP3 said using Lodestar was “Really convenient to do exploratory data analysis.” Participant NP1 also stated that they would use Lodestar for “specific cases where [they] don’t know how to write the code.” Participant NP6 and FP1 shared similar sentiments. These findings suggest that Lodestar helps users more easily complete data science tasks without being hindered by low-level programing issues, and may help users learn how relevant code could be written for future data science projects.
Limitations
Customizing Visualization Outputs. Many participants wanted the ability to customize and choose what attributes of the data were used in generating visualizations. For example, participant FP2 said that “it would be nice to be able to set the parameters...” Thus, even finer-grained control over visualization (and interaction) designs in Lodestar would be a point of improvement.
Additional documentation
Some participants noted that providing more documentation of the features in Lodestar would be helpful when navigating the interface. For example, NP3 stated that it would be helpful if “you could have [some information] about what the data is, where [it] came from, what the columns are.” Thus, the Lodestar interface could be improved further to give users more context for the inputs to each analysis step.
Recommendation evaluation
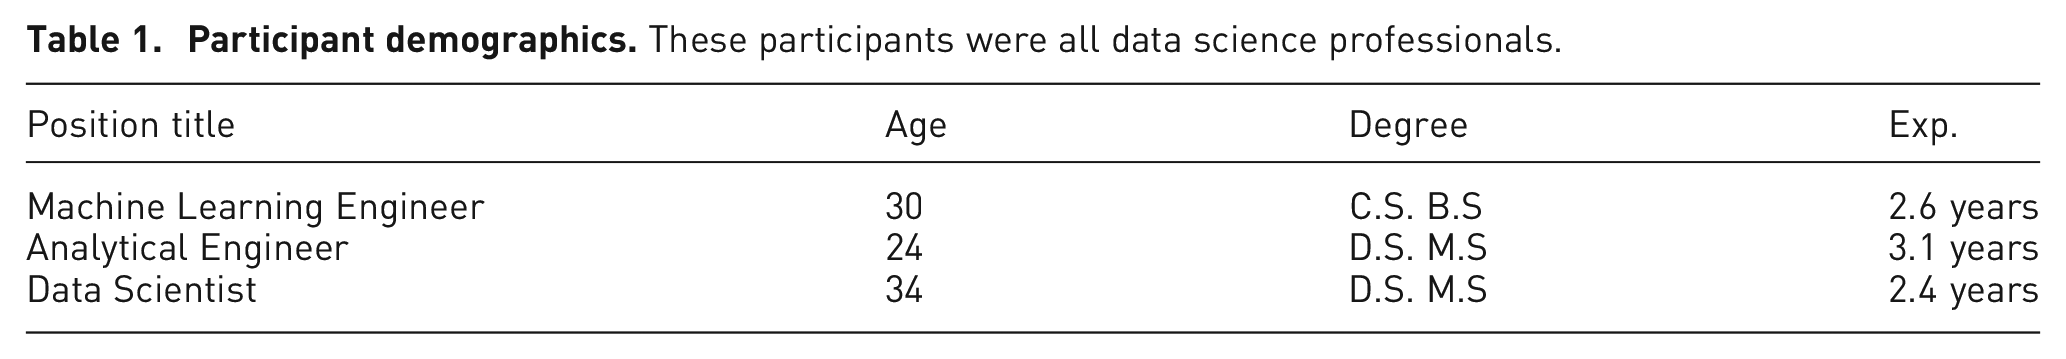
We conducted a third user study to evaluate the utility of Lodestar recommendations. We recruited three professional data scientists through a convenience sample of people within a professional network connected with the authors. Participant demographics can be found in Table 1. These professionals took part in an hour-long expert review 61 conducted using online videoconferencing. The interviewer initiated a video call with each participant and shared a screen with a running instance of Lodestar.
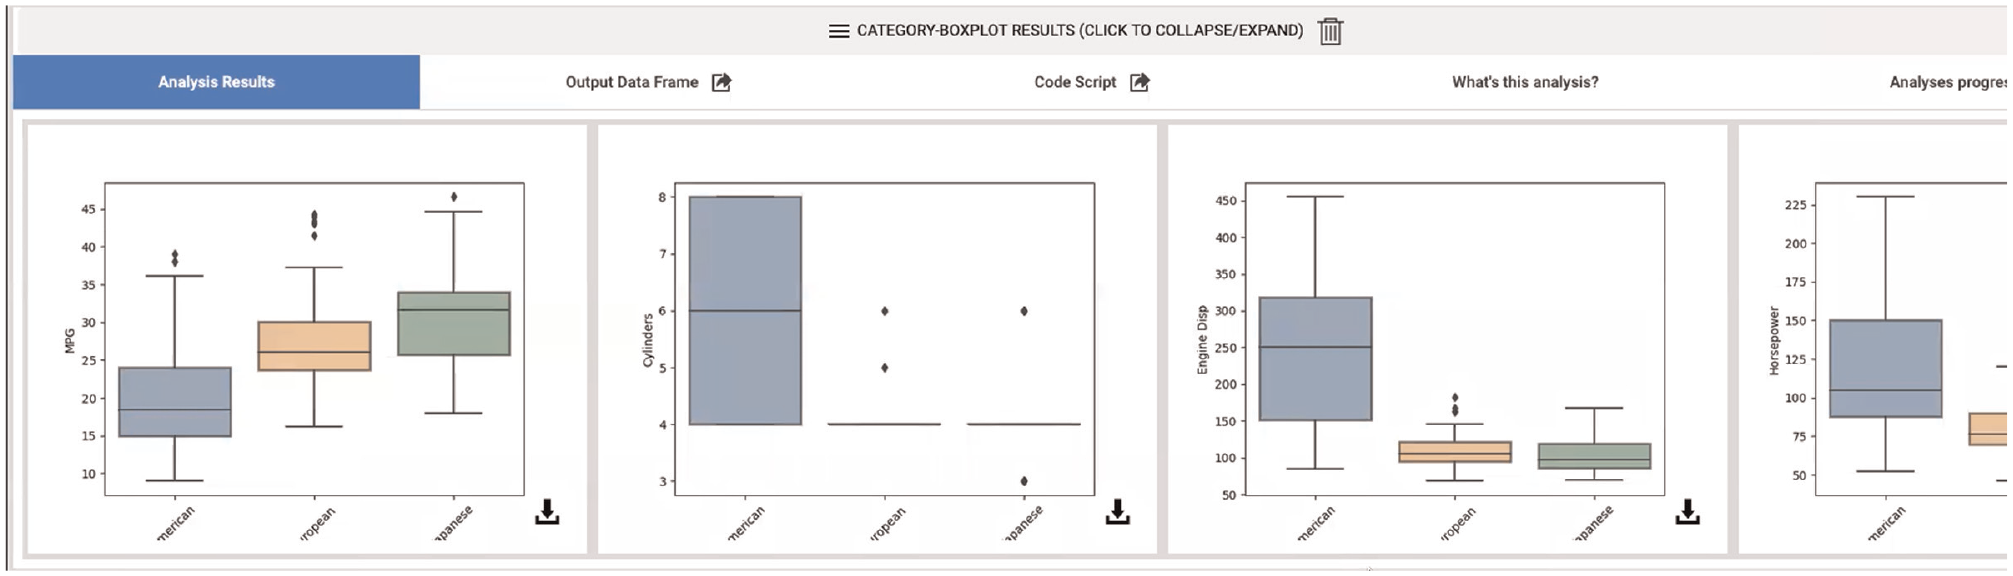
To start, participants were presented with two different analytical scenarios and asked to evaluate the strength of crowd and expert recommendations on behalf of an intern working within two scenarios. The first scenario proposed that an intern would be exploring the cars dataset and using Lodestar to understand the general trends. In the second scenario the intern would be trying to identify the factors which influence housing prices in the boston-housing dataset.
Participants were encouraged to remotely guide interactions with Lodestar recommendations and to build a data science workflow using Lodestar recommendations. At each step, after considering and choosing a recommendation, participants were asked to consider two questions:
Why have they chosen this crowd or expert recommendation?
Are the current crowd or expert recommendations appropriate for an intern performing the current task? Why or why not?
We adopted this protocol to ensure that participants have the flexibility to build an appropriate workflow for the objectives presented and the structure to provide feedback regarding a wide-array of analytical branches represented by the Markov recommender. Questions posed to the experts can be found in the supplement.
Results
We transcribed the verbal responses of each participant and coded their responses using the identifiers “crowd,”“expert,” and “workflow.” The crowd identifier classified reflections regarding crowd recommendations. The expert identified classified comments on expert recommendations. Finally, participants’ reflections on how the data science workflow was constructed and their interactions Lodestar were identified as comments regarding the workflow. We summarize the results of this analysis in this section. Identifiers for each professional participants begin with “P.”
Expert
All participants found that expert recommendations “were quite reasonable” (P1), and helpful for interns performing exploratory analysis as in the first scenario. Expert recommendations seemed to match expectations and act as a helpful guide for further analysis. P1 and P3 found the recommendations which visualized dataset attributes to be particularly helpful during exploration. For example, P1 said they found the “Category Distribution”recommendation “almost too perfect” (Figure 5).
While performing more directed analysis as part of the second scenario, participants found that expert recommendations were helpful during the beginning of the analysis. For example, P1 commented that “looking at the data as the first step makes sense.” However, P1 and P3 expressed a desire for more control over how the recommended techniques were being executed in order to dig deeper into data. All participants found the idea of exporting to a traditional notebook environment to be a useful next step in reaction to reaching the end of a Lodestar analytical track.
Crowd
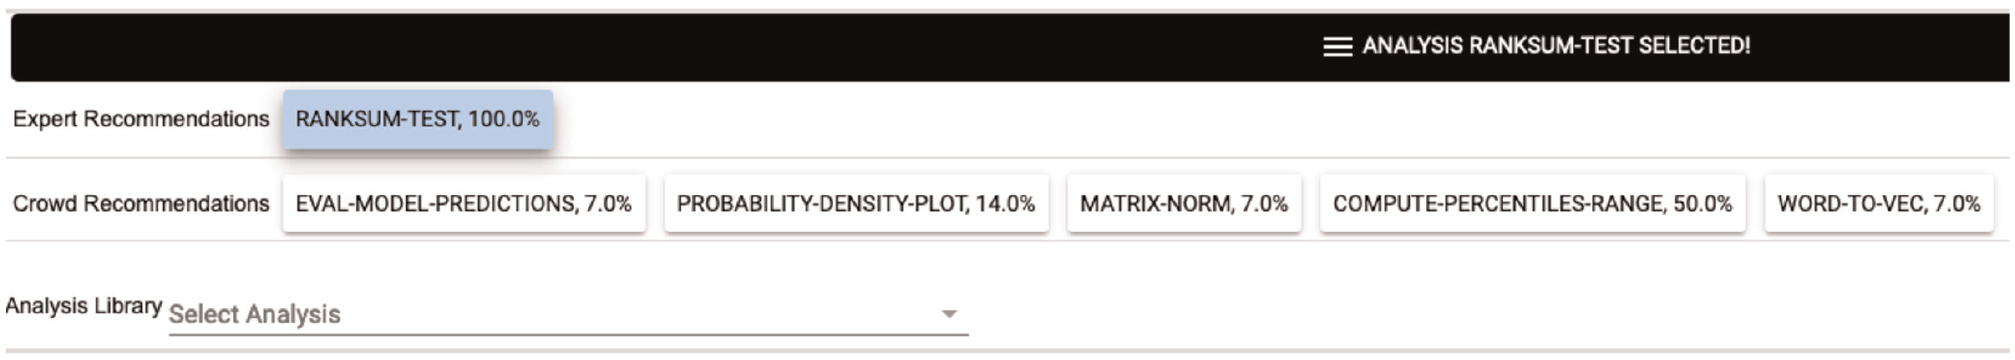
Participants found crowd recommendations overwhelming and unhelpful for exploratory tasks. The fact that the Lodestar displayed low confidence in the recommendations was a particularly strong deterrent for all three participants. For example, P2 said that “there is one [crowd recommendation] I might have wanted to click but... the probability looks really low. So, I’m not really sure how to interpret that” (Figure 6).
P1 and P2 found crowd recommendations equally unhelpful for the directed tasks of the second scenario. However, P3 felt that crowd recommendations could be occasionally helpful when expert techniques seem less varied. Unlike the other participants, P3 performed more than a handful of the advanced techniques suggested by the crowd: k-mean clustering, percentile range, and quantitative bar plots.
Workflow
Two participants found that expert and crowd recommendations were appropriately generated based on previous selections. However, these participants also found the data agnosticism of the recommendations to be confusing.
The system seem to the sufficiently transparent since all participants navigated to the “Code” tab in order to examine the programing details of each analytical step. However, P1 and P2 did not find the categorization of recommendations based on advisor (code source) to be helpful. Both P1 and P3 suggested categorizing recommendations in more ways to allow for better control over analytical goals. For example, P3 suggested separating recommendations geared toward visualizing a data attribute from recommendations which provide analytical support. This would be an interesting direction for our future work.
All three experts agreed that Lodestar recommendations would be helpful for novice users who were learning new analytical techniques and learning to program.
Summary
Participants found expert recommendations more appropriate for data exploration than crowd recommendations. This seems reasonable given that the tutorials we used to train our expert advisor were demonstrating exploratory data analysis. Participants generally found crowd recommendations difficult to trust and understand. However, P1 and P3 suggested that crowd recommendations occasionally supported directed analysis better than expert recommendations. Finally, participants expressed that a combination of expert and crowd recommendations would support interns who wanted to safely sandbox unfamiliar data analysis techniques.
Discussion
We have presented Lodestar, a computational notebook for rapid experimentation and learning of new data science practices. Instead of forcing fledgling analysts to search for and apply relevant data analysis methods by hand, Lodestar recommends suitable next steps for the current workflow using both manually curated as well as automatically crowd-sourced guidance. Our work on Lodestar has uncovered several interesting discussion points: the prospect for data science for novices, the actual “wisdom” of crowd recommendations, and alternate recommendation mechanisms.
Data science for non-experts
The real power of Lodestar lies not in its data sources, which are publicly available to anyone online, but in its ability to synthesize the knowledge from these diverse sources into a single unified model. By sharing this knowledge in the form that data scientists are most familiar – Python (or R) source code– Lodestar provides reusable building blocks that can be transferred across workflows.
However, for the tool to be truly effective for its purpose, the library of analysis blocks must be expanded and drawn from a large set of sources. For example, new data sources could be incorporated to customize Lodestar for specific disciplines such as bio-informatics, computational journalism, and computer vision. Lodestar’s advisor model may be one way to support this; as suggested by our recommendation user study, instead of the “expert” versus “crowd” dichotomy that our current implementation uses, a more robust implementation could support a plethora of pluggable advisors drawn from a central repository. In this way, the advisors, analysis blocks, and library could be community-driven and improved by anyone.
Choosing an analysis step or interpreting results in our current prototype still requires baseline data science knowledge, such as from a university data science course (indeed, all our participants had this). However, the Lodestar approach does alleviate lack of expertise in data science practice, which is often the case for academic learning.
The philosophy of the current Lodestar implementation is to give the user as many options as possible for how to proceed with the analysis. However, choice is sometimes a bad thing: for a novice data scientist, getting multiple – and, worse, conflicting – advice can be bewildering. In future work, it would be interesting to curate and coordinate recommendations from multiple advisors to help the user make better and more informed choices.
On the “wisdom of the crowd” for data analysis
While we are excited about the prospects of the “wisdom of the crowd” 62 for data science and analysis, it has become clear that this is an area that will require significantly more work. For example, our current approach is not entirely automated; manual curation is still required in choosing a representative block from the clustering analysis and in editing the block into the appropriate form that Lodestar expects, including eliminating side effects, removing output statements, and resolving dependencies. We plan to automate these steps in the future.
The need for manual curation, or at least review, is compounded by the fact that a significant portion of Rule et al.’s Jupyter corpus 3 was of low quality: some notebooks had cells with a single line of code, or all of the source code in a single cell. Many had non-functional code, syntax errors, or code that was never used. While we filtered such notebooks from our analysis, the signal-to-noise ratio in crowdsourced code is often low.
The remedy for many of these challenges can often be found in sheer scale. While we studied the “sampler” dataset containing 6530 notebooks in this paper, the full 600 GB dataset contains more than 1.25 million notebooks. With access to this many examples, we could afford to discard more problematic ones. Furthermore, frequency of use would help ensure that best practices are easier to identify. Of course, a dataset of this size brings with it a new set of scalability challenges. Existing data processing 63 and code analysis64,65 techniques could help address this big data challenge in the future.
Different recommendation strategies
The Lodestar recommendation engine is based on Markov chains, which are useful for representing a sequence of chained states or commands, as in a data science script. However Markov chains may oversimplify the relationships between analysis steps and data science users in some ways. It would be interesting to study how to use more sophisticated methods as part of the Lodestar recommendation engine. For example, state-of-the-art recommender systems tend to be organized into collaborative filtering, content-based filtering, and hybrid filtering. 66 Collaborative filtering is based on a social view of recommendation, where behavior by other users such as navigation, ratings, and their personal traits are used to match content to a specific user. In the case of Lodestar, this would enable the historical preferences of Lodestar users to guide other users. For content-based filtering, recommendations can be derived by comparing items to recommend with user preferences and auxiliary information. This approach could enable Lodestar users to be matched to specific analysis steps based on, for example, workflows they have created in the past, specific data types, and metadata for existing datasets and code. Finally, we could combine methods to develop new hybrid recommendation strategies.
A recent development in artificial intelligence is to build recommender systems using deep learning techniques (or deep recommenders,45,67 particularly for content-based approaches. Given our large available corpus of potential training data, unsupervised methods such as Recurrent Neural Networks could prove useful, since they are ideal for sequential data. The Lodestar advisor model provides a useful framework from which to incorporate and merge future recommendation strategies for data science. However, these topics are beyond the scope of this paper.
Limitations and future work
Our evaluation of the recommender suggests curated recommendations, geared toward different types of analytical goal (e.g. data cleaning, data exploration, visualization..etc.) can enable rapid experimentation with different programing techniques for the real-world. We limited our system to tutorials which presented high-level data explorations techniques. Advisors specifically geared to provide recommendations on data wrangling techniques could be the means to handle messy real-world datasets for Lodestar users. Advisors can even be designed to provide “unique” or less popular recommendations to ensure Lodestar users consider many options. Diversifying the recommendation techniques to target multiple goals will be an important part of future work.
When we first curated crowd techniques, our aim was to introduce users to a variety of more modern libraries and conventions –particularly since expert tutorials become outdated. The professional data science study participants, rightfully, were sometimes confused by the complexity of the techniques presented by the crowd advisor. We believe that more detailed documentation 68 would be helpful reducing this type of confusing.
Due to the many challenges of automatic code analysis, we currently do not allow users to write their own code directly in Lodestar, or even to modify existing code. To make online code editing possible, we would need an automatic classification process that could determine how new code fits into the recommendation graph so that the system could resume the analysis with new recommendations after manual code block. Such live updates to the recommender are not currently part of Lodestar, but are an interesting direction for future work. These live updates would provide a view into the “latest” analysis trends and enable a means for the Lodestar analysis library to grow in time. We anticipate that such a live update mechanism would feed into a dashboard by which Lodestar users could further view, label, and filter for valid analysis techniques.
We made several design decisions to the Lodestar notebook that will need to be revisited for a general implementation. Lodestar currently does not consider specifics about each input dataset while making recommendations – only display recommendations which do not programmatically fail to execute on the selected dataset. This should be studied in future work. Furthermore, all of our analysis blocks take a Pandas data frame as input, and generate a new data frame as output. Also, other disciplines use other data representations, and some computations may require passing multiple data objects as arguments. To address these limitations, we look to improving our existing design and thoroughly evaluating these improvements in our future work.
Finally, with the release of state-of-the-art Large Language Models (LLMs) from OpenAI, Microsoft, and Google, it is safe to say that the future of data science recommendation is changing rapidly. Plugins for these LLMs already exist that allow users to upload datasets and then ask for customized data science analysis using natural language queries. We think that the findings in this paper can help guide and influence these future directions.