
Abstract
Real-time situation awareness is a key challenge of cybersecurity defense. Visual analytics has been utilized for this purpose, but existing tools tend to require detailed knowledge about the network, which can be challenging in large-scale, production networks. We conducted an interview study involving 24 security professionals to gather requirements for the design, development, and evaluation of visualization to aid situation awareness in cybersecurity. Using these findings, we designed a visualization tool – called RIVERSIDE – for providing a real-time view of the dynamically changing computer network to support situation awareness. We evaluated Riverside in a user study involving 10 participants. Participants were placed in an incident response scenario that tasked them to identify malicious activity on a network. 20% of the users identified all attack component, while an additional 40% only missed one component.
Introduction
Cybersecurity analysts are flooded with hundreds of security alerts on a regular basis, which can lead to missed indicators of compromise (IOCs) or add to the difficulty of rebuilding timelines during incident response (IR). Visualization has been presented as a technique that can help enhance situation awareness in cybersecurity, or so-called “cyber-SA.”1–4 This has lead to the development of a multitude of cybersecurity visualizations over the years. 5 However, user input is often ignored or never sought out during the design and evaluation phases of cybersecurity visualizations, 6 despite broader visualization literature documenting that real user evaluation is critical. 7 Additionally, cyber defenders are inherently skeptical of “automated reasoning about their data in general,” and thus tend to place mistrust in cybersecurity visualizations. 8 To cultivate widespread adoption of tools, user needs and requirements must be taken into account, and end users need to be involved in the development lifecycle. 1
In this paper, we propose a problem-driven design study 7 involving a visualization tool for providing cybersecurity situation awareness through dynamic responsive graphs called RIVERSIDE. In designing Riverside, we leverage previous user-centered visualization design research6,9,10 by conducting 24 semi-structured interviews with network and security professionals to discuss their experiences. Interviews were used to garner information about what mechanisms participants use for maintaining SA on their networks and what, if any, mechanisms they thought would be useful in a network visualization tool. We performed qualitative coding and thematic analysis to determine several themes surrounding participant’s capability preferences, industry truths, challenges with current capabilities, and the applications of visualization to participant professions. Additionally, we coded technical visualization features and mapped them to low-level actions that could be used to infer higher level analysis tasks. 11 Using the interview data, we developed Riverside, the data-driven network security visualization that allows analysts to make informed decisions about the state of their network.
Unlike other network security visualizations, Riverside does not require manual tuning or user-provided information and immediately yields valuable network insights upon deployment. The tool displays a recognizable and animated network view connected to a timeline for temporal navigation, providing dynamic situation awareness over time. We followed the guidelines presented by Freitas et al. . 12 to directly incorporate real users into our evaluation process by conducting a user study 13 with 10 security professionals.
Our direct contributions in this paper are the following:
Interviews with 24 network and security professionals yielding 14 qualitative themes on cybersecurity visualization development as well as 24 technical visualization features mapped to low-level actions;
The prototype RIVERSIDE tool, a network security visual analytics tool based on dynamically changing graphs showing real-time traffic on the network; and
Results from a user study yielding recommendations for future work in the cybersecurity SA visualization field based on end user trials and feedback.
All of the supplemental material for this research, including the full set of interview questions, codebook, usability tasks, and the Riverside manual are located here: https://osf.io/edjmu/.
Related work
Here we review prior work on security professional roles and experiences, applications of visual analytics in cybersecurity, cybersecurity situation awareness visualization, and user-centered techniques for cybersecurity visualization.
Figure 1 summarizes previous work that shows where Riverside differs from other visualization research and tools. The data categorization of “static” versus “dynamic” is meant to show what the tool inherently supports in terms of providing static or dynamic visuals. We color these instances, as well as partial implementations, yellow, to signify that it is something not inherently offered or never clarified. This in and of itself is a finding, as many of these tools which are meant to be “used” do not discuss how an end user would deploy the tool in an operational capacity.
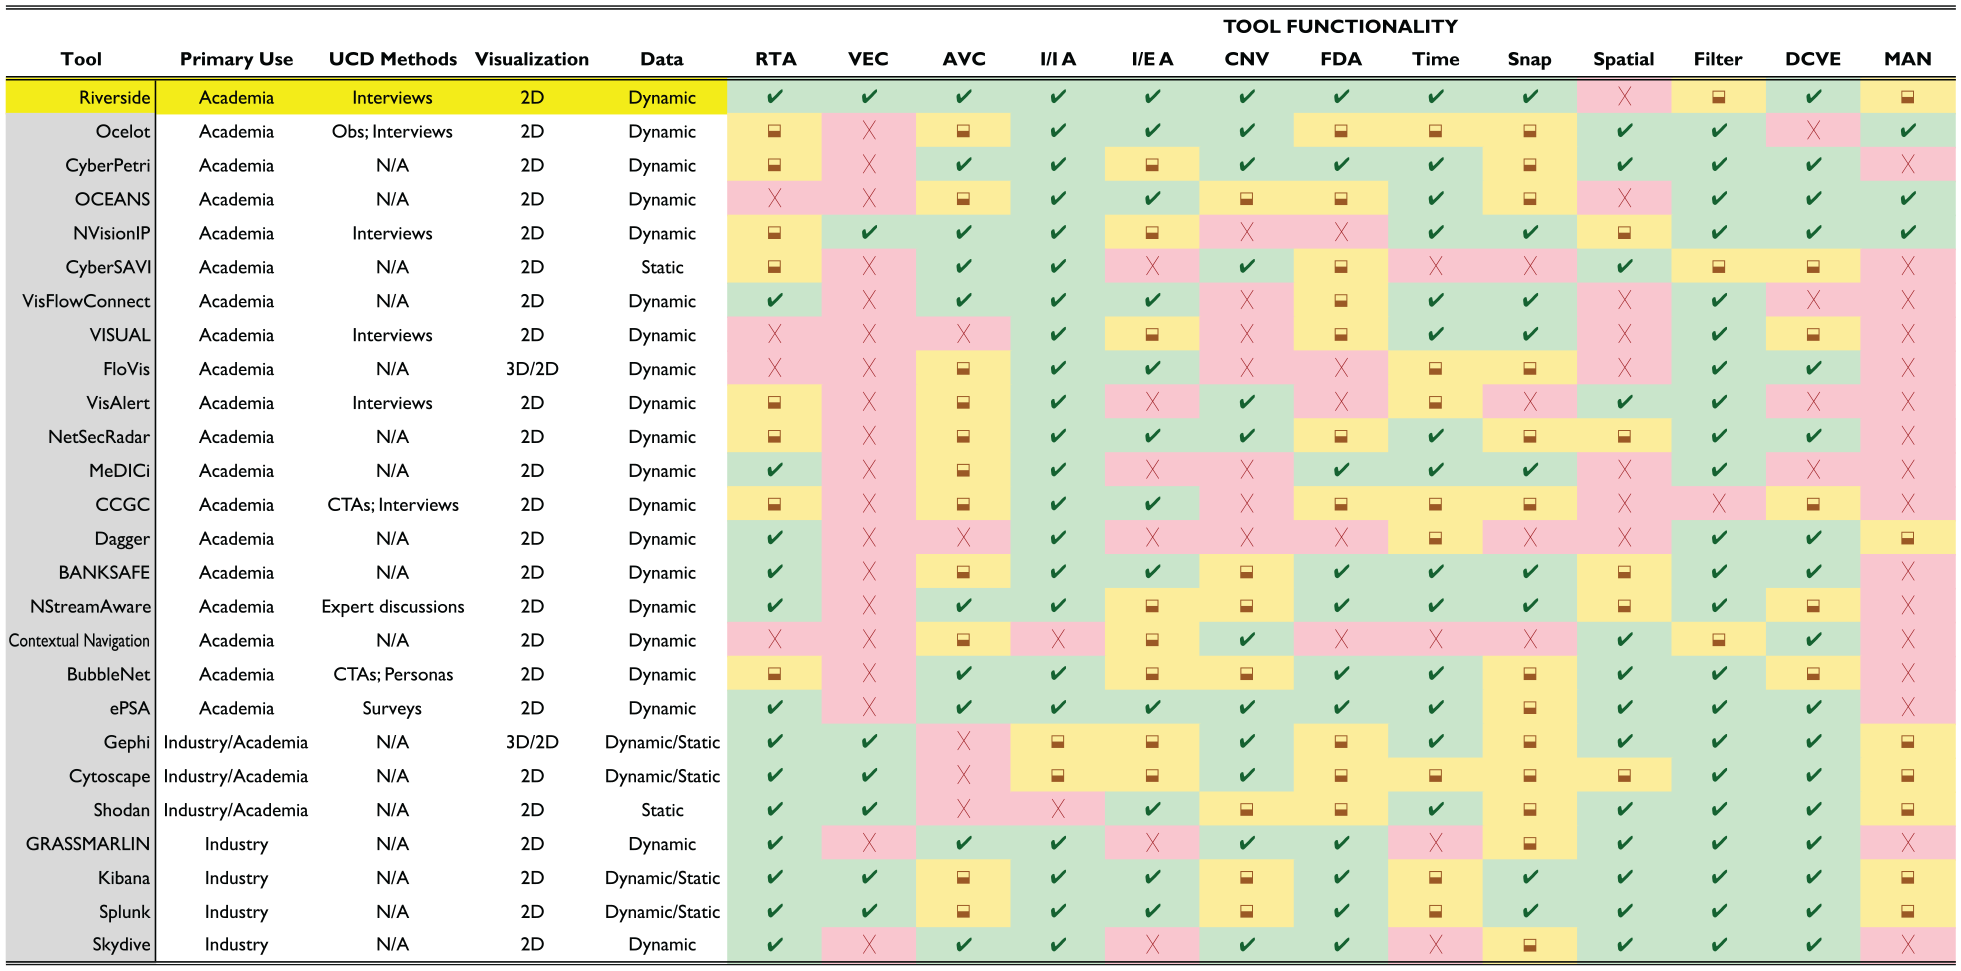
Taxonomy of cybersecurity situation awareness visualizations. Overview of features provided by existing cybersecurity situation awareness visualizations. Our tool, Riverside, is shown as the top line in comparison to similar visualizations and whether that tool offers the specific feature in entirety (green ), partially (yellow✓), or does not offer it at all (
Surveying IT and security professionals
One of the largest issues in the field of usable security is lack of feedback. 14 At the same time, input from users is imperative to ensure that usable and effective security mechanisms are developed. To do this, researchers employ a variety of methods to understand the challenges that security professionals face to build tools that will truly help them. The most common are interviews which have been used to understand the challenges system administrators face in keeping systems or networks updated 15 or identify the challenges security professionals who assist in vulnerability discovery and the constraints that they feel prevents them from being successful in their roles. 16 While these interviews were not conducted with the same use case as the ones in this paper, they were performed with the goal of understanding the obstacles that professionals face in their roles with the aim of developing effective solutions for them.
Our interviews included professionals in the fields of network administration, Security Operations Centers (SOCs), and Network Operations Centers (NOCs), as those are all professionals who could use network-based visuals to assist in their job tasks. Goodall et al. performed in-situ interviews with intrusion detection analysts and found that collaboration in organizations and the community was the primary issue for these analysts. 17 Similarly, Kokulu et al. looked at the issues surrounding SOCs, both technically and culturally, to determine that SOC personnel’s most common challenge was low visibility on their networks through interviews with analysts and managers. 18 This key finding of low situation awareness was echoed in NOC environments through various in-situ user studies conducted by Paul. 19
Souza et al. conducted a survey with system administrators to understand their primary needs and found that not only did the administrators hold a variety of job responsibilities, but the largest problems they faced were “information quality and dynamic knowledge management.” 20 Another study by Botta et al. used an ethnographic approach to understand the wide range of tools used by IT security professionals to develop better tooling and interfaces. They found that people prefer to use a handful of tools compared to just one or many, and the main issue with current tooling was “tailorability,” or the ability to modify a tool based on an analyst’s needs. 21
Visual analytics applications for cybersecurity
Several papers have focused on understanding cybersecurity analyst’s situation awareness mental models using interviews, 22 interactive tasks, 23 and cognitive task analysis (CTA),24,25 but all with the goal of determining how visual analytics can be used to developed effective cybersecurity visualizations by understanding the needs and workflows of analysts. Many of these studies focus on the use cases or applications of visualizations, such as D’Amico et al., who interviewed cybersecurity professionals to confirm or deny assertions regarding the jobs of defensive cyber personnel to garner how they felt about security visualizations. 26 This was based on previous work that focused on using CTAs to define cybersecurity defense roles, analysis, and workflows to produce recommendations for designing effective cybersecurity visualizations. 27 Many of study’s findings were in line with what we uncovered during our interviews. However, where they showcase very broad results, our analysis is focused on gathering specific technical features that participants desired beyond the general use cases of cybersecurity visualizations.
Lavigne and Gouin explored how visual analytics can be applied to cybersecurity by categorizing different types of visualizations and their applicability in security. 3 Tyworth et al. 4 looked at modifying Endsley’s traditional 3-level situation awareness model 28 to better fit cybersecurity since “cyber-SA lacked well-defined boundaries but required collaboration across multiple entities.” D’Amico and Kocka expanded Endsley’s stages of situation awareness and connected them to the stages of information assurance (IA) analysis based on possible use cases. 1 They found that no one visualization can possibly cover all the stages of IA analysis or levels of situation awareness and that there is no “silver bullet” for IA visualizations. We leverage this prior work to develop a network security visualization tool for providing high-level insights that augment a security analyst’s capabilities.
Visualization for cybersecurity SA
There are several visualization tools that focus specifically on the use case of providing situation awareness, akin to Riverside. NVisionIP 29 was one of the first dynamic network security tools and uses three views to show the data in a “galaxy view, small multiple view, and machine view” through scatter plots and bar graphs. VISUAL 30 and VisFlowConnect 31 use a grid layout with lines connecting the visualization entities, where FloVis 32 uses a mix of radial edge bundling, 3D, and grid layouts to display the network data. Another tool called IP Matrix 33 used matrices to visualize cyber attacks by using pixels to represent sites and colors to represent attacks. OverFlow leveraged the previous work of FloVis to create a central view that uses a concentric circle layout of node groupings to represent different segments of the network connected by links to represent communication. 34 Unfortunately, many of these tools use technology that has not withstood the test of time with the requirement of client-based software or the use of defunct frameworks and toolkits.
The Time-Based Network Traffic Visualizer (TNV) visualizes network traffic over time with a timeline axis per host in a matrix plot, 35 focusing on situation awareness through IDS alerts. TNV displays the links between hosts across timelines, but it requires the analyst to choose the data they’re visualizing, whereas Riverside provides this feature automatically for network hosts. VisAlert 36 was built to provide situation awareness, but exclusively visualizes IDS alerts in a hierarchical circle layout with a node-link diagram of the network in the center. It focuses on providing analysts insight in network intrusion detection but requires the user to manually aggregate their data for input into the tool. Similar to VisAlert, Zhou et al. used a radial layout with edge bundling and node-links to create NetSecRadar 37 but focuses on tackling network data fusion while providing real-time event correlation to users. Best et al. developed two tools to create a real-time, situation awareness platform called MeDICi. 38 Their tools CLIQUE and TrafficCircle combined to provide network behavior graphs presented in a grid-row layout and a radial “time wheel” to convey network communication data, respectively. Erbacher developed a situation awareness dashboard that used circles, or “gages,” to represent a system and was aimed at assessing mission impact for decision-makers, which involved risk and vulnerability scoring as well as evaluating network security components. 39 Similarly, Dagger 40 models and visualizes mission impact through hierarchical layering techniques such as sunburst visualizations.
Ocelot 10 uses mechanisms similar to Riverside, but its primary use case is for placing internal nodes into quarantine groups and uses sliding time windows whereas Riverside uses temporal navigation through a timeline to display past and current network insights. Additionally, Ocelot’s layout uses circle packing combined with node-link diagrams where the remote, or external hosts, are placed in a circular layout, while Riverside exclusively uses node-link diagrams on an infinite canvas. NetCapVis 41 and VIAssist 42 also use a client-server architecture with data batching for real-time analysis, but the former focuses on visualizing packet captures, similar to Wireshark, 43 whereas the latter uses geographic chart visuals. BANKSAFE uses a combination of circles to represent 24-h time-series data along with treemaps and matrix grids for activity data all by individual hosts through a hierarchical mapping of organizational levels and policies. 44 OCEANS 45 and CyberSAVI 46 were focused on creating collaborative security dashboards for overall situation awareness, but the former used various graphical charts where the latter presented a high-level topological view of a network using node-link diagrams. Despite many of these tools providing great insights into a user’s network, few of them discuss real-world deployment, or they contain complicated graphics and dashboards that make it hard for users to immediately comprehend.
Some more modern situation awareness visualization tools include NStreamAware 47 and CyberPetri 48 that both provide real-time network security analysis. NStreamAware uses “time slices” and data streams to collect and display relevant network security information, while CyberPetri is a later rendition of Ocelot 10 that was re-designed for monitoring a network security competition. CyberPetri used 15-minute data batching periods and colors to encode specific events, while Riverside uses colors to differentiate different components and batches data every 2 s allowing more accurate temporal analysis. NStreamAware uses data streaming and provides a multitude of dashboards to show slices of data over time, compared to Riverside which is focused on providing a concrete network environment view over time. Gray et al. built a network topology visualization tool, but it focused on visualizing external entities and providing situation awareness to network administrators of potential external security threats. 49 Some of these tools and frameworks incorporated user-driven feedback and requirements through results of other studies or methods of their own, but they all use varying layouts and features to provide SA. Riverside leverages this previous work and provides dynamic situation awareness through data-driven, real-time visuals of a network’s state using mechanisms different from those discussed here.
Graph visualization tools such as Gephi 50 or Cytoscape 51 are often used to create custom network visualizations but can have additional software or hardware requirements and necessitate the manual creation of the visualizations by end users. The same is true for multivariate visualization tools such as Tableau/Polaris, 52 Keshif, 53 and ExPlates. 54 Enterprise tools like Splunk are often used to visualize network security events, but the visualizations are an additional add-on that users must create themselves. 55 Arkime 56 and Kibana 57 are open-source tools, similar to Splunk, and are primarily for data aggregation. Arkime focuses on providing packet capture analysis and visualizations versus Kibana’s dashboards of network security chart visualizations.
VizAlerts is a “data-driven automation platform” that can be connected to Tableau to build various charts and dashboards for a variety of network alerting. 58 Some would also consider Shodan a geographic cybersecurity visualization tool for IoT devices because its data can be used to create unique and user-specific visualizations. 59 Skydive is another open-source project for real-time analysis but developed for Linux operating systems and internal network analysis. 60 GrassMarlin is a network mapping and situation awareness tool, but it is built for ICS and SCADA networks. 61
User-centered cybersecurity visualization
While some of the visualization tools mentioned previously incorporated user-driven requirements, there exists a body of work that focuses specifically on incorporating users into the design and evaluation of security visualizations due to the highly technical needs of the cybersecurity field. McKenna et al. stressed the importance of user-centered design methods for cybersecurity visualizations and developed a set of user profiles to identify needs and use cases for when visualization developers don’t have direct access to security personnel. 6 Building on this work, McKenna et al. built a cybersecurity dashboard, BubbleNet, using human-in-the-loop development at each stage of their process, conducted a user study, and deployed their dashboard in an operational environment for further testing. 62 Similarly, Stoll et al. recommended a “persona” approach with a five-step process to determine cybersecurity visualization requirements and use cases, 63 while another study used focus groups and semi-structured interviews with security professionals to apply visual analytics to malware analysis 64 using the “data-users-task analysis” framework 65 for their design process.
We differ from these studies in that we chose to interact with professionals who use visualizations across a variety of network and security roles and didn’t want to rely on generic models that can’t account for all possible cybersecurity use cases. Best et al. conducted interviews and focus groups to categorize user groups and the challenges associated with designing security visualizations for those users. 9 To address these challenges, they built a network security visualization mock-up called SEQVIZ by incorporating user recommendations throughout the entire design and development process. Similar to Best et al., Fink et al. conducted an ethnographic study of cybersecurity analysts to understand the challenges they face and provided a set of design principles for building an all-encompassing cybersecurity visualization environment. 8 Erbacher used CTAs along with discussions from various stakeholders to develop Cyber Command Gage Cluster (CCGC) meant to provide mission impact situation awareness. 39
Arendt et al. 10 used in-situ observations and interviews with security analysts to determine user requirements for building multiple network visualizations with various use cases. Legg used survey data from non-expert users to develop a web-based, cyber-SA dashboard, ePSA, that used a VPN infrastructure to display information about people’s personal and home devices. 66 Similar to Riverside, ePSA uses force-directed, node-link diagrams to display its network view and provides some user-customization features to highlight certain activities. Last, a similar study to ours was focused on the need for usable visualizations in the field of system administration, where researchers interviewed system administrators to gather technical visualization features and tie them to domain-level tasks. 67 Franklin et al. used methods akin to ours through group-focused semi-structured interviews with security analysts. 68 Their findings focused on developing tasks from analysts daily workflows and alert triage and analysis tasks, all with the goal of building an alert management visualization tool. We used this prior work as a framework for how to conduct our research by incorporating user-centered methods to design and evaluate a network security visualization tool.
Formative evaluation: Interview study
The use of visualizations in cybersecurity is not new, including those directly supporting the concept of situation awareness 5 ; however, oftentimes these visualization tools are developed without regard to the direct needs or wants of security personnel, 6 or the visualization piece is an add-on to a capability that performs a different function altogether. Furthermore, many of the tools that meet all of these needs are costly and unobtainable outside of a large enterprise environment. 69 With this in mind, we wanted to gain a better understanding of what those exact needs are and how they can be met through network security visualization.
Our goals were three-fold: (1) understand the experiences current network or security professionals have about the tools they use, (2) evaluate the level of cyber-SA that participants believe they have of their networks, and (3) gather various perspectives to use toward development of a network security visualization tool. We acknowledge that users needs vary for NOC or SOC analysts, network administrators, or incident responders, but all of these fields use visualization tools to aid in their job tasks. Furthermore, for many small to medium-sized businesses, these roles and responsibilities overlap, sometimes to the extent that network and security administration roles fall to the same team or individual. In fact, some of our participants were the sole IT and security administrator responsible for both network and security operations within their company’s environment.
Methods
After receiving approval from our university IRB, we conducted 24 audio-recorded, semi-structured interviews with participants who had backgrounds working in a NOC, SOC or experience with network administration over Zoom video conferences. The general flow of interview questions was background information on participant experiences, questions about capabilities they have used, and general questions on good incident response practices and situational awareness in security. The final part of the interview then asked participants to either draw or explain what they need from a visualization tool to help them be effective in their role, which could involve a layout or specific features.
We used Zoom transcription to generate initial transcripts and then used the audio recordings to correct errors. We anonymized all transcripts by removing any identifying information about participants, such as specific companies or organizations, before importing the transcripts into our coding software. Additionally, all participants were required to sign and return a consent form before their interview began.
Participants
We recruited participants primarily through social media posts on forums such as Twitter, LinkedIn, and Reddit, as well as emails through personal and professional networks. Participants enrolled in the study by filling out an online form, including their background and demographics. We screened participants to be at least 18 years of age, be U.S. citizens, and have at least 1 year of experience working in a NOC, SOC or as a network administrator. The only disqualifying criteria that we encountered for a participant was lack of experience in a relevant professional field.
We conducted 24 interviews in the period May to June 2022. Table 1 contains basic demographics for all of our participants as well as information about their current professional roles and what area of industry they currently work in. Our participants came from a variety of backgrounds with the majority working directly in the cybersecurity industry. Their average experience was about 9 years, and majority of our participants identified as male.
Interview participant demographics.
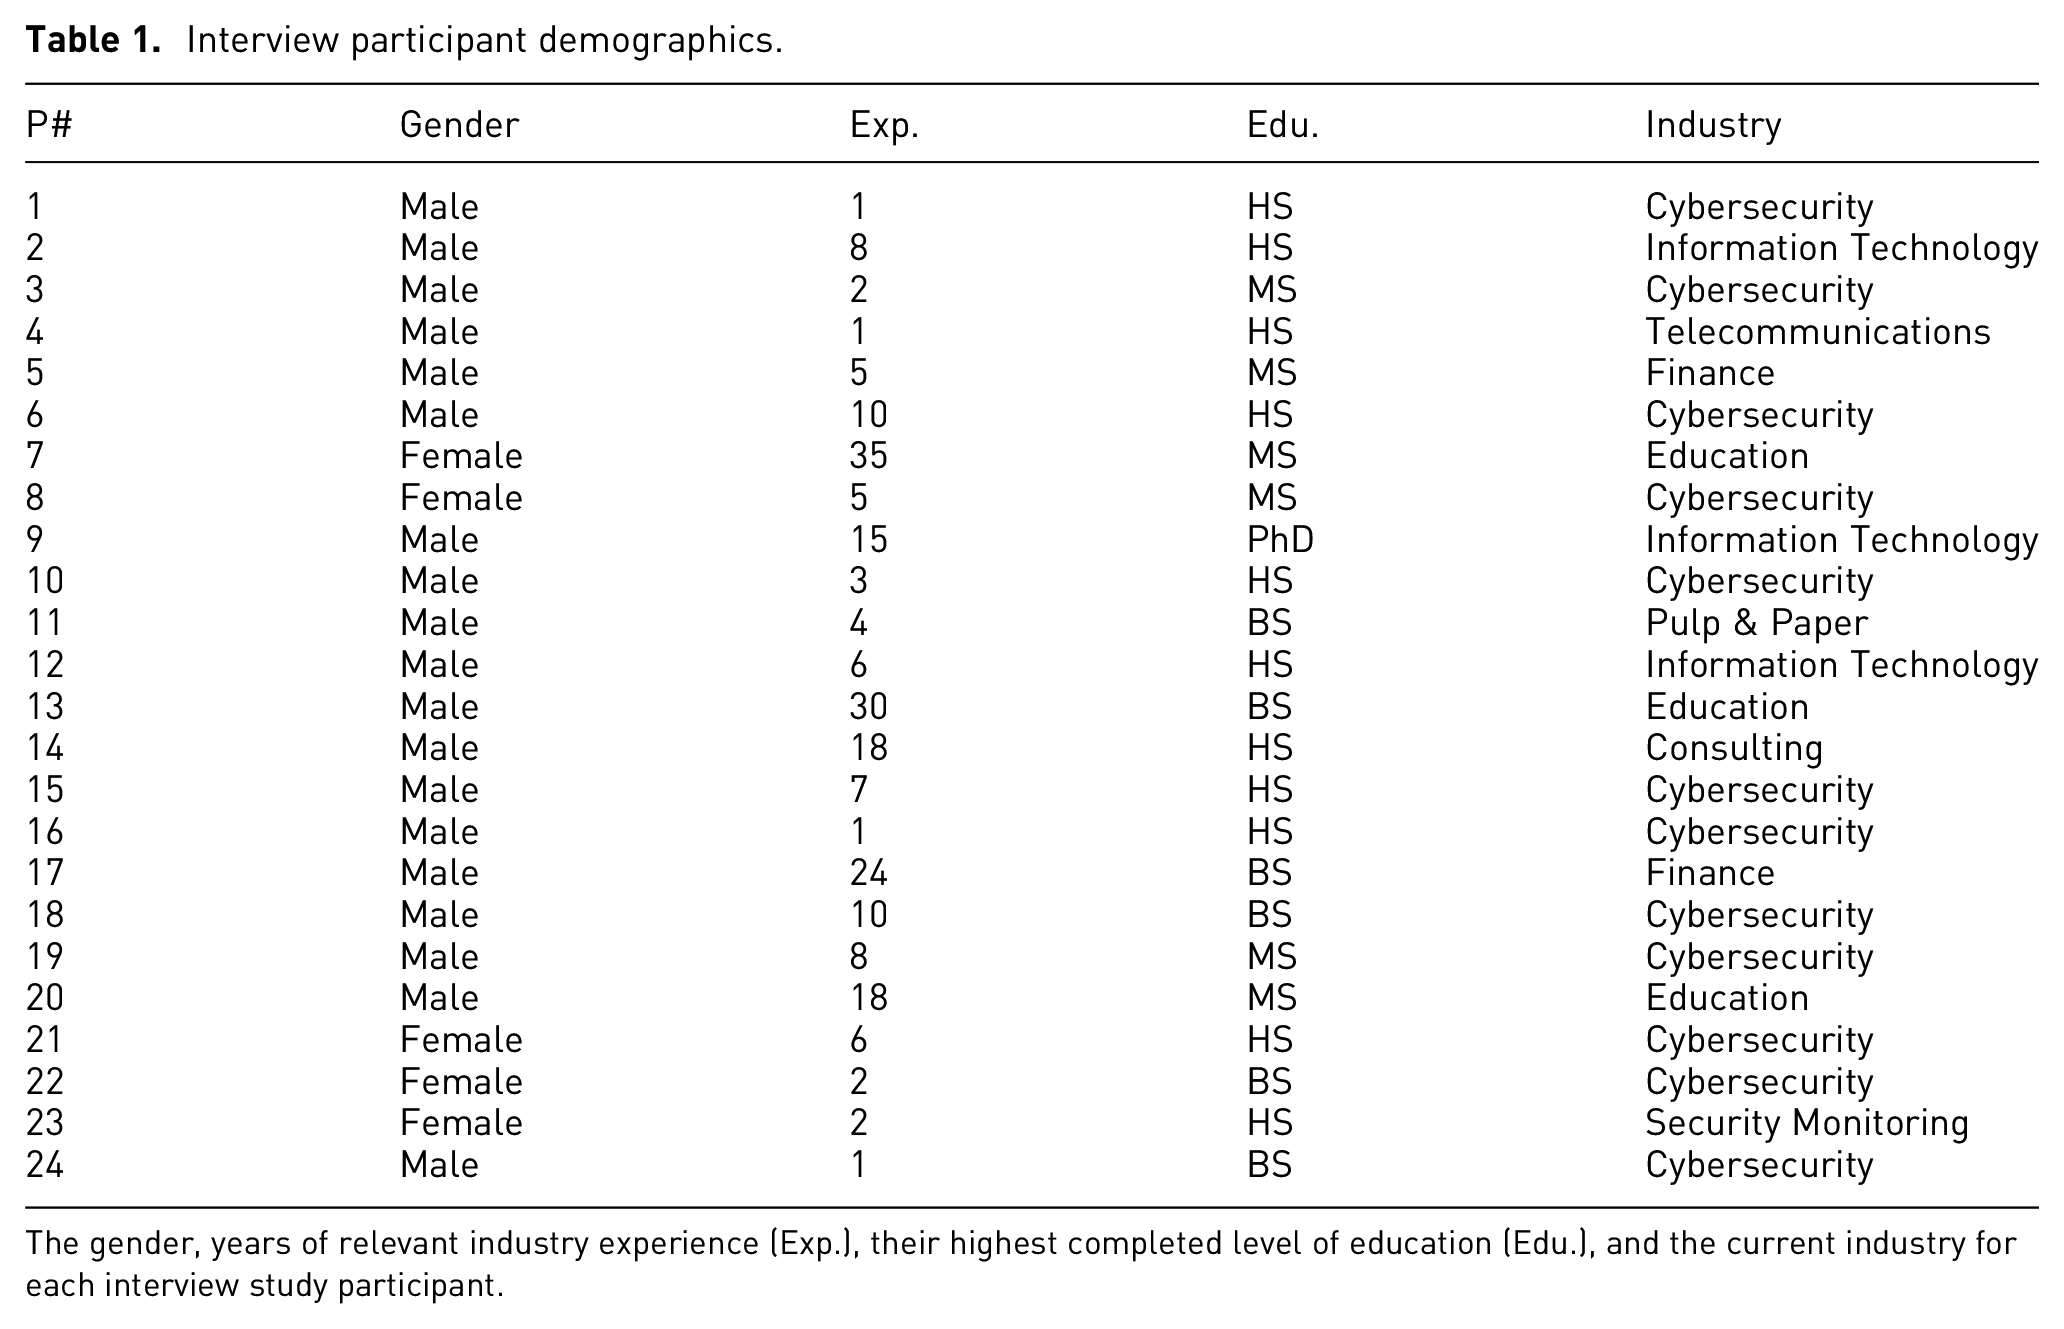
The gender, years of relevant industry experience (Exp.), their highest completed level of education (Edu.), and the current industry for each interview study participant.
Data analysis
We performed qualitative analysis for our interviews, with some semi-quantitative analysis for the frequency a particular visualization feature was mentioned. Our qualitative analysis was done using open coding and thematic analysis, loosely following the framework proposed by Braun and Clarke and Clarke. 70 We deviated from this framework by finishing our coding and subsequent codebook completely before diving into the thematic analysis.
Our qualitative analysis was performed using NVivo. We used open coding and thematic analysis to distil participant responses into 54 codes and 14 corresponding themes. We coded 24 “Visualization Features” which were not included in our thematic analysis and are thus not included in the previously mentioned totals. We chose not to use a reliability metric as the lead author performed the majority of the coding, and our analysis was largely qualitative. 71
Coding process
The primary researcher performed the interviews and was responsible for majority of the coding process, but both researchers were familiar with all of the interview data. The primary researcher chose four interviews at random to generate our initial codebook, tested it on two interviews, and revised the codebook as they saw fit. The second researcher then reviewed it to ensure that the coding methodology made sense for our research questions.
The primary researcher continued the coding process by applying the codebook to two interviews at a time. During this time, codes were added, merged, or removed to fill gaps. Both researchers did a final review of the codebook, looking through the descriptions and corresponding coded text to ensure accuracy for each code. During this process, we split larger codes into smaller ones or renamed codes to more accurate titles. Once this was complete, we once again reviewed the codes collaboratively as a final check in our coding process. After discussion, consensus was reached, and we froze our final codebook with 54 codes. We note that four of our interviews yielded no changes to our codebook.
Thematic analysis
We kept track of initial themes discovered during the coding process. We then reviewed the themes to combine, remove, or add new ones to ensure that every theme was relevant to our research question and the codes encompassed by those themes.
We finished our analysis with 14 themes. We organized the themes into four categories that aimed to provide the necessary background for our research. Every code was assigned to a relevant theme.
The landscape of network and security tools
Over the course of reviewing interview data, we kept a running list of the network and security capbilities and network visualization tools that participants mentioned during their interviews. The network and security capabilities mentioned, as well as how many times they were mentioned across all participants is shown in Table 2.
Network security tools.
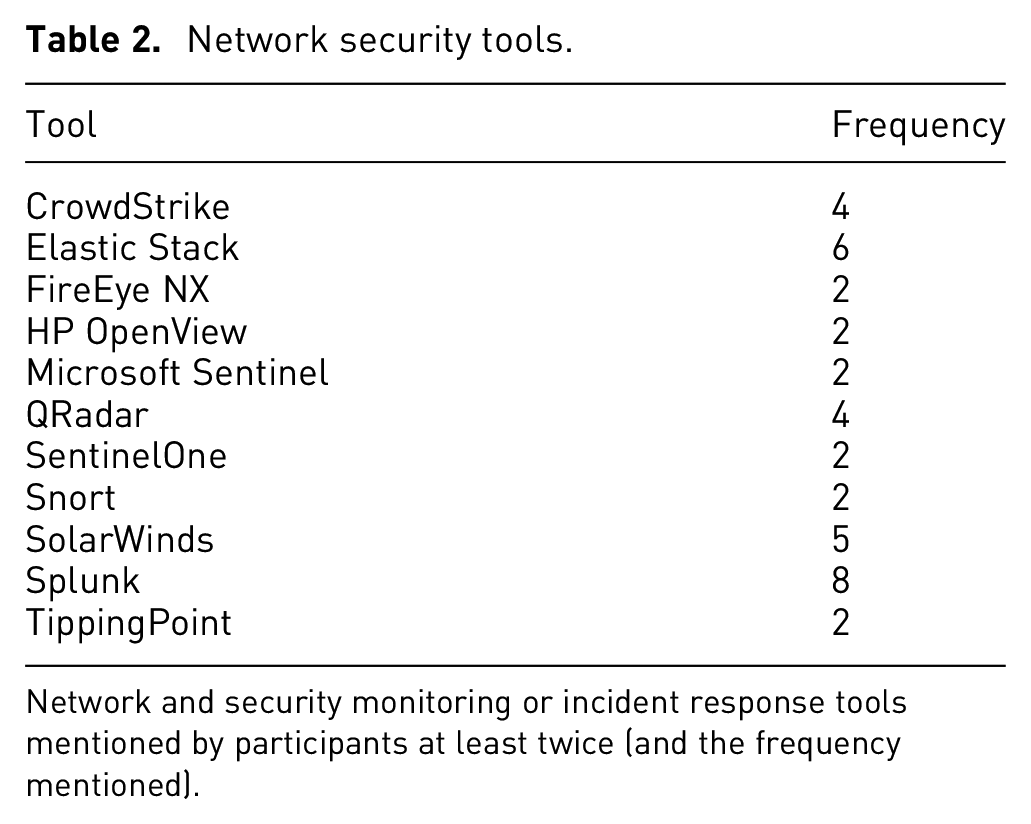
Network and security monitoring or incident response tools mentioned by participants at least twice (and the frequency mentioned).
We also kept a running list of visualization tools that participants specifically mentioned (Table 3). In contrast to the 54 network and security monitoring tools discussed by participants, there were only 19 visualization capabilities participants referenced across the corpus of interviews. In some cases, such as with SolarWinds, there is an overlap between the network & security monitoring and visualization tools, due to their multi-faceted capabilities. Other tools, like Kibana, integrate visualization capabilities on top of data aggregation capabilities where its primary function is providing visualizations for security data, whereas MISP creates network visualizations for cybersecurity threat intelligence. A few participants refrained from mentioning explicit tools, largely due to operational security requirements from their employers.
Network visualization tools.
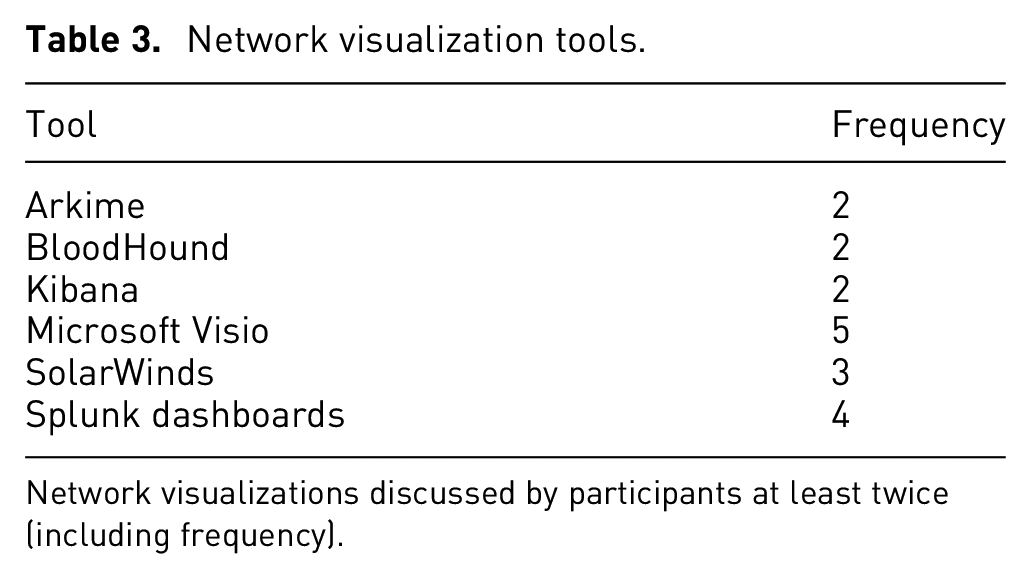
Network visualizations discussed by participants at least twice (including frequency).
Results
We now present the results of our interview data, which contain our thematic analysis, as well as our qualitative analysis for the 24 visualization features we coded.
Current capabilities
These cover what users have today. People are content with the capabilities they have. A few participants stated that they were quite content with their capabilities. The reasons behind this sentiment varied, but generally centered around access to “top of the line” tools and the feeling that they had enough overlap and redundancy in their capabilities. P1 stated specific capabilities that made them comfortable with the visibility they have on their network, while P5 felt their company had great redundancy and overlap in capabilities saying “it’s kind of like, you put Legos together and a little bit overlap, but, eventually everything gets covered.” Other participants, like P12, felt like their company had no blind spots and “there’s really nothing that [they] are wanting.” Participants such as P17 felt that they had their tools and alerts tuned really well, providing “great threat awareness” overall.
People want the option to manage their tools
When discussing how participants felt about their capabilities, many weren’t satisfied with their tools or capabilities because “they were users of someone else’s design” and couldn’t make changes that would enhance their visibility or insights. This particular notion seemed to exist because the analysts, or users, couldn’t make the changes they wanted on their end and needed a third-party to implement them.
Because of this, P1 and P4 stated that they preferred open-source tools because they can add to it “on the fly,” giving them more control over their tools, while P18 stated that their company will develop custom tooling if need be. Similarly, participants P20 and P22 felt that some commercial tools were great, but depending on the version, certain components weren’t able to be modified or adjusted for their needs.
People prefer automation over manual effort – to an extent
Despite people wanting to have control over their tools, many of them expressed the desire for automation in their capabilities. P3 and P19 both agreed that dynamic host discovery was a common problem they had faced over their careers and having a capability that could assist with that would be “game-changing.” Many participants also said that automated data aggregation was imperative for their operations, and P2 stated that tools aimed at data aggregation “made the consolidation and just event tagging and correlation of different sets of logs from different technologies together, much easier.”
Participants expressed a liking for automation particularly when it came to network mapping or visualization capabilities. P12 discussed an automated mapping tool that “builds an actual model of [the] network” and stated that it basically “does all the work for you,” which made their job easier. On the other end of the spectrum, P11 said they were “mostly managing [their] inventory in Excel spreadsheets” and that they “don’t really have a dynamic inventory.” Furthermore, they expressed the desire for “something that could build a network map or a node map right of the network using SNMP, or at least you know, even if I have to draw the lines ourself. I mean our network is small but with a massive company... that would be so helpful.”
Industry truths
Participants repeatedly made statements that there were certain realities when you work in the security or IT field. The below themes encapsulate these truths.
Data doesn’t lie
Many participants stated that regardless of what tooling you have access to, it’s only as good as the data that you collect, and if you aren’t familiar with the environment you’re operating in, then you can’t possibly understand what your data is telling you. P19′s stated “it’s kind of the problem with any kind of network monitoring, visualization stuff, as long as you’re feeding it good data then, it’s going to be able to present good data,” showcasing the importance of maintaining data integrity across your environment and tooling. P14 made a point about the importance of data integrity, as well, stating that “[I] have a guideline that I tell all of our analysts, and we’ve used it for a while. People lie, computers can lie, your dog lies, everyone lies. Data doesn’t.”
Several participants also felt that having the raw logs or data all in one place was going to be more useful than any tool output, stressing the importance of data aggregation and familiarity with the operational environment. P6 felt it was more important to be familiar with the operational environment instead of one’s tools and discussed the importance of “local and global prevalence.” They stated that “anything that you can do to combine what you’re looking at with some type of global prevalence or local prevalence is very powerful. So one, how common is this thing for this system? That’s kind of your local prevalence... or how common is it within this customer or this organization? Global prevalence is really only something that you can get when you kind of monitor, multiple different environments, so how common is this thing across all of our customers, or all the places that I’m looking?” Several participants made arguments to this effect: that your data should be considered ground truth over what any tool tells you.
Incident response requires coordination and correlation from a variety of aspects
IR is a complicated task with many moving parts, which was shown in the various responses and sentiments participants provided when asked what was the most important. Many of our participants said that proper scoping was paramount because as P14 said “it’s making sure that we get the entire story.” P18 echoed this sentiment believing that “if you focus too micro, you fix the one host, and then you dont realize its on 10 others, the problem is actually much bigger than you thought,” while P17 said “knowing how many endpoints, and like the real number, not the one they write on the whiteboard.” Others, like P13, cared more about being able to track down the data that triggered the alert or incident because “you get to a certain point that’s not necessarily a breach yet until there’s some sort of data exfiltration and that all goes back to logs.”
P8 stated that identifying the attack vector was paramount because “the main goal of incident response is to put in place security controls that will prevent a similar incident from reoccurring after you remediate the current incident,” while other participants believed that effective communication both up and down the chain was the most important thing during an incident. In that vein, P7 went on to say that having an incident response plan is not enough but that “you need to test the plan and test the team as well to make sure that everybody knows what their responsibility is in the event that you do have an incident.” This just goes to show the very complex nature of incident response and that people think having that big picture view can really help during a time when the one thing you don’t have is time.
24-by-7 network accountability is hard
Several participants felt that even with the best tools or analysts, certain networks and systems are just complex, making good security hard. Many participants held the notion that there were just things on their network that they didn’t know about and weren’t going to know about until there was an incident or event that would cause them to “find” that host. P19 described it “like if the SOC works an investigation and finds out about some weird asset, like a vulnerability scanner,” that was previously unaccounted for on asset lists or network diagrams, it could be added for the next time, but that “known unknowns” are just a reality in the world of network security.
P8 felt that prioritization of assets would help “even if you don’t have an inventory of all several 100,000 workstations, servers, if you can just get your 50 most prized systems” than it’s better than nothing, especially for larger networks, while P19 felt that “relying on a tool or person for complete network topology or asset management is not going to work all of the time, especially for larger networks.” P6 summed it up rather succinctly with the sentiment that “asset management is always crazy.”
Capabilities can serve multiple purposes, for better or for worse
A common sentiment that seemed to be split amongst positive and negative reactions was that participants felt that they had capabilities that provided multiple functions within their environments or processes, but these capabilities might not be what they really needed. P5 stated that they preferred one of the tools in their environment because it was used as the back-end in other capabilities they possessed, making it a multi-dimensional tool that supported a variety of functions for an analyst, and P20 said they leverage the unintended functionality of certain capabilities to their benefit, particularly for network perimeter insights. While these participants had positive experiences with tools that they felt provided useful yet unintended functionality, some participants expressed frustration.
P3 felt they lacked the ability to see what was happening on a host at a given point in time because they didn’t have a capability that gave them ground truth on every segment of their network. P2 mentioned that they “would actually use the SIEMs, not for security purposes, but for operations purposes, because they may have had capabilities that we were lacking in our current environments” and that “all of these tools [they’d] worked with were never implemented in the way they were designed to be implemented... jerry-rigged, if you will.” P9 and P21 stated that they were provided capabilities that didn’t exactly meet their needs, whether that be because they worked in a large organization that mandated certain tools for multiple teams, within a small team with a limited security or IT budget, or with customer-provided data that just didn’t supply enough visibility across operational environments. P16 felt that their network visibility was limited because of the capabilities provided and said it was like “looking at an entire Wheres Waldo page through a pin hole. It takes so long to tie things down because we can’t see big picture.” These participants felt handcuffed at times when attempting to perform their jobs because they had just enough insight to “get it done” but not enough to ever feel completely comfortable operating within their own environment.
Cybersecurity challenges
The following themes focuses on the notion that personnel, tools, and the security industry still fall short in many areas.
Some tools aren’t user friendly
Participants were quick to communicate frustrations with network and security monitoring capabilities that they felt just weren’t easy to use, whether that be because they required additional user input or resources to function, causing more stress on the user and network. Contrary to the theme discussed earlier, many participants had complaints centering around the frustrations for having to manually intervene when attempting to get useful output from a tool. P13 didn’t possess an automated way to create logical and accurate network diagrams and stated that “it’s a manual process to create the links” between all of their assets. P1 had complaints about a tool that they felt was “clunky and slow, and [they thought] it could be replaced by much better tooling.” Others felt that certain tools were a hassle because they relied on additional hardware or software requirements that caused performance issues, such as P20 who couldn’t capture more data with a tool because it would decrease the tool’s performance, making it unusable.
P21 had an interesting comment about visualization tools specifically, in that they “stay away from visualization tools, because sometimes [I’m] intimidated by it, and it feels like a time sink” for them to spend time getting proficient at it, and even while some are better than others, most are not intuitive. P17 echoed frustration with security visualization tools because “the biggest mistake... and where all of them go wrong, is they’re just too noisy right out of the gate... there’s just a ridiculous amount of data, and I think as people, we start to protect ourselves and shut down when confronted with too much data.”
There is no “one-size fits all” in security
The size of a security team and the situational awareness provided by their capabilities vary drastically from one organization to the next, and with this, the needs of a cybersecurity company can differ from those of a finance corporation. For example, P10 and P11 worked on networks with about 200–300 endpoints whereas P23 cited around 32,000 endpoints for their respective network scope. Additionally, participants, like P24, had very large operational environments but stated that they only have about 10 analysts that staff their 24/7 operations center, whereas P16 stated that they worked at a corporation where multiple teams are monitoring their network at a time. This isn’t to discredit the work being done but just that the needs of one company are vastly different from another and capabilities that work in one environment may not be suited to work in another.
Additionally, participants had varying reasons for why they felt confident or not in terms of situational awareness. Participants, like P21, work with customers, so they felt this limited their visibility and accountability of the networks they operate on because “it’s what [they] give us.” Others like P4 felt that they had great visibility because of their tool stack; however, many participants felt that their network visibility and accountability was average, with a common answer being that their asset management “as accurate and up to date as possible” as stated by P10. This further showcases a security capability gap whether that be from tooling or personnel, which isn’t something that an analyst or team can control.
There’s still room for improvement in security
Many participants, even those that were confident in their visibility or satisfied with their capabilities, felt that there were still areas that could be improved upon when it comes to network visibility and overall situation awareness within their environments. P11 was content with the insights their tools provided but wasn’t “really satisfied with where [they’re] at with using those tools,” which was similar to P16 who felt that their team didn’t know how to use current capabilities to the best of their ability. Others like P2 and P4 felt that continuous auditing and verification of network diagrams or asset inventory would have greatly improved their visibility. P10 believed that it “boils down to communication, whether it’s internal communication about who’s using what resources or communication with our clients as to what resources they’re using, what products.” At the end of the day, P7 put it perfectly when they stated that “nothing is ever 100%.”
Security is constantly changing, and capabilities need to adapt to that
While some participants such as P17 felt that over time they were able to adapt their capabilities to their needs, others, like P2, felt that their tools didn’t withstand the test of time as their environment grew and evolved. P3 specifically felt that current security visualizations weren’t adaptable to the environment they operated on since “50,000 assets is kind of hard to visualize. You dont want to visualize all 50,000, but we also don’t want to basically only visualize 5.” P10 and P23 expressed the importance of “customer-focused” tooling and that sometimes vendors aren’t amenable to changing a tool to fit the needs of a company, which can impact their visibility. P18 made a good point that “it’s that cybersecurity thing... attackers figure out something new, and you’ve got to pivot and build something else,” which makes designing adaptive capabilities a challenge.
A picture is worth a thousand words
When discussing if participants had used a visualization tool to assist in their professional lives, many of them expressed that having that visual component can help translate a network from just IP addresses to an actual network topology. P1 believed that having that having a graphical perspective provides insight to “not just network topology but also how segments of the network are used,” and P22 felt they they can give a “whole holistic picture versus like sometimes you get a little rabbit-holed or pigeon-holed when youre like down in the weeds.”
P21 felt that “the best value out of [network visualizations], is trying to translate what we’re doing and what we’re seeing to someone who doesn’t sit in that position.” Additionally, a few of our participants were supervisors at this point in their careers, so they saw visualizations as a way to communicate with upper leadership who may not be a technical by trade but needs to understand the impact of a network incident. P9 said it’s like “you’ve got people that will look at you like this is Greek, and you’ve got others that completely speak the language,” and they see visuals as a way to bridge the communication barrier.
Visual layouts tend to be a personal preference
People had differing perspectives on what layout they preferred for visualizing a network which varied from heat maps, node-link maps, visuals combined with graphs, or even 3D visualizations. Many participants described their preferred layout as the “big picture” with the ability to zoom in on specific hosts or sites to get more detailed information. P18 preferred the style of heat maps where they would want to see zones of traffic and then upon zooming in to a particular area be able to see specific hosts.
While participants had varying layout preferences, a common theme was they didn’t know what the best layout was for everyone, but the ones described were what they knew and felt comfortable with, such as P12. They went on to say that they didn’t know if their preferred hierarchical layout was the best, but they “wouldn’t be able to use a network visualization tool that didn’t have those features.” This supports the notion that visualizations need to flexible for the user while also maintaining usability in the features they provide.
Visualizations are not the be-all, end-all
Some of our participants expressed that, for them, the visualization was only one piece of the puzzle. P14 said network visualizations are “not the defacto standard because of how much traffic and everything [we] have going on.” P15 felt that visualizations were just extra capabilities, and they relied more on case management tools with automated alerting. These participants felt incorporation of incident management or automated alerting into the visualization pipeline would prove more worthwhile for their roles.
Other participants expressed that visualizations should be able to provide high level information that allows them to then pivot to the host level or other tools. P6 provided a great example where “there might be 50 gigs of traffic between this node and this node” and being able to visualize that quickly can provide necessary insights when an analysts needs it.
Visualization features
We coded 24 features that participants felt would be helpful in a network visualization tool. We mapped these features to low-level actions (Table 4). We tracked coded features by participant, so as not to double count a particular feature if a participant mentioned it multiple times. We used these counts to organize and prioritize components that we included in our tool. We coded features through direct mention of a desired feature or action by a participant, like “filtering,” or through an example use case provided by a participant. Descriptions of every coded feature can be seen in the final codebook.
Visualization features.
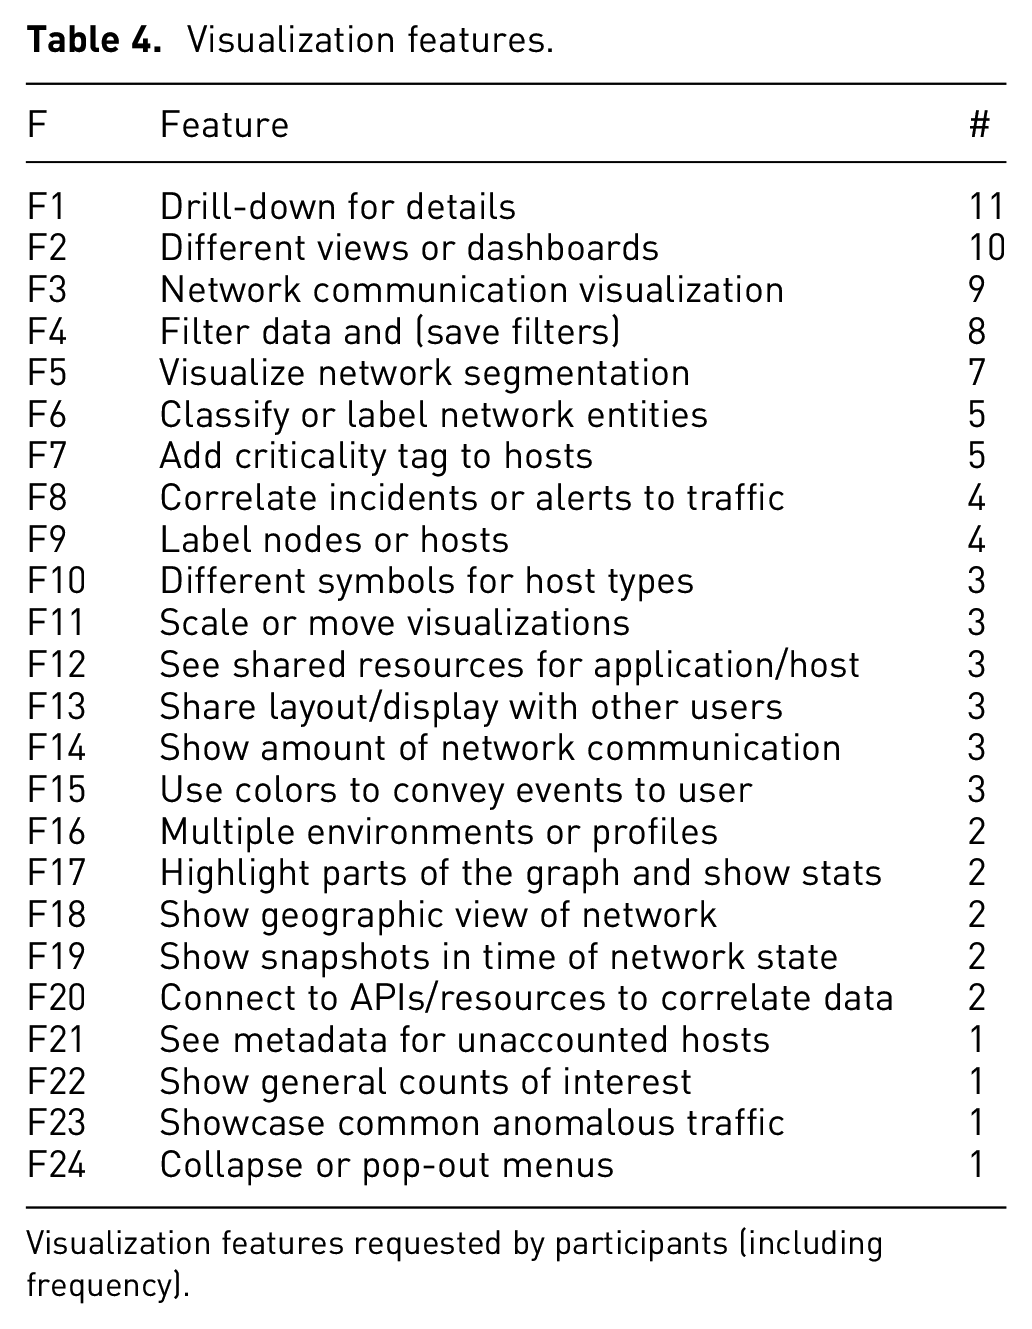
Visualization features requested by participants (including frequency).
Overall, the biggest gripe participants had with visualizations they’ve used was how cluttered or overwhelming many of them are upon start. Consequently, one of the most common features that participants desired was the ability to have basic information presented up front and then be able to get more information about a component at their discretion, echoing the mantra of “overview first, zoom and filter, then details on demand.” 72 This was largely because participants felt visualizations could present too much information up front and lead to “burnout” for analysts. Participants also desired the ability to have multiple views or dashboards since people process information differently. P22 said sometimes they add charts to their dashboards “so that it’s visually entertaining for [their] eyes, so that [they] don’t get burnt out when looking at [the] graphs.”
Another feature mentioned by participants criticality tags for hosts, and P8 thought this was particularly important for either new employees since they’re “probably not going to know what IP address belongs to a certain server, and what applications are residing on each server, so having that ability to discern that this is a system that holds PII or PHI data and having that, very clearly marked out on the diagrams, is really helpful in our opinion.” A modern feature that participants felt was increasingly important with more complex networks was being able to show network segmentation through the visualization, whether that be done automatically or with a tagging ability provided to the user. One of the other common but more complicated features was the ability to filter traffic whether that was to just tune out “the noise” or because their jobs require them to look for very specific indicators, such as P24 who feels that having the ability to perform “log querying and a log search” is key in threat hunting.
As mentioned before, we gave participants to the option to draw when we asked them the final interview question. For participants that chose to exercise this option, it provided very helpful depictions of what they envisioned for a network visualization tool. We took these drawings into account when coding visualization feature requests. P1 preferred a node-link visualization but liked the idea of a feature that allowed them to choose sections of the graph to show more information about those hosts or traffic as seen in Figure 2. P6 preferred having multiple views or dashboards that displayed the network both from a visual and chart perspective as seen in Figure 3. P6 also liked the idea of visually portraying the amount of traffic by making thicker links between nodes that represent hosts, as well as the ability to turn dynamic updates on or off. While we do not believe that one tool can answer all of the problems or desires presented by our participants, we do think that the concept of flexible situation awareness tools can provide necessary insights. With this, we started to build out our network security visualization tool using the data collected and analyzed from our interviews.
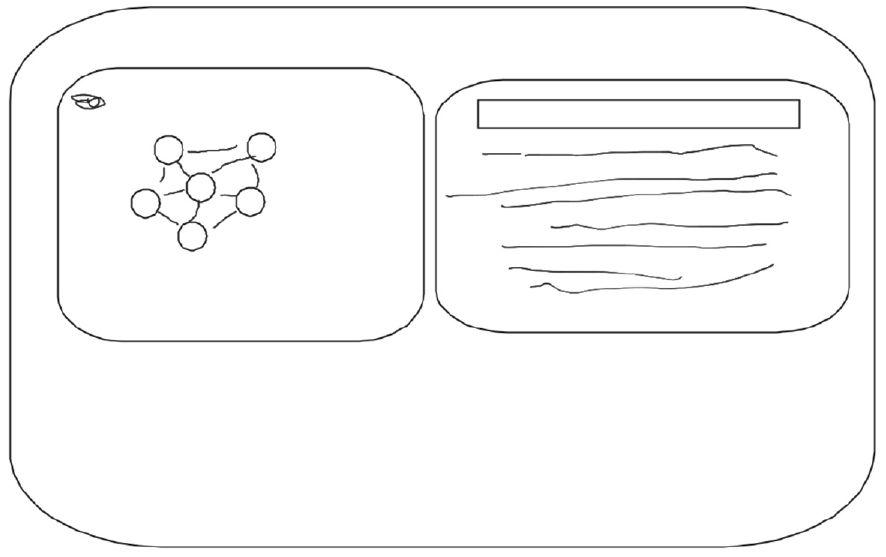
Participant 1 sketch. Network visualization tool layout by P1, showing a portion of the network as nodes connected with edges to represent communication (left) with detailed information about that portion of the network (right).
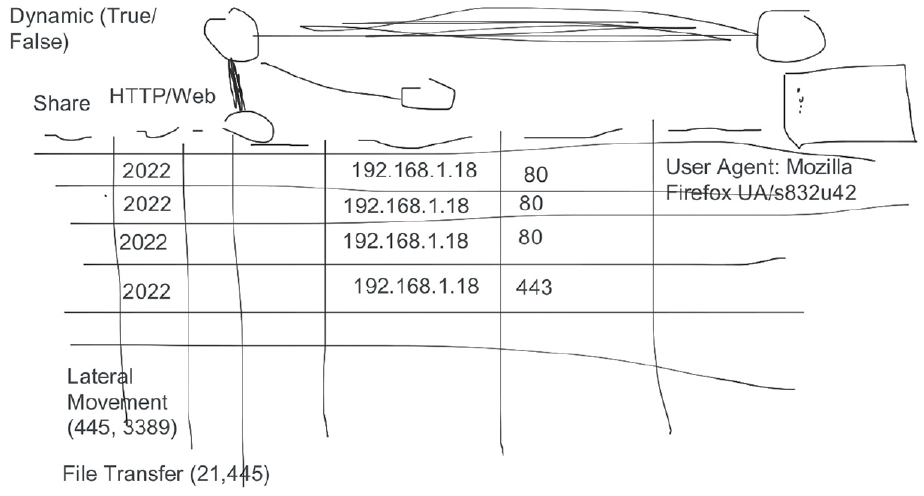
Participant 6 sketch. Network visualization tool layout by P6 that uses node-link diagrams (top) for the network visualization along with a chart of network traffic (bottom).
Limitations
Since we were recording participants and asking about capabilities they’ve used, some participants declined to answer certain questions or could not provide clarification because of their professional roles. This primarily affected their ability to name specific tools when asked and did not largely impact their responses for other questions. We also took care in logically ordering our interview questions from broad to narrow scope when discussing the types of capabilities participants use and the challenges that come with them, but we didn’t use methods such as a pilot study to formally test our questions. We did review our questions collaboratively, but our questions could have contained potential biases through word choices or phrasing.
We acknowledge that using a single, primary coder is not the norm, but as mentioned above, our primary goal was to uncover themes present in our data. Second, we chose not to use a reliability metric and instead used memoing with review by a second researcher at major points in our analysis. Our semi-quantitative analysis for specific visualization features is an additional area that could have produced unintentional coder bias. We attempted to mitigate this bias through the methods mentioned previously. We also did not use the semi-quantitative portion of our analysis to make any statistical claims. Additionally, our participant pool is not representative of all backgrounds in the technology industry, but it does showcase a wide range of experience, education, and professional backgrounds.
The riverside system
Riverside is a web-based cybersecurity visualization system where progressively animated node-link diagrams are used to show dynamic traffic flow over time. Instead of asking system administrators to create a network architecture a priori, something that is time-consuming and prone to inaccuracy, the network visualized in Riverside is uncovered from the data itself, allowing users to see the network communication as it is (rather than how they think it is). An overview of the Riverside visualization can be seen in Figure 4, where the “agent” nodes with specific hostnames represent internal network nodes and gray-colored “remote” nodes with IP addresses represent hosts communicating with the internal network. Links, or edges, between nodes are created when network communication occurs between two hosts and is categorized as “to,”“from,” or “bidirectional” traffic. Riverside uses a time-to-time mapping for displaying visualization components based on the timeline component, allowing users to watch their network state in real-time or navigate through previous time.
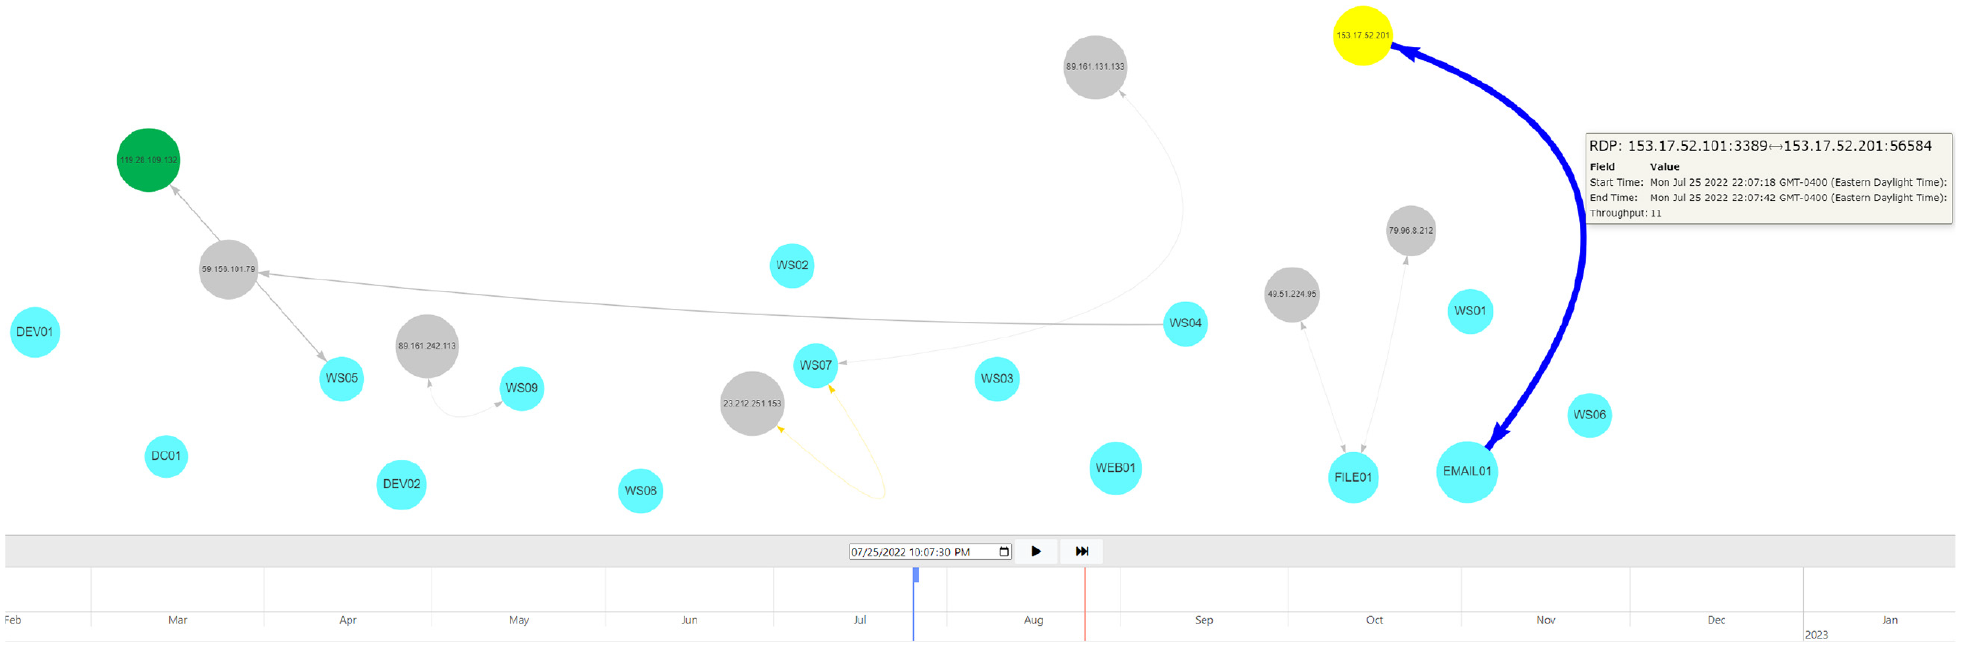
Riverside overview. Snapshot of network flow showing communication by “remote” hosts and internal hosts (agents). Node colors can be changed by a user, and visualization components can be hovered over to show more information about a node or segment of network communication, like the RDP traffic displayed. The timeline at the bottom shows both real-time (solid-line cursor) and user-specified time (block-cursor), allowing a user to dynamically navigate their network in time.
We use animation to visually depict network communication over time. Single view visualizations have been shown to provide faster analysis for analysts, 73 while animated visualizations are more accurate for adjacent time and local pattern analysis. 74 While Riverside provides a singular, big picture view of the network, it is best used to compare network topology snapshots throughout time and allow analysts to correlate network communication with potential IOCs. Animation has been shown to be an effective method for conveying change across two or more charts. 75 Furthermore, Boyandin et al. stated that animated visualizations need to provide both a play button and slider functionality, giving users multiple options for how they interact with the animation. 74 We incorporate both in Riverside, allowing a user to pause, play, fast-forward, and slide through time as shown in the timeline at the bottom of Figure 4. The timeline can also be scaled to allow for finer-grained navigation when dragging the cursor, or the user can pause the visualization and input a time in the box just above the timeline display.
Use cases
Riverside is inspired by the following uses cases drawn from the interview study:
On-site analyst that needs a “big picture” view of their network to provide situational awareness.
Security analyst responding to an incident that needs to determine what portions of the network are potentially impacted through correlation of alerts.
Asset management capability with the need to build out an accurate network map and asset inventory.
With these use cases in mind, we lay out the design and development process of the Riverside system.
Visualization design
Riverside’s visualization provides a single view that changes over time, providing users a simple yet vast interface. We use animated node-link diagrams that update in real-time to address the online problem. 76 Node-link diagrams provide one of the most explicit representations of a network topology and depict information in a way that security analysts can immediately identify visually, as seen with the interview sketches seen in Figures 2 and 3. While node-link diagrams are common among modern network visualizations, they have proven to be an effective visualization technique to for dynamic network graphs. 76 Edges will show a single arrowhead to represent traffic “to” or “from” an agent node, or a two-sided arrow if the traffic is bidirectional, meaning both hosts are communicating with each other (Figure 5).
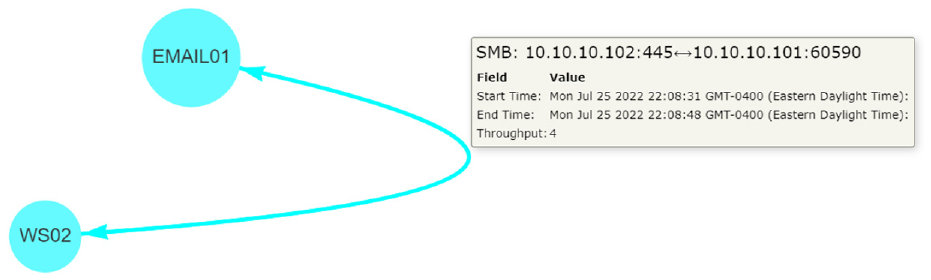
Riverside visualization. This shows two agent nodes (EMAIL01, WS02) communicating over SMB, showing bidirectional traffic between the two.
Additionally, we address the transition problem and aspects of change blindness 77 through animated, temporal navigation. 76 Throughput is used to change edge thickness based on the amount of traffic, and node transparency decreases as communication occurs to show hosts that are communicated with more frequently so that analysts are drawn to “new” or less frequent network communication. Other methods in animated temporal navigation have used staged transitions 78 or graph morphing to preserve mental mappings during transitions, 79 but these methods have had varying success in practice. Riverside’s animations are a time-to-time mapping to assist with temporal navigation, which provides real-time updates to combat the online problem, giving an analyst immediate insights into their network. We allow users to alter the visual encodings of nodes through various visual channels, such as shapes, hues (color), and labels to create a special-purpose layout 76 enabling them to track or ignore specific components through time. Edges are colored automatically based on their network traffic protocol, defaulting to gray edges for traffic that cannot be categorized beyond the transport layer.
Riverside was purpose-built to encompass the themes identified through our interviews and incorporate common features requested from our interview participants, while maintaining a clean and user-friendly interface. Table 5 lists the features that were inspired directly from out interview study. We were not yet able to implement every feature requested by interview participants, but we were able to include many of the user-specified customization features, which was in line with our thematic analysis results and user-centered design.
Riverside features.
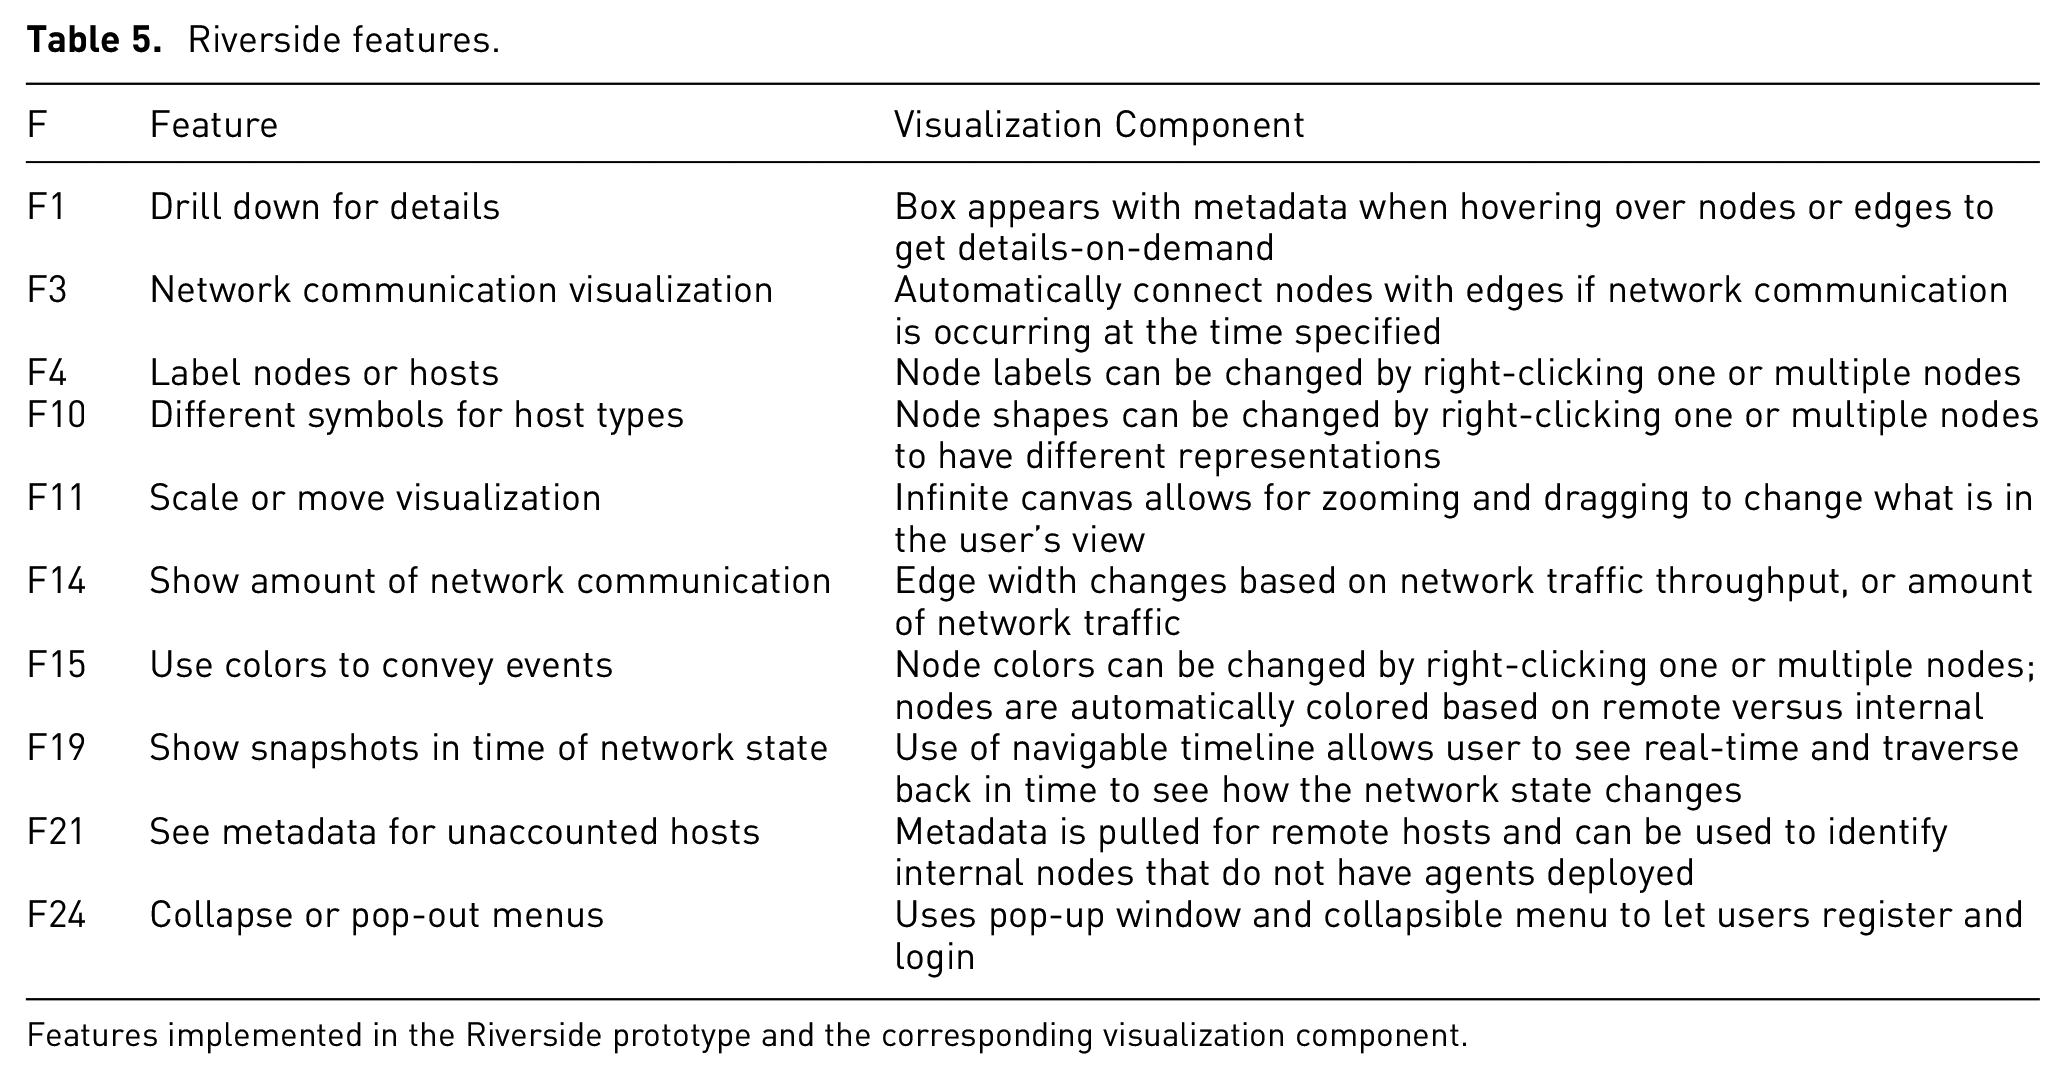
Features implemented in the Riverside prototype and the corresponding visualization component.
User-centered design
In addition to the visualization features, we used the themes uncovered during our interviews as overarching guides for the initial design and architecture of Riverside. We worked to address some of the challenges participants faced with their capabilities, particularly that the tool can be used in varying environments and is adaptive to a user’s needs. Riverside was designed as a web-based tool to ensure compatibility across different operating systems and environments. We use a simple interface so as to not overwhelm users while incorporating several user-customization components for Riverside’s layout.
Since participants felt that visualizations could help paint a picture when explaining a network incident to higher-level leadership or other analysts, we wanted to make sure that the visual component was simple and told a story. We incorporated an infinite canvas that provides a straightforward overview technicians can use when showcasing their results to a less technical audience. Last, we wanted to highlight the themes “Visualizations are not the end all be all” and “Data doesn’t lie.” While visualizations can provide multiple use cases, including those mentioned above, they are not the only tool that security analysts use and that likely will not change. Riverside was developed with the goal of aiding the cyber-SA security analysts have of their environments and augmenting current network security capabilities.
Implementation
An overview of Riverside’s system architecture is shown in Figure 6. Riverside uses a client-server model with agents that send network traffic to the server as they receive it using RPCs with Golang protocol buffers for structuring and serializing the data. The server then batches the data in two second windows and uses WebSockets 80 to send data in real-time to the frontend visualization. Session management is handled using an HTTP web framework with a backend API.
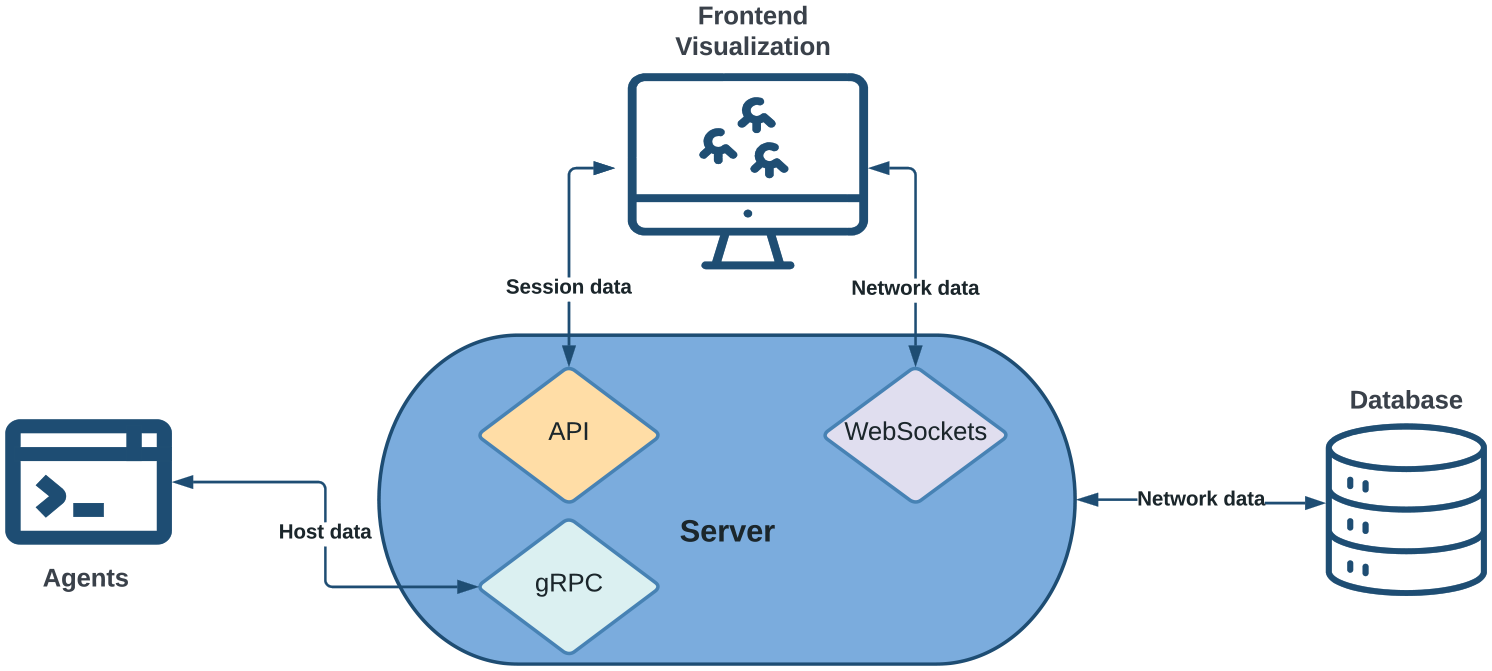
Riverside system architecture. Agents are installed on internal hosts that send network flow data to the server as they see it. The server stores the data in a separate database. The frontend visualization uses Websockets to communicate with the server to ensure real-time updates. Session management is handled using an external API.
While the frontend communicates with the server backend to gather data, the functionality of each is distinctly separate (Riverside’s source code is available here: https://github.com/artemis19/riverside). We primarily used the Javascript library vis.js 81 for the frontend visualization layout. The frontend does not directly communicate with the database to limit the number of concurrent lookups and preserve overall performance. Data is batched and sent to the frontend from the server using WebSockets with the Gorilla WebSocket package. 82 On the backend, we use GORM, 83 a Golang ORM library, to handle database entries and lookups.
Finally, we use stand-alone agent and server binaries developed in the Golang programing language 84 for monitoring hosts. The agents listen on its available network interfaces and sends traffic to the server as the agent receives it (Agents require root or administrator privileges to collect host network data.). This is done using a client-side streaming gRPC with defined protocol buffers 85 for handling sent and received data. The server is responsible for storing the necessary information in the database as it receives data from agents.
User study
We evaluated cyber-SA in Riverside using Endsley’s class “3 Level” model of situation awareness. 28 Here we describe the method; the following section presents ours results.
Methods
Using the four user-centered information visualization evaluation guidelines given by Freitas et al. ., 12 we chose the context for our study to be an incident response scenario. Our user persona was a cybersecurity analyst, 6 and we used prior research to guide the tasks that participants were asked to complete. We focused largely on situation awareness and correlation analysis for incident response tasks to guide our scenario, as those are two primary use cases for Riverside.
Scenario
The scenario was developed by the first author, who is a cybersecurity professional with first-hand experience of network monitoring. The scenario was designed to be plausible and representative of tasks that such a professional may encounter on a regular basis. Our scenario breaks down cyber-SA into three levels as follows:
We deployed Riverside on an internet accessible Digital Ocean droplet with pre-captured network data to perform our user study. We used a Qualtrics form to capture user responses and feedback. We then created and deployed a small test network of 15 hosts using containerization and custom bash scripts to generate traffic (The source code for our attack scenario is located here: https://github.com/artemis19/riverside_scenario.). Using these scripts, we simulated a realistic attack on the network, loosely modeled after the tactics, techniques, and procedures (TTPs) outlined in the MITRE ATT&CK framework 86 as seen in Table 6. This ensured accurate attack timing across all participant sessions to establish a consistent baseline for every participant trial.
Scenario components mapped to MITRE ATT&CK Techniques.
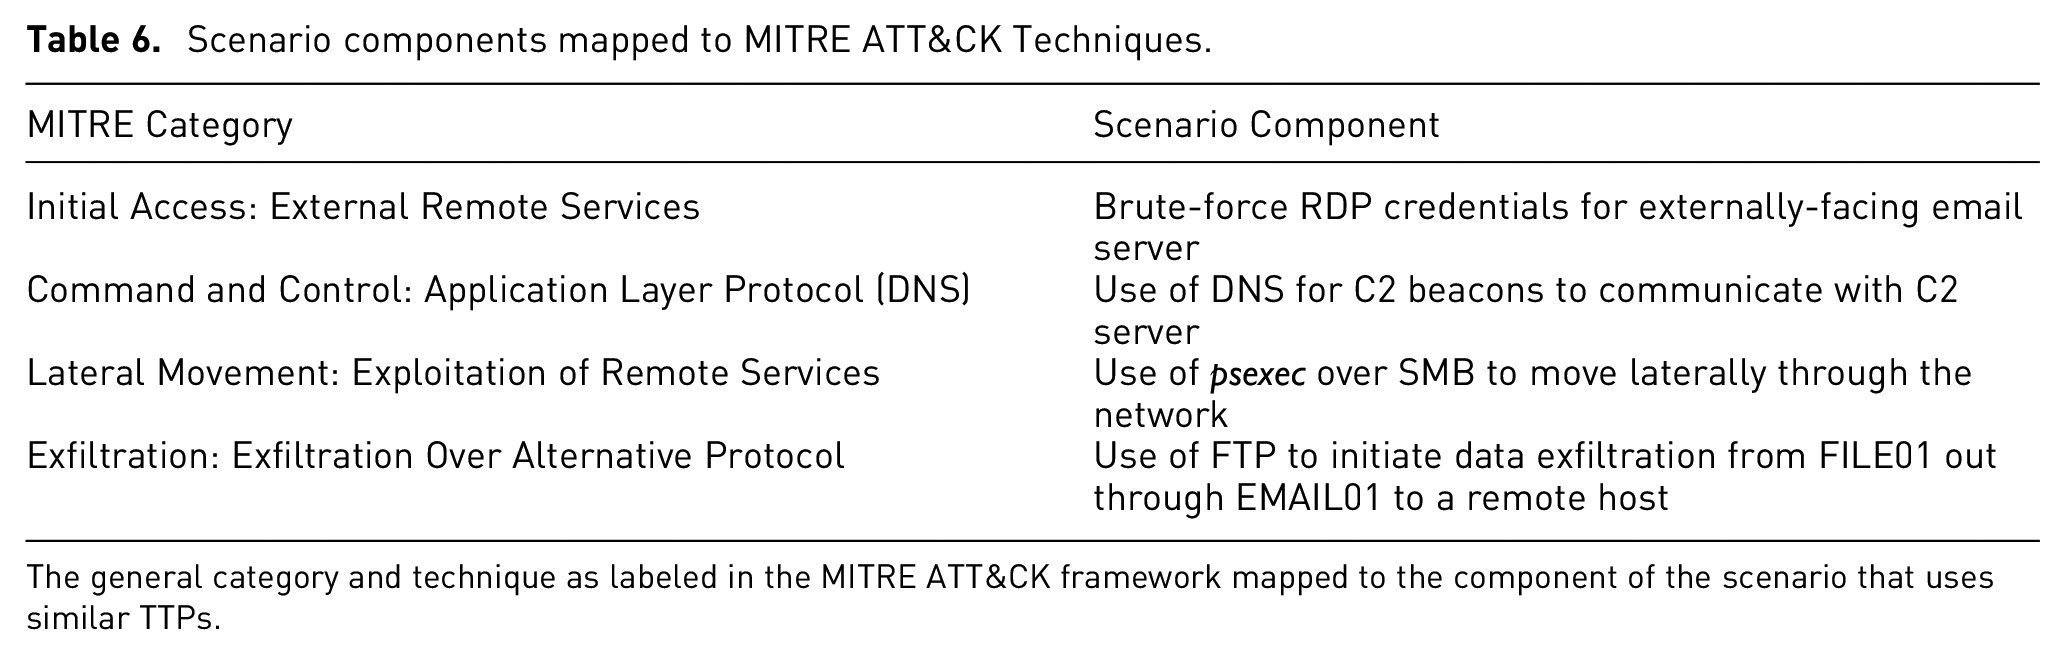
The general category and technique as labeled in the MITRE ATT&CK framework mapped to the component of the scenario that uses similar TTPs.
Scenario attack
The attack chain begins with RDP-bruteforcing a login to the email server, EMAIL01, as initial access. A second remote host acts as a command & control server (C2) and establishes a beacon on EMAIL01 over DNS. The “attacker” then performs lateral movement over SMB to WS02 then to WS03 and finally FILE01. In between the lateral movement, the C2 server establishes beacons on each compromised host, all over DNS as seen in Figure 7. The last piece of the attack chain was data exfiltration, which originated from FILE01, flowed through EMAIL01, and was exfiltrated from the network to a third remote host, part of which can be seen in Figure 8. All of the remote hosts used the same first octet, “153,” for their IP addresses.
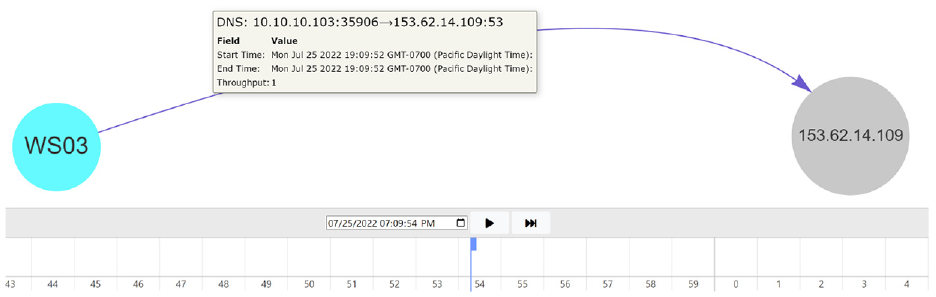
C2 beaconing in scenario. The remote host, 153.62.14.109, is the C2 server that establishes beacons on each compromised host over DNS.
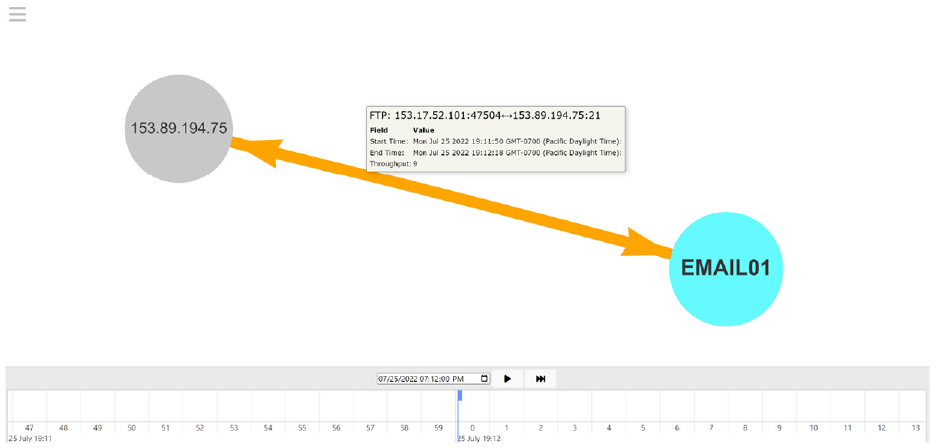
Data exfiltration in scenario. The initial data exfiltration starts from FILE01 as is pushed through EMAIL01, the attacker’s internal pivot point, and out to the malicious remote host, 153.89.194.75.
Incident response use case
The scenario starts with alerting the analyst that there was suspicious activity on a user’s workstation which was reported to the IT shop. It is then their job to use the Riverside tool to investigate the network traffic around the time of the alert and determine the full attack chain by answering questions and performing tasks along the way. The initial visual displayed to participants is shown in Figure 9. The scenario ends asking participants to summarize the entire attack chain and state what they would do next as as part of their processes and procedures as a security analyst. In addition to the required tasks, we had users interact with certain parts of Riverside’s design, like node customization, to show how Riverside can help users track certain network components during an incident investigation.
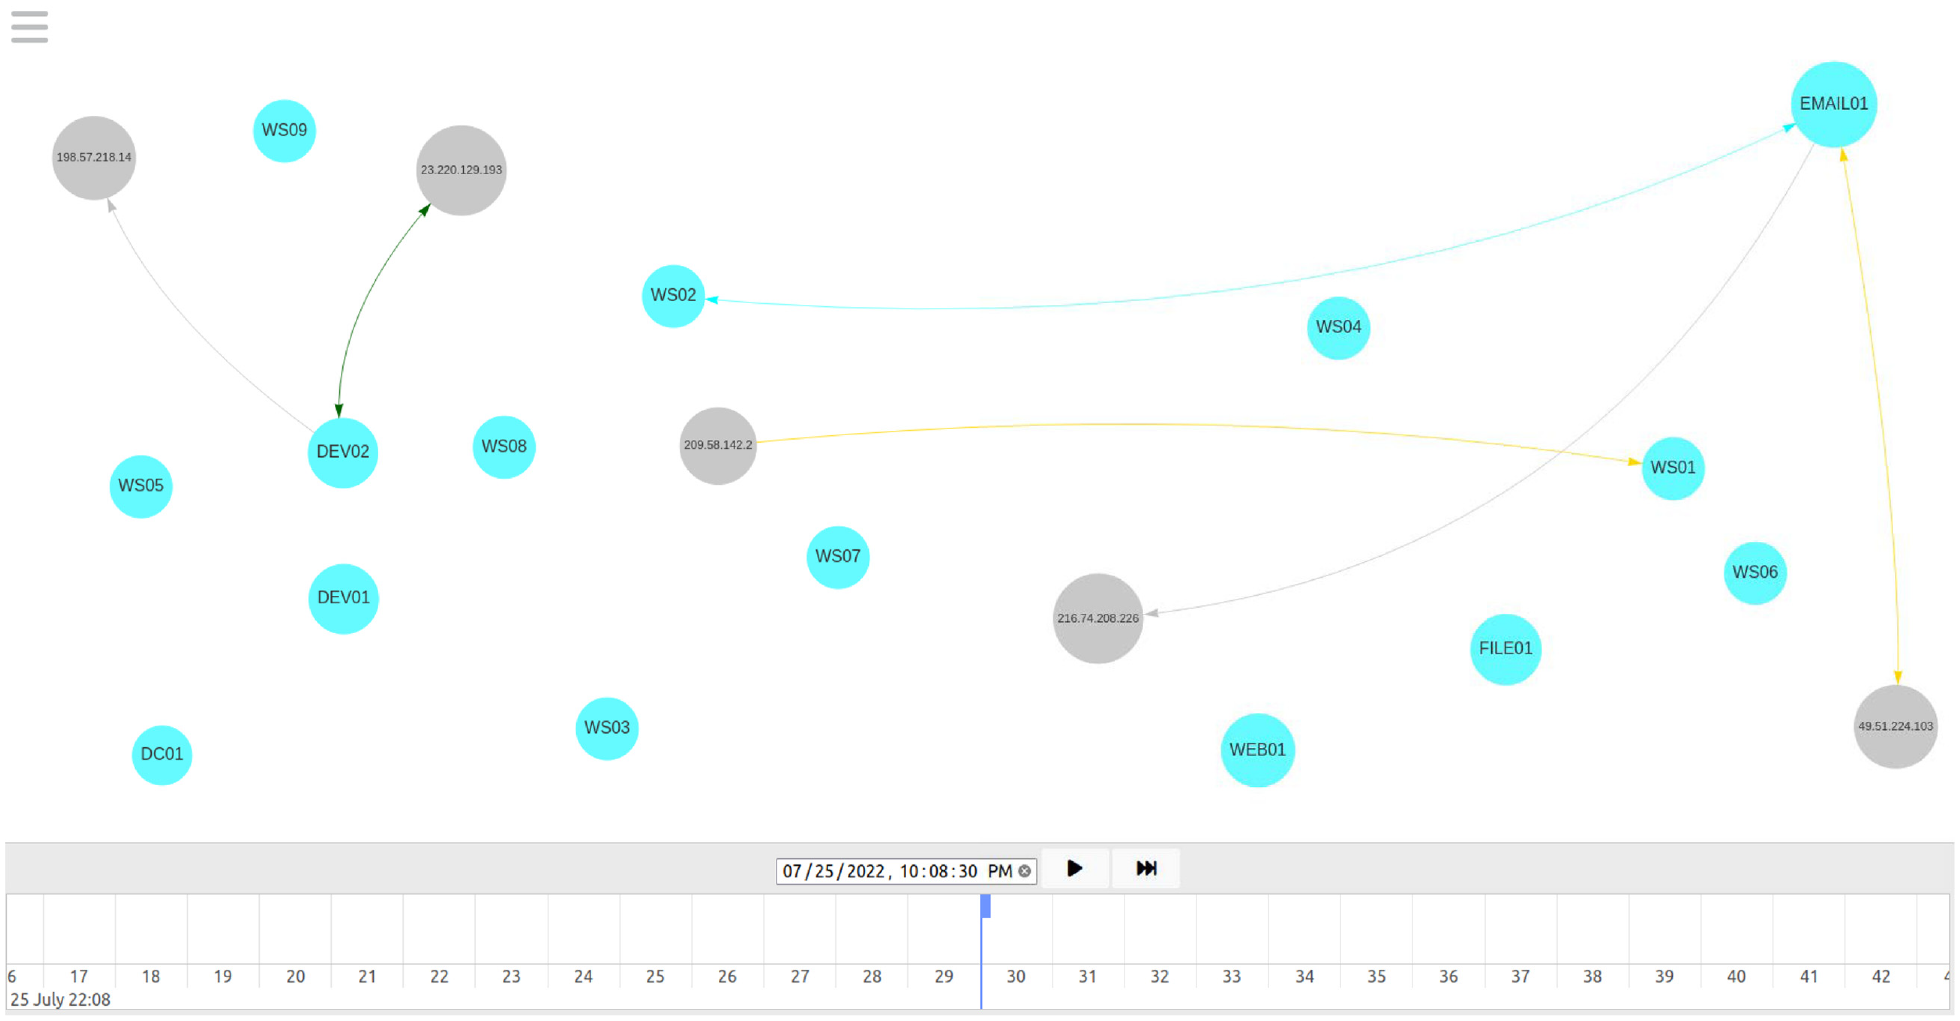
Initial Riverside visualization for user study scenario. The first visualization users will see when they navigate to the time reported in the scenario prompt. WS02 is the reported workstation and at this time, it is currently communicating with EMAIL01.
Participants
We recruited participants using snowball sampling through university IT departments and personal networks. We wanted to ensure our participants represented real-world users of Riverside, so our participants were restricted to security professionals who perform network security or IR tasks in some capacity. We recruited participants during August 2022 and completed all 10 user trials throughout August and September 2022. We refer to participants with an “S” and their associated identification number, and questions with a “Q” and the respective task or question number.
Table 7 contains demographics for our 10 participants, including gender, years of experience in the security industry, age, and highest level of education completed. Our participants were fairly well educated with an average age of 33. The majority of our participants identified as male with an average professional experience of 9 years in security.
User study participant demographics.
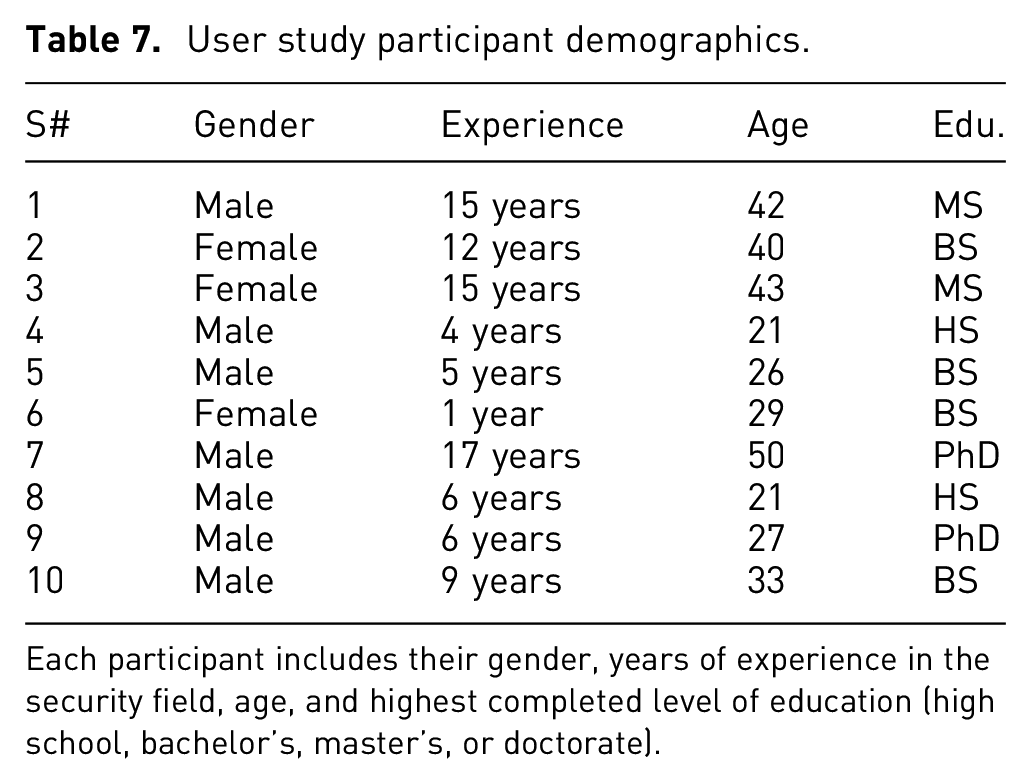
Each participant includes their gender, years of experience in the security field, age, and highest completed level of education (high school, bachelor’s, master’s, or doctorate).
Procedure
We used a script so that each participant was verbally provided the same overview. The Qualtrics form contained a 6-min instructional video showcasing Riverside’s features along with a PDF overview that participants could download and reference for the remainder of the study. We told participants that we could not answer any questions about the scenario or the tasks they were required to perform. Participants were allowed to ask questions if they had any usability issues with the tool that prevented them from performing the required tasks.
Results
Below we report on the quantitative and qualitative results for our in-depth evaluation of the Riverside prototype. Note that detailed results can be found on our OSF site: https://osf.io/edjmu/
Quantitative results
Participants used on average 46 min and 53 s (s.d. 10 min 57 s) to complete all trials. One participant (S7) did not finish the scenario and their time was capped at 60 min.
We used binary scores of 0 or 1 to determine whether a participant successfully completed the required task or not. All of the quantitative tasks were used to calculate completion rates, which included Q1, Q4, Q6-7, and Q9-14 (For tasks that involved entering a timestamp, we allowed a
Quantitatively assessed user study questions and tasks.
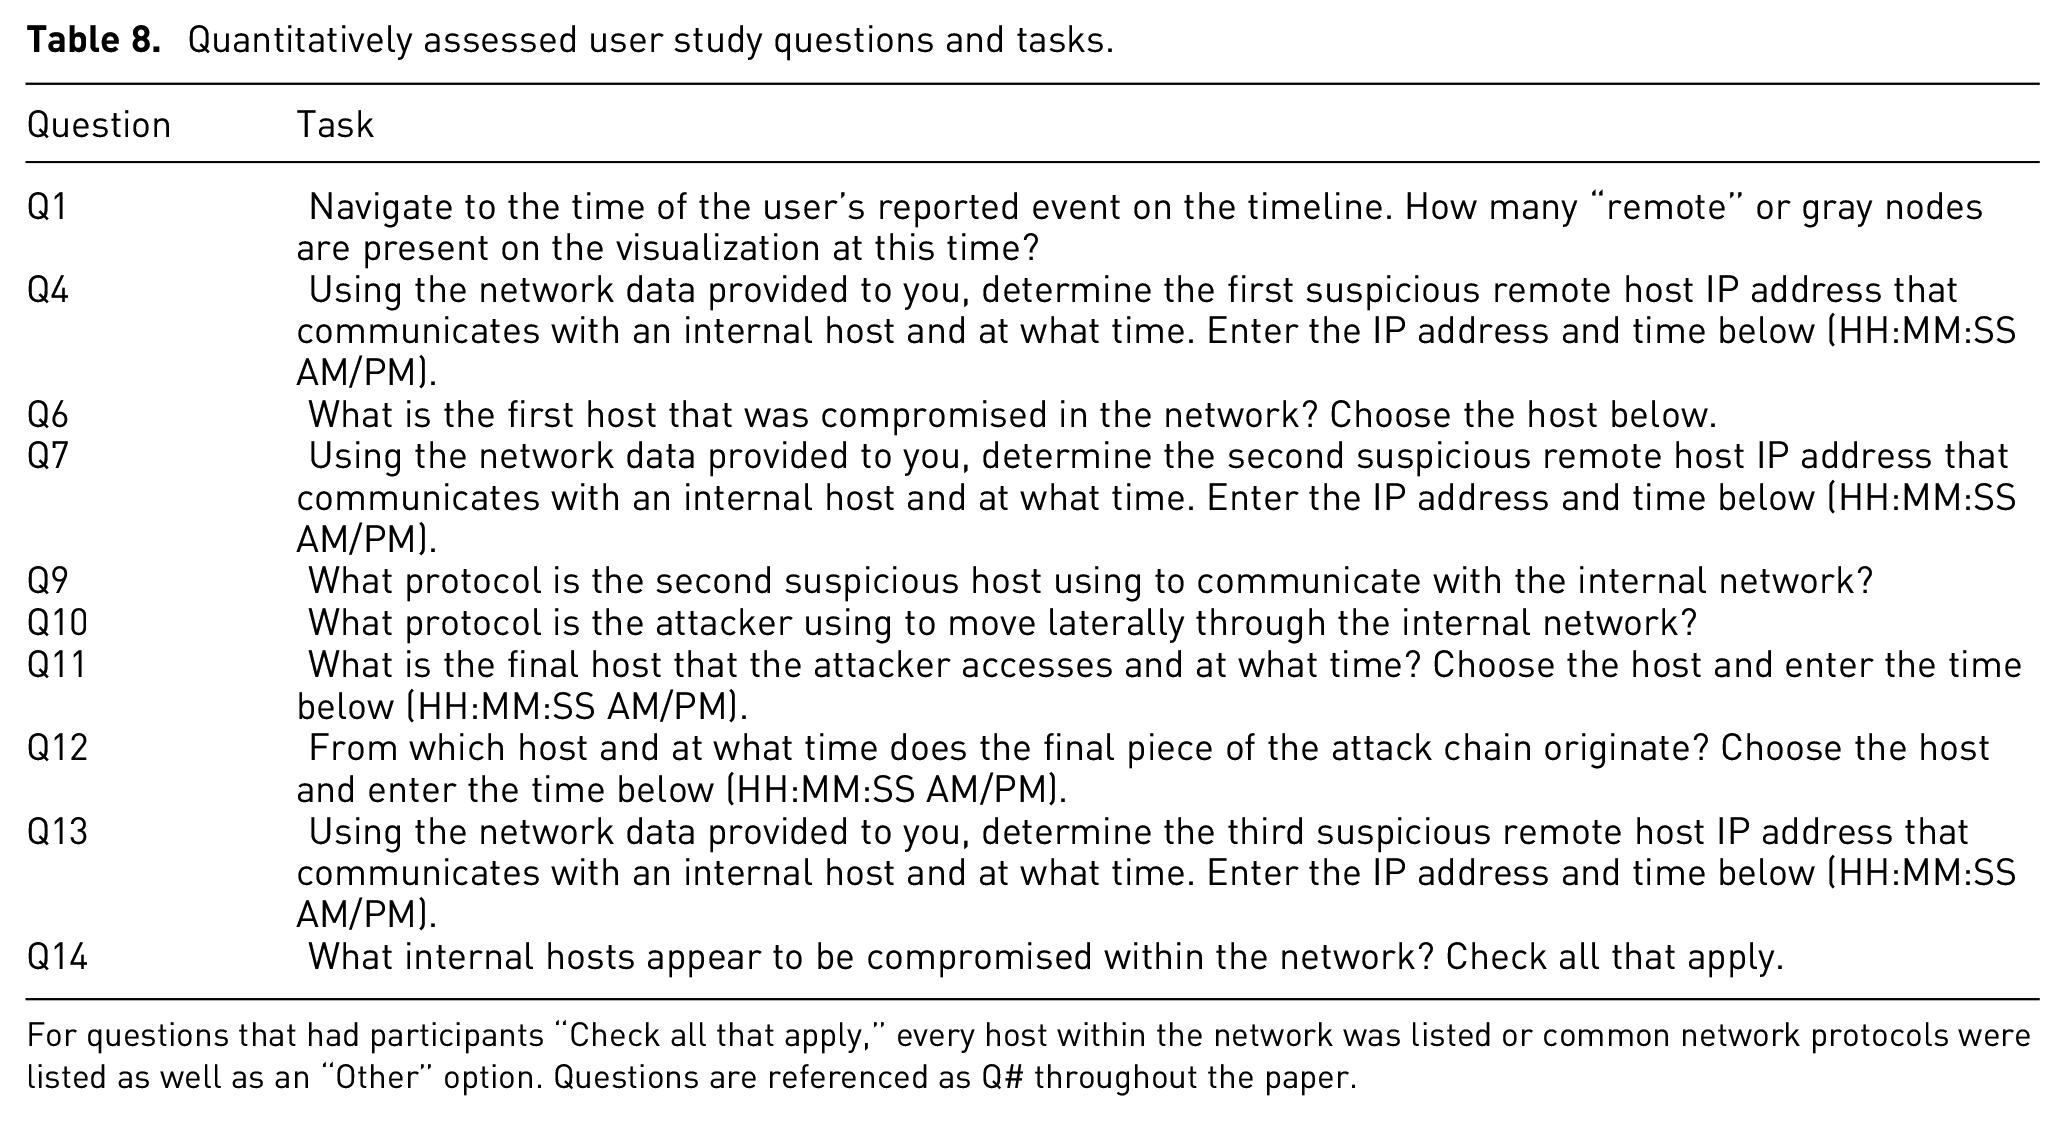
For questions that had participants “Check all that apply,” every host within the network was listed or common network protocols were listed as well as an “Other” option. Questions are referenced as Q# throughout the paper.
The questions not included were qualitative in nature, such as asking a participant what color or shape they chose for a specific host during the scenario. Due to our small sample size
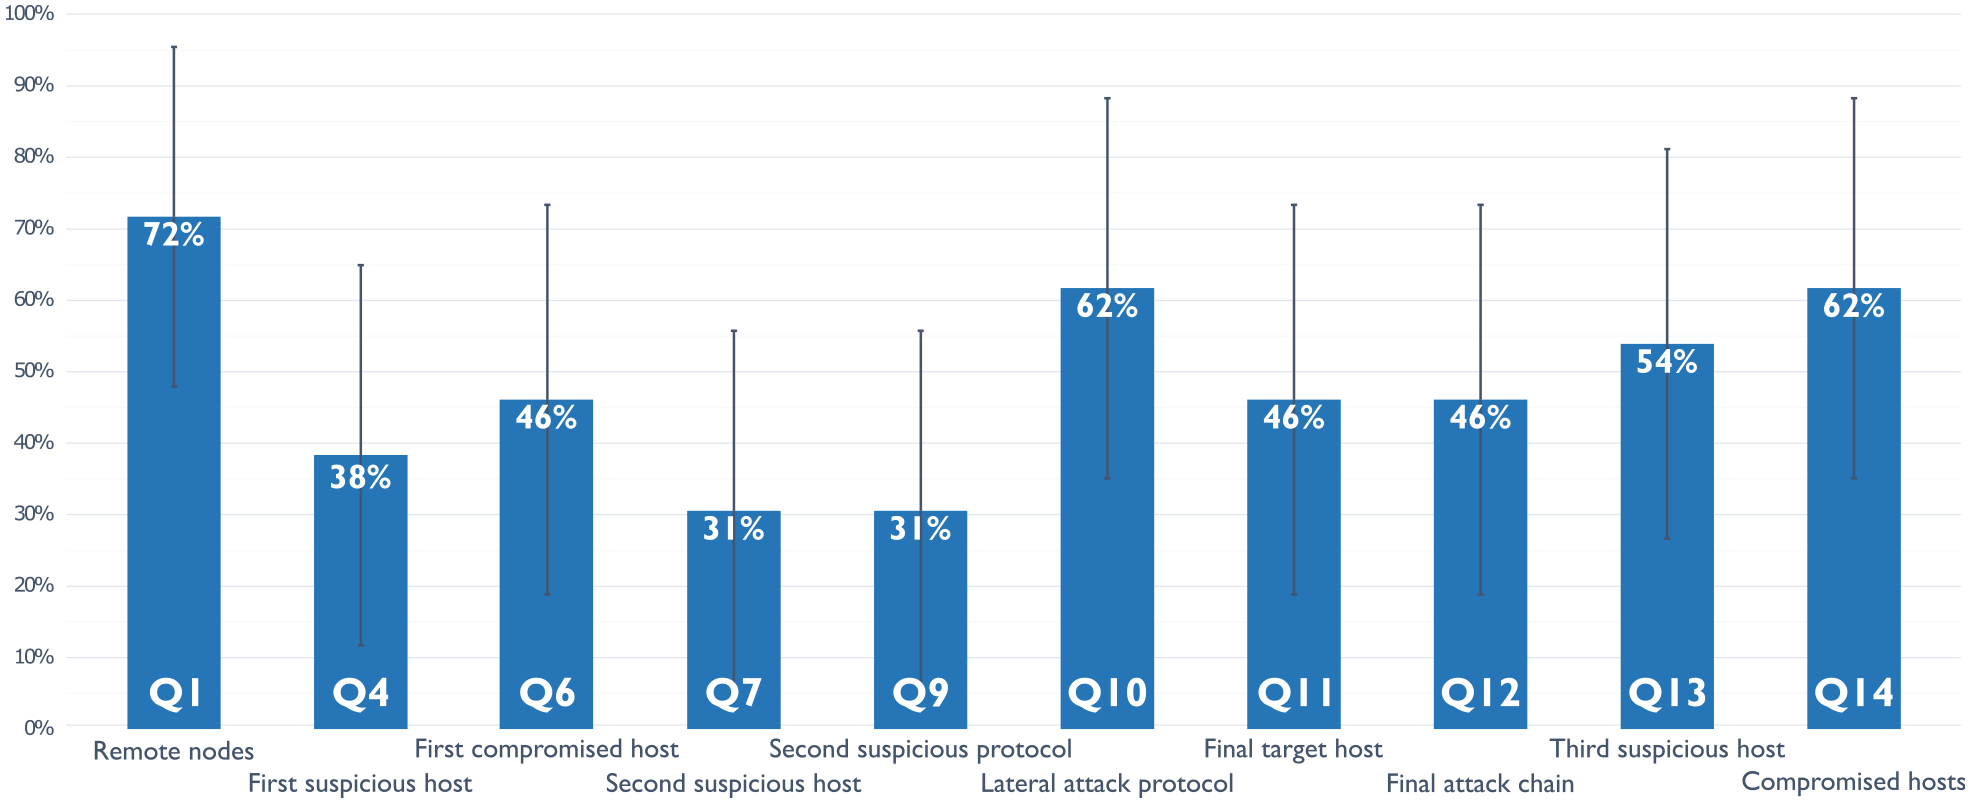
Task completion rates. Each task’s successful completion mean
Overall, participants successfully completed 49% of the tasks. Q1, Q10, and Q14 had the highest completion rate, while Q4, Q7, and Q9 had the lowest with the remainder of tasks hovering just around or under 50% for all participants. The initial RDP compromise of EMAIL01 (Q4) was correctly identified 38% of the time, while participants accurately stated that EMAIL01 was the first host compromised in the network (Q6) 46% of the time. The lateral movement of SMB across the network (Q10) was correctly recognized by 62% of participants. The C2 host (Q7) communicating over DNS (Q9) was only observed 31% of the time.
The data exfiltration portion of the attack was spread out across three questions. Participants were 46% successful in identifying when and where the exfiltration occurred (Q11) and the other internal hosts involved (Q12), while 54% of participants correctly observed when the third suspicious remote host had data exfiltrated (Q13). The second-highest completion rate, tied with Q10, was Q14 where 62% of participants successfully identified the compromised hosts. Our results provide a favorable benchmark for future work in this field.
Cybersecurity situation awareness
We used three questions to qualitatively assess the cyber-SA that Riverside provided to participants as described above. Q3, Q15, and Q16 were used to assess the three levels, respectively. We performed semiquantitative analysis to showcase the relative cyber-SA that our participant pool achieved for certain levels, using key points from our answer key to determine whether a participant completely understood the attack chain or not. We generated the following answers as ground truth:
Perception (Q3): Participants should identify the continuous SMB connections across the network around this time seems unusual, or that the initial alert is indicative of suspicious activity between WS02 and EMAIL01 and should be investigated.
Comprehension (Q15): Participants should have analyzed all relevant traffic and seen that the attacker likely bruteforced RDP credentials for the email server, starting around 10:07:17 PM, ending around 10:07:59 PM from the 153.17.52.201 IP address. The attacker then used 153.62.14.109 as their C2 server to maintain callbacks over DNS after moving laterally to a new host on the network over SMB. They accessed EMAIL01 initially, then moved to WS02, then WS03, and finally FILE01. They then exfiltrated data from FILE01 through EMAIL01 out to the 153.89.194.75 address, starting around 10:11:10 PM, ending around 10:12:20 PM.
Projection (Q16): Participants should recommend something along the lines of correlate IOCs across the rest of the network, block IPs across network, isolate infected hosts, or look up threat intelligence reports about IOCs to see what other TTPs could be present.
Perception
For Q3, participants had varying responses, but overall, 70% of participants (n = 10) did mention something about the continued SMB communication between WS02 and EMAIL01 as a reason to investigate further. Some participants, like S4, were incorrect in their initial assessment and mentioned what they thought was a portion of the attack chain since “at 10:08:37 PM [EDT] WS02 is connected to by a new external host (185.199.111.133) which also connects to a number of other internal hosts all at the same time.” S6 even went on to mention DNS requests outbound toward remote hosts which looks like non-normal behavior, correctly identifying the C2 beacon for WS02, while S10 had identified the anomalous traffic with EMAIL01, specifically the “RDP traffic with some random external IP and also making an SMB connection to a workstation.” Even though S7 did not complete the entire scenario, they did notice some suspicious activity which they mentioned in Q3, such as the “large amount of traffic between WS02 and EMAIL01 shortly after antivirus alert,” and the extended communication “between WS02 and WS03 after a bit longer after antivirus alert.”
Comprehension
Nine out of ten participants identified WS02 and EMAIL01 as compromised in their response for Q15. Only two participants successfully identified every component of the attack chain, including (1) the initial remote access to EMAIL01 over RDP; (2) all three of the correct suspicious remote hosts; (2) lateral movement over SMB; (3) C2 beacons over DNS; (4) data exfiltration that occurred from FILE01 through EMAIL01; (5) four compromised hosts (EMAIL01, WS02, WS03, FILE01); and (6) applicable timestamps for each portion of the attack chain.
Four participants only missed one component of the attack chain. S8 identified everything in the attack chain except the initial RDP compromise and thought that “some TCP-based spray occured with 185.199.111.133 at 7/25/22 10:08:08 PM [EDT],” was the initial compromise since it occurred just before the SMB communication between WS02 and EMAIL01. Participants S5, S6, and S9 only missed identifying the correct C2 server and subsequent beacons over DNS. An example of one of the incorrectly perceived attack chains was given by S3 who believed the initial compromise was a phishing email to EMAIL01, but then claimed the “lateral movement originated from 185.199.111.133 [remote host] across several hosts, starting with the DC01 server at the same time, 22:08:36 [EDT].”
Projection
Most participants suggested appropriate recommendations for Q16, but dependent on their previous answers, they may have suggested that those actions be taken on hosts that weren’t necessarily compromised, such as S1 who said “WS02, DEV01, and DC01 all need to be checked and sanitized. Also an incident report needs to be drafted and a damage assessment done.” In this instance, hosts that were seemingly unaffected would have been taken offline, like DEV01 and DC01, but appropriate remediation such as isolation and a damage assessment were mentioned. S2 stressed the isolation of EMAIL01 as it was the first to be compromised, while S8 stated that “there were several indicators of suspicious activity chained together that strongly suggest a breach, pivot and exfiltration occurred” and recommended contacting an IR team for a more in-depth investigation. Even though S3 did not correctly identify the compromised hosts, they did suggest useful host forensics techniques such as “taking the $MFT” and looking for “file system changes that matched the timeline of the attack to see if there are other integrity issues” that would have helped them confirm or reject their findings.
Likert scale feedback
We gathered feedback using a 5-point Likert scale for Riverside’s ease of use, participant’s experience using Riverside, and Riverside’s efficiency to complete the specified tasks. Figures 11 to 13 contain the results from our feedback questions where participants could respond with “Strongly Disagree,”“Somewhat Disagree,”“Neither Agree nor Disagree,”“Somewhat Agree,” or “Strongly Agree” for each. Overall, participant responses were overwhelmingly positive, and all participants (n = 10) provided responses for the feedback questions.
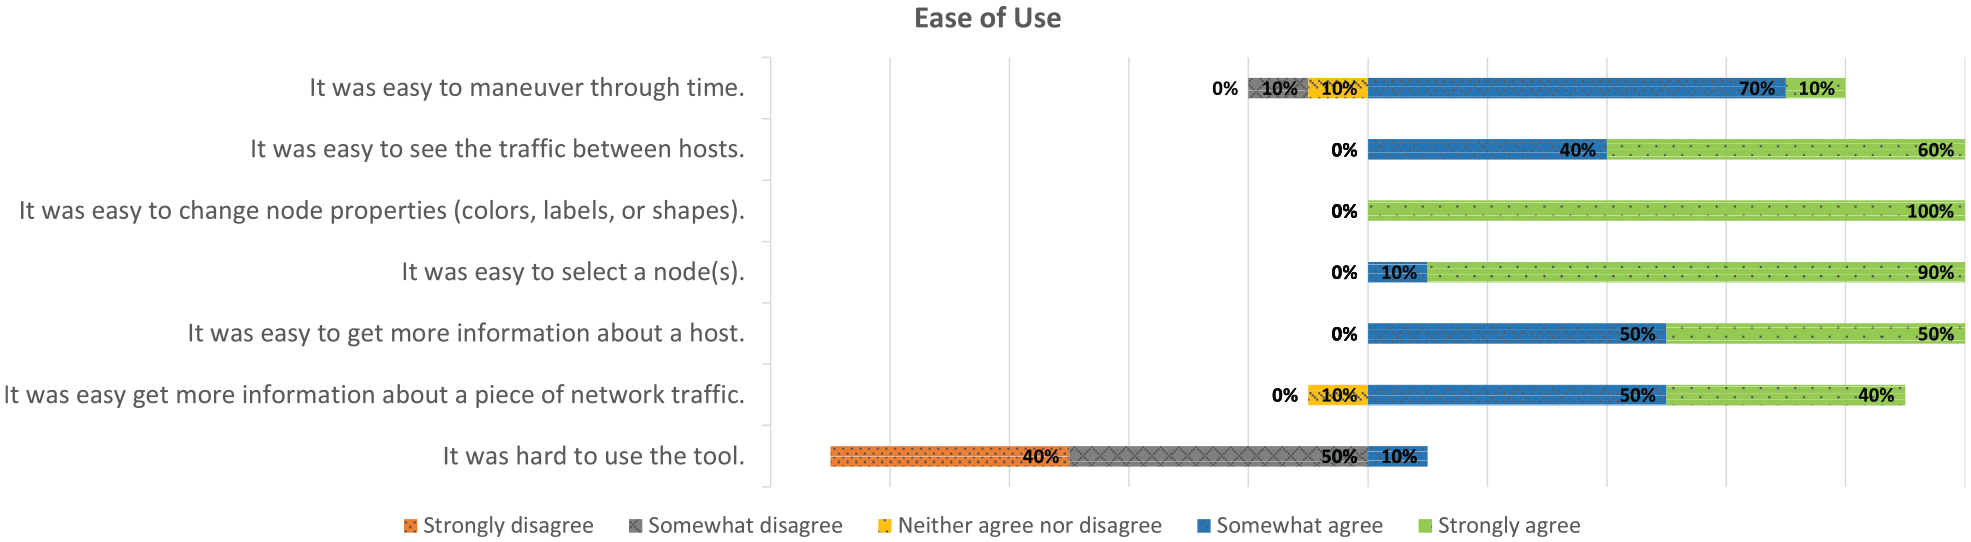
Ease of use. Participant ability to use Riverside, broken down by its components.
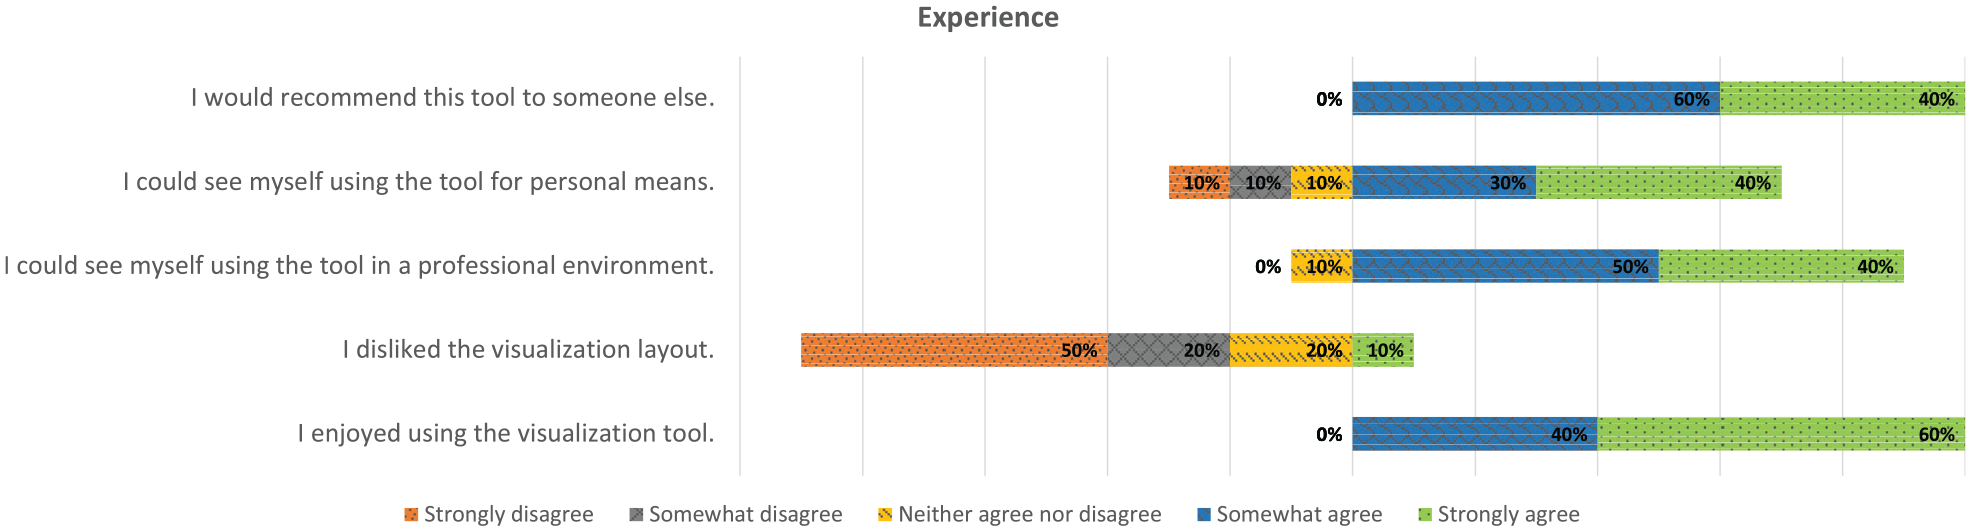
Experience. Participant experience using Riverside while working through the provided scenario.
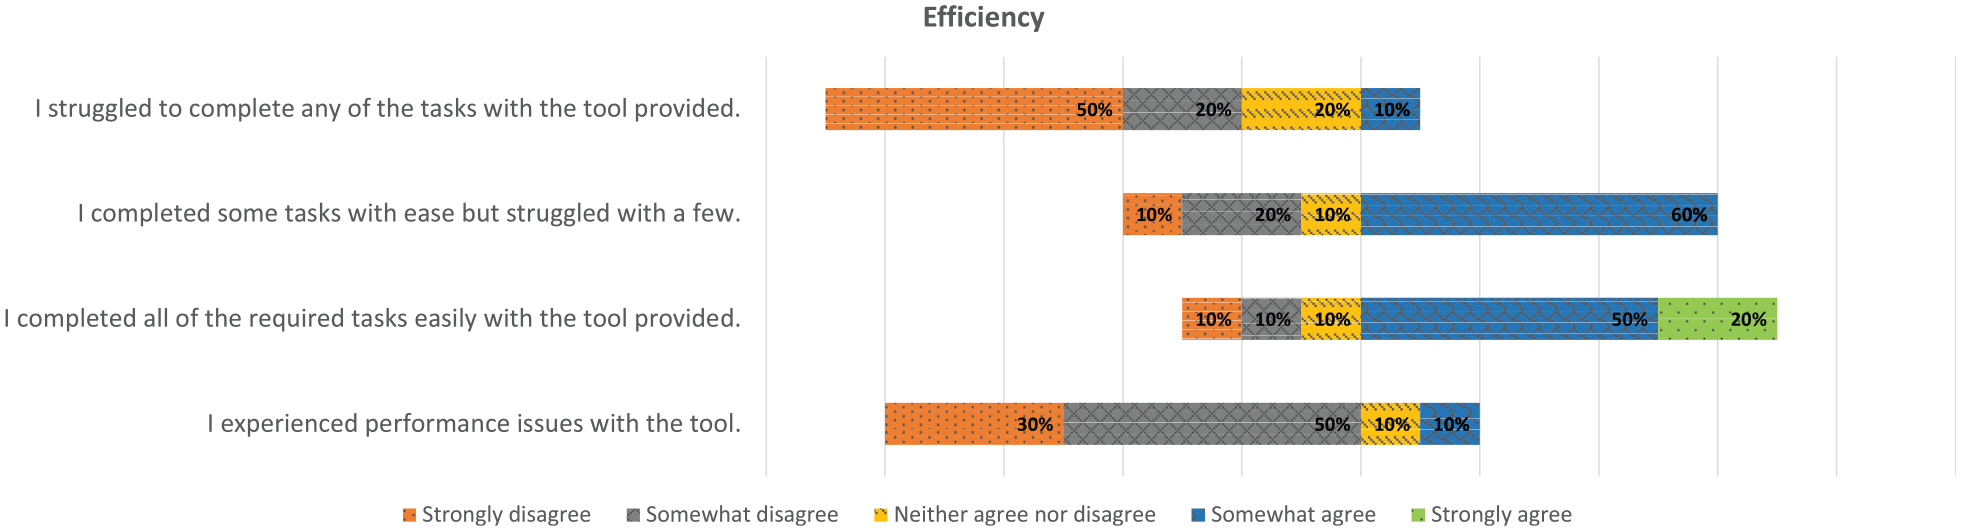
Efficiency. Participant perceived efficiency using Riverside.
Usability issues
There were some usability issues that either slowed participants down when getting started or caused some speed bumps along the way. However, participants said there was nothing inherently wrong with Riverside that prevented them from working through the tasks at hand. Some of the basic usability issues that participants noted was a timezone specifier, because currently the timeline adjusts to local time, but we had the times in the scenario specified as Eastern Daylight Time, causing participants to have to adjust the times mentally depending on their time zone and navigate accordingly. Additionally, a couple of participants noticed that if a specific piece of network communication was repeated later on, as in the same two hosts communicating over the same protocol and ports, the “Created At” timestamp would show the later time rather than the communication currently happening, which was correctly shown in the “Updated At” timestamp. In this instance, we told participants to go off of the current time specified on the timeline, and they were then able to continue. Last, when some participants initially experimented with zooming and panning the canvas, they lost track of the original nodes and were forced to refresh the page.
A few participants struggled to navigate to the initial alert time, in which case we had them confirm what time they had typed in, and in most cases, the participant had simply typed the date in wrong or forgot to specify “PM” and was looking at the correct time but in “AM.”
Qualitative feedback
After participants had completed the feedback questions, we allowed them to provide both written and verbal feedback. Most participants expressed positive feedback, and a common thread across all participants was that they’d never used a visualization that presented the information the way Riverside did, particularly with the timeline component for navigation. S4 said “it would be awesome if we could feed our insights into a visualization tool like [Riverside],” while S5 appreciated that information was collected beyond just internal hosts, unlike other security-oriented visual analysis tools they’ve used.
S2 said the “biggest issue [I] had was scrubbing through the time, at some points I completely lost the time window in question and at other times scrolling along the visualization was “jumpy” and I couldn’t get it to settle where I wanted it.” Participants that experienced this issue suggested that a “home” button for spatial reference or a timeline indicator would have assisted them in reorienting the canvas correctly. Many participants also noted that if they changed a node property early on in the scenario, it took them a bit to find it again. S9 and S7 both said they would have appreciated consistent node placement that provided insight into the logical setup of the network because in Riverside’s current state it “it was not clear how node and edge placement were handled.” A commonly requested features across participants was the ability to pause the timeline immediately upon dragging the blue cursor instead of having to pause and then drag, especially if they had seen something of interest and wanted to “scroll back” to look closer at it. Others desired a way to show the true source and destination, as it would have helped with their understanding of which host initiated certain communications. S7 thought that a legend for the edge colors would be helpful so that users didn’t have to “mentally do the mapping” of the associated ports and protocols.
Participants verbally echoed what the “Ease of Use” feedback questions showed in that they could see themselves using this tool again, and that Riverside was very “easy to use” and “intuitive.” S1 had an interesting recommendation of being able to export a video from specified times, so they could include it in a presentation for superiors. Additionally, several participants specifically mentioned how that they could see Riverside being useful for correlation of alerts in tandem with other tools or incident investigation mechanisms to “get the big picture view of what’s going on.” Some of the “quality of life” feedback was having the ability to copy-and-paste times, node metadata, and traffic communication, so that they could easily perform lookups in other capabilities. Participants also said that having a rewind button in addition to a fast-forward option would have been helpful, as well as being able to set the playback speed of the timeline.
Discussion
Here we explain and generalize these findings and their implications for visualizations for cyber-SA.
Explaining the results
The hardest tasks for participants appeared to be Q4, Q7, and Q9, all of which were below 40%. These questions correlate with identifying the initial malicious host, the C2 host, and the protocol used for beaconing. We think these questions gave participants issues because Q4 required participants to go back in time before the initial alert time, which might have caused some confusion. Additionally, we don’t know if all participants noticed that EMAIL01 had an external interface, which was meant to simulate an externally-facing email server. If they had noticed this, then maybe the initial RDP communication would have stood out compared to other remote hosts communicating with EMAIL01, as it was only the continued connection throughout the entire scenario between EMAIL01 and a remote host.
Since Q7 and Q9 were directly related, it should make sense that they had the same completion rate. Additionally, the C2 beacon over DNS was not as long and “obvious” as the SMB communication, so it was probably harder for participants to narrow in on that traffic, especially when that communication first happened. A common answer that participants provided as an alternative C2 remote host (Q7) was 185.199.111.133, because it communicated with a large portion of the network over ICMP shortly after the initial alert provided in the scenario. In hindsight, that is arguably suspicious traffic, but it also only happened once and did not occur after the successive lateral movement over SMB. Q10 and Q14 were the second-highest completion rates. This shows that if participants were able to determine SMB as the “indicator” of lateral movement, then they were also able to identify the compromised hosts.
For the overall cyber-SA achieved, the average task completion was on par with the percentage of participants who identified the correct attack chain (Q15) and therefore recommended actions to be taken on the correct hosts within the network (Q16). Almost all participants acknowledged that the initial alert and corresponding SMB traffic led itself to further investigation, but some participants did get themselves off track to start by focusing on something that was potentially not part of the attack chain at all. Participants that did this seemed to have tunnel vision, which can be common among security analysts, especially when they have no other capabilities or personnel to confirm their findings. We observed that some of the participant’s answers for the individual questions didn’t always match what they determined as the attack chain at the end of the exercise. This can be seen with S5 who incorrectly answered Q4 as “185.199.111.133 (10:08:08 PM [EDT]),” but then correctly identified the three suspicious remote hosts and the times that MCA likely occurred on the network when answering Q15 and Q16. This could have been because they didn’t want to go and correct their answers or because they were running out of time and didn’t have the time to go back.
For participant’s overall success using Riverside with the provided scenario, we think it was hard to pinpoint anything specific that caused participant’s performance to be sub-par. S1 expressed the sentiment that “Im sure I got stuff wrong because when theres an attack, everything seems suspicious!” Other participants said that not having that baseline knowledge of the environment they were working in, such as a network map or asset list, was a hindrance. S4 stated that “its hard to know what I should be looking for because this isnt my environment, and I dont have logs to correlate.” Our results showcase that it’s hard to develop all-encompassing visualization tools, and security is a dynamic field that lends itself to having a breadth of capabilities. Last, even though the feedback largely positive, participants completed all of the Likert scale feedback questions without knowing how well they’d performed, so while most participants answered positively with these questions, some might have changed their responses had they known their performance results. In particular, the results for participant’s efficiency were more mixed than the other feedback categories since participants answered these questions without knowing their “success” for the scenario.
Generalizing the results
While our participant pool was small, it was largely representative of the cybersecurity community. Our participants were an average of 33 years old, 70% male, and 30% female, and according to a 2022 survey, the average age of a cybersecurity professional is 42 years old with 78% identifying as male and 22% identifying as female. 87 This supports that our results should generalize to larger populations, as we wouldn’t need to use an adjusted method with a larger population, and task confidence intervals would actually become narrower and more precise. Additionally, we developed a realistic incident response scenario and tied it to a use case that security analysts have to perform on a regular basis: identification and analysis of anomalous network activity. We also constructed our attack chain based on industry standards of common attacker TTPs. While this was a controlled environment, our results showcase the potential for using visuals to aid security analysts in performing correlation analysis, and the need for using realistic scenarios when constructing usability studies.
Additionally, we posit that the compellingly positive feedback on Riverside’s visualization supports our bottom-up approach and can be applied to future cybersecurity visualization development. Maintaining a “simple” and “easy to use” interface is easier for users to digest, compared to the complicated and crowded visuals commonly used in cybersecurity. Security analysts need immediate visuals when balancing numerous alerts and capabilities, which reinforces the need to “display all facets of an environment without user intervention.” Moreover, allowing users to characterize the visualization makes them feel as though it’s theirs and further motivates tool adoption. Going back to some of the capability gaps identified by prior research, participants were able to correctly identify the malicious lateral movement over SMB, 62% of the time, and 70% of participants discussed suspicious SMB connections across the environment when analyzing their perception of the initial network activity. Additionally, 60% of our participants were able to correctly identify all or almost all of the attack chain with just an initial prototype of Riverside, showcasing its potential for augmenting cyber-SA, particularly during a critical event such as an incident response case.
All of the above points underscore the importance of balancing automation with user input, especially when dealing with dynamic data in a technical field. Riverside provides a dynamic visual of a network’s behavior to provide analysts that missing internal baseline. Additionally it ties in the external component of an environment that is necessary to ensuring cyber-SA across the entire domain of an analyst’s responsibility. Additionally, we show the possibilities for using information visualizations to augment cybersecurity capabilities, specifically with the use cases of situational awareness and correlation analysis. Furthermore, incorporating users into the entire lifecycle of a tool will lead to acceptance within the community and increase the chances of integration into a user’s processes and procedures.
Limitations
Our sample size was small, and since we used snowball sampling, we acknowledge that this could have limited our results in establishing a realistic benchmark. However, we did recruit a broad range of participants in terms of background and experience. Additionally, our participants were primed for anomalous behavior on the network, whereas in the real-world, security analysts may just be keeping an eye on things without necessarily hunting for MCA.
Additionally, our scenario was developed collaboratively by us, so question wording or ordering could have impacted our results. For example, originally the answer to Q11 was FILE01 in our answer key, but after reading through some of the participant responses, we noticed that many people answered EMAIL01. After reviewing the question, we realized it was slightly ambiguous through the use of the word “final,” which was originally intended to be the final host compromised, but technically EMAIL01 is the final host accessed by the attacker before data is exfiltrated from the network. We then decided to accept either host with a correct timestamp as a correct answer.
We also used pre-captured network data and did not have participants use the real-time functionality of Riverside. This was done to maintain a repeatable scenario across all participants for accurate analysis. Additionally, an analyst would normally have other tools and personnel at their disposal to confirm their findings, but we required them to complete their tasks alone and using only the Riverside visualization. While most of our analysis was rudimentary, it provides a first cut in analyzing achieved cyber-SA with a cybersecurity visualization.
Conclusion and future work
In this paper, we presented analysis from interviews with 24 network and security professionals which resulted in 14 themes and 24 visualization features mapped to user actions. Using our interview results, we designed an initial prototype a network security visualization tool, Riverside. We then conducted a qualitative user study with Riverside to determine its usability, gather feedback on its current design, and showcase how Riverside can be used to assist security analysts in maintaining cyber-SA of their networks. Riverside’s design received overwhelmingly positive feedback from the user study and participants felt that the user interface was simple, while still allowing them to interact with the visualization in ways that were meaningfully helpful for completing their tasks. Furthermore, despite the fact that Riverside was a prototype when evaluated, participants still managed to complete just under 50% of the usability tasks, and 60% of participants identified all, if not almost all, of the correct attack chain.
Future work is needed for tools such as Riverside to be deployed in a true operational capacity. This includes front-end filtering as well clustering to support scalability and prevent visual clutter. We would also like to add the ability for agents to have a criticality tag that would allow users to filter on types of hosts based on how “important” they are. Last, we want to incorporate node and timeline “staining,” which would perform two functions: (1) add a tag to the timeline when a user interacts with a node and (2) stain a host that a user thinks is “suspicious” to track all other hosts that it communicates with by adding a stain. This would assist users in tracking their actions, as well as showcase the potential impact of a given network incident. Finally, we want to deploy Riverside in an operational environment using the system usability scale 88 to provide a quantitative usability measurement and usage data from practical day-to-day use.