
Abstract
Genealogy studies are growing in popularity, and researchers are increasingly using visualization methods to summarize and communicate their findings. A family tree is a visual representation of family members and their relationships that is commonly used to support the research of a family’s history and publish the results. In some cases, an ancestor may occur in more than one place in the lineage of an individual, which is one of the reasons for the occurrence of consanguineous marriages, that is, marriages between blood relative spouses. Current methods for family tree visualization were not designed to analyze and assess the level of consanguinity in the ancestry of individuals. This paper proposes VisAC, an interactive tool to support the visual analysis of consanguinity in individuals’ ancestry. The inbreeding coefficient is used as a measure of consanguinity. The coefficient corresponds to an estimate of the probability that two alleles (a variant of a given gene) in the DNA were inherited from the same individual. A visualization design and an interactive tool were developed with genealogists’ support. In addition, the feedback collected through a questionnaire about two demo videos and tests with three target users strongly supports the effectiveness of the family tree visual representation and the adequacy of the interactive tool for the exploratory analysis task. Real-world examples are given to illustrate the usefulness of the visualization design, and an example of exploratory analysis is presented to illustrate the use of the interactive tool. In summary, this work formulates the task of visual analysis of consanguinity in ancestors’ trees and proposes VisAC, a new visualization tool to support the task.
Keywords
Introduction
Genealogy research can be defined as acquiring knowledge on who our ancestors were. It is a long-term and challenging task that is gaining increasing popularity. Several free and commercial tools support constructing a family tree, managing the collected information, and communicating findings. The research results are usually made available in the form of written narratives or printed charts, as the standard family tree representation for Charles II of Spain given in Figure 1.
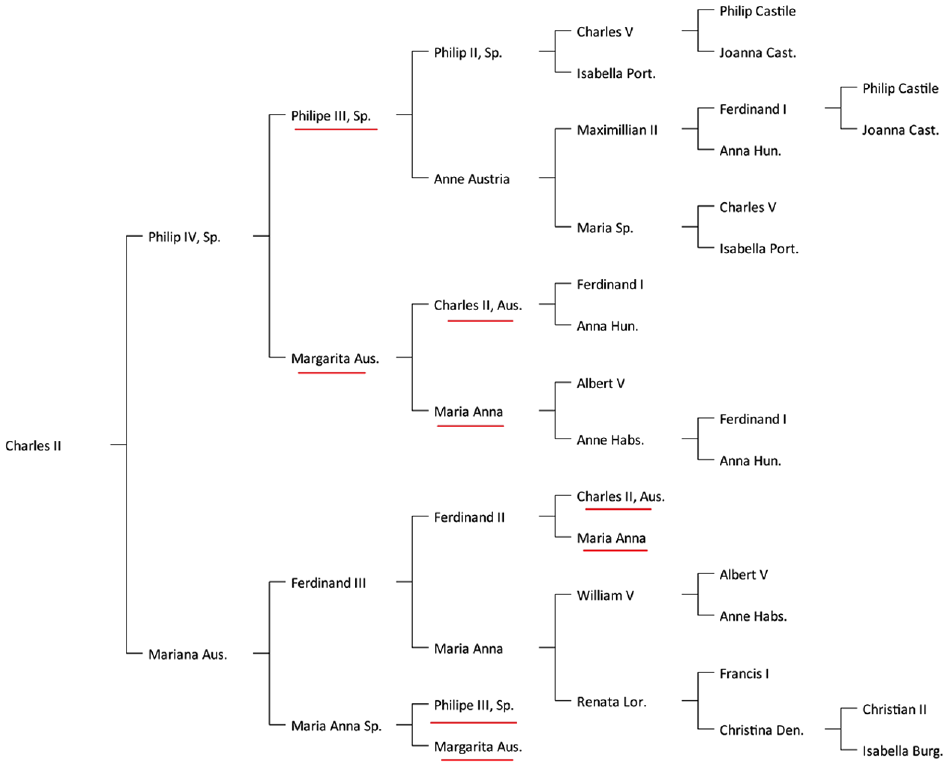
A classic binary family tree for Charles II of Spain’s ancestry representing some common ancestors more than once. The names underlined in red are examples of common ancestors with multiple representations, illustrating the difficulty in assessing the level of inbreeding.
When researching an individual’s ancestry, a family relationship with an ancestor already present in a distinct branch of the family may emerge. We refer to the ancestors that occur in several branches of an individual’s ancestry as the common ancestors, as they are common to the ancestry of several individuals. If correctly identified, a common ancestor has a single record in the software database but, in general, has repeated representations in the family tree as, for example, is the case of Philip III in Figure 1.
When the parents of an individual share a common ancestor, it means that they are blood relatives and, as a result, their children will have a degree of consanguinity. Consanguinity is relatively common in several cultures, particularly in European Royal families. One of the most discussed examples to illustrate the problems associated with a high level of consanguinity is that of Charles II of Spain. He was physically disabled and mentally disturbed, which is suggested to be a result of many consanguineous marriages in his ancestry. He was also infertile, which led to the extinction of the Habsburg dynasty, Alvarez et al. 1 As the number of common ancestors in a family increases, it becomes difficult to keep track of who they are and where they are located in the family tree. The existing methods to manage and visually represent a family tree were not designed to analyze common ancestry and the level of consanguinity in a family. Figure 2 represents a hand-made and, therefore, non-standard representation of Charles II’s family tree.
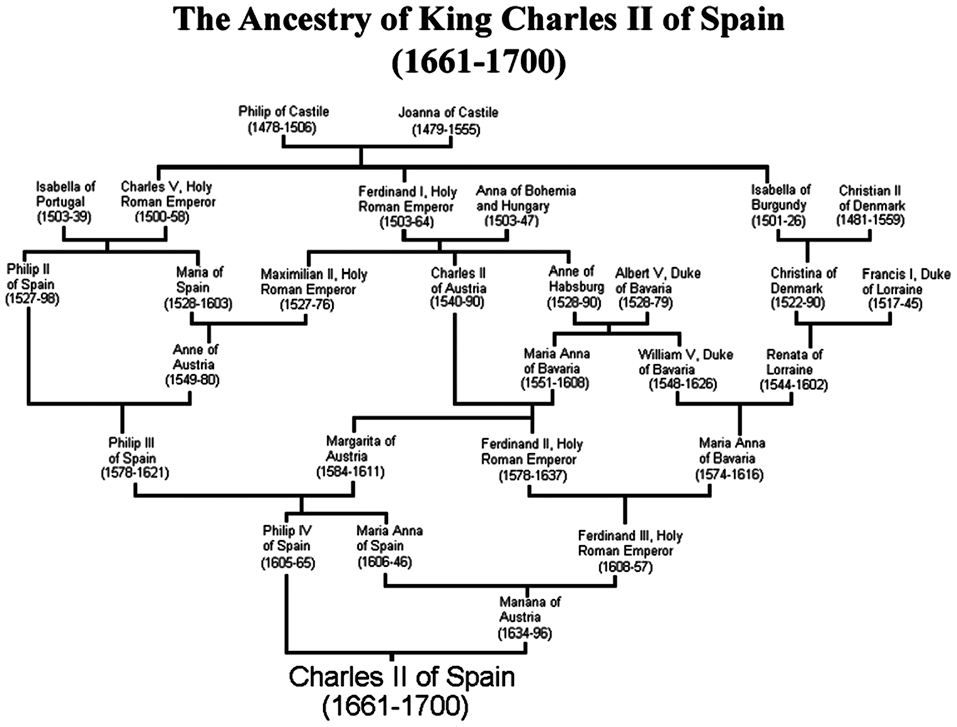
A representation of Charles II ancestry in a non-standard layout in which individuals are placed arbitrarily making it difficult to grasp relationships.
From discussions with users emerged the opportunity to develop a method to aid genealogists in conducting an exploratory analysis on the consanguinity level in individuals’ ancestry. Studies have used descriptive statistics, such as the average and standard deviation of the inbreeding coefficient, to analyze how such values vary across the family tree’s generations (see Wright 2 for details on the coefficient). Such analysis was used to support the conclusion that inbreeding was an important factor in the extinction of the Habsburg dynasty, Alvarez et al. 1 We believe consanguinity analysis is an ill-specified task and, therefore, difficult to address with automated solutions.
This paper presents problem-driven research aiming to develop a visualization design to analyze consanguinity in the ancestry of individuals. It is a work developed in a two-stage research process: (i) developing a visualization design focused on promoting the analysis and identification of consanguinity in a family tree; (ii) developing an interactive tool to support the exploratory analysis of consanguinity.
In the proposed visualization design, the direct ancestors of a selected root individual are represented in a binary tree-like representation. The nodes corresponding to a common ancestor are collapsed, and the paths from each common ancestor to the root individual are highlighted. Labels and symbols indicate existing kinships between parents who are blood relatives and the coefficient of inbreeding of their descendants (used as a measure of consanguinity). The design also considers a two-roots representation to enable the coancestry analysis between any two individuals.
VisAC, an interactive tool that enables configure and interact with the visualization, was developed in R, ggplot2, and Shiny. The genealogy records are provided in standard GEDCOM files (GEDCOM is a standard data structure for storing and exchanging genealogical information). To capture the requirements of domain users, the work was conducted in close collaboration with genealogists. Moreover, the effectiveness of the visualization design and the interactive tool is supported by (i) feedback collected from two demo videos and a questionnaire sent to target users and by (ii) tests in which target users were asked to complete a set of tasks with the tool. Thus, our work:
is the first to tackle the problem of consanguinity analysis using visualization techniques;
presents a visualization design with carefully chosen design options;
presents VisAC, an interactive tool with features specifically designed to support the exploratory nature of the task;
was developed in cooperation with domain users;
provides a well-designed solution that greatly simplifies the genealogist’s complex task of consanguinity analysis, as the feedback collected from questionnaires and tests with users not involved in the development process suggest.
A wide range of examples with real data is presented that aim to illustrate the validity and utility of the design. To the best of our knowledge, it is the first tool designed to support the visual analysis of consanguinity in individuals’ancestry. The feedback obtained from target users supports both its utility and effectiveness for the task.
This paper first reviews related works on visualization designs for genealogical studies. Then, it presents our visualization design. It discusses the domain situation, the target users, and the tasks the design aims to support. It also discusses an abstraction from the domain of the data and user tasks, followed by a discussion of the visual encoding decisions, and the interaction mechanisms. Then, it discusses the evaluation conducted with domain users, the implementation details, and presents an example that illustrates the use of the tool. Finally, it provides concluding remarks, discusses the limitations of the proposed tool, and suggests directions for future work.
Related work
Visualization methods and tools for family studies have been widely used to support medical analysis and study human families’ history, that is, genealogy.
In the context of medical analysis, tools have been proposed to support the visualization of genetic data to help identify genetic patterns within a population or a family. An example is Haploview, Barrett et al., 3 a tool that provides the means to calculate a set of linkage disequilibrium pairwise measures and population haplotype patterns from genotype data, as well as a context-specific graphical representation. In more recent work, Matschiner 4 presents a tool to plot haplotype genealogy graphs in which a method is proposed to collapse similar nodes. The recent work by Nobre et al. 5 presents a visual analysis tool that provides multi-variate tree-like graphs representing one or more families. Data characterizing the clinical context of the individuals are encoded in the tree, enabling the analysis and identification of specific characteristics that occur in multiple families to study its hereditary path.
A pedigree tree or pedigree chart has been defined as a graphic representation of a family’s health history in which the occurrence of a particular disorder is highlighted in the affected individuals, Bennett et al. 6 An example of a tool to draw and visualize a standard pedigree chart is PediDraw, He and Li. 7 More recently, an open-source tool that provides the means to infer family relations from data stored in database management systems and produce the corresponding pedigree tree for a selected family has been proposed in Ranaweera et al. 8
Our work is focused on visualization methods for genealogy. Preece 9 provides an overview of existing software tools to support a genealogist’s research that, in general, provide standard visualization methods for genealogical records providing limited analysis capabilities. One traditional visual representation of family records is the family tree, which represents family relationships in a tree layout that may include an individual’s ancestors and the descendants of all individuals. A particular case is an ancestors’ tree, a binary tree representing a selected root individual’s direct ancestors (or the lineage).
Several works have been published presenting advanced visualization methods for genealogical data. An early example of a work focused on representing a very large family tree in the limited screen space is by McGuffin and Balakrishnan, 10 who propose an interactive method based on a dual-tree scheme. The method aims to arrange the tree nodes to avoid edge crossing and maintain a clear representation of the relations between family members. The ancestors’ tree of the root individual and the descendant tree of a selected ancestor of the same root individual are represented. Another work is by Tuttle et al., 11 which proposes PedVis, a method based on an H-tree layout that uses the display space effectively so that it exploits the intrinsic characteristics of the data. The representation is tied to the binary tree concept, thus, representing the ancestors’ tree of a root individual. The grid-like layout makes it challenging to distinguish generations. Sugiyama et al. 12 propose the WHIteBasE. This alternative method focuses on displaying a family tree so that individuals with complex relations are effectively represented in the restricted screen space. Mařík 13 proposes a method to represent large family trees. The author aims to overcome the limitation of traditional methods, which are adequate when the focus of the analysis is centered on a root individual, and presents a technique that draws a tree to enable properly representing the relationships among interlinked families. An innovative visualization design for family trees that is focused on presenting enhanced details about nuclear families is proposed in Borges. 14
In the pursuit of methods capable of representing very large families in a restricted space, the GeneaQuilts system was proposed by Bezerianos et al., 15 providing a technique based on a matrix representation. The method can avoid link crossings by mapping individuals from the same generation to alternating graph layers to clearly exhibit marriage and parent/children relationships. The interactive implementation allows one to search and navigate very extensive genealogy databases. The drawback is the limited amount of information provided about each individual.
Fancharts present an alternative representation to family trees, in which the central person is represented in an inner circle, and subsequent concentric rings represent the ancestors in each generation. Some authors refer to a fanchart as a Sunburst chart. The work by Zappala 16 proposes a modified fanchart visualization that highlights relatives of the root individual having complete, incomplete, or missing, information. The method’s focus is to help keep track of which ancestors need additional research. Kennard 17 proposes an interactive pan and zoom folding fanchart system that enables to explore the information details while keeping the overall layout of the graph. The system keeps the root individual unchanged to reduce users’ disorientation while using pan and zoom features to enhance the level of detail of particular individuals.
When the focus is analyzing whose individuals were contemporaries, a timeline graph is an adequate representation. Kim et al. 18 propose TimeNets, a time-based representation that depicts individuals as timelines that converge and diverge to represent marriages, divorces, and remarriages. Vertical proximity encodes conjugal relationships. The work by Sachdeva et al. 19 is the first that incorporates temporal information into a tree layout. A radial layout is centered around a selected root node; the corresponding edge length encodes the age difference between a node and the root node.
Mukaliyev 20 proposes a visualization design that integrates the concepts of family tree and timeline using a dual-tree layout that aims to handle big datasets and encode temporal information. In addition, Ball 21 proposes a temporal family-centric tree-like visualization that shows when people lived in relation to other people. The visualization represents family units and their members, enabling a clear identification of from which family an individual came from and of the time when his family lived. Georgelis 22 proposes a tool having three linked visualizations (an ancestors’ tree, a sunburst, and a timeline) that provide a multiperspective visualization of the data available in a standard GEDCOM file. With a different perspective, Shakespear 23 proposed an interactive tool to explore the events in the lifespan of an individual with particular emphasis on geographical movements that are shown in a 3D map of the world.
Recently, Liu et al. 24 proposed a visual analytic system to analyze a family’s history and evolution, providing several distinct perspectives over the data, such as a tree view, a migration view, and a stream view. The system is powerful and provides the ability to explore the data from several perspectives. However, it seems built for a very large, specific, and complex dataset while probably being overly complicated for standard GEDCOM datasets. Similarly, Fu et al. 25 present a system that is specifically designed for a very large real-world non-standard dataset and propose a method to compare family trees and how they differ in ancestral traits over generations.
General propose online tools are becoming widely used by genealogists to store and share their research results, however, to the best of our knowledge, no published works focus on the visual analysis of consanguinity and inbreeding in the ancestry of a selected individual. The work presented in Borges 14 provides a way to represent individuals with multiple occurrences in the tree, but the domain task it supports is different. The tool publicly available created by Lyon 26 presents some similar concepts, as highlighting the paths from one ancestor to the root individual. However, the visualization seems more focused on the interactive mechanisms than on the careful visual encoding of the information to reveal insights about the coancestry between individuals. Figure 3 shows their ancestors’ tree representation for William of Windsor. The dots represent individuals aligned by birth date, given in the y-axis. The common ancestry is indicated by node collapsing. In the figure, the two paths from Charles Bingham to William are highlighted as a result of hoovering the common ancestor’s dot. In addition, it is possible to access the pop-up window showing the kinship between the common ancestor and the root person that corresponds to each of the paths. The DNA contribution from the common ancestor to the root individual is also given. We believe that the representation we propose has a different focus, as can be understood by comparing the tree in Figure 3 to the tree in Figure 12. Our representation enhances the paths to all root individual’s common ancestors and also the individuals in those paths. In addition, the kinships resulting from a common ancestor are indicated as well as the individuals having a non-null inbreeding coefficient that results from the consanguinity. The interactive features designed to support the exploratory analysis of consanguinity, which are described later on, are a fundamental differentiating aspect. Our design is also extended to consider two root individuals.
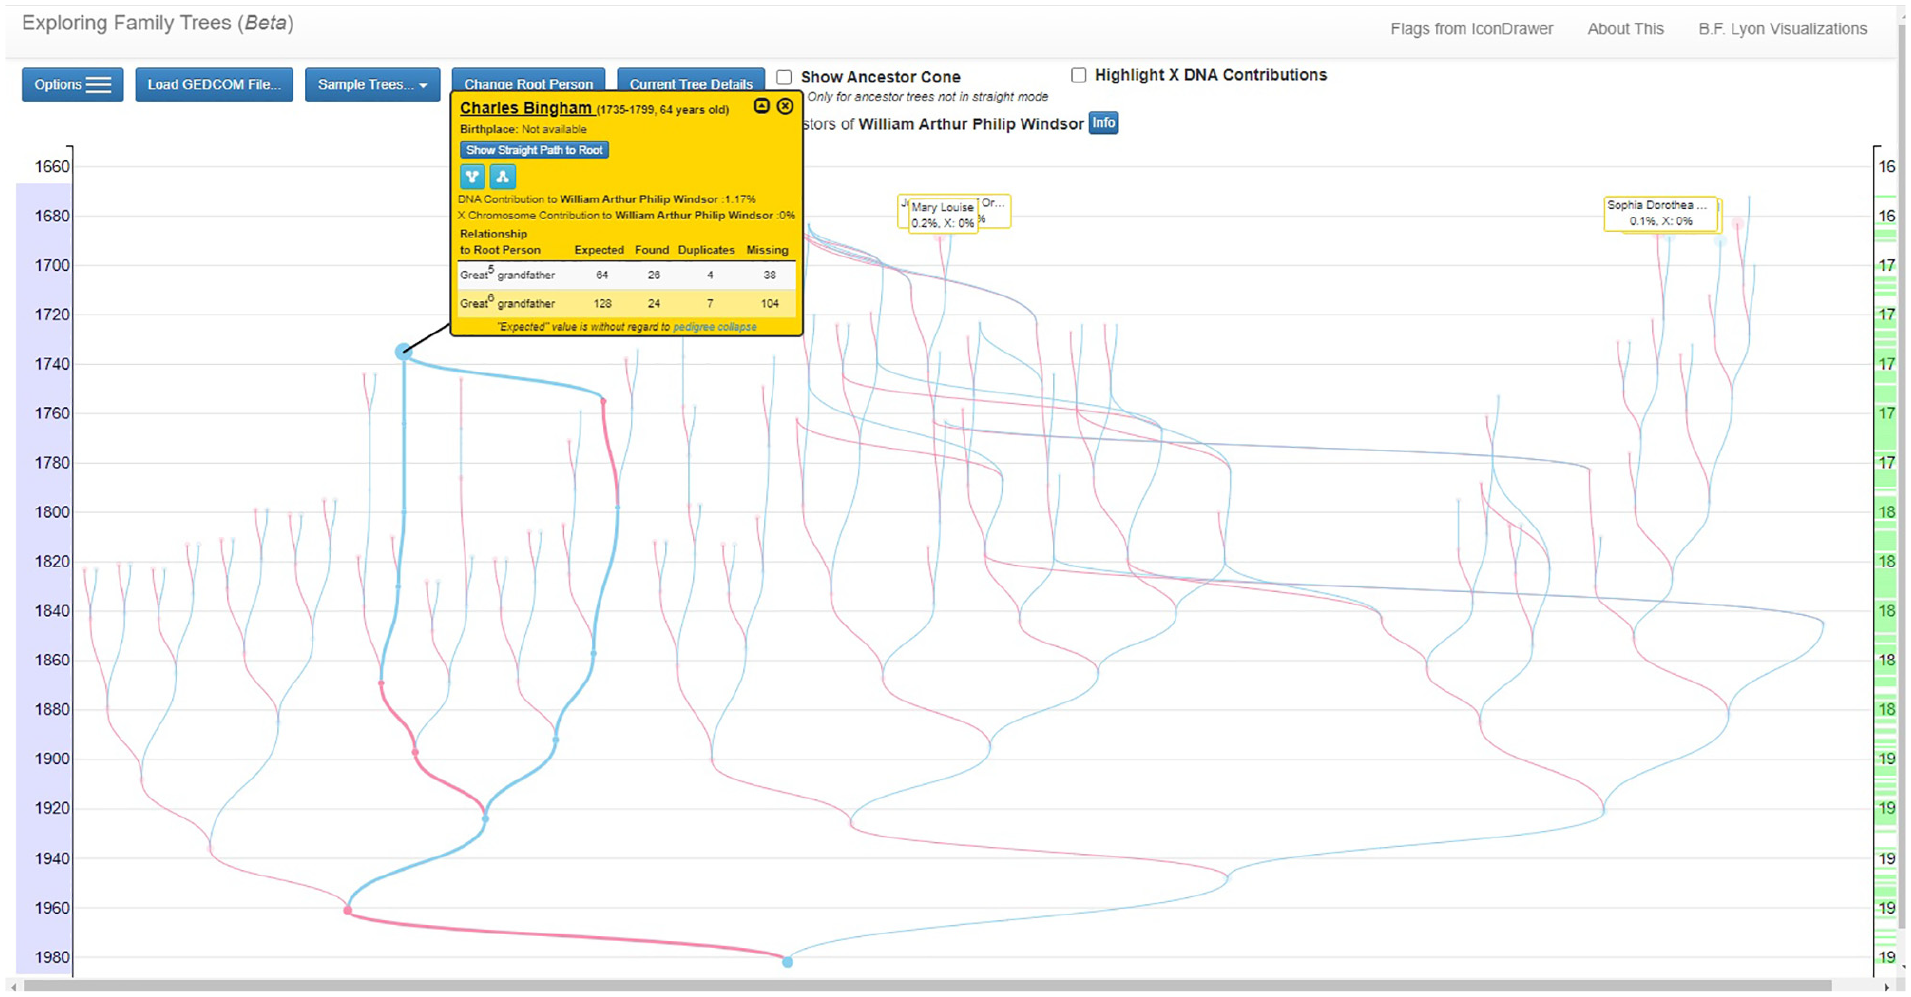
The ancestors’ tree for William of Windsor proposed in Lyon 26 (reproduced with permission from the author).
The VisAC system
We propose a visualization design and an interactive tool developed while closely following the four nested levels for the visualization design process proposed by Munzner. 27 This project results from the author experience as a genealogist and the requirements for the proposed tool result from discussions with fellow genealogists. The need for a method to obtain a clearer view of the ancestors that occur more than once in a family tree and where they are located in the tree was established.
From now on, we use the term family tree to refer to a representation that includes members of a family and the term ancestors’tree to refer to a representation that includes only the direct ancestors of a selected root individual.
Domain description and domain task
Many genealogists use dedicated software tools to manage their genealogical records. With such tools, they can create a family tree by entering the genealogical information of an individual, that is, his/her record. Family relationships are represented by links between the records of related individuals.
A family can be defined in a bottom-up or a top-down sequence. A top-down sequence starts with creating the record for the family founder and the record for his/her spouse/partner, which are linked. Then, the record for each child is created and linked to his/her parents. The children’s marriages are managed similarly. In case a marriage is to be defined with an individual whose record was previously defined in another branch of the family (a common ancestor), the relationship is defined by creating a link to the record of that individual. That way, common ancestors have all their information in a single record in the system.
Software tools for genealogy provide the means to manage the individuals’ records and create written reports and graphical representations of the family tree. In a classic representation, as in Figure 1, there is no clear indication of individuals having duplicate representations (as are the individuals underlined in red). We note that such individuals have a unique record in the software’s database. As a result, while conducting the research, the genealogist gains a sense that some individuals have multiple occurrences and are connected to several other individuals in the family tree. However, due to the long-term task at hand, it is difficult to keep track of where such individuals are in the tree and assess the level of consanguinity in the family with the available mechanisms. That may be of particular importance in the analysis of consanguineous mating, which occurs when the two parents of an individual have ancestors in common. Consanguinity is an issue when discussing, for example, legal issues or genetics.
The Coefficient of Inbreeding has been proposed as a measure of consanguinity between two individuals.
2
Genetic information is stored in DNA, and a gene is defined as a section of DNA. A gene contains two alleles, each inherited from one parent. The inbreeding coefficient corresponds to an estimate of the probability that two alleles at a random location in the DNA are identical by descent, that is, inherited from one common ancestor. An individual’s inbreeding coefficient
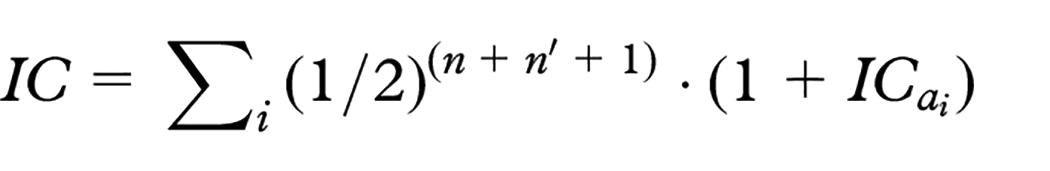
where
The Coefficient of Relationship (CR) is more adequate to measure the consanguinity between any two individuals and has been defined as being twice the inbreeding coefficient that would have a child of the two individuals. 2
The occurrence of inbreeding results in what is referred to as pedigree collapse, which describes how reproduction between two blood-related individuals causes the number of distinct individuals in the ancestors’ tree of their offspring to be smaller than what it could otherwise be. Another consequence of inbreeding is that when the parents of an individual carry similar DNA, the chance of having the same recessive genes responsible for congenital disabilities is significantly increased. As referred before, one of the best-known examples of the dangers of consanguinity and inbreeding is given by the House of Habsburg. Their marital practices led to Carlos Habsburg (also referred to as Charles II of Spain) being so severely deformed that he could not reproduce, resulting in the Habsburg dynasty’s end. Figure 2 shows the ancestry of Charles II in a hand-made, non-generalizable representation, with which it is possible to see a high degree of consanguinity in his lineage. However, it is not easy to understand the degree of kinship among the represented individuals. An alternative standard representation is shown in Figure 1, a classic binary tree in which some individuals are represented several times, as is the case of Philip of Castile, making it difficult to assess the level of inbreeding.
As a result of the above discussion, we identify the target user of our new visualization design as a genealogy researcher interested in the consanguinity assessment of an individual’s ancestry. To that effect, the following domain tasks are defined:
Create an ancestors’ tree representation centered in a selected root individual;
Identify common ancestors in the ancestors’ tree and highlight how close they are from the root individual in what concerns to the number of generations;
Identify individuals who have a non-null inbreeding coefficient, understand their parents’ kinship, and highlight his/her common ancestors;
Change the selected root individual to show the ancestry of an alternative root individual and to support the exploratory nature of the analysis task;
Explore and analyze the degree of consanguinity between any two individuals by enabling to select two, possibly unrelated, root individuals;
Export the graphical representation in a high-definition publishable format.
Data and task abstraction
The visualization is created from the data available in a standard GEDCOM (The GEDCOM 5.5.1 standard http://www.gedcom.org/gedcom.html) file. A parser was implemented to convert the GEDCOM data into a tabular format containing the following information about each individual (see Borges 14 for a description of the parser):
ID; name; and gender;
date of birth; and date of death;
IDs of the parents.
Following Munzner 27 ’s framework, the target user aims to analyze the genealogical data to consume the information and discover new features in that data. The tool aims to provide the means to conduct an exploratory analysis of the genealogical data in search of ancestors having multiple occurrences in an ancestors’ tree and assess the level of consanguinity in the family. The additional task of presenting the findings to fellow genealogists in the form of publishing quality images is also defined.
The consanguinity analysis focuses on a central (or root) individual and his/her direct ancestors (parents, grandparents, great-grandparents, and so on). The direct ancestors are usually represented using a binary tree that is referred to as his/her ancestors’ tree. In such a binary tree, nodes correspond to individuals, and arcs indicate parent-child relationships. The root node of the binary tree corresponds to the root individual.
In a standard ancestors’ tree, an individual occurring more than once, a common ancestor, is represented by more than one node, as illustrated in the tree on the left-hand side of Figure 4 in which the white circles indicate the individuals having multiple occurrences. To highlight inbreeding, we adopt the representation illustrated in the center of the figure, where repeated nodes are collapsed and the corresponding arcs redirected. Alternative representations were considered, such as the represented on the right-hand side of the figure. In the latter, only the closer common ancestors have multiple representations, and a dashed arrow indicates the node duplicate from which the ancestors are connected. The feedback obtained from domain users supported the adoption of the full-collapse representation in the center as being more intuitive for complex trees.
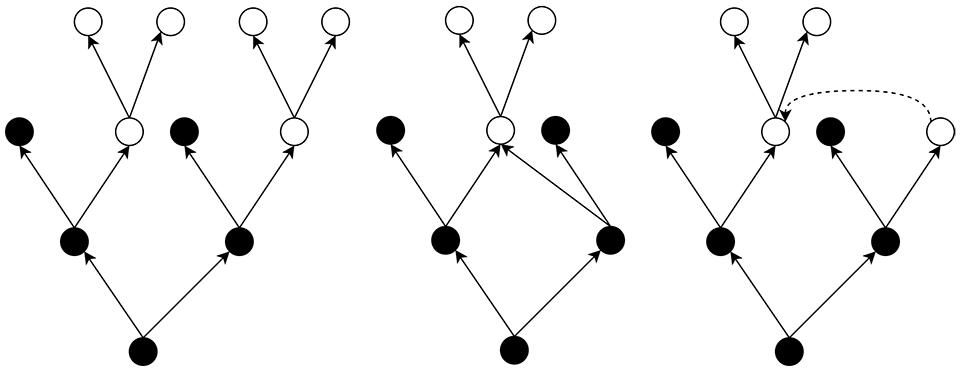
Three alternative considered for the representation of common ancestors (white circles) in an ancestors’ tree. On the left-hand side, a common ancestor has multiple representations; on the center, the chosen representation, every individual is represented only once; and on the right-hand side, only closer common ancestors have multiple representations.
As a result of the collapse of the nodes corresponding to common ancestors, the tree loses some of the characteristics of a standard binary tree. In particular, an ancestor collapse results in a cycle of undirected arcs. Thus, the search for individuals having a non-null inbreeding coefficient can be defined as the task of finding cycles of undirected arcs in the collapsed tree.
Visual encoding
In this section, we discuss the visualization design decisions. As referred in the previous section, due to the collapse of the nodes that correspond to common ancestors, each individual is represented by a unique node in the ancestors’ tree. Therefore, one important decision was representing and encoding a common ancestor. Several alternatives were discussed with domain users, as illustrated by the examples given in Figure 5. The use of color in the arcs was first considered to encode a child-parent relationship to a common ancestor, as in the figure’s example on the left-hand side. Such representation assumes that upward lines correspond to males and downward lines to females. That representation was not considered clear by the users, leading to the inclusion of a shaded triangle aiming to highlight that the blue arcs were child-parent relationships from two distinct children of the same parent, as exemplified by the representation in the middle of Figure 5. The final decision was to use color to encode gender and arc width and transparency to encode the paths to a common ancestor, as illustrated by the example on the right-hand side of the figure. This way, the thin and transparent edges represent child-parent relationships to individuals known in the ancestors’ tree. Thicker and darker edges represent the paths to a common ancestor, and a circle shape also encodes the individuals in that path. The absence of any edge means that no information is known about the ancestry in the corresponding branch of the family. In addition to color, an arc leading to a father (male) points upwards, while an arc leading to a mother (female) points downwards unless there was a node collapse.
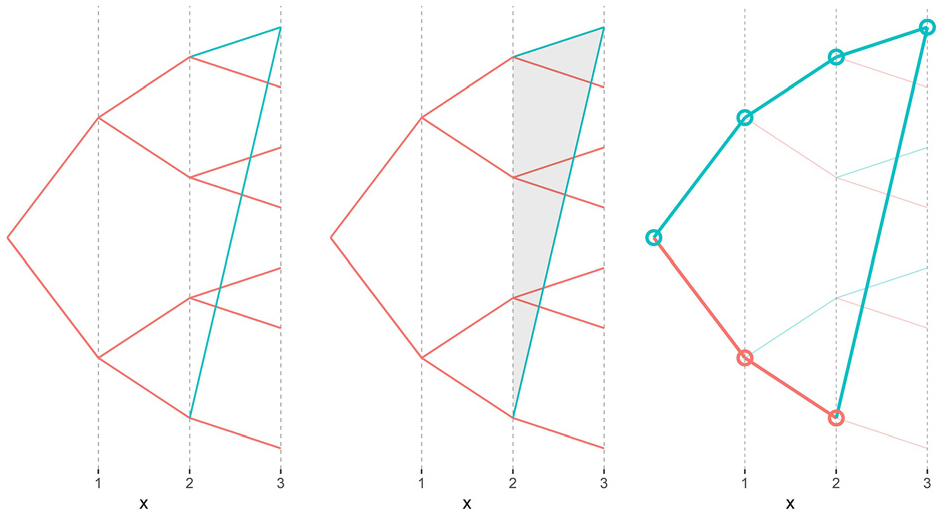
Three options considered for encoding the representation of common ancestors. The example on the right-hand side was considered a better option by domain users.
Another design decision was to keep the nodes in a given generation aligned, instead of a temporal alignment that could be obtained if time was represented in the corresponding axis. The main goal of the tool is the analysis of consanguinity resulting from common ancestry. The inbreeding coefficient of an individual, which is used as a measure of consanguinity, is a function of the number of generations in the paths (the path length) from such individual to the common ancestors that originate it. Therefore, for such analysis, the number of generations between a common ancestor and a descendant is more relevant than the number of years between their births. In addition, the kinship between any two individuals depends on the number of generations between them and the nearest common ancestor. Having individuals aligned by generation enables a clearer perception of the paths’ length comparison.
As a result of aligning by generation, horizontal arcs may occur. In an earlier version of the tool, when the first horizontal arcs emerged, it was believed that it resulted from a bug in the code. A closer analysis revealed that the paths from two spouses and their common ancestor did not have the same number of generations. The genealogist knew that the spouses were blood-related, but he was not aware they were in different generations. At the time, that was considered a fascinating insight provided by the representation. As a supporting example, in Figure 12, both Albert Spencer and Cynthia Hamilton descend from Charles Bingham, but Cynthia has a path having one more generation. The paths lengths comparison is not as easy in the representation given in Figure 3 that has the individuals aligned by date of birth.
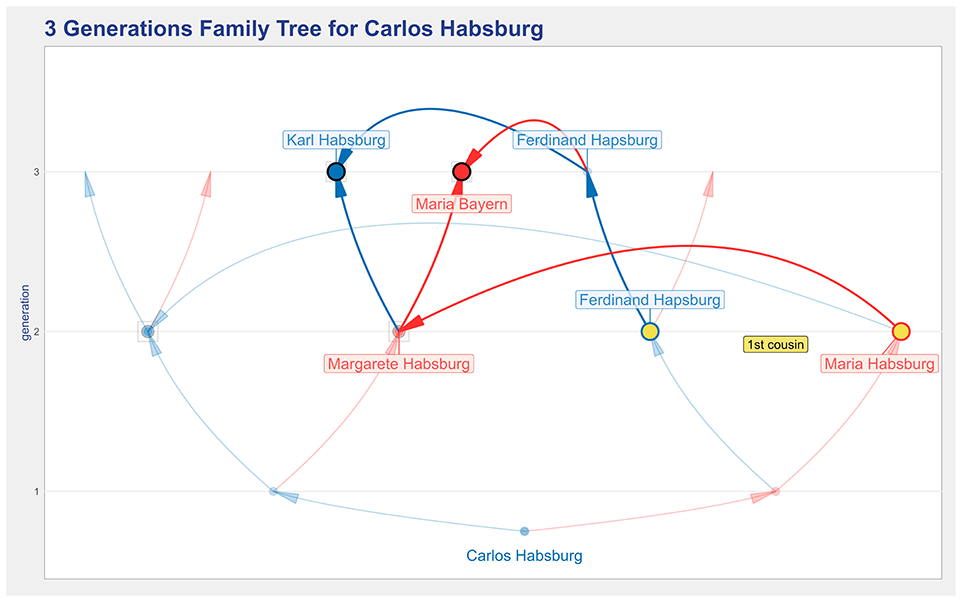
The example in Figure 6 that represents a small ancestors’ tree for Carlos Habsburg (Charles II of Spain) will be used to illustrate the other design decisions. The common ancestors are represented by larger dots colored by gender and black outline. Such dots are placed on top of a gray square that was added to facilitate the perception of common ancestors in larger trees. Spouses who are blood relatives have their dots colored in orange with the outline colored by gender, and their kinship is indicated by a label that has the same color in the background as their dots. The individuals with non-null inbreeding coefficient have their dots colored in green with the outline colored by gender.
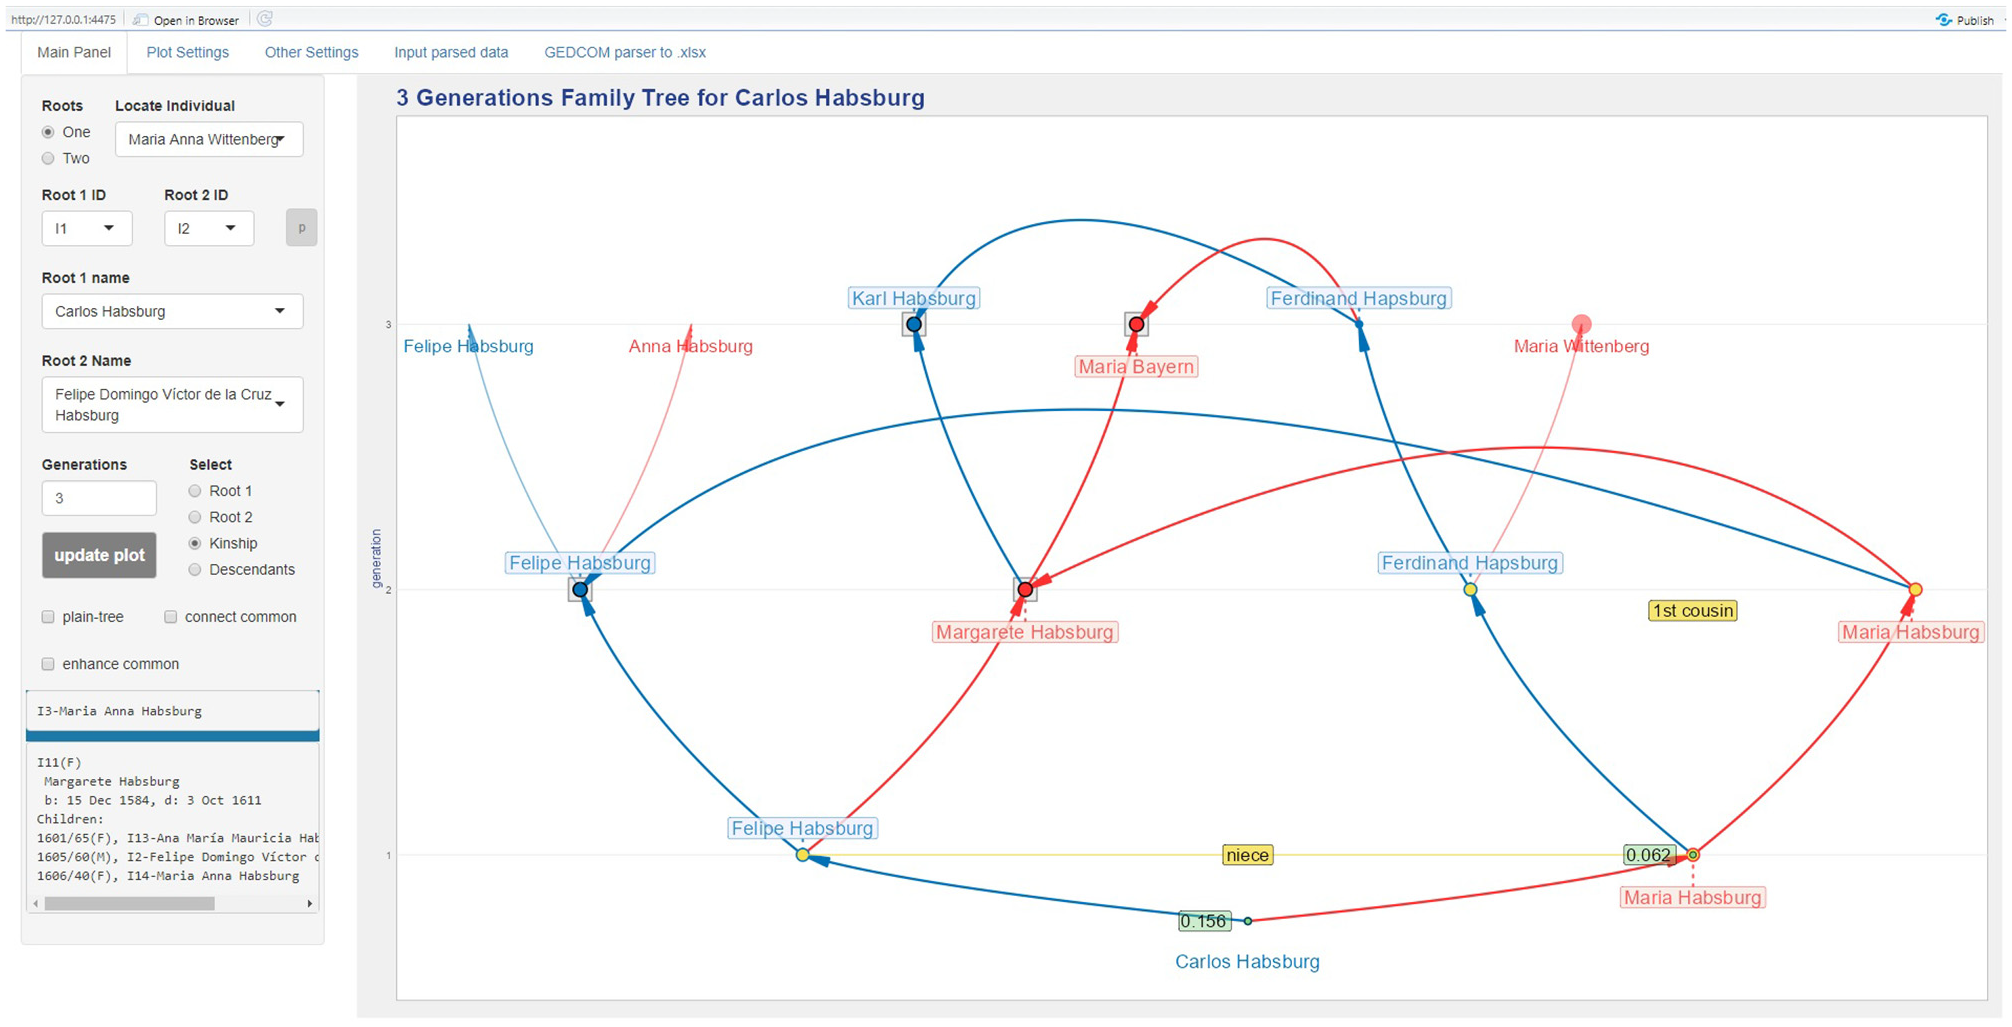
The VisAC’s main panel showing a three generations tree for Carlos Habsburg.
There is an option to include labels with the names of all individuals in the first few generations, which are colored by gender. The labels for the common ancestor and the individuals in a path to them are also included but have a different layout (with the background colored by gender). An arrow was added to the arcs to clarify the direction of the child-parent relationships. That is of particular importance when two paths from the root individual to a given common ancestor do not have the same length, which can lead to horizontal or backward arcs. In such a case, the direction of the relationship would not be unequivocal. An example of that is the arc from Maria Habsburg to Margaret Habsburg in Figure 6. As an option, tapered arcs can be used instead of arcs with arrows, as suggested in Holten and van Wijk. 28 A tapered arc has a varying width, being wide at the start and narrow at the end. An example of this representation is given in Figure 11.
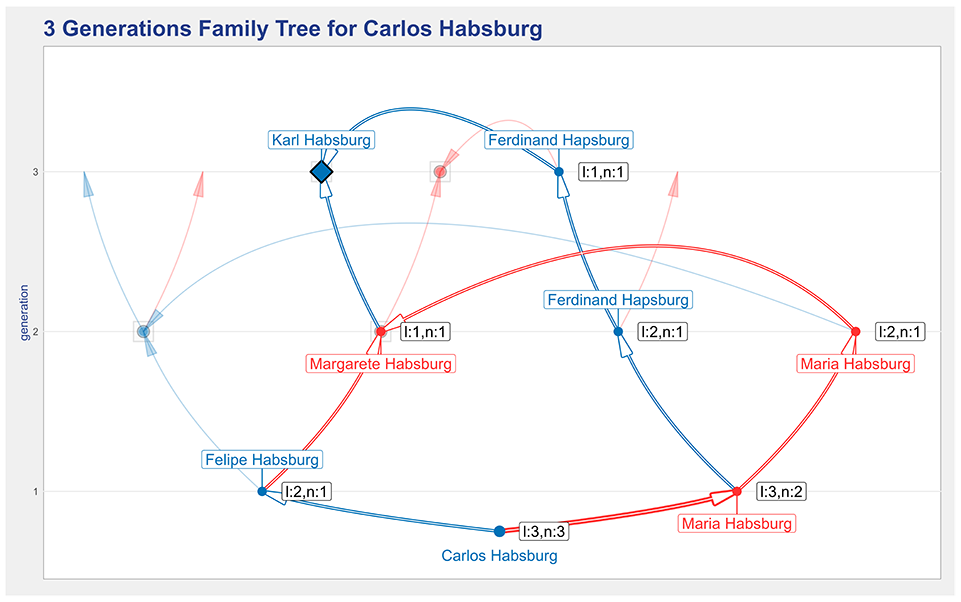
To provide the means to compare a classic representation with the proposed design, a representation without node collapse is also available, that is, a plain-tree. Figure 7 shows a four generations plain-tree for Charles II that is available by setting the ’plain-tree’ check box. In this representation, common ancestors are indicated by a colored dot. To identify the multiple locations of each common ancestor, their dots can be connected by dashed lines, which may be adequate for simple trees. In the figure, the option was to connect the dots of a selected individual. A thicker dashed line and larger dots are used to enhance the tree locations of Maria Bayern. The user can swap between the representations in Figures 6 and 7 by selecting and deselecting the plain-tree check box.
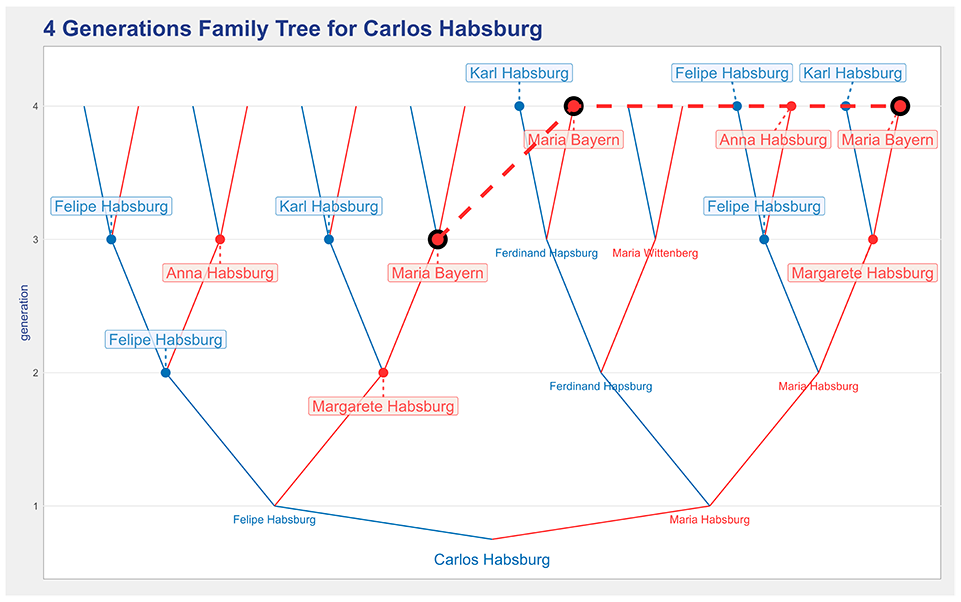
A four generations plain-tree representation for Carlos Habsburg that indicates common ancestors without node collapse.
The design was extended to represent the ancestry of two selected root individuals. That will be illustrated in the following sections, noting that such extension did not require modifications in the encoding of the base design.
Interaction mechanisms
The visualization design described in the previous section has been shown to work well to: (i) communicate the results of genealogical research and (ii) for not too complex trees when the genealogist has a clear understanding of where, in the ancestry, are the common ancestors. However, in gaining an understanding of the level of consanguinity in a family, the genealogist will benefit from exploring the ancestry of different individuals and looking at trees with varying depths. The implementation of an interactive mechanism to manipulate the visualization had two main goals: (i) to promote the exploratory analysis of the consanguinity in a family; (ii) to provide the means to clarify the visual representation in large and complex trees by enhancing specific aspects of the tree. To achieve that, the following features were integrated into VisAC:
plot type: set the number of root individuals (1 or 2);
select root(s): select the root(s) individual(s) by either the ID(s) or by the name(s);
revert root(s): revert to the previous root(s) setting;
gen: set number of generations for the tree;
locate: identify a selected individual on the tree;
zoom: zoom into a selected area of the plot;
children: list the children of a selected individual;
plain-tree: show a plain-tree representation, without node collapsing;
descendants highlight: select a common ancestor and highlight the paths to the root(s) individual(s);
kinship highlight: for two blood-related parents clarify who the ancestors that originate their kinship are;
enhance common: for a two-roots plot, enhance the paths from the common ancestors that are in the ancestry of both roots;
plot settings: select the labels to be included in the plot (names, kinships, or coefficients) and their font sizes and positioning;
save plot: export the plot into a high-definition image file.
Figure 6 shows VisAC’s main interface while representing a three generations one-root tree for Carlos Habsburg. On the side panel on the left are the main plot settings. A radio button is available on the top left to set the number of roots for the plot. Below that, four select lists enable to select the roots either by name or id. In the figure, an one-root representation of the ancestry of Carlos Habsburg (I1) is selected. The small button on the right-hand side of the IDs select boxes, if pressed, enables to revert to the previous roots’ setting. A numeric input is used to set the number of generations (in the figure set to 3). The children feature is activated by a single click on the intended individual. The figure shows Margarete Habsburg offspring at the bottom of the side panel. On the top right, the Locate Individual select list is used to locate on the tree a selected individual. In the figure, Maria Wittenberg was selected as an example and identified by a large transparent dot that is colored by gender.
It is possible to zoom into a particular area of the tree by selecting the intended area and pressing update plot.
The select radio button next to the number of generations numeric input sets the double-click behavior. One aspect of the Shiny environment that was difficult to deal with was capturing a user keystroke. There are just three actions that we can capture: (i) the drag, which is being used to select a zoom area; (ii) the single-click, which is being used to get detailed information about an individual; (iii) and the double-click, which is being used for root selection and the two highlight features. The reasoning for using the double-click for the more advanced features and the single-click for the more straightforward feature of providing detailed information was that a single-click, which is easier to occur by accident, should be assigned to the less demanding feature. Thus, we use the select radio button to set the behavior for the double-click action. Double-click can be used to: (i) select a new root(s) individual(s); (ii) select an individual from a couple of two blood relatives to highlight the origin of their kinship; (iii) select a common ancestor to highlight the paths from him/her to the root(s) individual(s).
In Figure 6 the kinship option is selected, and the label underlined in blue on the side panel indicates that a double-click selected Maria Ana Habsburg. Thus, when the update plot button is pressed, the plot will be updated to clarify the origin of the 1st cousin’s kinship between Maria and Ferdinand Habsburg. The resulting plot is shown in Figure 8, in which the two spouses have their orange dots augmented, and the common ancestor(s) have their dots, which are colored by gender, also augmented. The paths from the spouses to the ancestor(s) are painted while the rest of the plot is faded into the background.
An illustration of the kinship highlight feature that shows who are the ancestors who originate the kinship between Maria and Ferdinand Habsburg.
Figure 9 shows the representation that results from selecting the descendants option and double-clicking in Karl Habsburg. Karl Habsburg has his shape changed into a large diamond, and all paths from him and the root are highlighted. Optionally, the arcs’ thickness can also be set to encode the number of paths that go through each individual in the paths. In addition, a new set of labels is included to indicate the number of generations between an individual and the common ancestor and the length of the shortest path. In the figure, the label ‘l:3,n:2’ indicates that there are two paths from Karl to Maria Habsburg and the shortest path has a length of three generations.
An illustration of the descendants highlight feature that is used to clarify how the root individual, Carlos Habsburg, descends from the common ancestor, Karl Habsburg.
The enhance common checkbox is used to highlight the paths from the ancestors that are common two both root individuals. This feature is useful in complex trees to distinguish those common ancestors who are in the ancestry of the two root individuals. Figure 10 shows the three generations two-roots plot in which the roots are the two grandfathers of Carlos Habsburg. There are three levels of arc’s density: (i) thin lines to represent regular ancestors; (ii) medium lines to represent the ancestors that have repeated occurrences but only in the ancestry of one of the roots (as is the case of Isabel Aviz and Albrecht Wittelsbach); and (iii) the thicker and darker lines to represent the paths to the common ancestors who are in the ancestry of both root individuals. It is curious to note that, due to the extreme level of consanguinity in the ancestry of Charles II, the shared common ancestors are more frequent than the non-shared common ancestors.
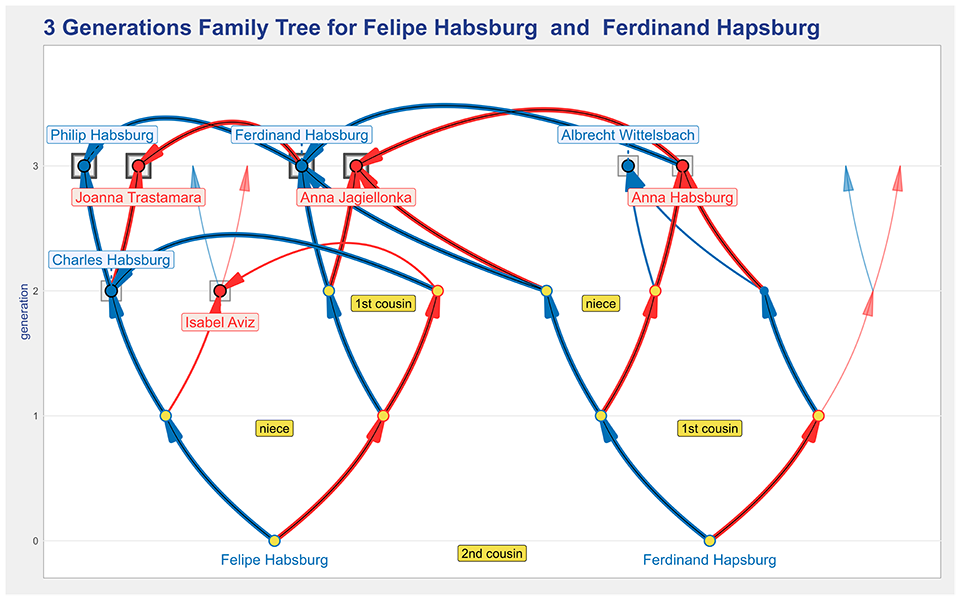
A two-roots tree for Felipe Habsburg and Ferdinand Habsburg, which is using the enhance common feature to help identify those common ancestors who are in the ancestry of both root individuals.
The two root individuals are relatives, as the label stating them as second cousins indicates. When the two roots are blood-related a label indicating their coefficient of relationship can be included.
Figure 11 shows a more complete seven generations representation of the ancestors’ tree for Carlos Habsburg using tapered arcs, instead of arcs with arrows. It is quite revealing to see his high degree of inbreeding (with a coefficient of 0.241) and the number of ancestors in the first four generations that have a non-null inbreeding coefficient (indicated by the green labels). There are a small number of individuals in the seventh generation from whom most individuals in the fourth generation (and below) seem to descend.
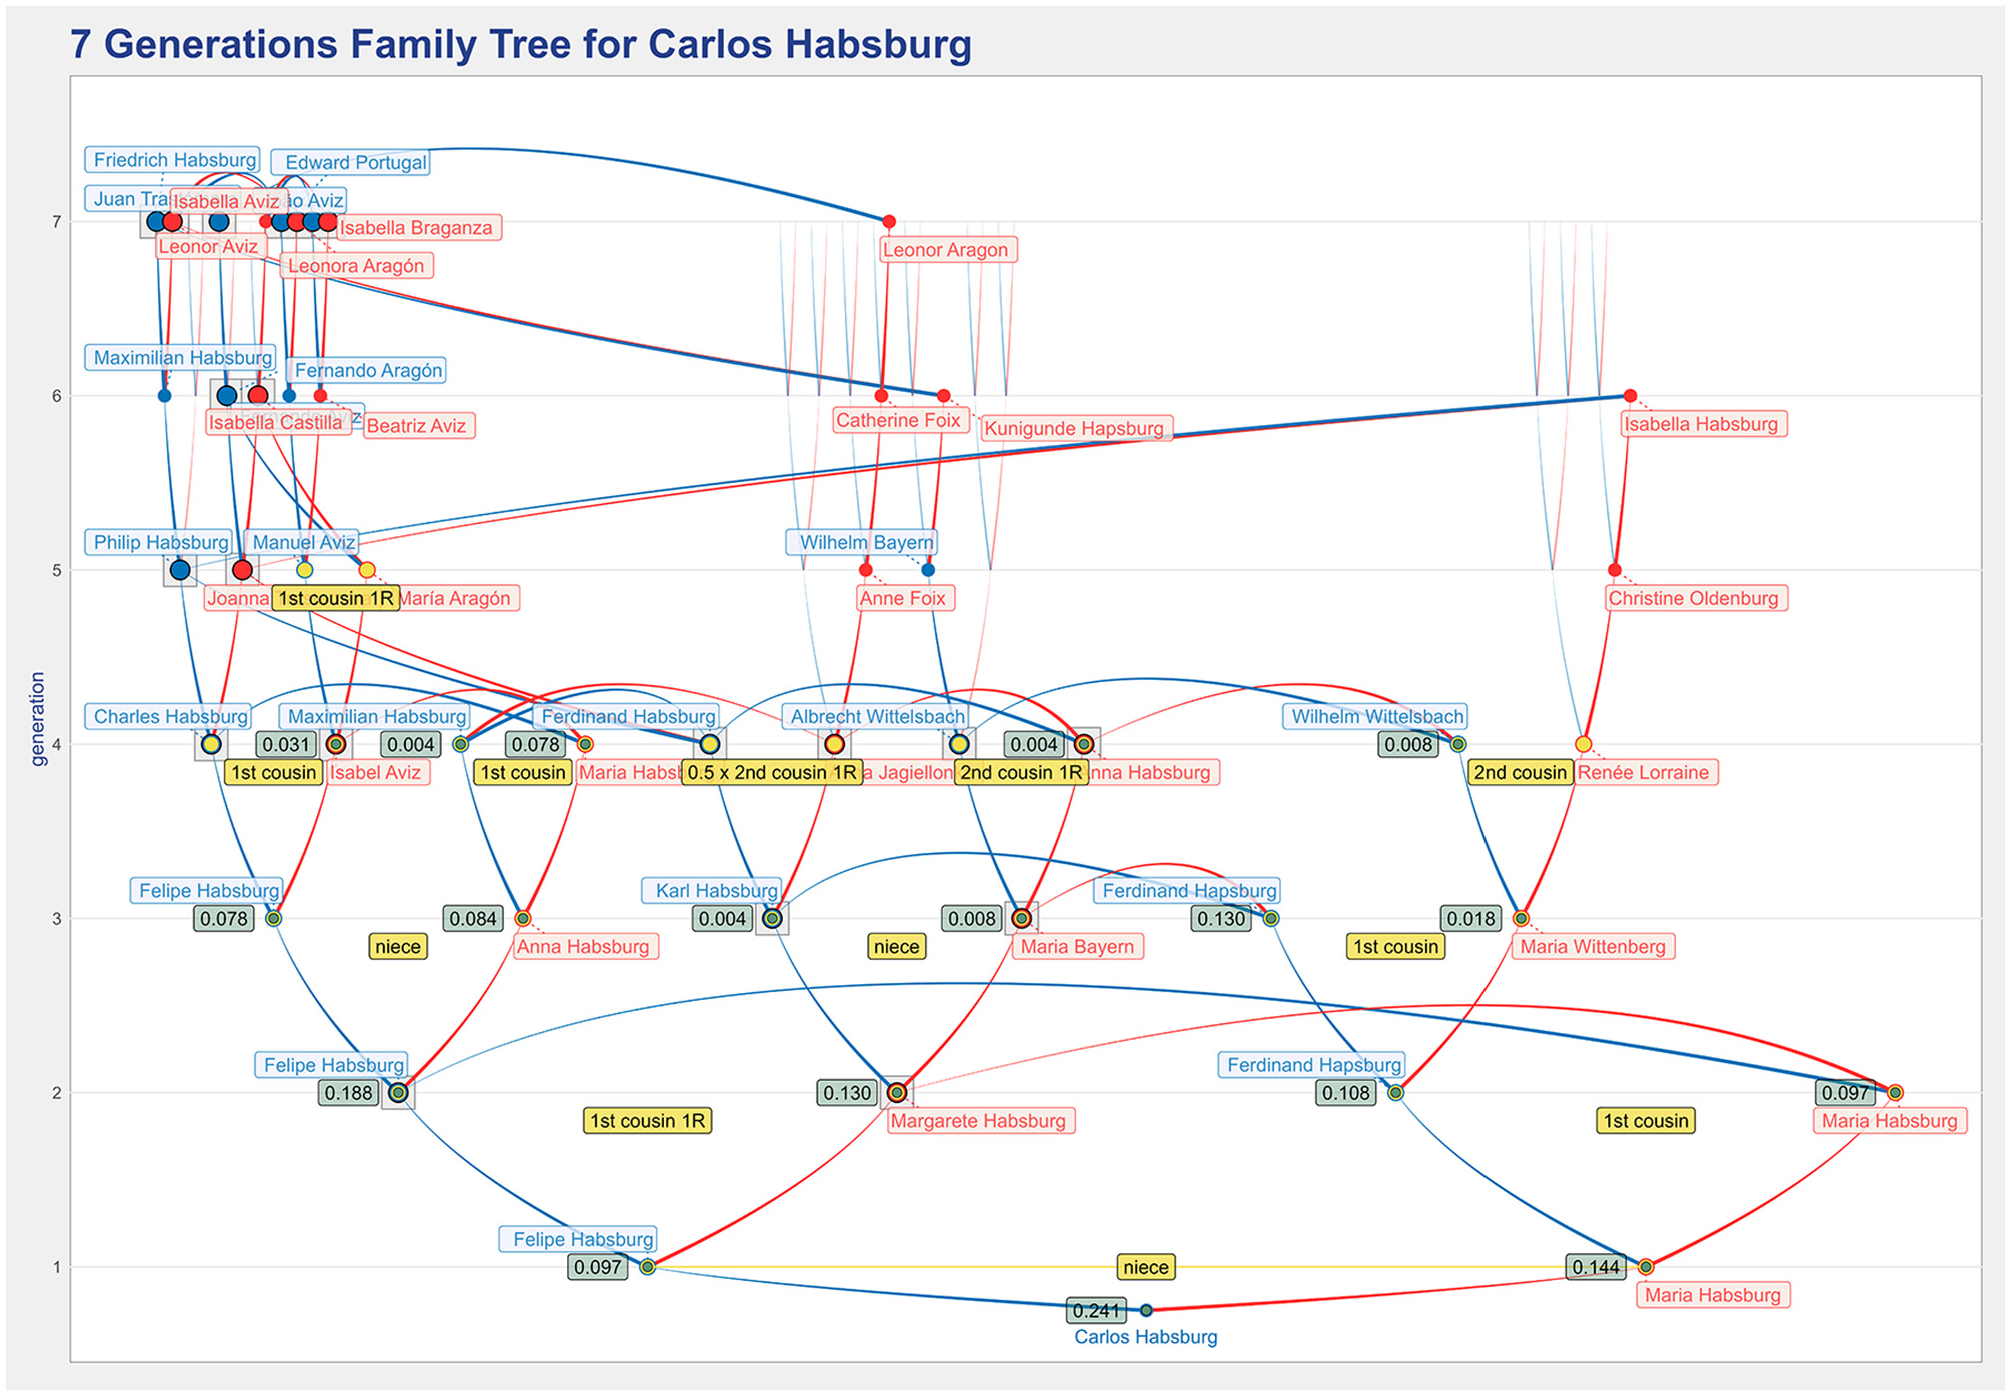
A seven generations ancestors’ tree for Carlos Habsburg using the tapered arcs that illustrates the effectiveness of the visualization design in representing a family tree with a very high level of inbreeding.
Since the user may want to modify more than one setting at a time, and to avoid the permanent re-computation of the tree, the update plot button is used to refresh the plot. A video demonstrating how to use the tool is available as Supplemental Material.
User evaluation
This work was conducted in close collaboration with domain users. The initial requirements emerged from the research of the author’s ancestry, which has some level of consanguinity. Pursuing a representation that promotes the analysis of common ancestry and the resulting consanguinity was the research drive. It was a two-stage process: (i) developing a visualization design and (ii) incorporating the design into an interactive tool.
An initial ancestors’ tree design was developed that reflects the feedback received in gatherings with genealogists and in at least two meetings in which the work was presented. A tree representation was shown on such occasions, and users asked what they could read from it. The focus was to understand if the users could grasp the representation, but no formal feedback was collected. The design was then incorporated into the interactive tool, which went through a prototype/validation loop. Formal feedback was collected in two ways: (i) a questionnaire and two demo videos sent to users identified in Facebook groups dedicated to genealogy or in research papers focused on inbreeding analysis and (ii) tests with the tool with three local users.
In the questionnaire evaluation, two videos were sent to users. The first video is a demo of the tool presenting its main features, while the second shows an example of how to use the tool to explore an individual’s ancestry. The questionnaire asked their opinion about the visual representation and the adequacy of the interactive features. It was answered by six users that had never heard about the tool. As expected, the feedback obtained was quite general since the users could not play with the tool, but valuable and rewarding feedback was received. As an example of the feedback received, we have:
“…I like the extensive tools and tweaks that are available. I think it will be very useful for the community.” and”…the visualization features have a bit of obscure names…”
“Using the thin and thick lines makes the visualization really clear” and “The inbreeding coefficient given in the green labels is highly technical. It’s not clear to me what this coefficient means. For me, the lines are a clear indication of inbreeding.”
“Very impressive work …! So excited to see this. This is what I have had in mind since I started to work with genealogies. I’m so glad you did it! I believe this could a great tool for many things, especially in animal breeding!”
“I like the visual representation. It is clear and easy to understand.”
“Firstly, I have to say thank you for creating the tool. Overall it’s an excellent, much-needed solution for determining and visualizing pedigree-collapse. On the visualization itself, I like your use of bold lines in paternal and maternal colors to emphasize the relevant paths to the common ancestor(s). It’s a simple, elegant and very effective solution.”
Simultaneously, a second evaluation was conducted with three local users asked to complete a set of tasks. These users were not the same as those who answered the questionnaire. The users referred to a learning curve to take full advantage of the tool, which they considered natural for such a specific tool. The feedback was, in general, very positive, and the evaluation very insightful.
As a result of the evaluation, the following features were included in the current version of the tool:
the option to revert to the previous root(s), enabling to go back to a previous representation;
for two-roots plots it was identified the necessity of being able to distinguish the common ancestors that are in the ancestry of both roots;
the ability to identify on the tree any individual selected from a list, as long that he/she is included in the tree represented;
the option-button and the double-click interaction was improved;
the plain-tree representation was suggested to make comparing a classic representation to the proposed design easier.
The version of the tool presented in this paper incorporates the feedback collected from both the questionnaires and the tests with the users. Finally, we note that the users preferred the term consanguinity to inbreeding since the latter is more specific and has a definition more challenging to grasp.
Implementation
The goal was to create a standalone tool to be used by a genealogist since they often feel uneasy about sharing the research records before publishing the results. Thus, the aim was to create a personal tool to be installed in the genealogist computer.
VisAC is implemented in R with the ggplot2 (https://ggplot2.tidyverse.org/) package for the plot creation and the Shiny (https://shiny.rstudio.com/) package for the interactive mechanisms. R and ggplot2 provide a programing framework for creating high-quality graphics. In addition, the availability of packages that provide methods for inbreeding analysis was considered an essential aspect since the implementation of an algorithm to compute the inbreeding coefficient is not a trivial task and was out of the scope of our work. In particular, the packages pedigree (https://cran.r-project.org/web/packages/pedigree/) and pedigreeTools (https://cran.r-project.org/web/packages/pedigreeTools/) were used for computing the inbreeding and the relationship coefficients. The Shiny package was used to create the interactive application since it provides the necessary features to enable some interactive manipulation of the plot.
The tool is efficient for trees with two roots and 15 generations. As an example, we can refer that Figure 14 took 3.5 s to be created in an Intel Core i7-10510U CPU, 32 GB of RAM. A binary tree with 15 generations has 32,768 possible ancestors in the last generation, which is too much to be adequately shown in a visual representation. Such trees are useful to overview the overall ancestry and guide the user on who to select as the root for analyzing a particular part of the ancestry. The tool is available in a GitHub repository (https://github.com/jlmborges/VisAC).
Exploratory analysis example
This section illustrates how to use the VisAC tool to analyze consanguinity. The publicly available GEDCOM featuring Kings and Queens of Europe (Royal92.ged file available in https://webtreeprint.com/tp_famous_gedcoms.php) is used as an example.
The analysis starts with the seven generations ancestors’ tree for William of Windsor given in Figure 12. There are several missing arcs from the sixth to the seventh generation, meaning that there are ancestors for whom there is no information in the file. Interestingly, no arcs connect the maternal (right-hand side subtree) to the paternal lineage (left-hand side subtree). Thus, the plot reveals no consanguinity in the first seven generations between William’s parents, Prince Charles, and Princess Diana.
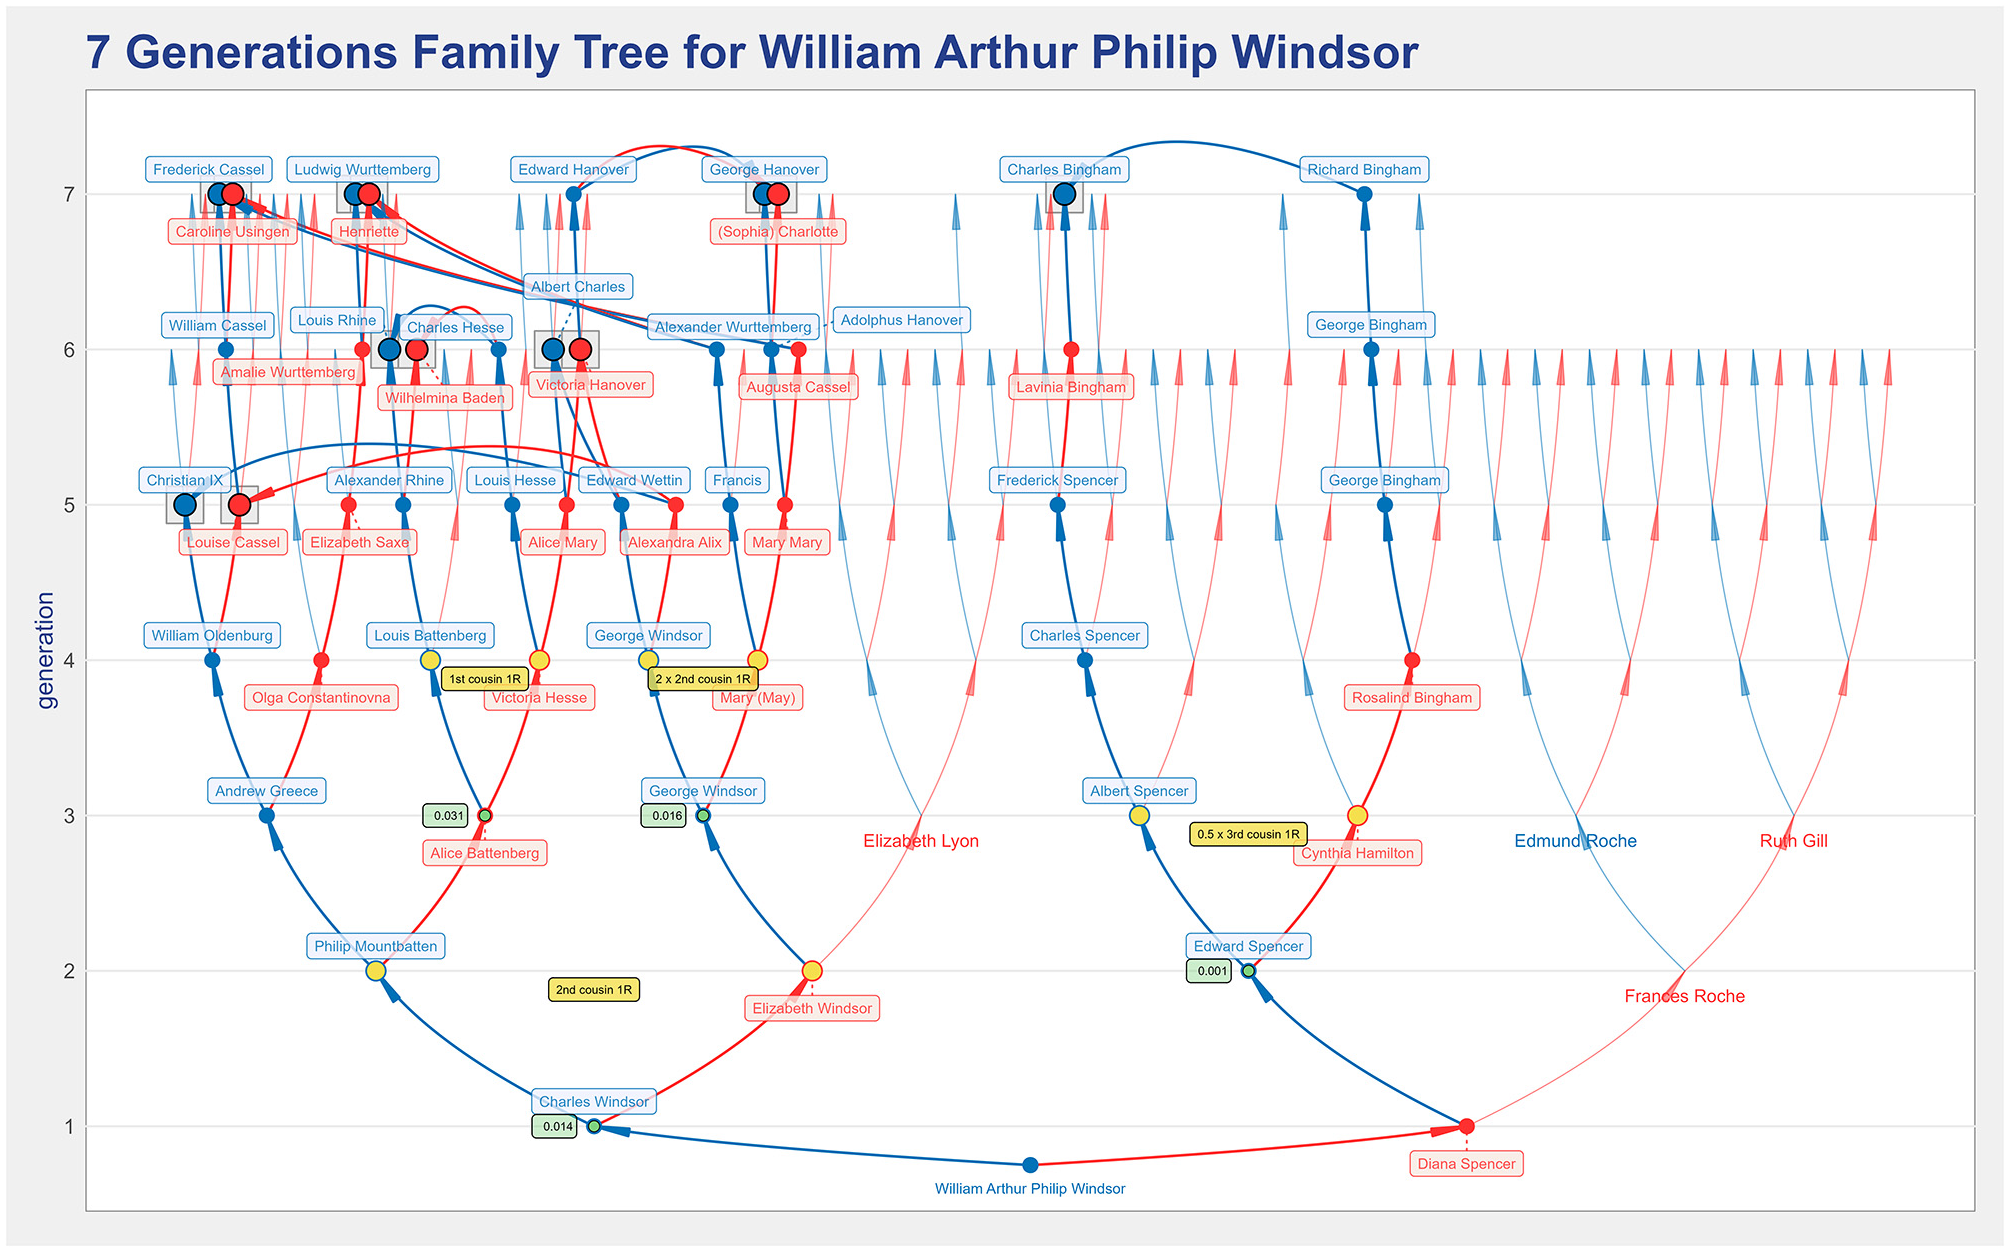
The seven generations ancestors’ tree for William of Windsor, the Duke of Cambridge, that shows that his parents are not blood relatives when the ancestry of up to seven generations is considered.
Both William’s paternal and maternal lineages have some consanguinity. In the maternal lineage, Charles Bingham is the only common ancestor. However, the missing arc corresponding to his spouse indicates a lack of information about her in the file. Charles Bingham originates the non-null inbreeding coefficient of Williams’ maternal grandfather, Edward Spencer, and the kinship between Albert Spencer and Cynthia Hamilton. They are half-third cousins once removed, where half means they share just one great-great-grandparent, which is probably due to the referred lack of data.
There are six couples of common ancestors in William’s paternal lineage, and therefore, significantly more consanguinity. Next to William’s father, the green label indicates his non-null inbreeding coefficient, meaning that William’s paternal grandparents are blood relatives. They are second cousins once removed, as indicated by the orange label. When the number of common ancestors is large, it becomes more challenging to understand who originates a given kinship. In such cases, the kinship highlight feature is helpful to clarify who originates it. To illustrate that, Figure 13 shows that Queen Elizabeth II and Prince Philip, William’s paternal grandparents, are second cousins once removed through Christian IX, the king of Denmark, and his wife, Louise Cassel.
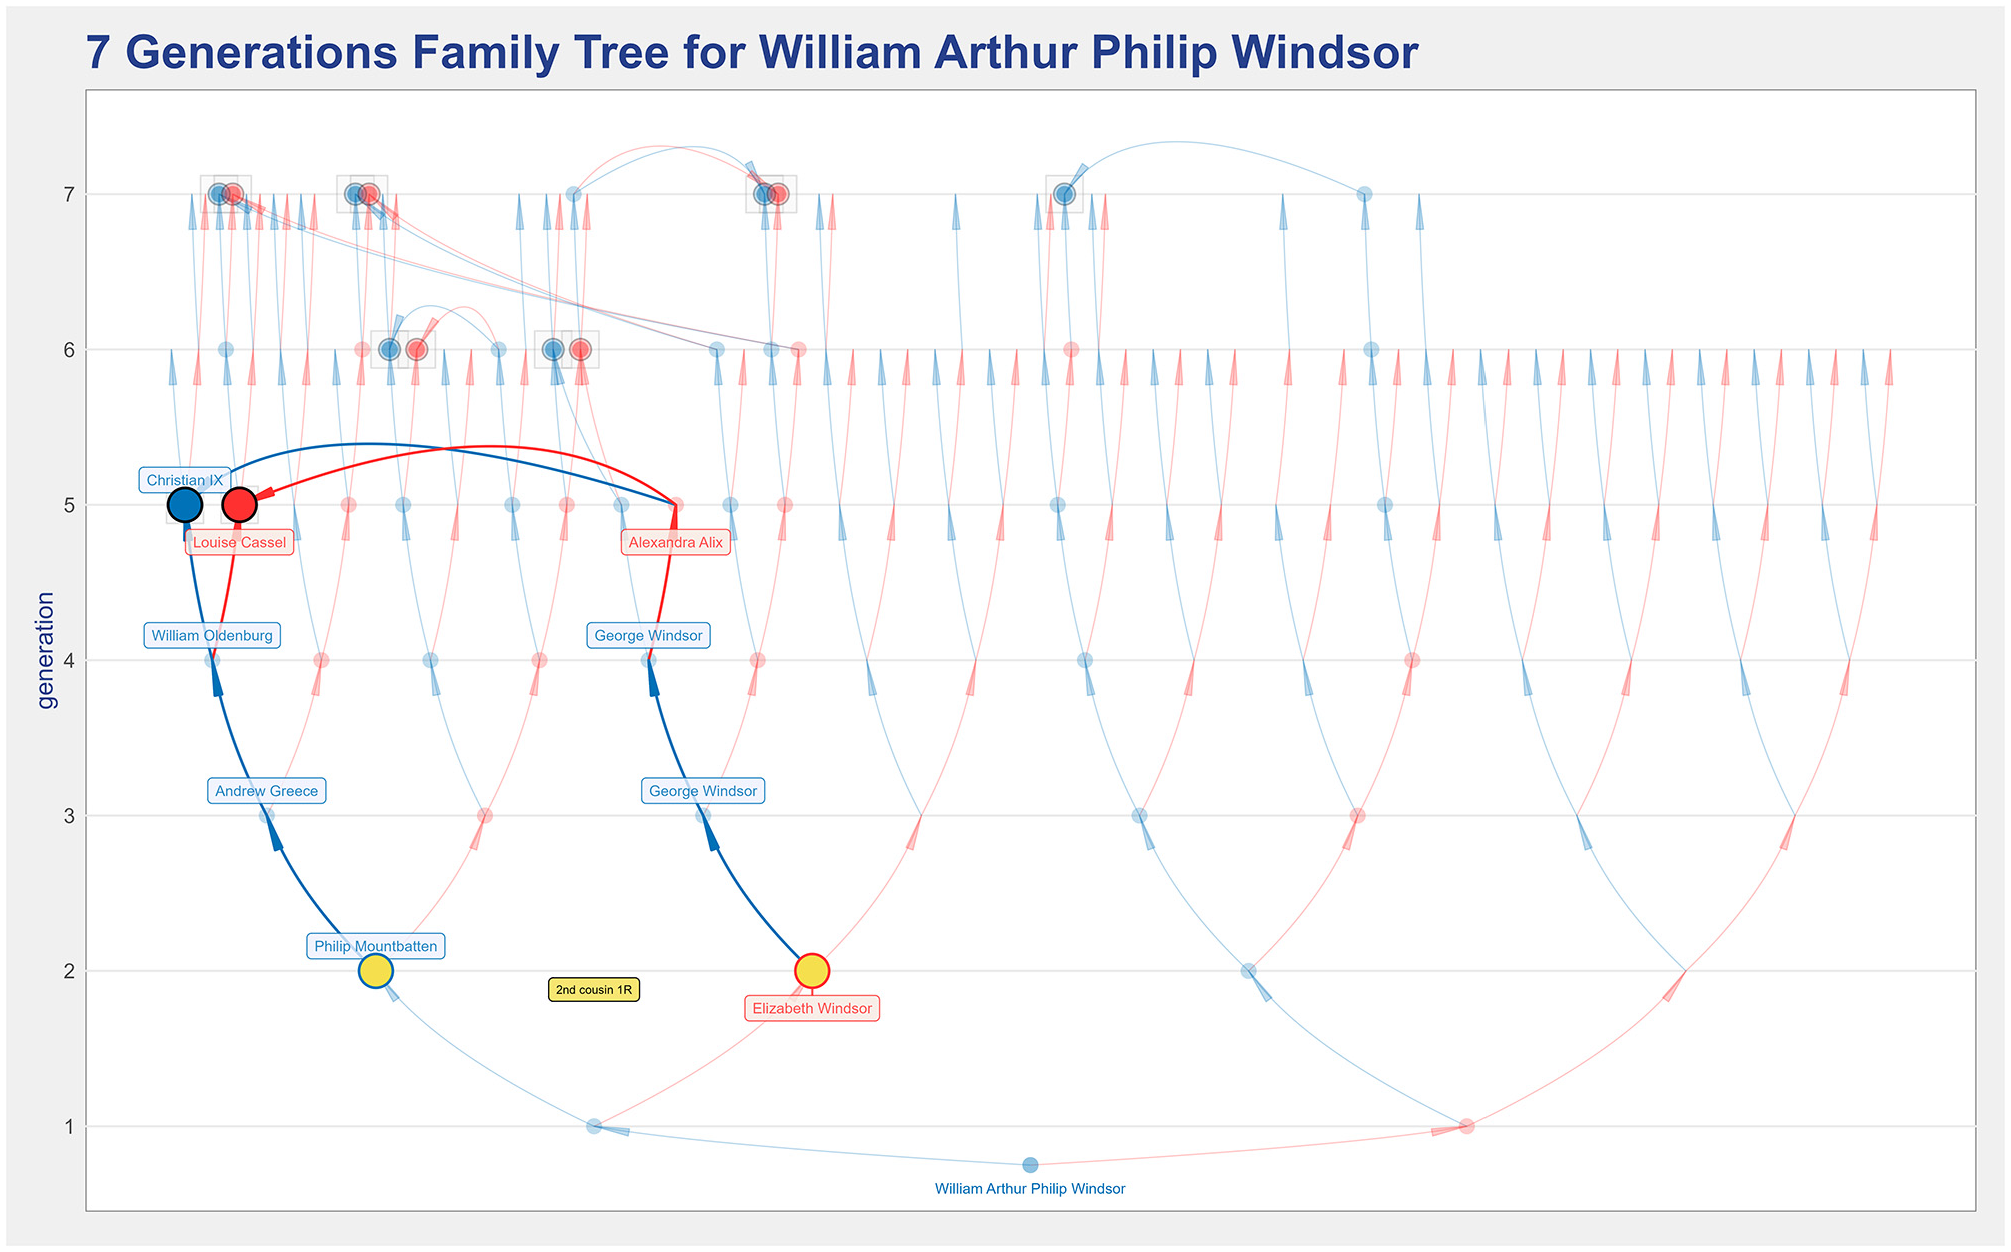
The seven generations ancestors’ tree for William of Windsor, highlighting the kinship between Queen Elizabeth II and Prince Philip.
VisAC can represent trees of up to 20 generations. However, the exponential increase of ancestors with the number of generations results in overplotting, making the representation details challenging to interpret. Figure 14 shows a 15 generations tree for William of Windsor that is useful to provide an ancestry overview. William’s paternal lineage was researched in more detail, having some branches extend for longer than the 15 generations shown. Only the names’ labels for the common ancestors are represented to reduce clutter (the labels for the ancestors in the paths were omitted). In the paternal lineage, many individuals have a non-null inbreeding coefficient, indicated by the green labels. A value of 0.000 means that the individual has a non-null inbreeding coefficient but only a non-null value after the first three decimal places. The level of inbreeding led us to explore William’s paternal lineage and change the root to his father, Prince Charles.
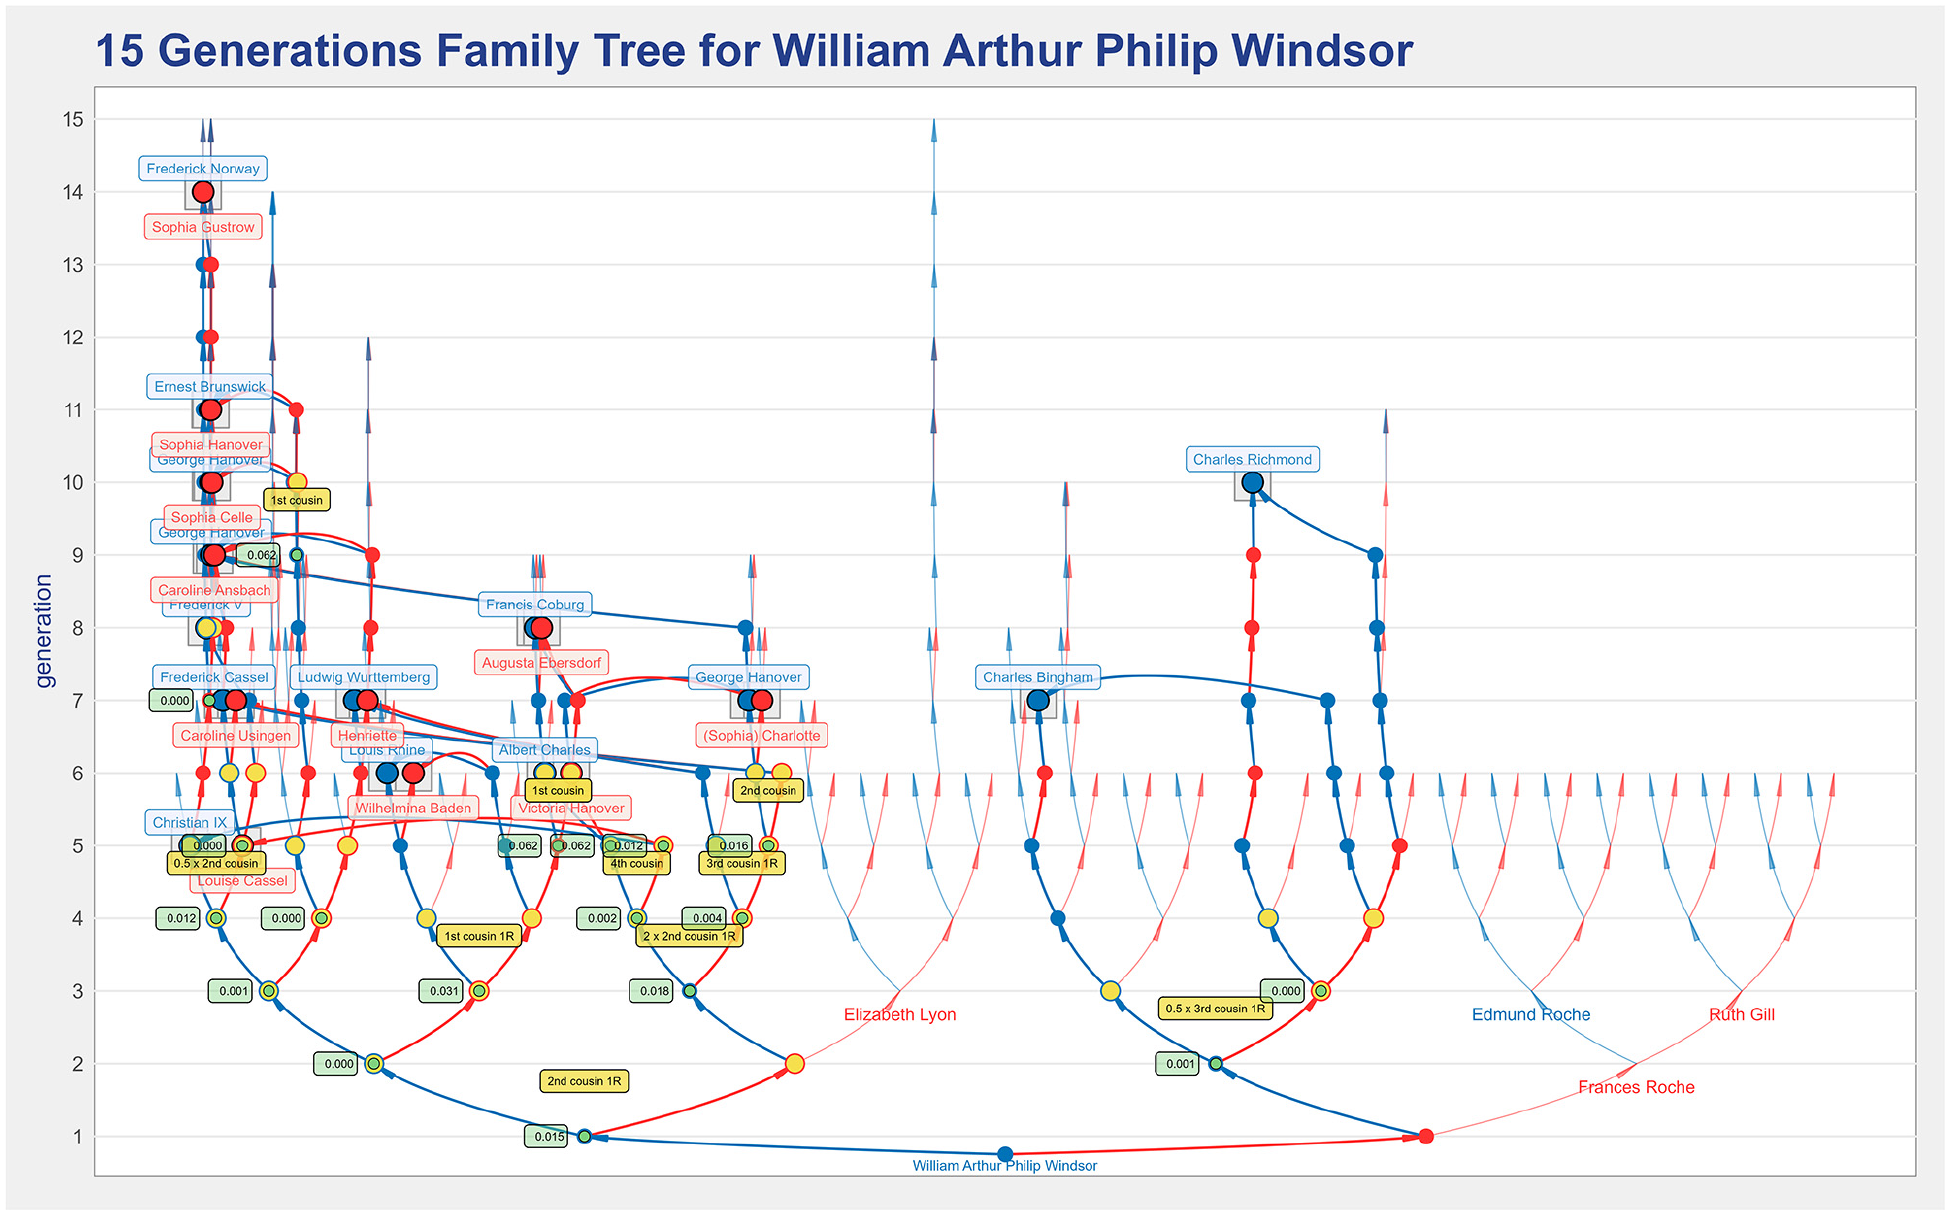
A 15 generations representation of the William of Windsor’s ancestors’ tree that is useful to provide an overview of the individual’s ancestry.
Figure 15 shows an eight generations ancestors’ tree for Prince Charles in which the paths from George II of Hanover (who was King of Great Britain) to prince Charles are highlighted. Prince Charles descends from four of George II’s children, and the label next to Prince Charles (l:8,n:10) indicates 10 distinct paths from George II to him, the shortest having eight generations.
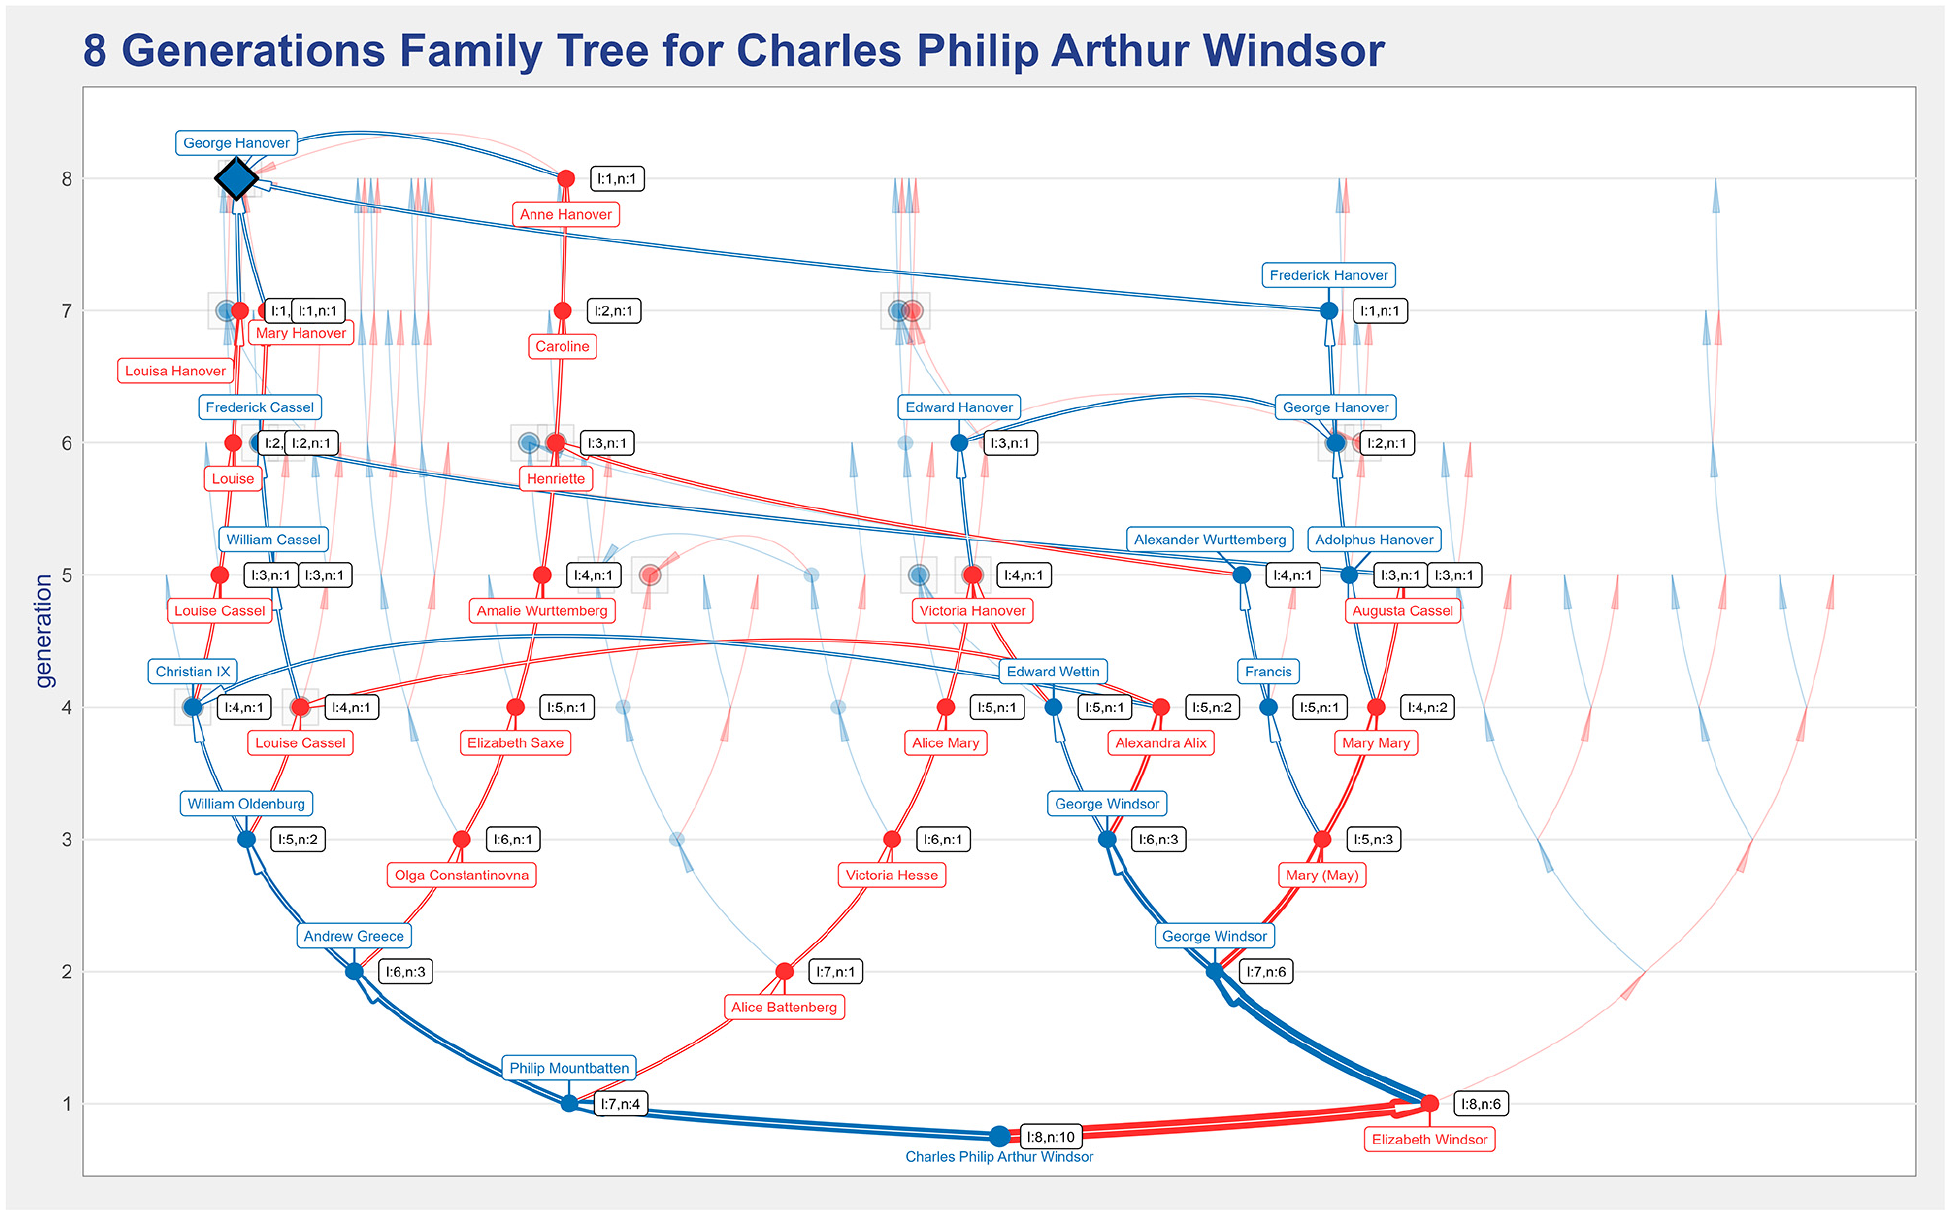
An eight generations ancestors’ tree for Charles Windsor that illustrates the descendants highlight feature by highlighting the paths from George II Hanover to the root individual.
Figure 16 shows a six generations two-roots plot for Prince Charles and Prince Carl Philip, the son of the King of Sweden. The arcs connecting their trees show that they share some ancestry. The option to enhance common ancestry was set, meaning that the common ancestors that appear in both lineages are distinguishable by an underlying gray box with a darker outline. Both Princes descend from Albert Charles and Victoria Hanover, and Victoria of Hanover descends from George III Hanover and Sophia Charlotte.
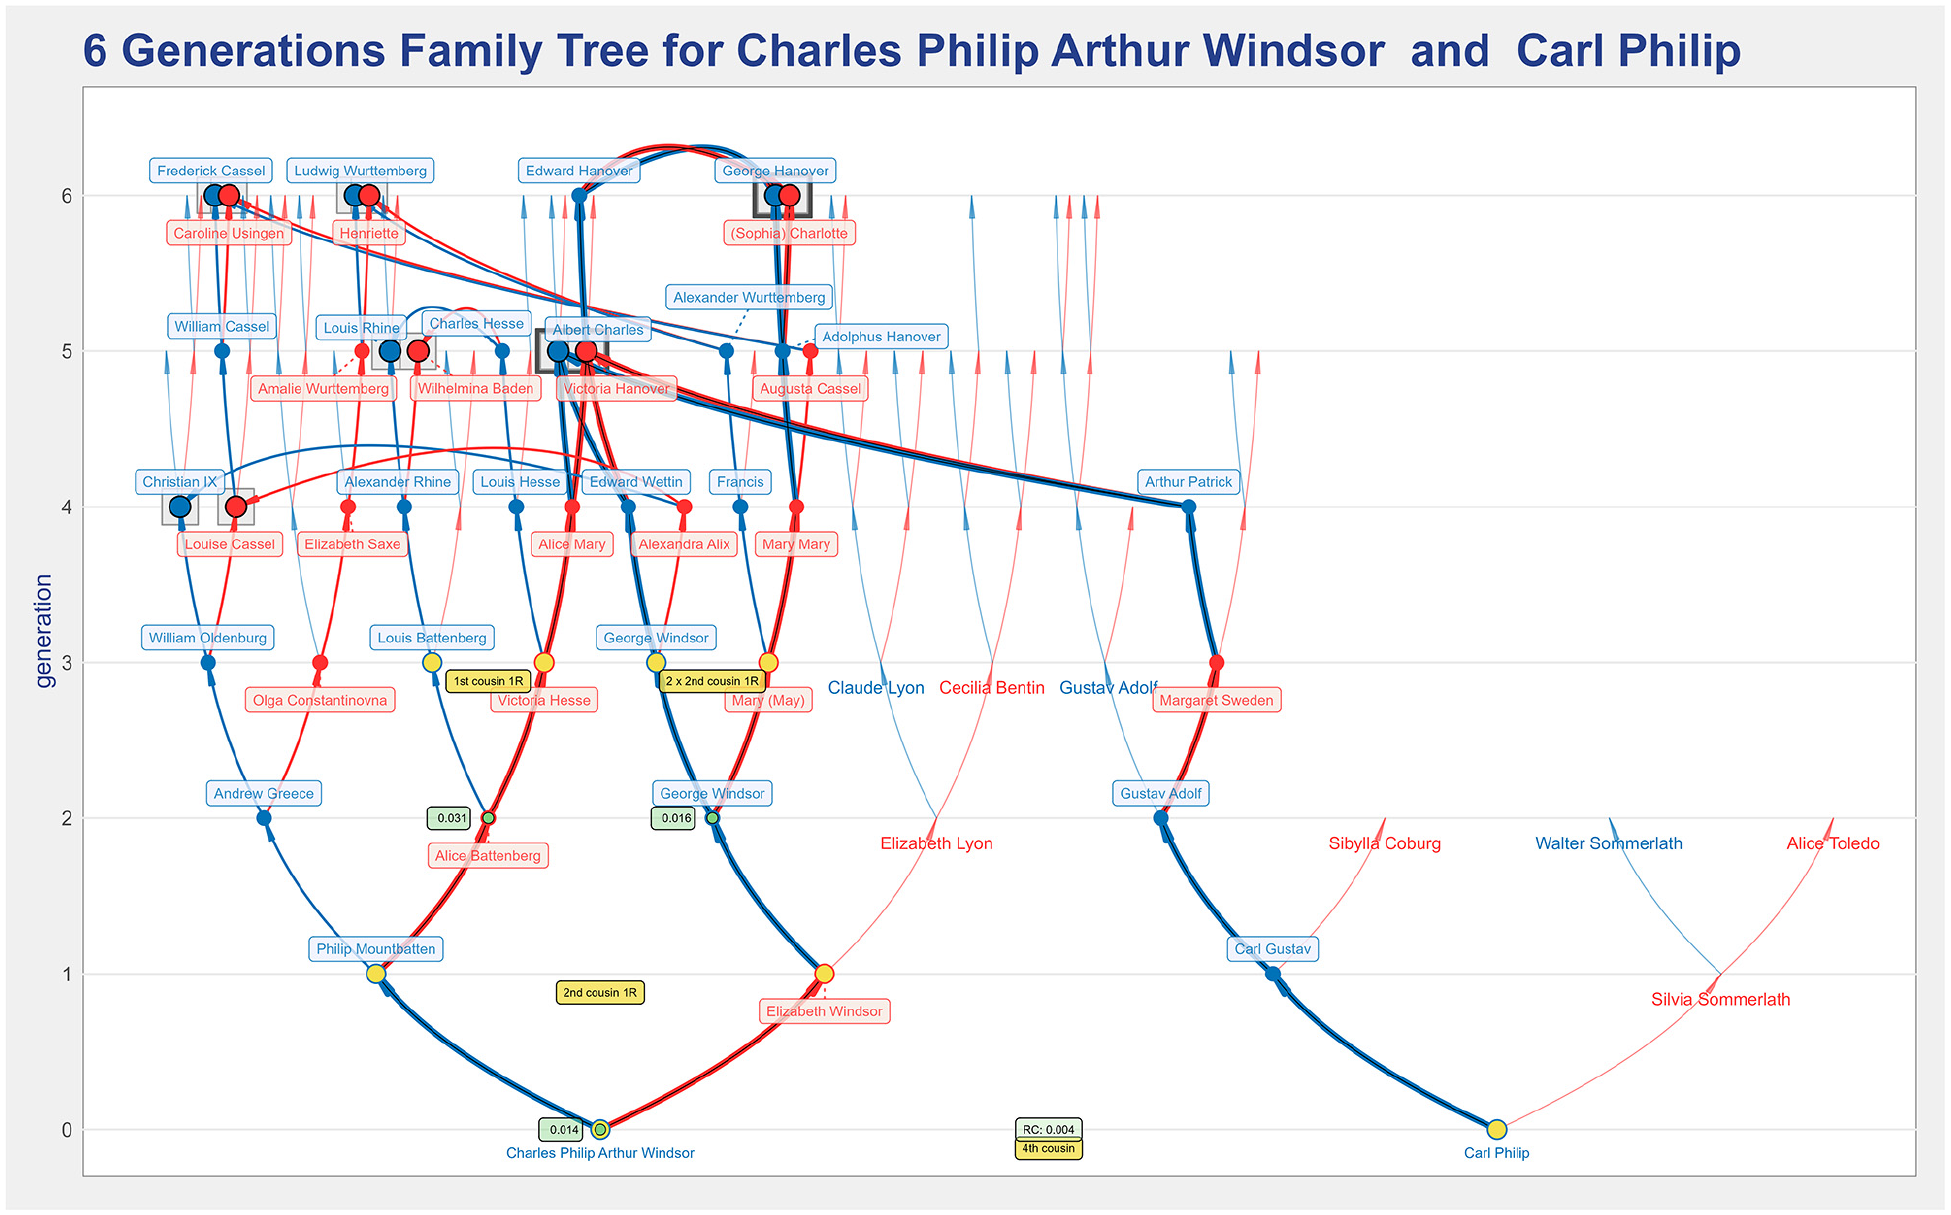
A two roots representation of the ancestry of Charles Windsor and Carl Philip of Sweden that illustrate the enhance common feature that is useful to help identify the common ancestors that are in the lineage of both root individuals.
A video illustrating the steps in this exploratory analysis is available as Supplemental Material (https://paginas.fe.up.pt/~jlborges/visac/VisAC_case_study.mp4).
Concluding remarks and future work
This paper proposes VisAC, an interactive tool that uses a visualization design for consanguinity and inbreeding analysis in individuals’ ancestry. An ancestors’ tree of one, or two, root individuals is created in which the paths to ancestors with multiple occurrences (the common ancestors) are highlighted. The inbreeding coefficient is used as a measure of consanguinity. Individuals having a non-null inbreeding coefficient are highlighted, as well as parents who are blood relatives. A set of interaction mechanisms is made available to support the exploratory nature of the task of consanguinity analysis. To the best of our knowledge, it is the first visualization tool specially designed for consanguinity assessment in an ancestors’ tree.
This was a problem-driven work, motivated by the author’s desire to have a visualization that could help make sense of his genealogy research data, and which was conducted according to the four levels of visualization design proposed by Munzner. 27 The domain tasks were fine-tuned in frequent meetings and discussions with fellow genealogists, as well as the validation of the final visualization design. VisAC incorporates the feedback collected among target users through a questionnaire about two demo videos of the tool and through tests in which users were asked to complete a set of tasks while using the tool. As the examples illustrate, we believe the proposed visualization design does an excellent job supporting consanguinity analysis in an ancestors’ tree. The feedback collected from domain users supports both the visual representation’s effectiveness and the tool’s utility for the task.
The visualization design is based on the concept of a binary tree in which some nodes are collapsed. The option to keep the nodes in their initial position leads to an area of white space. Such white space works as an indication of a subtree collapse due to inbreeding or of a branch of the family with incomplete research (unknown ancestors). However, it was suggested by some users that such space could be helpful to give space to the large number of individuals in the farther generations. There is a tradeoff between the increased legibility achieved by keeping the positions fixed and the legibility achieved by having more space to represent the individuals. This is worth to be studied in future developments.
Also, as future work, we consider extending the visualization to encode additional information such as a measure of pedigree collapse (the number of theoretical ancestors of an individual compared to the actual number of distinct ancestors), a summary of unseen generations, and other metrics such as disease markers. For example, it could be helpful to have a summary indication of what lies in the ancestry of the individuals in the last represented generation. One final aspect suggested to consider is the visual simplification of the farther generations, for example, through arcs’ bundling or an icicle tree-style layout for some portions of the tree.
Footnotes
Funding
The author(s) disclosed receipt of the following financial support for the research, authorship, and/or publication of this article: This work is financed by National Funds through the Portuguese funding agency, FCT—Fundação para a Ciência e a Tecnologia, within project UIDB/50014/2020.