
Abstract
This article presents a data-driven analysis of multimodal genre in a corpus of primary school science diagrams that contains multiple layers of cross-referenced annotations for multimodal discourse structure. The aim is to identify diagram genres in the corpus and describe their multimodal characteristics. To do so, information about expressive resources used in the diagrams and the discourse relations between them is extracted from the corpus, and computer vision is used to approximate the visual appearance of the diagrams. The article also presents a new method for quantifying information about the use of layout space. The resulting description of multimodal discourse structure is processed using UMAP, an unsupervised machine-learning algorithm, in order to identify diagrams that exhibit similar structural characteristics. The analysis allows the identification and characterization of four diagram genres in the corpus, which adopt different rhetorical strategies in combining expressive resources into discourse structures. The analysis also reveals that layout plays a major role in shaping the genre space, which can be further refined using information about the discourse structure. Overall, the results suggest that computational methods can be used to characterize multimodal genre from a bottom-up perspective using low-level information about expressive resources and layout.
Introduction
Contemporary media regularly use diagrams to represent real-world phenomena that may be difficult or impossible to observe directly. Their ability to abstract away makes diagrams a particularly flexible resource for communication. Consequently, diagrams are regularly deployed in diverse media ranging from online newspapers to school textbooks, which gives rise to considerable variation, as diagrams are shaped by the context in which they occur and the communicative goals that they seek to achieve. Diagrams are also inherently multimodal, that is, they combine illustrations, geometric shapes, arrows, written language and many other expressive resources. Just how diagrams draw on these expressive resources in different contexts of use remains an open question because the dimensions of variation are simply too many to be brought under analytical control.
In this article, I analyse a multimodal corpus of diagrams that represent topics in primary school natural sciences. By combining annotations from multiple layers of the corpus, I seek to identify particular types of diagrams using quantitative and computational methods. More specifically, I use unsupervised machine learning to detect patterns in the corpus and present a new method for quantifying information about the distribution of expressive resources across the layout space. In terms of methodology, I argue that computational analyses must be supported by a sufficient understanding of diagrams as a mode of communication, which is necessary for relating the observations made in the corpus to broader theories of multimodality.
Multimodal Perspectives On Diagrams
Diagrams are a prominent feature of both classroom practice (Wilson and Landon-Hays, 2016) and learning materials (see e.g. Bezemer and Kress, 2008; Dimopoulos et al., 2003), which is why their multimodal characteristics have been frequently studied in educational contexts. Guo (2004), for instance, examines the structure and functions of a diagram in a university-level biology textbook, observing that learning how to interpret diagrams is a key part of the process of acculturation into disciplinary discourse in biology. Such processes of acculturation are also needed to build up complex forms of multimodal literacy needed for interpreting diagrams, as Unsworth and Cléirigh (2014: 156) have shown by analysing how meaning is constructed using written language and visual expressive resources in primary school biology diagrams. Drucker (2014) discusses these processes more broadly in terms of visual epistemology, which she characterizes as ways of knowing that rely on diverse forms of visual representation.
Doran (2019) attributes the communicative power of diagrams to their ability to integrate multiple types of representational structures into a single discourse structure. To exemplify, diagrams may express part–whole relationships within an object while simultaneously setting up relations between that object and others (see, e.g., pp. 262–263). Almeida (2016: 99) illustrates this point finely by showing how multiple representational structures operate in an embryology diagram from the 19th century, which uses a tabular layout to draw comparisons between depicted objects while simultaneously setting up sequences that show their development. This observation highlights the role of layout as an expressive resource alongside other resources identified in diagrams, which range from language and images (Doran, 2019; Unsworth and Cléirigh, 2014) to diagrammatic elements such as arrows and lines (Lechner, 2020).
Although the studies presented above have shed light on the structure and functions of diagrams, proposals for generic frameworks for describing the multimodality of diagrams have been rare. Consequently, much of the previous work continues to build on pre-theoretical distinctions between language and image, which are not sufficient for describing the diverse forms of visual representation and co-deployment of expressive resources in diagrams (Hiippala and Bateman, 2022b: 406–407). Put differently, analysing the multimodality of diagrams requires a framework that departs from the assumption that written language, layout, arrows, lines, illustrations and other expressive resources are necessarily integrated into a common discourse structure. Unpacking this structure must be supported by sufficiently fine-grained and carefully circumscribed analytical concepts. The lack of suitable frameworks for analysing diagrams is also reflected in the inability to make theoretically informed distinctions between diagrams and other visual modes of communication (Doran, 2019: 274). Bateman (2022: 54) observes that such frameworks are ultimately necessary for relating empirical observations to analytical concepts responsible for describing the object of study, which is also a prerequisite for theoretical renewal.
The diagrammatic semiotic mode
To provide a generic framework for analysing diagrams, Hiippala and Bateman (2022a) introduce the diagrammatic semiotic mode, which is an abstraction for supporting the analysis of all kinds of diagrammatic representations. The concept of diagrammatic semiotic mode has been previously applied to developing an annotation schema for primary school science diagrams (Hiippala et al., 2021), scaffolding computational analyses of visual expressive resources and layout (Hiippala and Bateman, 2022b) and problematizing the identification of analytical units in diagrams (Hiippala and Bateman, 2022a). Just like any other semiotic mode, the diagrammatic semiotic mode is treated as a socially shared resource for communication, which emerges and evolves among a community of users (Kress, 2014).
The definition of the diagrammatic semiotic mode, which is illustrated in Figure 1a, is based on the theoretical model of semiotic mode with three strata originally proposed in Bateman (2011). The first stratum, material substrate, anchors the semiotic mode to materialities with particular properties. Crucially, the materiality must be malleable, that is, it can be manipulated for communicative purposes by a community of users. Bateman (2021) proposes that material properties may be characterized along the dimensions of temporality, space, participant roles and transience, which constrain the expressive resources available within the semiotic mode.
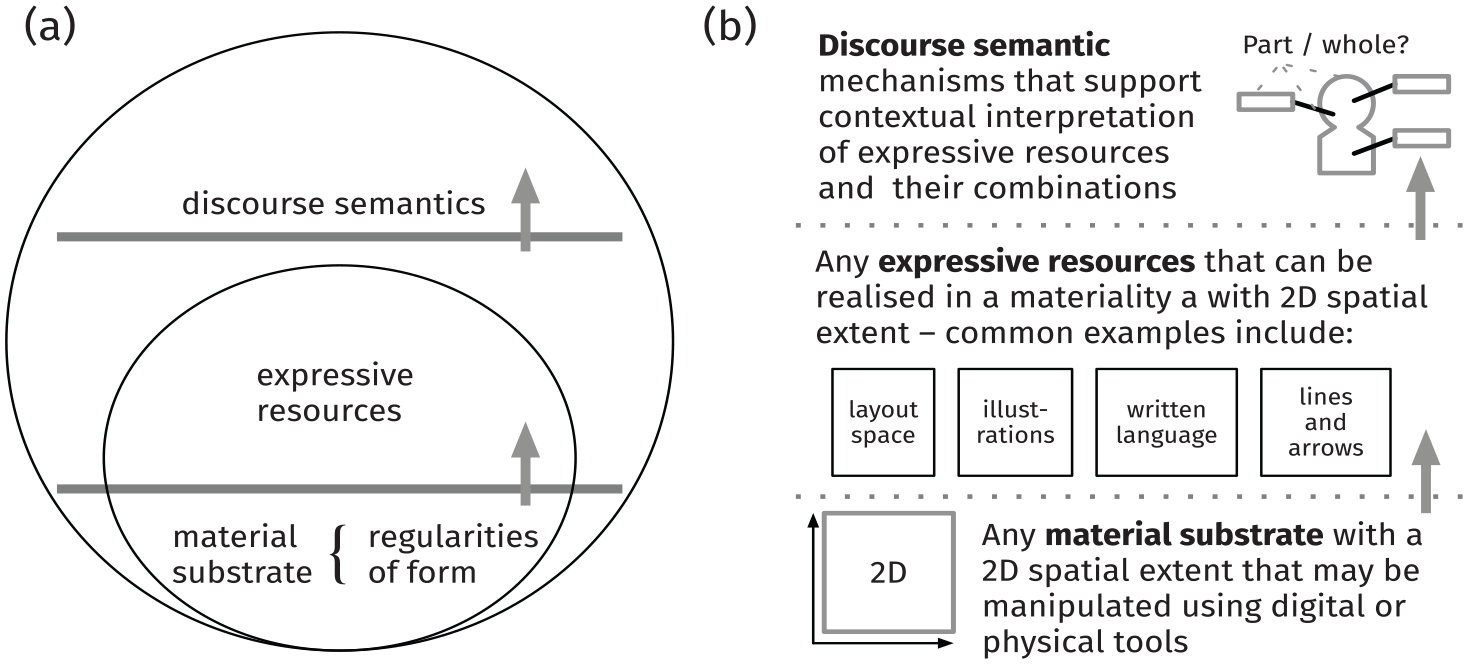
A sketch of the diagrammatic semiotic mode (Hiippala and Bateman, 2022b: 408).
The second stratum, expressive resources, consists of ‘semiotically charged organizations of material that can be employed for sign-construction’ (Bateman, 2011: 20). Expressive resources are assumed to have an organization that allows making choices within these resources and combining them into larger units. Any use of expressive resources must also involve the intentional manipulation of some material substrate, but the expressive resources themselves are not bound to any particular materiality, that is, they can operate with any materiality that fulfils the requirements set for the expressive resource in question. Written language, for example, may be deployed on any materiality with a 2D spatial extent, because its semiotic organization is sufficiently developed to be carried across materialities.
Finally, the third stratum of discourse semantics provides mechanisms that support the contextual interpretation of expressive resources (Bateman, 2020; Bateman and Wildfeuer, 2014). More specifically, the stratum of discourse semantics is responsible for generating hypotheses about the structure of multimodal discourse. Evaluating these hypotheses involves identifying discourse units and the expressive resources used to realize them, and the discourse relations that may hold between the participating units (Taboada and Habel, 2013). This process may be characterized as a form of abductive reasoning, which involves considering the combination of expressive resources in their context of use in relation to world knowledge.
Figure 1b applies the theoretical model presented above to diagrammatic representations, which is exemplified using the diagram in Figure 2. In terms of materiality, the diagram in Figure 2 is static, 2D, permanent and observable, which provides access to diverse expressive resources (see Bateman 2021). The expressive resources deployed in Figure 2 include monochrome illustrations and diagrammatic elements in the form of arrows. The identification of expressive resources is supported by the stratum of discourse semantics, which generates hypotheses about particular forms present in the diagram and their meaning.
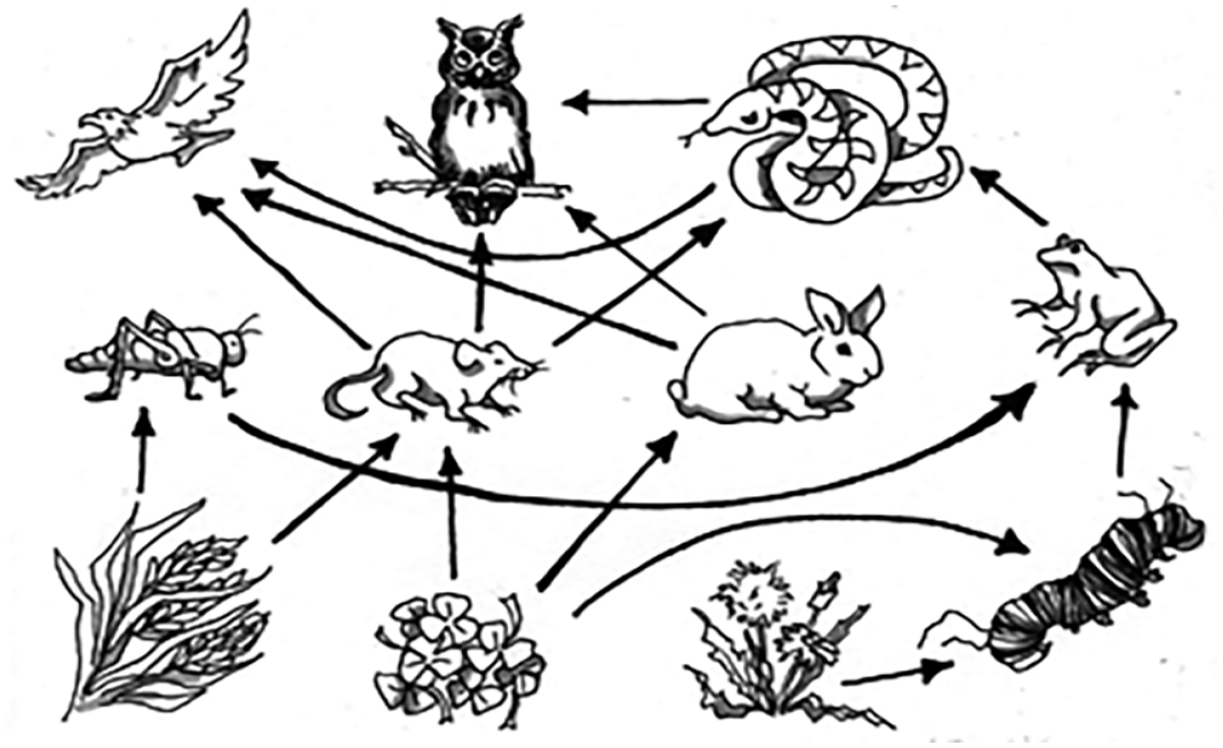
Diagram #450 from the AI2D dataset.
These inferences are equally supported by world knowledge: recognizing that the illustrations depict various flora and fauna quickly leads to the inference that they are unlikely to shoot arrows at each other, which is why the most plausible hypothesis is that the arrows in Figure 2 are not illustrations of actual arrows, but diagrammatic elements that stand for particular types of processes or relations (Alikhani and Stone, 2018). The exact nature of these processes may be further narrowed down through world knowledge: in this case, a process such as ‘gives energy to’ is more likely to hold between the depicted entities rather than, for example, a relation such as ‘is friends with’.
Naturally, world knowledge is not limited to our embodied and perceptual experience of the physical world, but also includes previous encounters with different semiotic modes and their recurrent use for different social purposes. Figure 2, for instance, shows a food web, which is commonly represented using network diagrams. Because the combination of expressive resources deployed in this diagram invokes previous encounters with other network diagrams, making sense of the discourse structure of this diagram does not have to start from scratch, as recurrent discourse structures can ‘speed up’ the process of inference. These recurrent structures emerge as a result of goal-oriented communicative use of semiotic modes, which are often described using the concept of genre in multimodality research.
Genre and rhetorical strategies
From the perspective of multimodal discourse, genre has been described as a second-order phenomenon – ‘a patterning of patterns’ (Bateman, 2014: 241). This implies that any patterns ascribed to genre emerge as a result of lower-level choices that shape the structure of multimodal discourse (Stöckl, 2020: 34–38). Recent advances in multimodality theory have enabled relating these choices more strongly to the concepts of medium and semiotic mode (Bateman, 2014). Setting out the relations between media, semiotic modes and genre has resulted in a powerful ‘meta-model’ (Lim, 2004: 222), which allows their respective contributions to multimodal discourse to be pulled apart (Bateman, 2017).
Bateman et al. define medium as ‘a historically stabilised site for the deployment and distribution of some selection of semiotic modes for the achievement of varied communicative purposes’ (2017: 123), rather than treating medium merely as materiality or a ‘channel’ that enables communication. From this perspective, examples of contemporary media include, among many others, school textbooks and corporate websites. Both media can be readily distinguished by virtue of serving different communicative functions in society (Kress and Van Leeuwen, 2001: 68). Just like semiotic modes, media emerge within communities of users, which is why media provide a fertile ground for the emergence of new semiotic modes or novel combinations of existing modes (Bateman et al., 2017: 123).
As pointed out above, recent theoretical advances have benefited the study of genre because they have allowed the disentangling of the respective contributions of media and semiotic modes to multimodal artefacts (Bateman, 2014). For example, digital media often feature navigation structures that support the use of the artefact, which are an inherent feature of the underlying medium and not associated with any particular genre realized in such media. In addition to mapping the contributions of the underlying medium, describing genre structures – patterns of patterns – requires a fine-grained understanding of the participating semiotic modes, which allows capturing choices made within them. Building on Lemke’s (1999) work on genre semantics, Bateman (2014: 250) characterizes such recurrent choices for achieving communicative goals as rhetorical strategies that may be associated with particular genres.
So far, the concept of rhetorical strategies has been used as an analytical tool for theorizing about differences between genres. However, Bateman (2008: 224) notes that understanding how rhetorical strategies translate into multimodal discourse structures associated with particular genres requires empirical research. The reason why previous discussions of rhetorical strategies have remained predominantly theoretical may be traced back to the lack of suitable corpora and analytical methods for supporting large-scale, data-driven research (Hiippala, 2015: 80). In what follows, I seek to identify rhetorical strategies associated with particular genres in a multimodal corpus of primary school science diagrams that features multiple layers of cross-referenced annotations. To track the choices made within the diagrammatic semiotic mode, I extract information about instances of expressive resources and the discourse relations that hold between them from the corpus, and apply computational methods to their analysis.
Data And Methods
AI2D-RST: A corpus of primary school science diagrams
AI2D-RST is a multimodal corpus of 1,000 English-language diagrams that represent topics in primary school natural sciences, such as food webs, circuits and human anatomy (Hiippala et al., 2021). The corpus is based on AI2D, a dataset of 5,000 diagrams originally developed for studying the automatic processing of diagrams (Kembhavi et al., 2016). Whereas the AI2D dataset was annotated by paid non-expert workers recruited via an online crowdsourcing platform, AI2D-RST includes multiple layers of cross-referenced annotations that describe the logical and rhetorical structure of diagrams (Hiippala and Orekhova, 2018). These annotations were created by five expert annotators, who exhibited a high degree of agreement on annotation decisions, which indicates that the annotation schema can be applied reliably (Hiippala et al., 2021: 674–680).
The AI2D-RST annotation schema is loosely based on the Genre and Multimodality (GeM) framework (Bateman, 2008). In AI2D-RST, the grouping layer (Hiippala et al., 2021: 667–668) corresponds to the layout layer in GeM, which groups individual analytical units into larger elements based on their visual features and placement in the layout (Bateman, 2008: 121–122). To represent discourse relations that hold between individual analytical units, AI2D-RST uses the multimodal extension of Rhetorical Structure Theory (RST: Mann and Thompson, 1988) proposed in Bateman (2008: 150–161). The discourse layer in AI2D-RST refines multimodal RST for diagrams by defining additional discourse relations (Hiippala et al., 2021: 669–673).
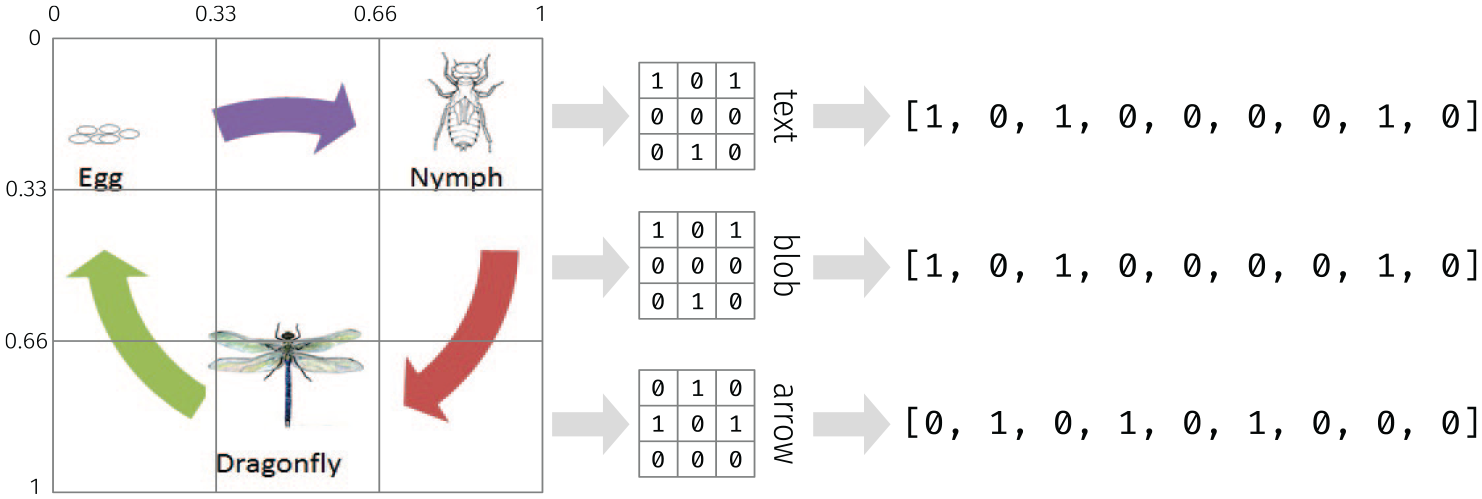
Figure 3 illustrates the application of the AI2D-RST annotation schema to a diagram that represents the life cycle of a fly. Figure 3(a) shows how the original diagram was segmented into analytical units by the crowd sourced non-expert workers (Kembhavi et al., 2016: 243). AI2D defines four types of analytical units: text, arrows, arrowheads and ‘blobs’, a category which covers all forms of visual expression (Hiippala et al., 2021: 665–666). Unlike the layout layer of the GeM framework, AI2D does not describe the visual features of analytical units (cf. Bateman, 2008: 117–121), but previous research suggests that these may be approximated using computer vision methods (Hiippala and Bateman, 2022b). Furthermore, AI2D does not decompose visual expressive resources into their component parts, which prevents creating maximally accurate representations of discourse structure (Hiippala and Bateman, 2022a).
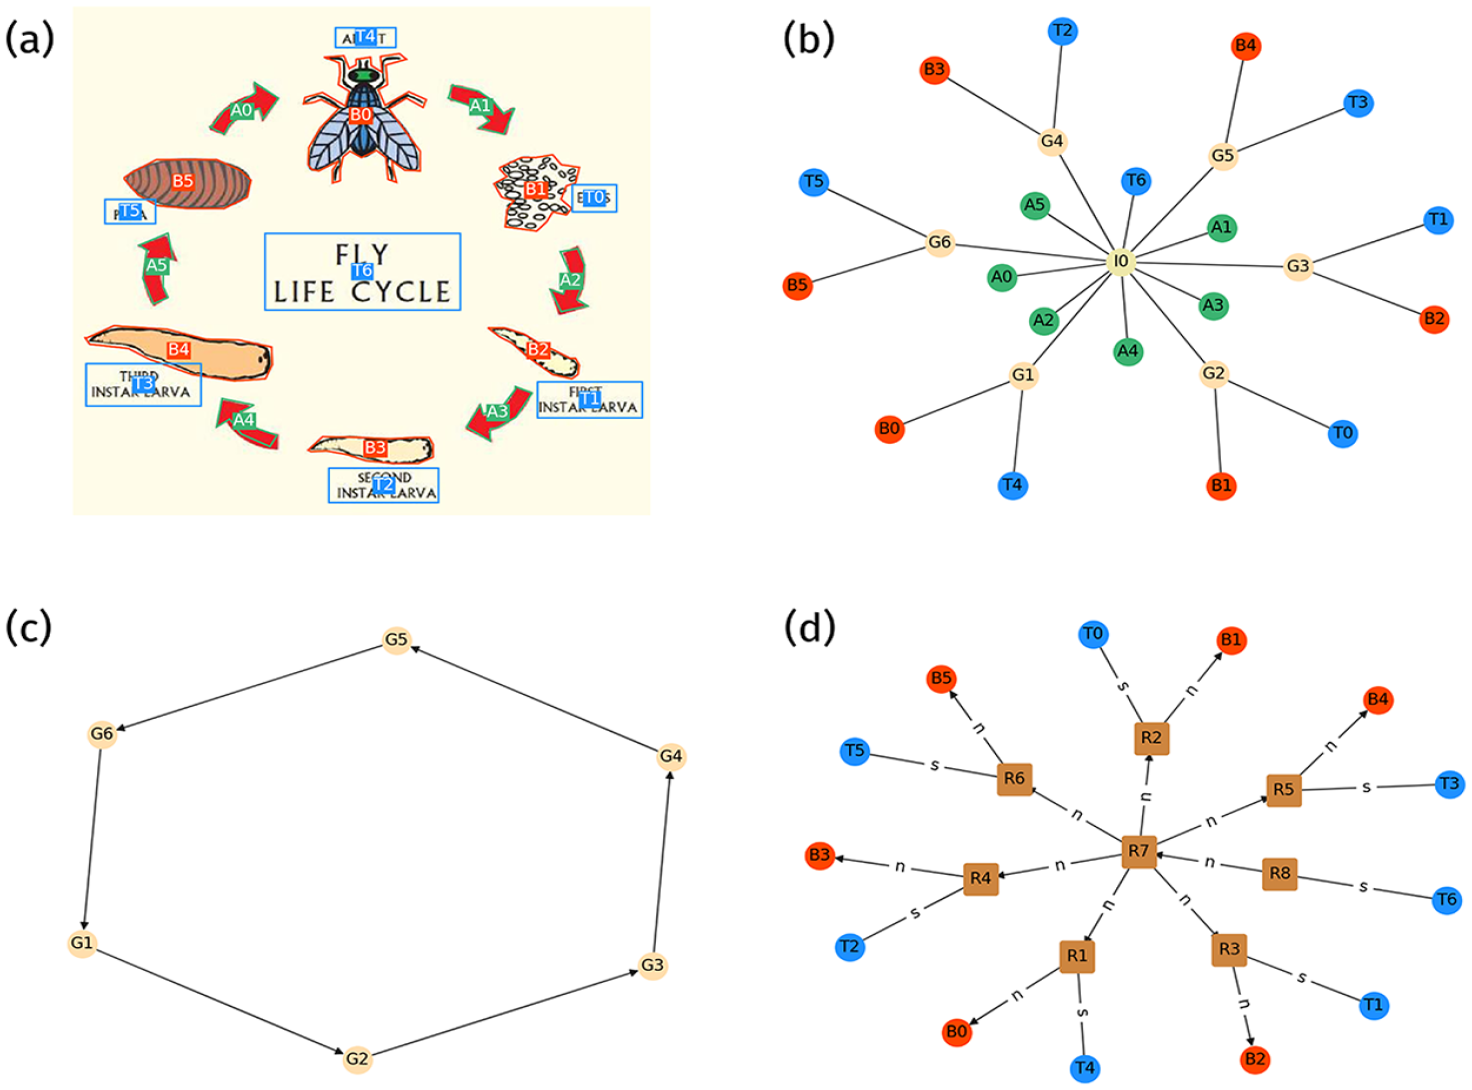
Annotation graphs for diagram #2185 from the AI2D-RST corpus: (a) crowd-sourced layout segmentation from AI2D overlaid on top of the original diagram. The identifiers are carried over to the graphs; (b) the grouping layer represents the logical structure of the diagram using an acyclic graph. The root node I0 stands for the entire diagram; (c) the connectivity layer describes connections signalled using arrows and other diagrammatic elements using a cyclic graph; (d) the discourse layer represents rhetorical relations between diagram elements using an acyclic graph: IDENTIFICATION (R1–6), CYCLIC SEQUENCE (R7) and PREPARATION (R8). Edge labels mark nuclei (n) and satellites (s).
The layout segmentation provides an inventory of analytical units that may be picked up for description in the AI2D-RST annotation layers. All annotation layers in AI2D-RST are represented using graphs. Figure 3(b) shows an acyclic graph for the grouping layer, which groups together diagram elements that form larger units. To exemplify, the blob B0 and the text T4 form a group with the identifier G4, which may be then picked up in the connectivity layer in Figure 3(c). The connectivity layer, which represents connections realized using arrows and lines, is represented using a cyclic graph, which means that the nodes and edges may form cycles. Finally, Figure 3(d) shows an acyclic graph for the discourse layer, which introduces additional nodes prefixed with R, which stand for rhetorical relations. RST assigns discourse units with the role of nuclei or satellites, which are marked using the edge labels n and s.
In addition to graph-based representations of diagram structure, AI2D-RST assigns each diagram into one or more categories (Hiippala et al., 2021: 668–669). These categories may be treated as describing the multimodal genres identified in the AI2D-RST corpus as they reflect the rhetorical strategies adopted in the diagrams. For example, the diagram shown in Figure 3 is assigned to the category of a cycle. In the corpus, this information is stored under the root node I0 in the grouping graph (Figure 3(b)). A single diagram may also belong to multiple genres, if the diagram features rhetorical strategies associated with more than one genre defined in the typology shown in Figure 4. The typology of diagram genres was developed during the annotation process and its application exhibited a high degree of agreement between multiple annotators (Hiippala et al., 2021: 676).
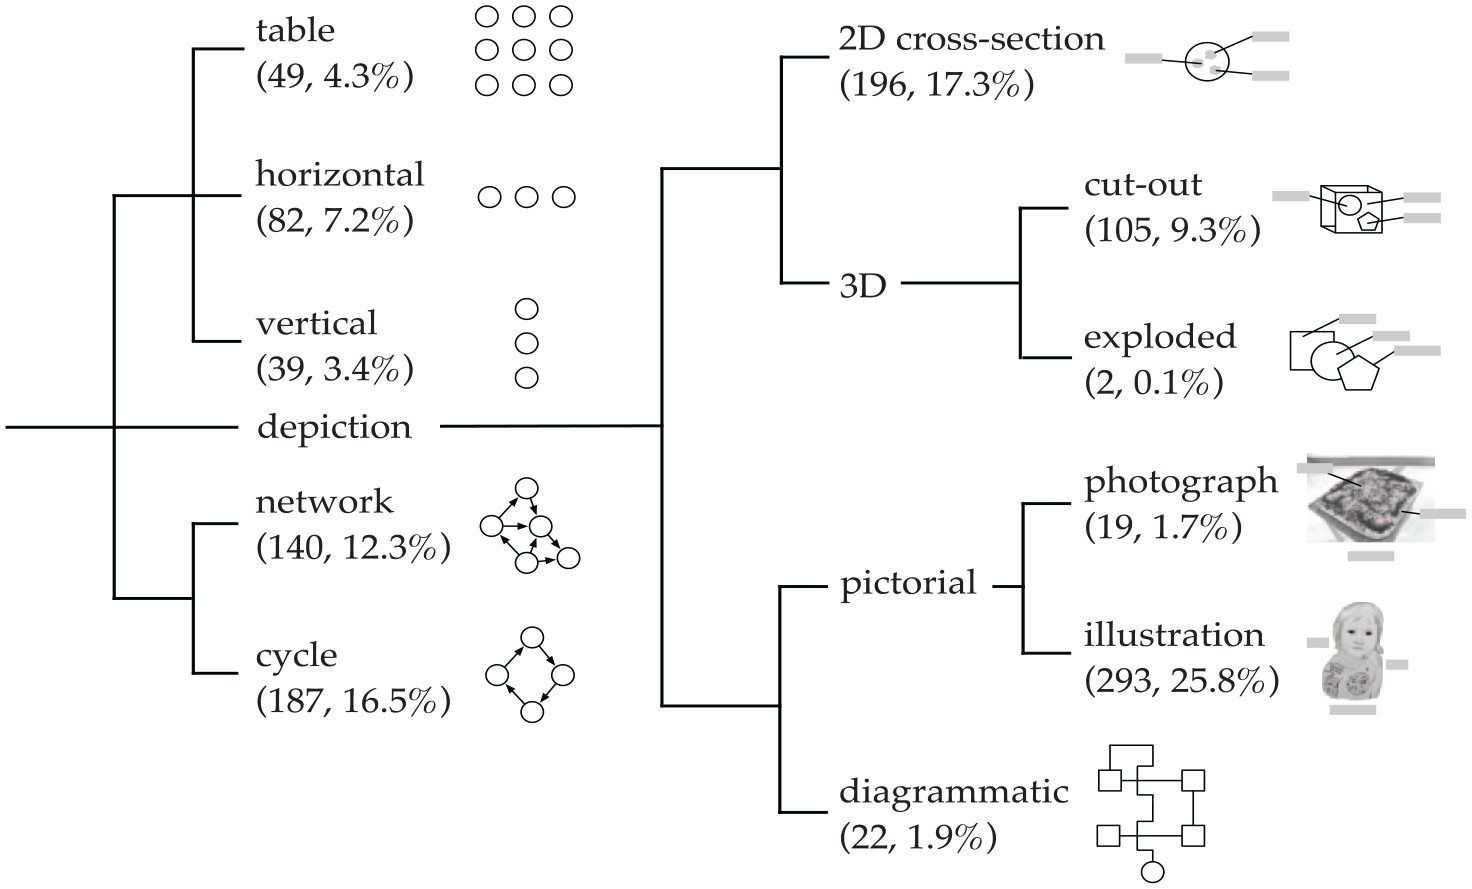
Diagram genres identified by trained experts in the AI2D-RST corpus (Hiippala et al., 2021: 668).
Taken together, the annotation layers in AI2D-RST provide a rich description of the multimodal structure of diagrams. In terms of the model of a diagrammatic semiotic mode presented in Figure 1, the annotations describe instances of expressive resources, their compositional structure and discourse relations that hold between individual expressive resources and their combinations. However, just how the choices made among expressive resources and the discourse relations that hold between them relate to rhetorical strategies adopted within particular genres remains an open question.
Methods
Based on the theoretical model of the diagrammatic semiotic mode presented in Figure 1, I extract the following information about expressive resources and discourse structure for each diagram in the AI2D-RST corpus to identify potential rhetorical strategies. The information for each feature is stored into a vector, or a sequence of numbers. The code for reproducing the analyses performed below is openly available at the following URL: https://doi.org/10.5281/zenodo.7595949
A novel method for extracting a layout ‘fingerprint’ that represents the spatial distribution of expressive resources. The layout space is first divided into a grid with nine cells. Next, the centroid of each text, blob or arrow element is calculated using relative coordinates that range from 0 to 1, where 0 stands for left edge or bottom and 1 stands for right or top of the diagram. The value of the grid cell in which the centroid of element is located is increased by 1. The resulting two-dimensional histograms can be flattened into three 9-dimensional vectors, which can in turn be combined into a 27-dimensional vector for representing the spatial distribution of different expressive resources.
Combining these features yields an 86-dimensional vector, or put differently, a sequence of 86 numbers. Each number in the sequence represents a dimension of variation in the multimodal structure of the diagrams in the AI2D-RST corpus. Because the measurements consist of integers (e.g. counts for nodes and rhetorical relations) and floating-point values in the range [0,1] (e.g. network density and Local Binary Patterns), I scale all integers to the range [0,1], so that the largest integer in each column has a value of 1 whereas the smallest integer equals to 0. In this way, all input features consist of floating-point values within a similar range.
The vector for each diagram determines its point in the 86-dimensional space, which establishes the dimensions of variation in the multimodal structure of the diagrams. This multidimensional space may also be seen as defining the ‘dimensions of semiotic space’, as envisioned by O’Toole (2011: 164), which may be used to map the choices made in diagrams that were preferred over alternative possibilities. These choices give rise to variation in the multimodal structure of diagrams, which may be associated with particular rhetorical strategies. Because variation in an 86-dimensional space is difficult to grasp let alone visualize, I use UMAP – an unsupervised machine learning algorithm for dimensionality reduction – to reduce the vector for each diagram from 86 to just 2 dimensions for visual analysis (McInnes et al., 2018).
The UMAP algorithm learns a mapping between high- and low-dimensional spaces, which attempts to position points that are close to each other in the 86-dimensional space close to each other in the 2-dimensional space. The algorithm is controlled by three user-defined parameters: number of neighbours, minimum distance and distance metric. The number of neighbours defines how many neighbouring data points are considered when learning a mapping between the high- and low-dimensional spaces. The minimum distance defines how close points may be positioned to each other in the low-dimensional space, whereas the distance metric defines how the distance between points is calculated. Based on trials with different combinations of parameters, I set the number of neighbours to 60 and minimum distance to 0.1, and use Manhattan distance as the distance metric.
Visualizing the genre space using the UMAP algorithm
Figure 6 shows the position of each diagram in the AI2D-RST corpus in the two-dimensional space learned by UMAP. The diagrams form several clusters along the vertical and horizontal axes: the upper left-hand side shows a cluster that consists predominantly of cut-outs, cross-sections and illustrations, which are strongly characterized by layouts with graphic elements in the middle, whereas arrows and text are positioned on the edges (Hiippala and Bateman, 2022b: 418). Moving towards the right along the horizontal axis, the illustrations in this cluster gradually merge into a cluster of vertical, horizontal and tabular diagrams, which are primarily defined by their patterned use of layout space. Another cluster towards the bottom consists of cycle and network diagrams, which use diagrammatic elements such as arrows and lines to establish connections between elements (Alikhani and Stone, 2018). Interestingly, the network diagrams are split into two clusters that suggests the presence of two types of network diagrams in the corpus, which will be discussed shortly below (see Figures 6 and 7).
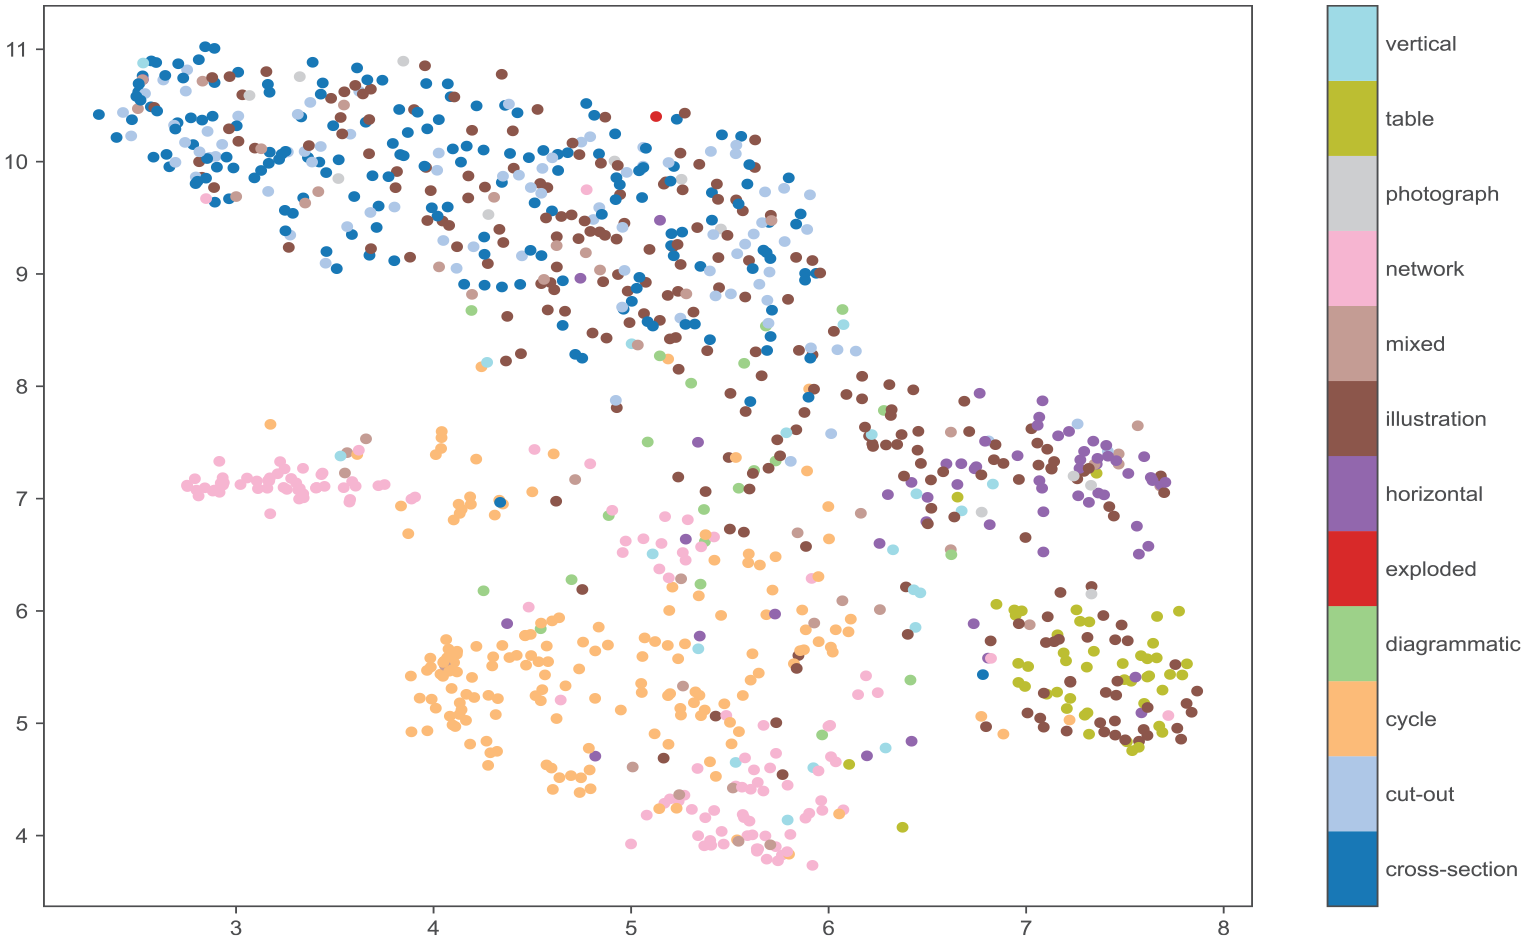
A scatter plot showing the distribution of the AI2D-RST 1000 diagrams in the 2D space learned by UMAP. The plot represents each diagram by a point coloured according to the diagram type, as shown in Figure 4.
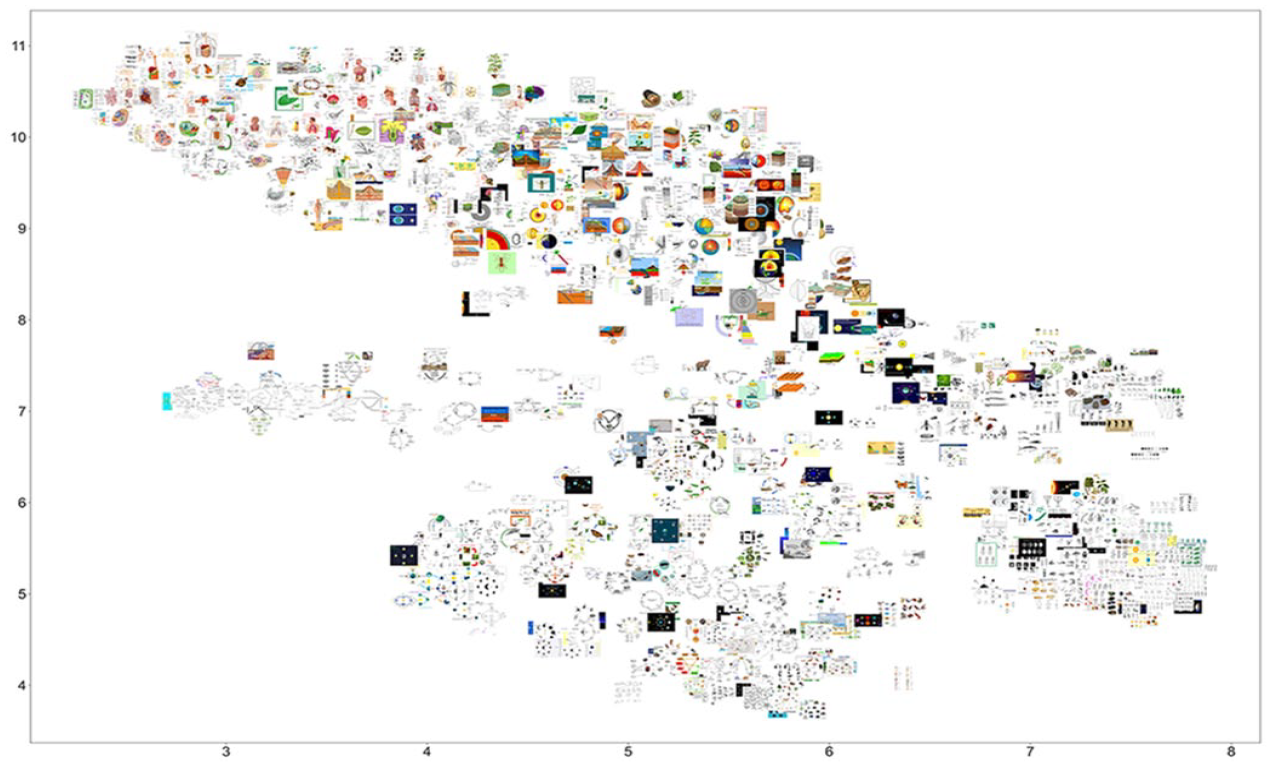
A scatter plot which reproduces that shown in Figure 6, but replaces the points with thumbnails of the diagrams for visual reference.
Apart from this split, the clustering of diagrams in the two-dimensional space largely reflects the main categories defined in the genre typology presented in Figure 4. This is a notable result because the UMAP algorithm was not provided with any information about the genre of each diagram during the learning process. In other words, the algorithm used the features extracted from the corpus to construct clusters that largely follow the main categories identified by trained experts. The presence of clear clusters suggests that the visualization in Figure 6 may be treated as a topological representation of the genre space learned by the UMAP algorithm, which could be used to identify specific genres and the rhetorical strategies that characterize them Bateman (2008: 223–224).
However, in contrast to statistical methods for dimensionality reduction such as Principal Component Analysis, which has been previously used to explore variation in multimodal corpora (see, e.g., Johannessen et al., 2021), there is no way to determine which of the features extracted from the AI2D-RST corpus are encoded in the UMAP representations and to what extent. It is possible, however, to gradually remove input features provided to UMAP to assess how their removal affects the output from the algorithm. In this case, the output is evaluated in terms of the clusters formed by the diagrams in the two-dimensional space in Figure 6, which uses the full set of features extracted from the corpus.
Figure 8 shows six plots for two-dimensional UMAP representations learned from diverse combinations of features, whose names and dimensionality are provided above each plot. To begin with plot A, expressive resources alone are not sufficient for distinguishing between diagram genres. Although networks, cycles and depictive diagrams form their own clusters, they are too dense to reveal variation within genres. In plot B, adding information about connectivity results in looser clusters, which nevertheless cannot be associated with particular diagram genres. In contrast, combining information about expressive resources and discourse semantics in plot C provides distinct yet relatively dense clusters for depictive, cyclic and network diagrams. Overall, the density of the clusters in plots A, B and C makes identifying rhetorical strategies difficult.
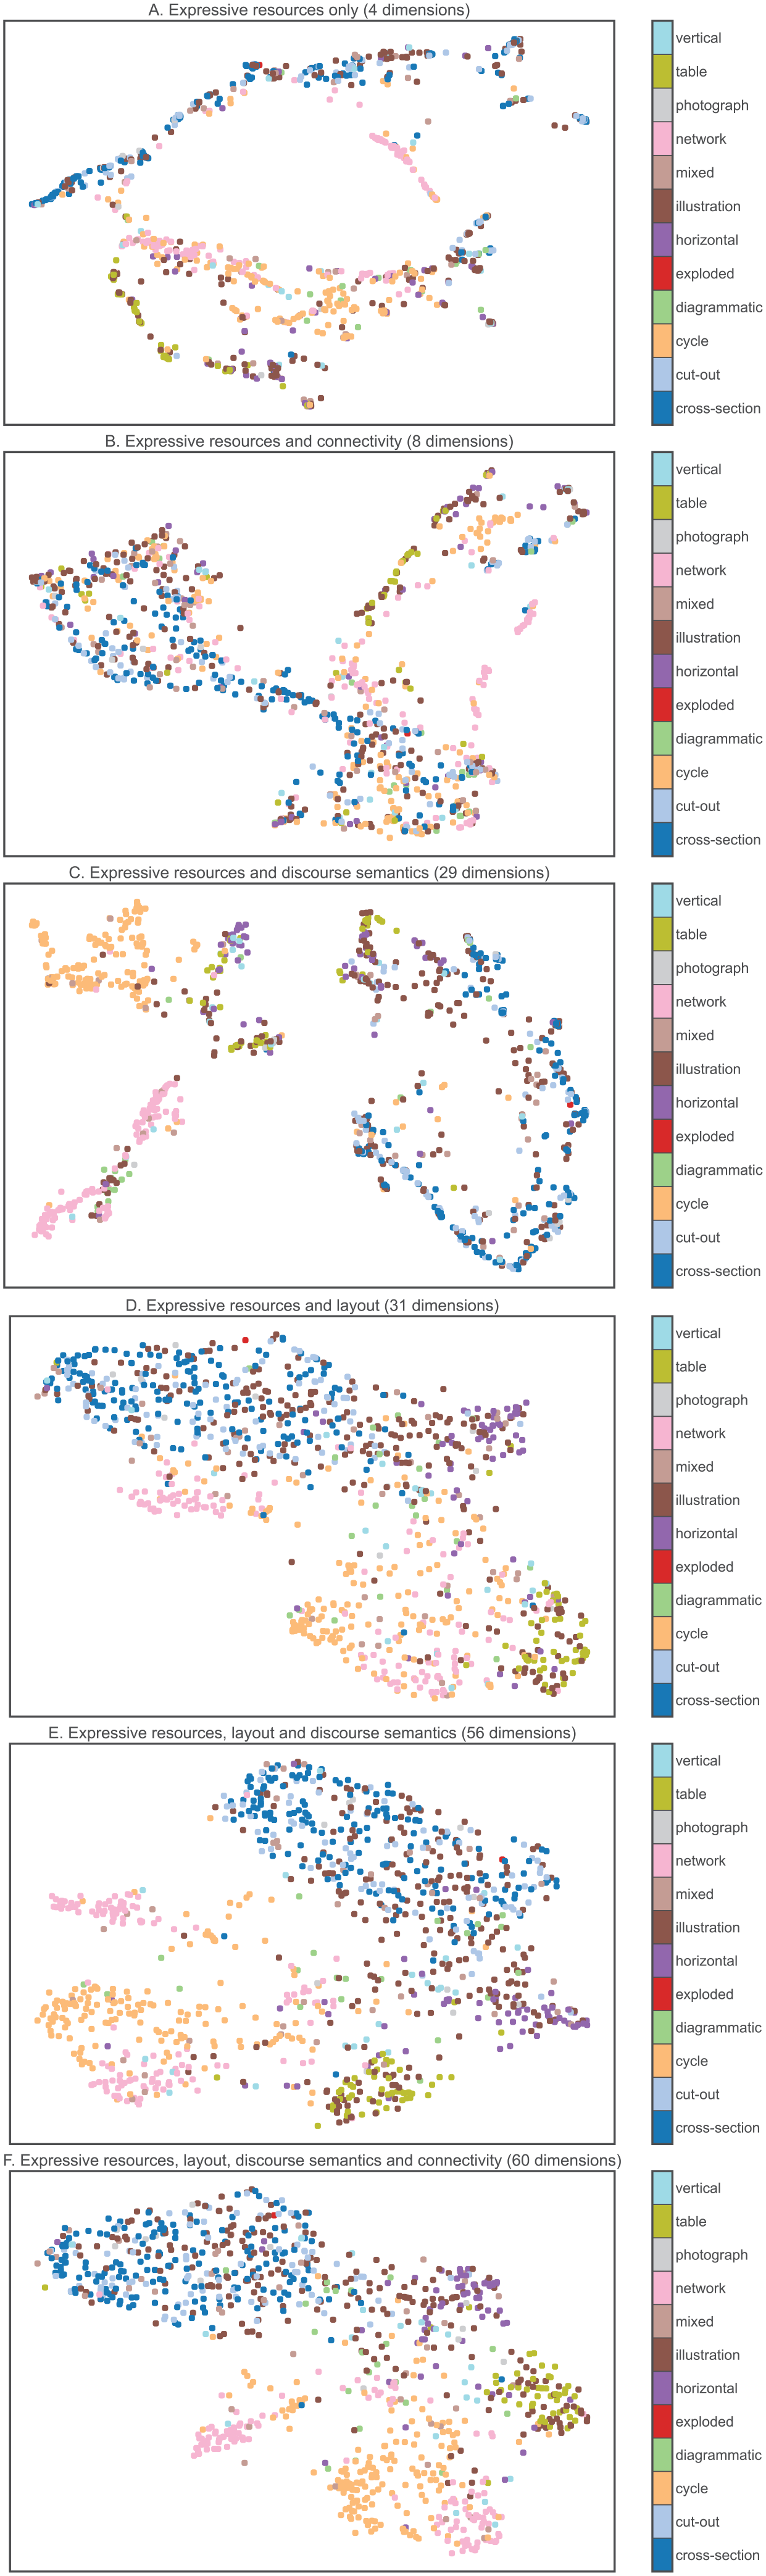
Two-dimensional UMAP representations learned using various input features. Note that all UMAP representations use the same parameters and seed value as those in Figure 6.
Plot D combines information about expressive resources and their spatial layout, which results in loose clusters for diagram genres that also reveal their internal variation. What is remarkable about plot D is how the combination of expressive resources and layout information allows UMAP to learn representations that distinguish between different layouts, which ‘expands’ the genre space and already resembles the plot in Figure 6 to a certain extent. Plots E and F show how adding information about discourse semantics and connectivity makes the distinction between different clusters even clearer. These plots, which notably lack any information about the visual appearance of the diagrams, bear close similarity to the plot in Figure 6.
When comparing the UMAP representations in plots D, E and F with that shown in Figure 6, which represents the visual appearance of diagrams using Local Binary Patterns, it appears that layout information plays a crucial role in establishing distinctions between the diagram genres. This is not surprising, as some diagram genres defined in the AI2D-RST corpus are characterized by strong layout patterns (Hiippala and Bateman, 2022b: 416–417). Whereas adding information about discourse semantics and connectivity sharpens the distinctions between diagram genres, the contribution of visual appearance to the formation of genre space appears limited. Although Hiippala and Bateman (2022b) successfully explored the diversity of visual expressive resources in the AI2D-RST corpus using the combination of Local Binary Patterns and UMAP, applying the same algorithm to entire diagrams cannot be used to distinguish fine-grained differences in diagrammatic representations, such as those that exist between 2D cross-sections and 3D cut-outs.
Overall, the plots in Figure 8 highlight how information about the structure of multimodal discourse – expressive resources, their spatial organization and discourse semantic relations – encode a wealth of structural information about diagram genres, which may be recovered by the UMAP algorithm. Knowing that spatial information plays a crucial role in forming major clusters, it is possible to explore other contributions to variation within the clusters as well. Zooming into the cluster on the top left-hand side in Figure 6 reveals that these diagrams use labels and lines for establishing part–whole relationships, which gradually give way to fewer labels which may also be overlaid on top of the objects on the right-hand side. These may be considered to represent different rhetorical strategies for representing part–whole relations (Hiippala and Bateman, 2022b: 416).
A closer look at the cluster of networks and cycles separated from the larger cluster in Figure 6 reveals that these diagrams use written language rather than visual expressive resources to represent nodes and stages of networks and cycles. This is highlighted in plot D of Figure 8, which limits the input features to expressive resources and layout information, as these diagrams are a part of the cluster that uses written labels to describe part–whole relations. As a rhetorical strategy, preferring written language over depiction arguably increases the level of abstraction in the representation. For this reason, these diagrams could also be considered to represent the ‘diagrammatic’ genre, which consists of schematic diagrams.
Discussion
The computational analysis presented above suggests that the AI2D-RST diagrams may be grouped into four genres based on their multimodal discourse structure. Figure 9 shows manually defined boundaries for each tentative genre in the 2D genre space. The first genre, which covers cut-outs, cross-sections and some of the illustrations could be characterized as depictive. This genre relies on rhetorical strategies for naming and describing objects by combining visual expressive resources, arrows and lines, and written language. The second genre, which may be termed spatially-fixed, consists of diagrams with a tabular or horizontal structure. The rhetorical strategies of this genre are defined by fixed layout positions along the vertical and/or horizontal axes. The third genre, depictive-connected, includes cyclic and network diagrams that set up connections between depicted entities. In contrast, the fourth genre of schematic-connected consists of networks and cycles where written language and symbols are preferred over depiction. These genres use a rhetorical strategy based on the functional use of arrows and lines for establishing connections between entities.
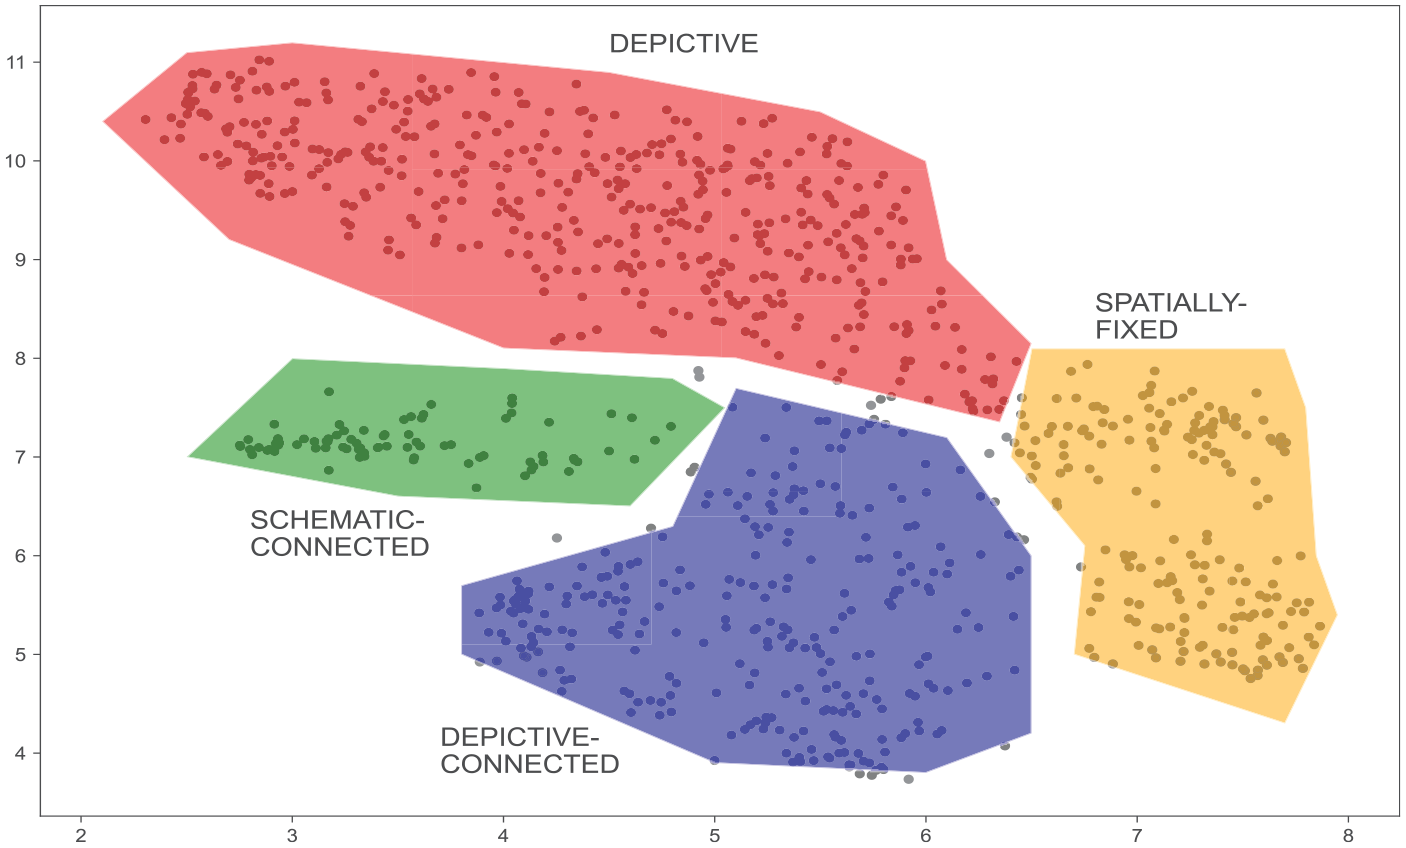
Manually defined boundaries for potential diagram genres identified in the AI2D-RST corpus based on their multimodal discourse structure.
The results show that layout plays a major role in distinguishing between diagram genres in the AI2D-RST corpus. This observation adds to the previous finding that some diagram genres are characterized by specific layout patterns (Hiippala and Bateman, 2022b: 416–417), which calls for further attention to the role of layout in diagrams. Within the diagrammatic semiotic mode, layout may be described as an expressive resource that controls the spatial organization of the diagram, which is responsible for generating expectations towards the structure of multimodal discourse (Bateman, 2008: 248). In other words, the spatial organization of expressive resources provides immediate cues about the potential communicative goals set for the diagram (Purchase, 2014: 67–68). The method proposed in Figure 5 could also be used to analyse how semiotic modes such as text-flow and page-flow, which are regularly deployed in combination with diagrams in various media, use layout as an expressive resource (Bateman, 2008: 176). Similar methods are currently being developed for large-scale analysis of historical newspapers in the field of digital humanities (Wevers, 2023).
However, identifying rhetorical strategies associated with particular diagram genres requires information about the discourse structure. As shown in plot D of Figure 8, adding information about discourse semantics into the input data allowed the UMAP algorithm to distinguish, for example, between network diagrams that use written labels or illustrations for the nodes of the network. These two alternatives may be seen to emerge from drawing on different rhetorical strategies within the network diagram genre. For other genres, such as cut-outs, cross-sections and illustrations, detecting rhetorical strategies is more difficult as the differences are related to the visual representation of the depicted phenomena as opposed to discourse structure.
In this context, it should be noted that basic units of analysis in AI2D-RST – text, blobs and arrows – are inherited from the annotation framework defined in the AI2D corpus (Kembhavi et al., 2016). These units of analysis are not optimal for representation of multimodal discourse structure due to insufficient detail in describing the compositionality of visual expressive resources (Hiippala and Bateman, 2022a, 2022b). Using theories of multimodality to guide the process of decomposing the diagrams into analytical units could yield a more accurate representation of the discourse structure. Such a description could be used to identify rhetorical strategies that distinguish between cut-outs, cross-sections and illustrations, thus offering a more fine-grained view of the depictive genre proposed in Figure 9.
Future work should also leverage information about discourse structure to a greater extent in identifying rhetorical strategies, as counting the occurrence of particular rhetorical relations offers a very limited view of discourse structure. Alternative approaches could involve, for example, using graph neural networks to learn vector representations for the discourse structure of diagrams using the graphs available in AI2D-RST (see Figure 3(d)). Graph neural networks learn about graph structure by passing information between the nodes, while also accounting for the kinds of connections that hold between them (Wu et al., 2021). The application of graph neural networks could yield a more accurate description of discourse structures in diagrams, although interpreting the results would likely face similar challenges as the application of UMAP in this study.
Methodologically, the ability of UMAP to learn about structural differences between diagrams using information about expressive resources and their spatial organization suggests that UMAP could be used to describe diagram genres from a bottom-up perspective (see Figure 9). Information about expressive resources is also easier to acquire than descriptions of discourse structure, which requires expert annotators (Hiippala et al., 2021: 669–673). Interpreting the UMAP visualizations naturally benefits from having access to expert annotations for diagram genres in the AI2D-RST corpus, as each data point may be coloured according to its genre, but the results suggest that the diagram genres could also be defined in a data-driven manner based on the UMAP clusters. Such methods could also benefit the field of diagrams research, where there is a growing need for an empirical basis for classifying diagrams (see, e.g., Purchase et al., 2018).
Conclusion
In this article, I have presented a data-driven analysis of multimodal genre in a large corpus of primary school science diagrams. By using information on the structure of multimodal discourse available in the corpus, I have demonstrated how unsupervised machine learning methods can be used to identify diagram genres and to describe their multimodal characteristics. Beyond diagrams, the methods introduced in this article could adapted to describing genre structures in entire multimodal artefacts. This would, however, require multimodal corpora which are sufficiently large to capture variation within the domain that they represent, which remain rare due to the time, resources and expertise needed for their creation. Creating such corpora, however, is crucial for developing novel methods for conducting empirical research on multimodality, as demonstrated by the new method for quantifying information about the use of layout space introduced in this article, which would not have been possible without the corpus, and turned out to be crucial for describing the genre space.
Footnotes
Acknowledgements
I would like to dedicate this article to the memory of Dr Martin Thomas (University of Leeds) and Professor Giovanni Parodi (Pontifical Catholic University of Valparaíso), who made pioneering contributions to the development of corpus-based approaches to multimodality.
Declaration of Conflicting Interests
The author declared no potential conflicts of interest with respect to the research, authorship and publication of this article.
Funding
The author received no financial support for the research, authorship and publication of this article.
Biographical Note
TUOMO HIIPPALA is Associate Professor in English Language and Digital Humanities in the Department of Languages at the University of Helsinki, Finland. His current research interests include diagrammatic representations, multimodal corpora and computational methods for supporting empirical research on multimodality.