
Abstract
Purpose:
This study aims to identify immunoglobulin-A-nephropathy-related genes based on microarray data and to investigate novel potential gene targets for immunoglobulin-A-nephropathy treatment.
Methods:
Immunoglobulin-A-nephropathy chip data was obtained from the Gene Expression Omnibus database, which included 10 immunoglobulin-A-nephropathy and 22 normal samples. We used the limma package of R software to screen differentially expressed genes in immunoglobulin-A-nephropathy and normal glomerular compartment tissues. Functional enrichment (including cellular components, molecular functions, biological processes) and signal pathways were performed for the differentially expressed genes. The online analysis database (STRING) was used to construct the protein-protein interaction networks of differentially expressed genes, and Cytoscape software was used to identify the hub genes of the signal pathway. In addition, we used the Connectivity Map database to predict possible drugs for the treatment of immunoglobulin-A-nephropathy.
Results:
A total of 348 differentially expressed genes were screened including 107 up-regulated and 241 down-regulated genes. Functional analysis showed that up-regulated differentially expressed genes were mainly concentrated on leukocyte migration, and the down-regulated differentially expressed genes were significantly enriched in alpha-amino acid metabolic process. A total of six hub genes were obtained: JUN, C3AR1, FN1, AGT, FOS, and SUCNR1. The small-molecule drugs thapsigargin, ciclopirox and ikarugamycin were predicted therapeutic targets against immunoglobulin-A-nephropathy.
Conclusion:
Differentially expressed genes and hub genes can contribute to understanding the molecular mechanism of immunoglobulin-A-nephropathy and providing potential therapeutic targets and drugs for the diagnosis and treatment of immunoglobulin-A-nephropathy.
Introduction
Immunoglobulin-A-nephropathy (IgAN), the most common primary glomerulonephritis in the world, is characterized by the presence of IgA immune complex deposits in the glomeruli. 1 The incidence of IgA nephropathy has obvious regionality. It is well known that East and Pacific Asians are more susceptible to IgAN than Africans. 2 The main clinical manifestations in patients with IgAN are gross hematuria or microscopic hematuria, accompanied by different degrees of proteinuria. Follow-up studies have shown that about 20–40% of IgAN patients develop progressive renal insufficiency and/or end-stage renal disease within 10–20 years of diagnosis.3,4 The pathogenesis and progression of IgAN are influenced by immune response, immune mediators, and heredity factors,5,6 but the precise pathogenesis of the disease remains incompletely understood. Numerous studies have suggested that genetic factors may play a notable role in the pathogenesis and development of IgAN. With the emergence of genome-wide association studies, ITGAM -ITGAX, VAV3, CARD9, HLA-DQB1, DEFA, HORMAD2, TNFSF13, PSMB8, CFHR1/CFHR3, CFH, and DEFA have been identified as susceptibility loci for IgAN. 7 With the advancement of modern medicine, the treatment of IgAN has been perfected, but manipulation of signaling pathways or gene targets in the pathogenesis of IgAN can create more effective treatments than ever before. Therefore, it is important to look for new therapeutic targets and potential drugs for IgAN. In recent years, screening and discovery of drugs using gene expression profiles and the Connectivity Map (CMAP) database 8 have become a new hotspot.9,10 In this study, the bioinformatics tools were used to analyze the gene expression profile data of normal people and IgAN patients, to screen the differentially expressed genes (DEGs) related to IgAN, and to analyze the small molecule drugs that have the potential to treat IgAN through the CMAP database. Finally, it provides a reference for the pathogenesis of IgAN and the development of potential therapeutic drugs.
Materials and methods
Data information
The microarray data of IgAN-related GSE93798 11 was downloaded from the GEO database. 12 GSE93798 is based on GPL22945 platform and was composed of 10 glomerular compartment tissue samples from patients with IgAN and 22 normal controls.
Analysis of DEGs
The probe matrix in the expression spectrum chip was converted into a gene matrix using the platform information file. No corresponding gene symbols or multiple gene probe groups were removed or taken the median in the probe group. Then, screening of DEGs between glomerular compartment tissue of IgAN patients and normal controls by limma package 13 in R software (https://www.r-project.org/). The screening criteria for DEGs were an adjusted p value <0.05 and |logFC| (log-fold change) >1.0. Principal component analysis (PCA) and hierarchical clustering were used to analyze the DEGs between IgAN and normal controls.
Functional enrichment analysis of DEGs
Gene Ontology (GO) enrichment 14 was a common method for annotating genes and gene products that can be used to identify characteristic biological properties of high-throughput genomic or transcriptome data. There were three main aspects: Cell Component, Molecular Function and Biological Process. Kyoto Encyclopedia of Genes and Genomes (KEGG) 15 was a knowledge base for gene function system analysis, linking genomic information with high-order functional information for the analysis of gene and biological pathways. Through clusterProfiler package in R software. 16 GO analysis and enriched biological pathways of DEGs could be obtained. And an adjusted p value of <0.05 was set as the cut-off standard.
Protein-protein interaction network construction and selecting the hub genes
The significantly DEGs were introduced into the STRING online database (http://www.string-db.org/). 17 An interaction score >0.7 was set as the cut-off point and was used for the protein-protein interaction (PPI) networks of DEGs. Finally, visualization of PPI networks were obtained from the STRING online database through Cytoscape software. 18 In addition, the MCODE plugin in Cytoscape was used to filter the significant nodes (central proteins) in the PPI networks. 19
CMAP analysis
Effective therapeutic drugs for IgAN were screened by the CMAP database. DEG files were uploaded to the CMAP website. The screening criteria were set to Mean < −0.4 and p <0.05.
Results
Identification of DEGs
The DEG screening criteria were set in the limma package, and 348 DEGs were obtained, in which 107 were up-regulated and 241 were down-regulated. The volcano plot (Figure 1) showed the distribution of DEGs between IgAN and normal controls.

Volcano plot of gene expression in microarray data GSE93798, with a threshold of p value and |logFC|>1 for filtering differentially expressed genes (DEGs). Blue represents down-regulated genes, red represents up-regulated genes, and yellow means no significant DEGs. Up: up-regulated DEGs; down: down-regulated DEGs; stable: non-differentially expressed genes.
Cluster and PCA for DEGs
The results of cluster analysis of the top 200 DEGs (Figure 2) and PCA (Figure 3) showed that IgAN samples could be significantly distinguished from normal controls. PCA indicated the similarity of the samples within the group and the differences between the groups. Each point in the graph represented a sample, and the higher the degree of aggregation between the samples, the higher the similarity of the samples. In this experiment, within the IgAN group and the control group there was high similarity but there was great difference between the two groups.

Heatmap of the top 200 differentially expressed genes (DEGs) screened by the limma package. Horizontal axis shows samples of microarray data and vertical axis shows DEGs. Orange areas represent up-regulated DEGs and blue areas represent down-regulated DEGs in glomerular compartment tissue samples from patients with immunoglobulin-A-nephropathy (IgAN) and normal controls.

The principal component analysis for differentially expressed genes (DEGs). The blue points show immunoglobulin-A-nephropathy (IgAN) sample data and the red points show healthy control sample data.
Functional enrichment analysis of DEGs
GO enrichment analyses of 241 down-regulated genes and 107 up-regulated genes was performed by clusterProfiler package in R software. The top 10 GO terms with the highest degree of enrichment in each category of the up-regulated and down-regulated genes were shown (Figure 4). In the biological process group, up-regulated genes mainly concentrated on leukocyte migration, angiogenesis, and cytokine secretion, and the down-regulated genes mainly concentrated on alpha-amino acid metabolic process, cellular amino acid metabolic process, and organic anion transport. In the molecular function group, up-regulated genes mainly focused on glycosaminoglycan binding, extracellular matrix structural constituent, and platelet-derived growth factor binding, and the down-regulated genes mainly focused on secondary active transmembrane transporter activity, transcriptional activator activity, and RNA polymerase II transcription regulatory region sequence-specific binding. In the cellular component group, up-regulated genes mainly enriched in collagen trimer, proteinaceous extracellular matrix, and fibrillar collagen trimer, and the down-regulated genes mainly enriched in apical part of cell, apical plasma membrane, and peroxisome. Additionally, with a p value <0.01 as the cut-off criterion, the KEGG pathways associated with the up-regulated and down-regulated genes were presented (Figure 5). We found that related pathways of up-regulated genes were mainly involved in AGE-RAGE signaling pathway in diabetic complications, extracellular matrix (ECM)-receptor interaction, and protein digestion and absorption. The pathways of down-regulated genes were significantly enriched in AGE-RAGE signaling pathway in glycine, serine and threonine metabolism, phenylalanine metabolism, and arginine and proline metabolism.

The top 10 terms in each Gene Ontology (GO) analysis. The vertical items are the name of the GO terms. The horizontal and the length of the graph represent the gene numbers. The colors in the graph denoted the different GO categories. (a) GO terms in each category of the up-regulated genes. (b) GO terms in each category of the down-regulated genes.
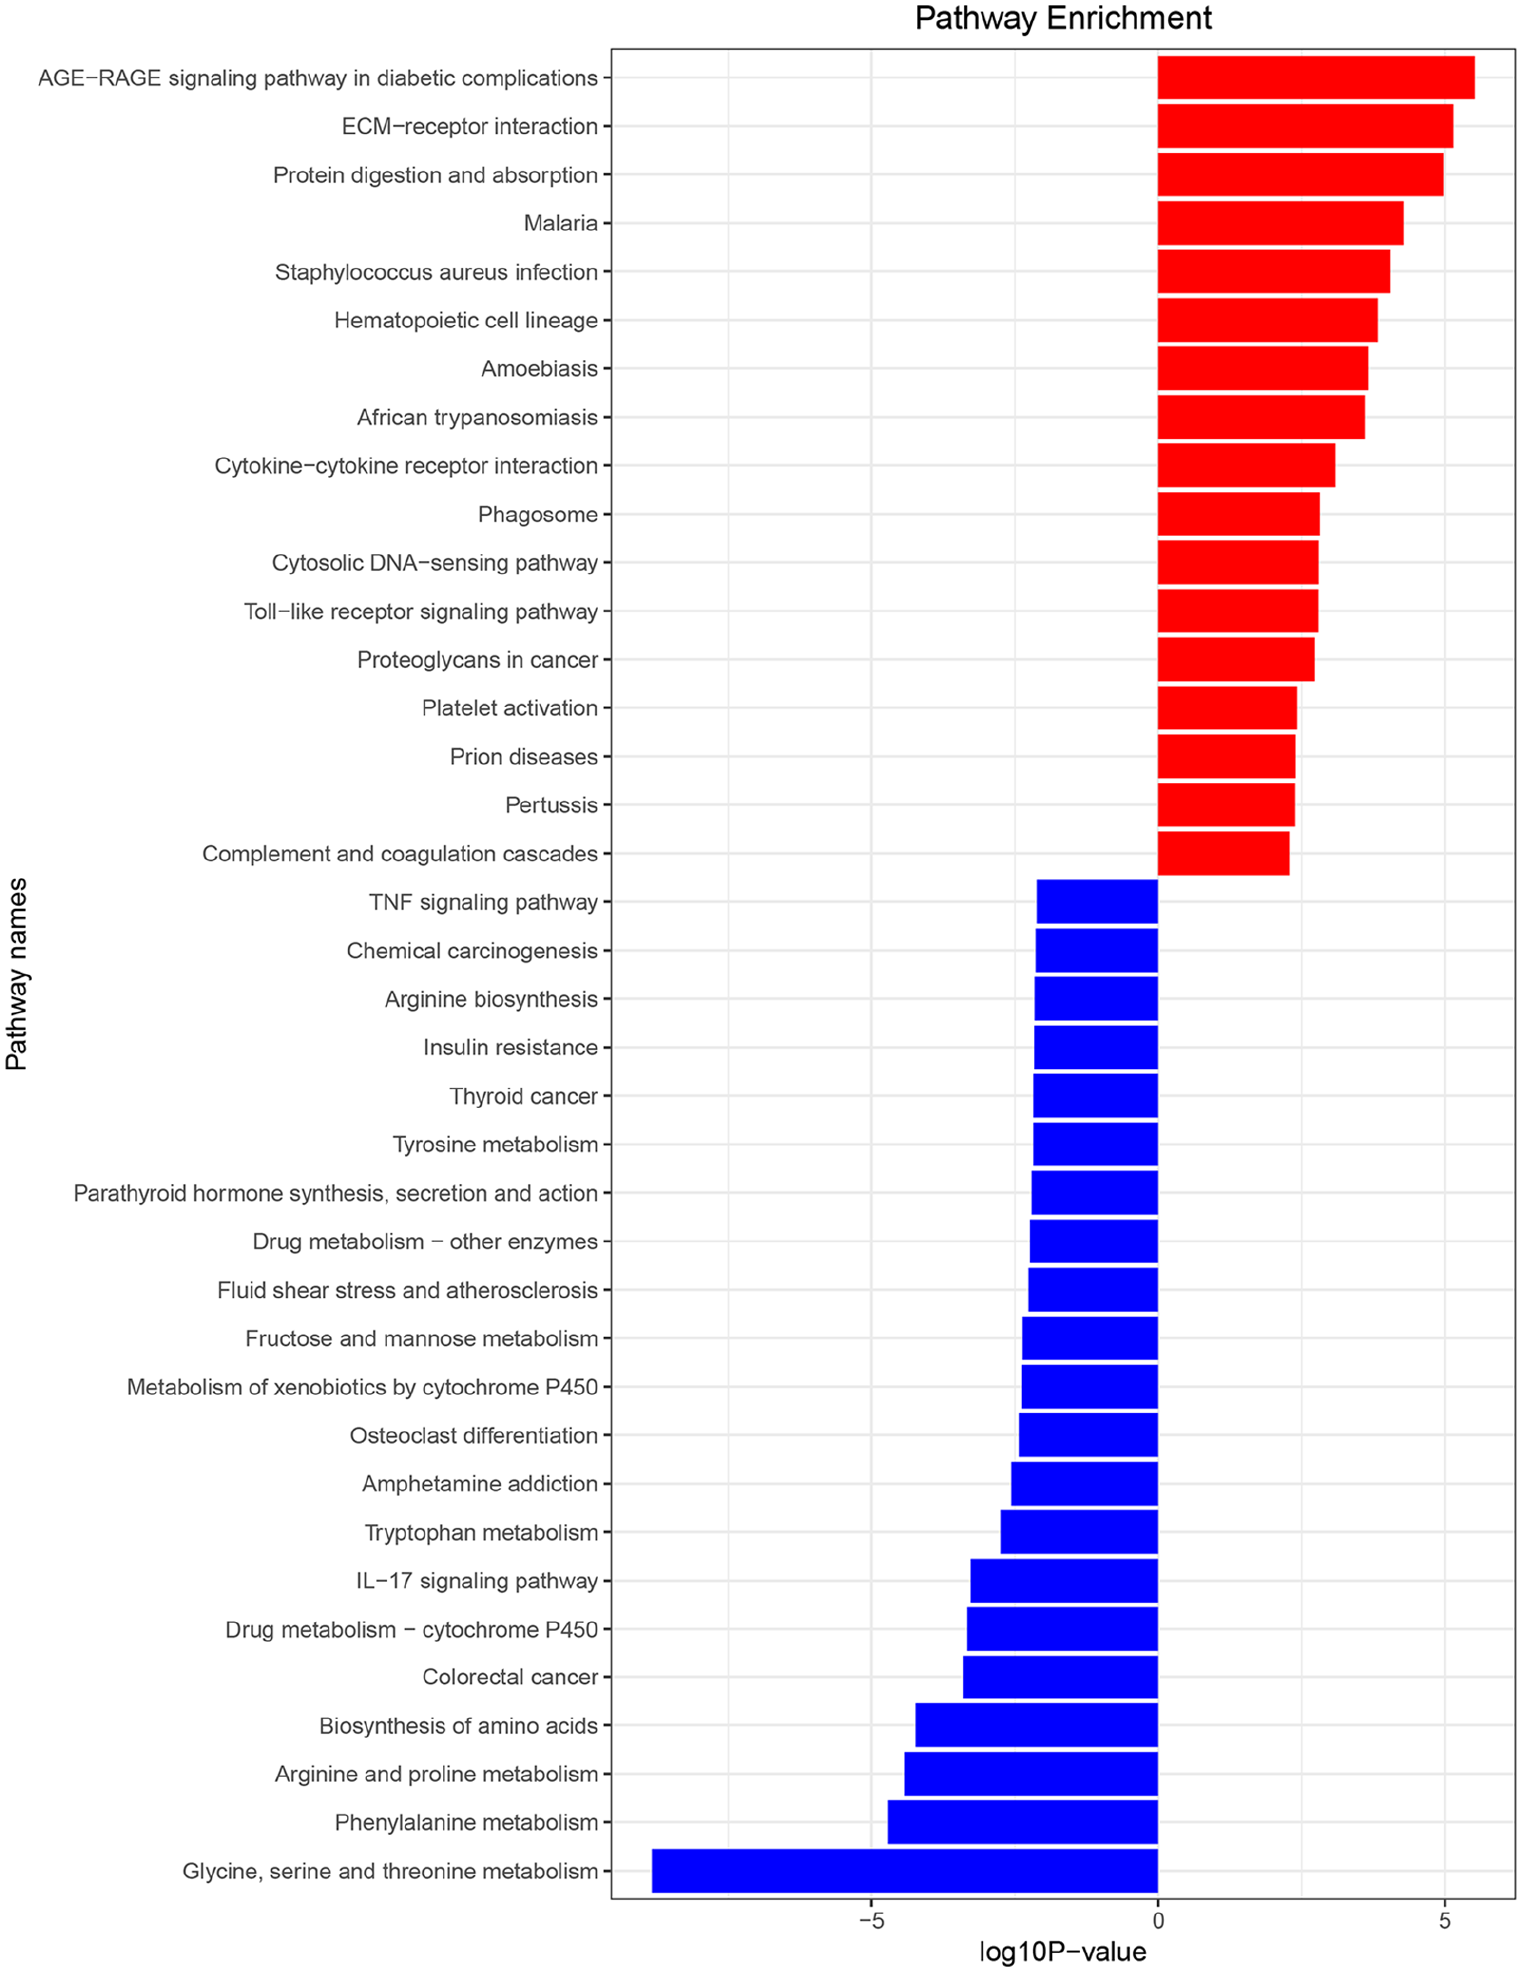
Kyoto Encyclopedia of Genes and Genomes (KEGG) pathway analysis for differentially expressed genes (DEGs). The horizontal axis represents the -log (p value) of the pathway and the vertical axis represents the pathway list. Red bars represent KEGG pathways associated with the up-regulated DEGs. Blue bars represent KEGG pathways associated with the down-regulated DEGs.
PPI network construction and hub gene identification
The PPI networks data file of STRING was imported into Cytoscape, and the PPI networks were composed of 221 nodes and 521 edged (Figure 6(a)). In the PPI networks, this study showed the top five DEGs with the highest node degrees were Jun proto-oncogene (JUN; degree, 22), complement C3a receptor 1 (C3AR1; degree, 21), fibronectin 1 (FN1; degree, 21), angiotensinogen (AGT; degree, 20) and Fos proto-oncogene (FOS; degree, 20). In addition, one of the most important modules was identified by MCODE plug-in of Cytoscape. In this module, 11 central genes were identified (Figure 6(b)), including CXCL11, APLNR, CXCL10, CX3CR1, CCL4, C3AR1, SUCNR1, FPR3, CXCR2, AGT, and CXCL2. We also performed GO and KEGG functional analysis on these genes using Clusterprofiler (Figure 7).

Protein-protein interaction (PPI) networks of the common differentially expressed genes (DEGs) and module analysis. (a) PPI network of DEGs in patients with immunoglobulin-A-nephropathy (IgAN) compared with controls. Red nodes indicate up-regulated genes. Blue nodes indicate down-regulated genes. Oval-shaped nodes indicate DEGs. (b) One of the most important modules was identified by MCODE plug-in of Cytoscape in PPI network.

Significantly enriched Gene Ontology (GO) terms of the modular genes. (a) Significantly enriched GO terms of the modular genes. (b) Significantly enriched Kyoto Encyclopedia of Genes and Genomes (KEGG) pathways of the modular genes. The color of each bubble represents the false discovery rate (FDR) for that term, with red representing greater significance. The GeneRatio refers to the proportion of enriched genes for each term.
Identification of potential therapeutic drugs for IgAN
The CMAP database (http://portals.broadinstitute.org/cmap/) was used to screen potential drugs for IgAN. The smaller the p value, the higher the correlation between the genes and the drugs. The most significant three drugs were thapsigargin, ciclopirox, and ikarugamycin (Table 1).
Identification of potential therapeutic drugs for IgAN via the CMAP database.

CMAP: Connectivity Map; IgAN: immunoglobulin-A-nephropathy.
Discussion
In this study, DEGs between IgAN patients and healthy people were analyzed using bioinformatics. The results showed that 348 DEGs in IgAN samples were identified, including 107 up-regulated and 241 down-regulated genes. In GO analysis, the up-regulated genes were related to collagen trimer, leukocyte migration, and angiogenesis, and the down-regulated genes were highly enriched in amino acid metabolic process and organic acid transport. In the KEGG analysis, the up-regulated genes were mostly enriched in AGE-RAGE signaling pathway and ECM-receptor interaction. The down-regulated genes were mostly enriched in amino acid metabolism. The above enrichment analysis results can help us further study the role of DEGs in IgAN.
In this study, DEGs were identified from the GSE93798 microarray datasets. C3AR1, AGT, JUN, FOS, FN1, and SUCNR1 were selected as hub genes. From the PPI network, we found that C3AR1 and AGT not only have high node degrees, but also exist in the hub module. C3AR1 is the receptor for C3a, which is a key mediator of inflammation and is engaged in cellular inflammatory response. 20 Previous studies have found that plasma concentrations of C3a increased remarkably in patients with IgAN.21,22 The increase of C3a in urine and kidney and the expression of C3aR in kidney are also closely related to the severity of renal injury. 23 Combined with previous experiments, we surmised that C3AR1 can be used as one of the targets for the diagnosis and targeted treatment of IgAN in the future. 24 AGT is the only substrate of renin-angiotensin system (RAS). It is proved that the expression of AGT in kidney is increased in patients with IgAN.25–27 However, some studies in Chinese and Japanese have found there was no association between IgAN and AGT.28,29 In 2012, Kidney Disease Improving Global Outcomes introduced the clinical practice guidelines for IgAN suggesting that RAS blockade is listed as the cornerstone of therapy for IgAN. JUN and FOS are part of the transcription factor AP-1, which regulates the expression of genes involved in proliferation, cell death, differentiation, and inflammation. 30 The increased expression of AP-1 was correlated with IgAN. 31 This result was consistent with a previous research. 32 Fn1 is a noncollagenous glycoprotein and the principal component of the ECM. The previous study revealed that urinary FN excretion may be a sign of disease activity in IgAN. 33 SUCNR1 (GPR91) was a hub protein in the hub module in the PPI network. It is in the G protein-coupled receptor family, which is the largest proteome involved in biofilm signal transduction. 34 SUCNR1 has previously been shown to regulate the secretion of renin in the kidney. It has been proposed to be involved in the development of diabetic nephropathy. 35 However, SUCNR1 was not implicated in IgAN based on current studies. We speculate that this gene might be another novel biomarker in the pathogenesis of IgAN and more validations should be performed to confirm this prediction.
Using the MCODE in Cytoscape, we filtered 11 hub genes in the PPI network. These genes mainly participated in chemokine signaling pathway, cytokine-cytokine receptor interaction, and Toll-like receptor signaling pathway. The factors contained in these pathways that have been shown to be involved in the occurrence and progression of kidney disease.36–40 Our study demonstrated significantly high expression of CXC chemokines (CXCL11, CXCL10, and CXCL2), chemokine receptor (CX3CR1) and chemokine ligand 4 (CCL4), which is also involved in the chemokine signal pathway. Therefore, we predict that these pathways may play a vital role in the IgAN progression.
In this study, CMAP analysis was used to examine the potential small molecule drugs for the treatment of IgAN. As a result, the most significant three compounds were thapsigargin, ciclopirox, and ikarugamycin. A study in 1990 showed that thapsigargin is an inhibitor of the sarco-endoplasmic reticulum Ca2+-ATPase. 41 It was mainly used in targeted treatment of tumors, including prostate cancer (G115) and hepatocellular carcinoma (G202). 42 Ciclopirox olamine was widely used in the synthetic antifungal agent and iron chelator. 43 Its antitumor effect has also been known in recent years. 44 Ikarugamycin was an antibiotic with strong antiprotozoal activity. 45 Although there is no relevant literature to study the effect of these compounds on IgAN treatment, we speculate that these small molecule drugs may have potential for the treatment of IgAN by interfering with hub genes.
This study suggested that DEGs were mainly involved in the chemokine signaling pathway, cytokine-cytokine receptor interaction and Toll-like receptor signaling pathway, and the core genes JUN, C3AR1, FN1, AGT, FOS, and SUCNR1 may be the key factors related to the pathogenesis of IgAN. Thapsigargin, ciclopirox, and ikarugamycin may become new drugs in the treatment of IgAN, which provide a series of potential targets for the follow-up study of the molecular mechanism of IgAN and its therapeutic drugs, but further experiments are necessary to confirm the function of DEGs and small-molecule drugs.
Supplemental Material
Supplementary-Data1-Differentially_expressed_genes – Supplemental material for Identification of key genes, pathways and potential therapeutic agents for IgA nephropathy using an integrated bioinformatics analysis
Supplemental material, Supplementary-Data1-Differentially_expressed_genes for Identification of key genes, pathways and potential therapeutic agents for IgA nephropathy using an integrated bioinformatics analysis by Xiaoxue Chen and Mindan Sun in Journal of the Renin-Angiotensin-Aldosterone System
Supplemental Material
Supplementary-Data2-GO_analysis – Supplemental material for Identification of key genes, pathways and potential therapeutic agents for IgA nephropathy using an integrated bioinformatics analysis
Supplemental material, Supplementary-Data2-GO_analysis for Identification of key genes, pathways and potential therapeutic agents for IgA nephropathy using an integrated bioinformatics analysis by Xiaoxue Chen and Mindan Sun in Journal of the Renin-Angiotensin-Aldosterone System
Supplemental Material
Supplementary-Data3-KEGG_pathway_analysis – Supplemental material for Identification of key genes, pathways and potential therapeutic agents for IgA nephropathy using an integrated bioinformatics analysis
Supplemental material, Supplementary-Data3-KEGG_pathway_analysis for Identification of key genes, pathways and potential therapeutic agents for IgA nephropathy using an integrated bioinformatics analysis by Xiaoxue Chen and Mindan Sun in Journal of the Renin-Angiotensin-Aldosterone System
Supplemental Material
Supplementary-Data4-compounds_predicted_by_cMAP_database – Supplemental material for Identification of key genes, pathways and potential therapeutic agents for IgA nephropathy using an integrated bioinformatics analysis
Supplemental material, Supplementary-Data4-compounds_predicted_by_cMAP_database for Identification of key genes, pathways and potential therapeutic agents for IgA nephropathy using an integrated bioinformatics analysis by Xiaoxue Chen and Mindan Sun in Journal of the Renin-Angiotensin-Aldosterone System
Footnotes
Declaration of conflicting interests
The author(s) declared no potential conflicts of interest with respect to the research, authorship, and/or publication of this article.
Funding
The author(s) received no financial support for the research, authorship, and/or publication of this article.
Supplemental material
Supplemental material for this article is available online.
References
Supplementary Material
Please find the following supplemental material available below.
For Open Access articles published under a Creative Commons License, all supplemental material carries the same license as the article it is associated with.
For non-Open Access articles published, all supplemental material carries a non-exclusive license, and permission requests for re-use of supplemental material or any part of supplemental material shall be sent directly to the copyright owner as specified in the copyright notice associated with the article.