
Abstract
Objective:
The objective of this study was to make use of a quantitative and qualitative approach comparing the systemic renin-angiotensin system (RAS) of hypertensive black and white African men by using RAS equilibrium analysis.
Materials and methods:
This sub-study involved 23 black (n = 15) and white (n = 8) hypertensive men aged 39.5–41 years, living in the North West Province of South Africa. The RAS-Fingerprinting was determined with LC-MS/MS quantification of angiotensin peptides. Blood pressure and other variables were determined with known methods.
Results:
The main finding of this study was the significant lower Ang I (<5.0 and 45.1 pg/ml; p = 0.005) and Ang II (15.6 and 123.9 pg/ml; p ⩽ 0.001) encountered in the hypertensive black African men compared to their white counterparts. Levels of Ang 1-5 (downstream metabolite of Ang 1-7) (1.8 and 3.0 pg/ml), were detected in black and white hypertensive men, respectively.
Conclusions:
The observed differences between circulating RAS components, which are reflected via equilibrium angiotensin levels, point to a distinctive molecular regulation of the RAAS in the two study cohorts. The increased peripheral resistance observed in hypertensive black individuals might take over a dominant role in control of blood pressure in this study population. A novel highly sensitive LC-MS/MS method resolved the issue of peptide recovery variations during sample preparation by using internal standards for each individual angiotensin metabolite.
Introduction
The renin-angiotensin system (RAS)
The RAS is a proteolytic cascade that consists of multiple enzymes and effector peptides. Angiotensin-converting enzyme (ACE) is one of the major enzymes in the RAS catalyzing the proteolytic conversion of the decapeptide angiotensin I (Ang I) to the octapeptide angiotensin II (Ang II, Ang 1-8).1,2 Ang II is involved in blood pressure and volume homeostasis as well as the development of hypertension, by promoting vascular smooth muscle cell migration, hypertrophy and delayed hyperplasia. 2 All components of the RAS are present in human plasma with renin the rate-limiting enzyme of the RAS, catalyzing the conversion of pro-hormone angiotensinogen (10 N-terminal amino acids of the 452 amino acid-secreted protein) to Ang I. 3 Ang I is the substrate for the production of the other angiotensin metabolites. Angiotensinogen is produced by the liver and secreted to the circulation, generating a pool of angiotensinogen with concentrations in humans normally in a range of 5–50 µg/ml (100–1000 nM). 3
Typical baseline values for plasma renin activity (PRA) in humans range between 0.1 and 2.35 (nmol/l)/h, 4 while PRA values up to 20 (nmol/l)/h might be reached under pathologic conditions or on treatment with RAS blockers.5,6 Concentration and post-translational modifications of angiotensinogen can affect PRA. 7
High renin levels result in increased Ang II formation, could be detrimental to the vasculature and may play a role in hypertension, stroke, retinal detachment, myocardial infarction, heart and kidney failure, renal fibrosis, nephropathy and albuminuria.3,8,9 However, Opie and Seedat 10 suggested that low plasma renin might also be one of the contributing factors to hypertension in sub-Saharan black populations and ascribed the low renin levels to be environmental in origin. The trend toward low renin levels may also be due to abnormalities such as excessive renal sodium reabsorption,10-12 reduction in the rate of renin secretion 13 and genetic abnormalities in the RAS or related genes. 10 It seems that not only high renin states but also low renin hypertension is associated with detrimental end-organ damage and a worse prognosis compared to hypertension with normal renin levels.14,15
A novel method of RAS analysis
The biochemical analysis of the RAS represents a major challenge to analytical procedures, as it is well known that the quantification of angiotensin peptides is associated with technical issues. A novel highly sensitive liquid chromatography-mass spectrometry (LC-MS)/MS method 1 resolved the issue of peptide recovery variations during sample preparation by using internal standards for each individual angiotensin metabolite. 1 Internal standards are spiked to each sample before starting extraction procedures and are simultaneously detected in the final readout using an MS/MS analyzer operated in-line with an ultra-performance LC unit, which allows highly accurate quantification of angiotensin metabolites in tissue and plasma samples. The second major obstacle in biochemical evaluation of the RAS in patients is represented by pre-analytical variations. Angiotensin peptides are components of a rapidly flowing metabolic pathway characterized by the ongoing formation and degradation of individual angiotensin metabolites in vivo. Standard procedures are aiming to block all enzymes involved in this metabolism during blood collection. This is a valid approach if it can be ensured that the inhibitor cocktail used contains all inhibitors necessary to block all angiotensin-processing enzymes involved in peptide metabolism, which is not achieved by using commercially available protease inhibitor tubes, usually lacking appropriate renin or aminopeptidase inhibitors. Beside the qualitative composition of these protease inhibitor cocktails, the blood collection process itself can result in artifacts if mixing the inhibitor cocktail with the blood sample takes too long, which is a critical issue in animal studies using mice.
We followed a quantitative and qualitative approach comparing the systemic RAS of hypertensive black and white African men by using RAS equilibrium analysis. Equilibrium analysis provides a valid alternative to the measurement of circulating angiotensin levels and can be measured in standard Li-heparin or serum samples. Equilibrium angiotensin profiles are composed of absolute levels of up to 10 angiotensin metabolites determined in a single sample and therefore provide an integrated picture of the activation state and enzymatic properties of the systemic RAS, which serves as a substrate supply for RAS enzymes on endothelial surfaces and in tissues.
Methods and materials
Study design and participant selection
This is a sub-study of the South African study regarding the role of Sex, Age and Ethnicity on Insulin sensitivity and Cardiovascular function (SAfrEIC) study. This sub-study involved 23 black (n = 15) and white (n = 8) hypertensive men aged 39.5–41 years, living in the North West Province of South Africa. Exclusion criteria for this study were: previously diagnosed with diabetes (type 1 and 2), heart disease (bypass surgery, myocardial infarction or angina), stroke, asthma or any other serious medical conditions or use of any chronic medication. The inclusion criteria were: apparently healthy men and the hypertensives included in this sub-study were newly diagnosed after the study commenced. Newly diagnosed hypertensives who received medications that could interfere with the RAS were excluded in the analysis of this sub-study.
The Ethics Committee of the North-West University, Potchefstroom campus, approved this study. Before being recruited, all interested participants were fully informed about the objectives and procedures of this study. An interpreter was available to relay the information to individuals in their home language. Written informed consent was obtained from all individuals who decided to participate.
Organizational procedures
Participants reported to the Metabolic Unit facility on the Potchefstroom campus of the North-West University at 07:00 a.m. All the participants were introduced to the set-up and after the organizational procedures were explained to them, they all signed informed consent forms. Individuals received a participant sheet that guided them through the different research stations where the various measurements were performed. During the course of the morning, basic health and demographic questionnaires were completed, a fasting blood sample was taken and anthropometric measurements were performed. Afterwards blood pressure and pulse wave velocity measurements were taken with a Finometer and a Complior device. When all questionnaires and cardiovascular measurements were completed, each participant received a small financial compensation for travel purposes, as well as a breakfast. In the event of an individual being newly identified with hypertension or diabetes, individuals were referred to their local clinic, hospital or physician. Participants received a short report containing their health information.
Biochemical analysis
Serum high-sensitivity C-reactive protein (CRP), creatinine and gamma-glutamyltransferase (GGT) were analyzed with the Konelab20iTM auto-analyzer (Thermo Fisher Scientific, Vantaa, Finland). The serum amino-terminal pro-hormone B-type natriuretic peptide (NT-proBNP) levels were determined with an electrochemiluminescence immunoassay (Elecsys 2010, Roche Diagnostics, Mannheim, Germany).
Equilibrium RAS-Fingerprint analysis: Quantification of angiotensin metabolites in equilibrated serum
Serum was obtained by centrifugation (2000 g, 4°C, 10 min) and stored at -80°C until shipped for analysis. Following ex vivo incubation at 37°C for one hour (pH = 7.4), serum was stabilized and subjected to LC-MS/MS quantification of equilibrium angiotensin peptide levels (Attoquant Diagnostics, Vienna, Austria). Briefly, stable-isotope-labeled internal standards for angiotensin metabolites (Ang I, Ang 1-9, Ang II, Ang 2-8, Ang 3-8, Ang 1-7, Ang 1-5, Ang 2-7, Ang 3-7 and Ang 2-10) were added to the samples at a concentration of 200 pg/ml each. Following C18-based solid-phase-extraction, participants underwent LC-MS/MS analysis using a reverse-phase analytical column (Acquity UPLC® C18, Waters) operating in line with a XEVO TQ-S triple quadrupole mass spectrometer (Waters) in multiple reaction monitoring (MRM) mode. Two different mass transitions were measured per peptide, and angiotensin concentrations were calculated by relating endogenous peptide signals to internal standard signals under consideration of the corresponding response factors determined by sample specific calibration. A signal-to-noise ratio of 10 was considered as the quantification threshold for endogenous peptide signals, resulting in indicated lower levels of quantification.
Equilibrium RAS analysis, which has been used in this study, does not require any stabilization during sample collection, allowing standardized analysis of clinical samples. Following separation of serum using standard serum tubes, samples were frozen and shipped for analysis. Following rapidly thawing of the serum, the peptide cascade was allowed to re-establish under controlled pH at 37°C. Angiotensinogen is present in a vast excess, resulting in a constant Ang I formation rate that leads to the establishment of stable equilibrium levels of downstream angiotensin metabolites, which are readily formed as all angiotensin metabolizing enzymes are still active in the sample and present at huge amounts when compared to the very low concentrations of angiotensins, which are in the picomolar range. After reaching equilibrium, where the formation and the degradation rate of each individual peptide are equal, these levels can be rapidly and effectively stabilized and are further subjected to LC-MS/MS analysis as described above. The combination of equilibrium analysis with LC-MS/MS analysis is compatible with frozen heparin plasma and serum samples and can be used to access the biochemical state of the RAS at the patient-specific level without pre-analytical or methodological obstacles.
Anthropometric measurements
Body height was measured using the Invicta Stadiometer (IP 1465, London, UK). Body mass was measured using a digital scale (Precision Health Scale, A & D Company, Japan) in order to calculate the body mass index (BMI). 16 The Baecke physical activity questionnaire was employed to obtain the Total Activity Index of each participant.
Cardiovascular measurements
Pulse wave velocity (PWV) was measured using the Complior SP apparatus (Artech Medical, Pantin, France). The following distance was measured on the left side of each participant: carotid dorsalis-pedis (from the suprasternal notch to the pedalis artery in the foot) distance. The subtraction method was used—the distance from the carotid artery to suprasternal notch was subtracted from the distal measurement. The PWV was measured while the participant was in a supine position.
A five-minute continuous measurement of cardiovascular variables using the Finometer™ device (FMS, Finapres Measurement Systems, Amsterdam, Netherlands)17,18 was taken and analyzed with the Beatscope 1.1 software program. This device computed all cardiovascular variables and stored the data in computer files. The information was further integrated to obtain the systolic (SBP) and diastolic blood pressure (DBP), arterial Windkessel compliance (Cwk) and total peripheral resistance (TPR) of each individual.
Statistical analysis
The data were statistically analyzed by making use of the Statistica 13 software (StatSoft Inc, Tulsa, OK, USA). Data are presented as mean values or median values with lower and upper quartiles. Because of the small sample, non-parametric statistics were used. To compare two independent sample groups, the Mann-Whitney U Test was used to determine significance. Probability values of p < 0.05 were regarded as significant. Spearman rank order correlations were also determined.
Results
From Table 1 it is evident that the white men were overweight compared to their black counterparts (30.1 vs. 20.7 kg/m2, p ⩽ 0.001). No differences were encountered in the Total Activity Index if black and white participants are compared. The blood pressures of both groups are in the hypertensive range (⩾140 mmHg and/or ⩾90 mmHg) according to the European Society of Hypertension guidelines. 19 Heart rate (HR) (64 vs. 61 beats/min, p = 0.028) and TPR (1.33 vs. 1.01 mmHg.s/ml, p = 0.047) were significantly higher in the black- compared to the white men, and the Cwk was significantly lower in the black compared to the white men (1.38 vs. 2.43 ml/mmHg, p = 0.002). The c-dPWV was significantly higher in the black men compared to their white counterparts (9.55 vs. 8.16 m/s, p = 0.001). From the equilibrium RAS-Fingerprint (Figure 1), Ang I and Ang II were significantly lower in the black men compared to their white counterparts (Median values: Ang I, <5 vs. 45.1 pg/ml, p = 0.005; Ang II, 15.6 vs. 123.9 pg/ml, p ⩽ 0.001). Ang 1-5 and Ang 3-8 did not differ significantly, although these downstream metabolites of Ang II were detected only in samples from individuals with elevated RAS activity characterized by Ang II levels ranging in the upper quartile. There are both in black and white hypertensive groups detectable levels of Ang 1-5, which is the downstream metabolite of Ang 1-7 that can be used as a surrogate for an alternative RAS pathway in the absence of ACE inhibition. The GGT was significantly higher in the black compared to the white men (78.9 vs. 41.4 U/l, p = 0.023). The creatinine clearance was significantly lower in the black men compared to the white men (1.52 vs. 1.72 ml/min, p = 0.005). The NT-proBNP appeared to be higher in the black compared to the white hypertensives although the differences were not significant. Angiotensin II correlated inversely and borderline significant with NT-proBNP only in the black hypertensives (see Table 2), (Spearman R= −0.472, p = 0.076).
Characteristics of the hypertensive black and white men.

Data presented as median (lower; upper quartile). BMI: body mass index (kg/m2); Baecke TAI: Baecke Total Activity Index; SBP, DBP: systolic and diastolic blood pressure (mmHg), respectively; HR: heart rate; TPR: total peripheral resistance (mmHg.s/ml); Cwk: Windkessel compliance (ml/mmHg); c-dPWV: carotid-distalis pulse wave velocity; Ang I and Ang II: (angiotensin I and angiotensin II (pg/ml)); CRP: C-reactive protein (mg/l); GGT: gamma-glutamyltransferase; NT-proBNP: N-terminal pro-hormone B-type natriuretic peptide. a2*1-sided exact p value.
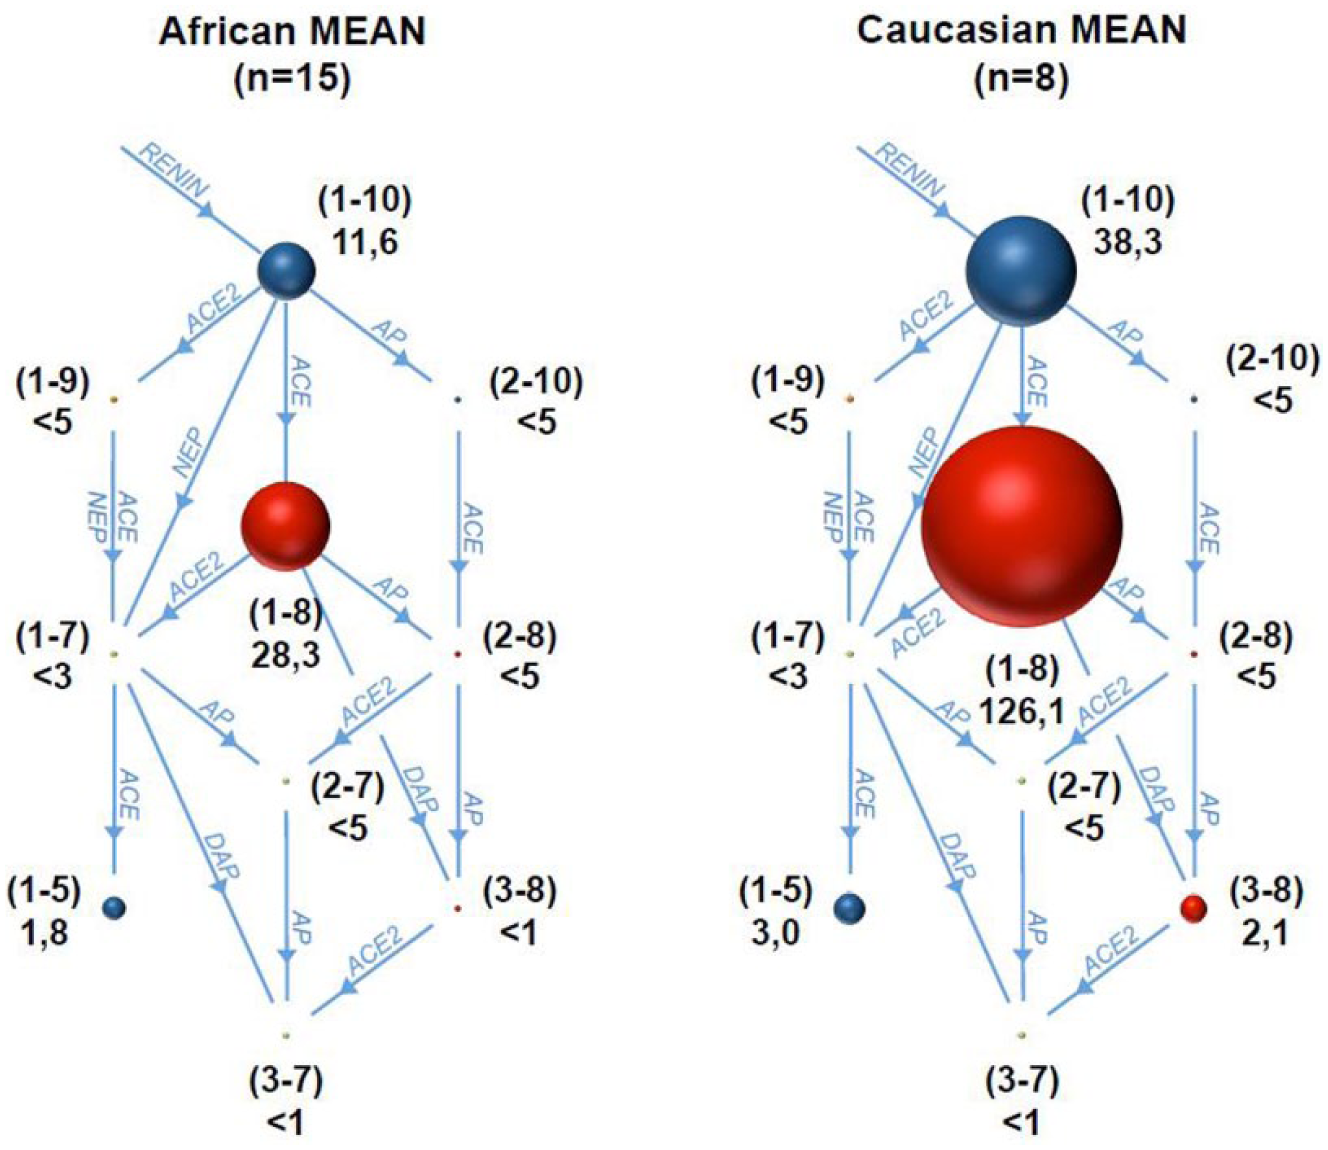
The Equilibrium RAS-Fingerprint of 15 hypertensive black (left) and eight hypertensive white (right) men (Caucasian) (untreated with medications that could interfere with the renin-angiotensin system (RAS)). The mean equilibrium concentrations of indicated angiotensin metabolites are given in the graphs in pg/ml serum. Sphere sizes represent the concentrations and enzymatic pathways are indicated as blue arrows. The enzyme activities indicated are: AP: aminopeptidase; NEP: neutral endopeptidase; DAP: di-aminopeptidase; ACE: angiotensin-converting enzyme. The numbers in brackets indicate the sequence of the corresponding angiotensin metabolite, starting with the decapeptide Angiotensin I (Ang I).
Spearman rank order correlations of Angiotensin II in hypertensive black and white men.

BMI: body mass index; SBP, DBP: systolic and diastolic blood pressure, respectively; TPR: total peripheral resistance; c-dPWV: carotid-distalis pulse wave velocity; NT-proBNP: N-terminal pro-hormone B-type natriuretic peptide; GGT: gamma-glutamyltransferase; CRP: C-reactive protein. P values ⩽0.05 regarded as significant.
Discussion
The aim of this study was to explore the differences in the RAS of hypertensive black and white men by using a novel method for determining the effector molecules. The main finding of this study is the significant lower Ang I and Ang II encountered in the hypertensive black African men compared to their white counterparts. This result is in accordance with the common notion that black individuals are more prone to have low renin hypertension10-12 accompanied by a suppressed RAS than white individuals. From the results of this study it is further shown that the black men had stiffer blood vessels (higher c-dPWV) than whites, also reported in the literature; 20 lower vascular compliance and higher TPR compared to their white counterparts. From the Sympathetic activity and Ambulatory Blood Pressure in Africans (SABPA) study it is also evident that in low-renin normotensive black participants a higher TPR was reported compared to high-renin participants. 21 In the regression model from the mentioned study the TPR contributed to the albumin-creatinine ratio, a marker of end-organ damage. 21 These findings strengthen the notion that in individuals with low-renin hypertension an additional cardiovascular risk may be posed.
In our study the median value of NT-proBNP was higher in the black compared to the white hypertensive men although not significant (29.6 (2.5–63.7) vs. 16.4 ng/ml (10.4–18.5), p = 0.428) due to the large variation in the data. These elevated NT-proBNP levels reflect higher volume loading in the hypertensive black men. The NT-proBNP, which is a hemodynamic marker of volume loading,22,23 is higher in black compared to white men. 24 In our study Ang II correlated borderline with NT-proBNP only in the black hypertensives. Because of the higher volume loading and the myogenic phenomenon, it seems that a physiological protective mechanism is in action where the resistance to blood flow in arterioles increases in order to protect the peripheral tissue and capillaries against edema or rupture 25 with the long-term result of higher blood pressure. From the literature it is also evident that African Americans exhibit larger systemic vascular resistance compared to white individuals and the peripheral resistance may play a larger role in regulation of ambulatory blood pressure. 26 This is confirmed in our study at least in hypertensive black men because the TPR is significantly higher in the black men with suppressed renin and low Ang II levels compared to the white men.
The findings of this study should be interpreted within its strengths and limitations. To the best of our knowledge it is the first study in which equilibrium RAS-Fingerprint analysis was employed for simultaneous biochemical characterization of the RAS peptides in a black and white population from South Africa and holds promise to understand the RAS better in different ethnic groups as well as in different pathologic states. The systemic RAS peptides and the interaction between components provide new therapeutic targets1,27 for treatment of cardiovascular diseases like hypertension in this population group. Our results proved the compatibility of standard collected serum samples with patient-specific biochemical characterization of endogenous angiotensin metabolism using LC-MS/MS. We further support previous studies reporting low-renin hypertension in black African men showing that equilibrium Ang I and Ang II peptide levels are significantly lower in the black population. 28 The small sample size, which is also reflected by the differences in median and mean values for equilibrium angiotensin peptides (Table 1, Figure 1), as well as the fact that aldosterone and sodium intake and/or excretion were not determined, are limitations of the study. The BMI differences observed in the two study cohorts might appear to be a confounder variable of the study. Functional interactions between the renin-angiotensin-aldosterone system (RAAS) and obesity have been established in previous studies and the local RAAS in adipose tissue has been discussed in terms of its contribution to hypertension. 29 Importantly, the systemic RAAS, represented by plasma-circulating components, were clearly shown not to correlate with BMI, 30 proving that the effects observed in our study are not related to differences in the BMI of investigated cohorts although in a large study conducted in African Americans published recently, 31 it was shown that visceral adiposity is associated with components of the RAAS in African Americans.
The observed differences between circulating RAS components, which are reflected via equilibrium angiotensin levels, point to a distinctive molecular regulation of the RAAS in the two study cohorts. Despite the low number of patients, the differences observed in equilibrium angiotensin levels were highly significant indicating that profound differences in systemic RAAS biochemistry might be present. This could affect the efficacy of therapeutic approaches targeting the RAAS that are currently employed to treat hypertension in South Africa.
The increased peripheral resistance observed in hypertensive black individuals might take over a dominant role in control of blood pressure in this study population, which could have resulted in an underrepresentation of the circulating RAAS in the control of blood pressure.
Footnotes
Acknowledgements
We thank Roche Diagnostics for providing the test kits for NT-proBNP. We also thank the participants in this sub-study.
Declaration of conflicting interests
Dr M Poglitsch has stocks in Attoquant Diagnostics GmbH. The other authors have nothing to declare.
Funding
The overarching SAfrEIC study was supported by the South African National Research Foundation (NRF) Grant (GUN 2073040), and the Medical Research Council (South Africa). Options, findings, conclusions and recommendations expressed in this material are those of the authors and the NRF does not accept any liability in this regard.