
Abstract
Objective:
The Dahl salt-sensitive rat is a well-established model of salt-sensitive hypertension. The goal of this study was to assess the expression and activity of renal sodium channels and transporters in the renin-deficient salt-sensitive rat.
Methods:
Renin knockout (Ren−/−) rats created on the salt-sensitive rat background were used to investigate the role of renin in the regulation of ion transport in salt-sensitive hypertension. Western blotting and patch-clamp analyses were utilized to assess the expression level and activity of Na+ transporters.
Results:
It has been described previously that Ren−/− rats exhibit severe kidney underdevelopment, polyuria, and lower body weight and blood pressure compared to their wild-type littermates. Here we found that renin deficiency led to decreased expression of sodium-hydrogen antiporter (NHE3), the Na+/H+ exchanger involved in Na+ absorption in the proximal tubules, but did not affect the expression of Na-K-Cl cotransporter (NKCC2), the main transporter in the loop of Henle. In the distal nephron, the expression of sodium chloride cotransporter (NCC) was lower in Ren−/− rats. Single-channel patch clamp analysis detected decreased ENaC activity in Ren−/− rats which was mediated via changes in the channel open probability.
Conclusion:
These data illustrate that renin deficiency leads to significant dysregulation of ion transporters.
Keywords
Introduction
The renin-angiotensin-aldosterone system (RAAS) is the central regulator of water and salt homeostasis in the body. Components of this hormonal cascade are major targets for pharmaceutical agents aimed at controlling blood pressure, and heart and kidney functions. Dahl salt-sensitive (SS) SS/JrHsdMcwi rats are extensively used to study the role of salt consumption in the development of hypertension. These rats, when kept on a high salt diet, exhibit remarkable phenotypic traits similar to those seen in the hypertensive African American population, including low renin, salt-sensitivity, hyperinsulinemia, and early end stage renal disease.1–3
Previous studies have shown that introgression of chromosome 13 (Chr 13) from the Brown Norway (BN) rat into the SS genetic background attenuates the development of hypertension in an SS-13BN consomic strain. While Chr 13 contains the renin gene, further studies, which narrowed the protective loci in the SS-13BN rats against salt-sensitivity, did not identify the renin gene in these regions.4–6 However, a number of other studies demonstrated that genetic modification of the renin locus does affect blood pressure.7–10 Previously, we generated a renin knockout (Ren−/−) in the SS rat using zinc-finger nucleases (ZFNs) designed to target the renin gene. 11 These rats have undetectable plasma renin activity, underdeveloped kidneys as well as significantly lower mean arterial pressure than their Ren+/+ littermates. There was also evidence of decreased renal function, reflected by polyuria, reduced creatinine excretion and creatinine clearance in Ren−/− rats. 11
Regulation of sodium balance by the kidney is the key factor responsible for long-term blood pressure control. Dahl SS rats demonstrate an impaired sodium excretion response to increases in renal perfusion pressure. This predisposes them to developing hypertension when challenged with a high salt diet. 12 In the present study we describe the effects of renin deficiency on several key sodium transporters in various nephron segments.
Materials and methods
Animals
ZFN-mediated renin gene knockout (Ren−/−) rats and their wild-type (Ren+/+) littermates were created 11 and housed at the Medical College of Wisconsin, and all work was conducted under protocols approved by the Institutional Animal Care and Use Committee. Male rats were fed 0.4% NaCl diet (#113755, Dyets, Bethlehem, Pennsylvania, USA). At the age of eight weeks, the rats were anesthetized with isoflurane, blood samples were collected from the descending aorta, and the kidneys were flushed with phosphate buffer and used for further analysis. 13
Plasma aldosterone and corticosterone levels
Collected blood samples were centrifuged (6000 g, 10 min), and then plasma was analyzed with the Aldosterone and Corticosterone Active RIA kits (MP Biomedicals, Orangeburg, New York, USA).
Patch-clamp analysis
Patch-clamp electrophysiology was used to assess ENaC activity in isolated, split-open rat connecting tubule/cortical collecting duct (CNT/CCD) segment. CNT/CCDs were isolated from Ren−/− and Ren+/+ rats as described previously.14,15 Kidneys were cut into thin slices (<1 mm) and then placed into ice-cold physiologic saline solution (pH 7.4). CNT/CCD regions were mechanically isolated from these slices under a stereomicroscope by micro-dissection with forceps. The tubules were split open with sharpened micropipettes controlled with micromanipulators to gain access to the apical membrane. Single-channel recordings were acquired with Axopatch 200B or 700B amplifiers (Mol. Devices, Sunnyvale, California, USA) interfaced via a Digidata 1440A to a personal computers (PC) running the pClamp 10.2 suite software (Mol. Devices) and subsequently analyzed with Clampex 10.2. Currents were filtered with an eight-pole, low pass Bessel filter LPF-8 (Warner Inst., Hamden, Connecticut, USA) at 0.3 kHz. A typical bath solution was used (in mM): 150 NaCl, 1 CaCl2, 2 MgCl2, 10 HEPES (pH 7.4). The pipette solution for the cell attached configuration was (in mM): 140 LiCl, 2 MgCl2 and 10 HEPES (pH 7.4). NPo, the product of the number of channels and the open probability (Po) were used to measure the channel activity within a patch. When multiple channel events were observed in a patch, the total number of functional channels (N) in the patch was determined.
Western blot analysis
Kidney total lysate was prepared as described previously. 15 Briefly, kidneys were cut in 1–2 mm slices under a stereomicroscope. Kidney cross-sections (~50 mg) were diced into small pieces with a razor blade. Samples were pulse sonicated in Laemmli buffer (Bio-Rad #161-0737) with a protease inhibitor cocktail (Roche) for 10 s and spin cleared at 10,000 g for 5 min. The resulting supernatant was subjected to PAGE, subsequently transferred onto a nitrocellulose membrane (Millipore, Bedford, Massachusetts, USA), probed with antibodies, and visualized by enhanced chemiluminescence (Fisher Sci #32106). The visualization and densitometric analysis was done on the ChemiDoc XRS+ System with Image Lab Software containing a band saturation control. Densities were normalized to the corresponding β-actin intensities and then relative values were averaged in groups. Primary antibodies for sodium-hydrogen antiporter (NHE3), α-, β- and γ-ENaC (SPC-400D, SPC-403D, SPC-404D and SPC-405D, respectively) were from StressMarq Biosciences Inc. (Victoria, British Columbia, Canada); 16 antibodies for sodium chloride cotransporter (NCC) were kindly provided by David H Ellison (Oregon Health & Science University, Portland),17,18 and Na-K-Cl cotransporter (NKCC2) by Pablo Ortiz (Henry Ford Hospital, Detroit).19,20
Histological and immunohistochemical analysis
Extracted kidneys were placed into a neutral buffered 10% formalin solution. The kidney sections were cut at 4 μm slices, dried, and deparaffinized for subsequent streptavidin-biotin immunohistochemistry. After deparaffinization, the slides were treated with a citrate buffer pH6 for a total of 35 min. The slides were blocked with a peroxidase block (DAKO, Carpinteria, California, USA), Avidin Block (Vector Labs, Burlingame, California, USA), Biotin Block (Vector Labs), and serum-free Protein Block (DAKO). For morphological analysis, the tissue was stained with hematoxylin-eosin. For immunohistochemical staining, tissue sections were incubated for 30 min with anti-α, β or γ-ENaC antibodies. Secondary detection was performed with goat anti-rabbit biotinylated immunoglobulin G (IgG) (Biocare, Concord, California, USA) followed by streptavidin conjugated with horseradish peroxidase (Biocare) and visualized with diaminobenzadine (DAKO).
Statistical analysis
All summarized data are reported as mean±standard error of the mean (SEM). Data are compared using one-way analysis of variance (ANOVA) with Tukey correction and p<0.05 is considered significant.
Results
Kidney morphology, plasma aldosterone, corticosterone, and electrolyte levels
Ren−/− rats were previously reported to differ from their Ren+/+ littermates by having significantly lower body weights and kidney underdevelopment marked by displaced medulla, incomplete formation of the medullary rays, and occurrence of large central lesions. 11 Figures 1(a) and (b) confirm the presence of structural abnormalities in Ren−/− kidneys, significant thinning of the medullar layer, and massive areas of undifferentiated tissue in the cortex. The low-renin plasma activity and angiotensin I levels reported earlier 11 are in accordance with our evaluation of the plasma aldosterone concentration, which was found to be significantly lower in Ren−/− rats (Figure 1(c)). Plasma corticosterone level did not differ significantly between the groups (Figure 1(d)).

Kidney morphology and plasma aldosterone levels of wild-type (Ren+/+) and renin knockout (Ren−/−) rats. (a) Magnified view of renal midline section from Ren+/+ and Ren−/− rats. Significant thinning of medullar layer and loss of tissue in central part of the Ren−/− rat kidney are clearly visible. Scale bar is 4 mm. (b) Hematoxylin-eosin staining of cortical layer shows the presence of large areas of undifferentiated tissue. Scale bar is 50 μm. (c) Plasma aldosterone and (d) corticosterone concentrations in Ren−/− rats and their Ren+/+ littermates. Number of rats used for analysis is shown. *p<0.05 versus Ren+/+ rats.
Western blot analysis of renal sodium transporters
Absolute sodium excretion and plasma Na+ concentration in Ren−/− rats did not differ from their Ren+/+ littermates. 11 However, the mutant animals demonstrated substantial polyuria (especially when considering their low weight).
Several Na+ transporters expressed in the nephron mediate sodium absorption in the kidney: NHE3 and sodium-glucose transport protein (SGLT) in the proximal tubules, NKCC2 in the loop of Henle, NCC in the distal convoluted tubules and epithelial sodium channel (ENaC) in the aldosterone-sensitive distal nephron, including late part of DCT, CNT and CCD. 21 Figure 2 demonstrates Western blot analysis of several of these transporters in the Ren−/− rats and their wild type littermates. NHE3 expression was lower in the Ren−/− group (Figure 2(a)) whereas the expression of NKCC2 was not altered (Figure 2(b)). We tested the consequences of renin deficiency on abundance of the thiazide-sensitive NaCl co-transporter, NCC, and found significantly lower expression of NCC in the mutant animals (Figure 2(c)).
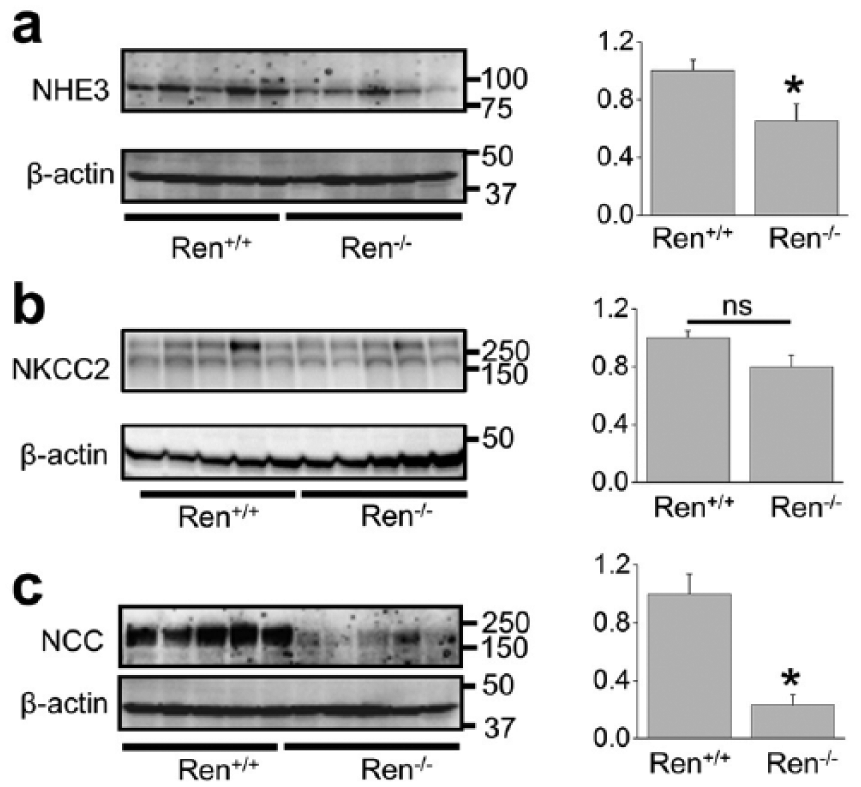
Western blot analysis of sodium transporters (sodium-hydrogen antiporter (NHE3), Na-K-Cl cotransporter (NKCC2) and sodium chloride cotransporter (NCC)) in the kidney total lysates from wild type and Ren−/− rats. Summary graphs represent the average relative density of the bands (normalized to β-actin) in the groups. *p<0.05 versus Ren+/+ rats.
ENaC abundance and activity measurements
Normally, cortical ENaC performs only ~5% of sodium reabsorption. However, this widely regulated channel is involved in the fine tuning of sodium transport in the kidney and is a key element in the antinatriuretic response to aldosterone.16,22 Surprisingly, Western blot (Figure 3) and immunohistochemical (Figure 4) analyses revealed that the expression of all three ENaC subunits did not differ between the groups. The only difference we noted was that expression of a ~90 kDa band of α-ENaC was significantly lower in Ren−/− animals (band 1; Figure 3). It should be noted, however, that we did not analyze the cleaved forms of α- and γ-ENaC subunits, which play critical roles in the activity of the channel. 23 To further test whether renin deficiency affects functions of ENaC, we performed single channel analysis using the cell-attached configuration of the patch-clamp method. Figure 5(a) demonstrates representative current traces recorded from the apical membranes of CCDs isolated from Ren+/+ and Ren−/− rats. We found that mutant rats exhibited significantly lower total ENaC activity (NPo) compared to Ren+/+ littermates. The average number of channels observed in each experiment (N) did not significantly vary between groups, but the lower NPo in the Ren−/− animals was caused by changes in the open probability of individual channels (Po) (Figure 5(b)). Therefore, these data allow us to conclude that absence of renin decreases the activity of ENaC by alteration of gating properties but not expression of the channel.
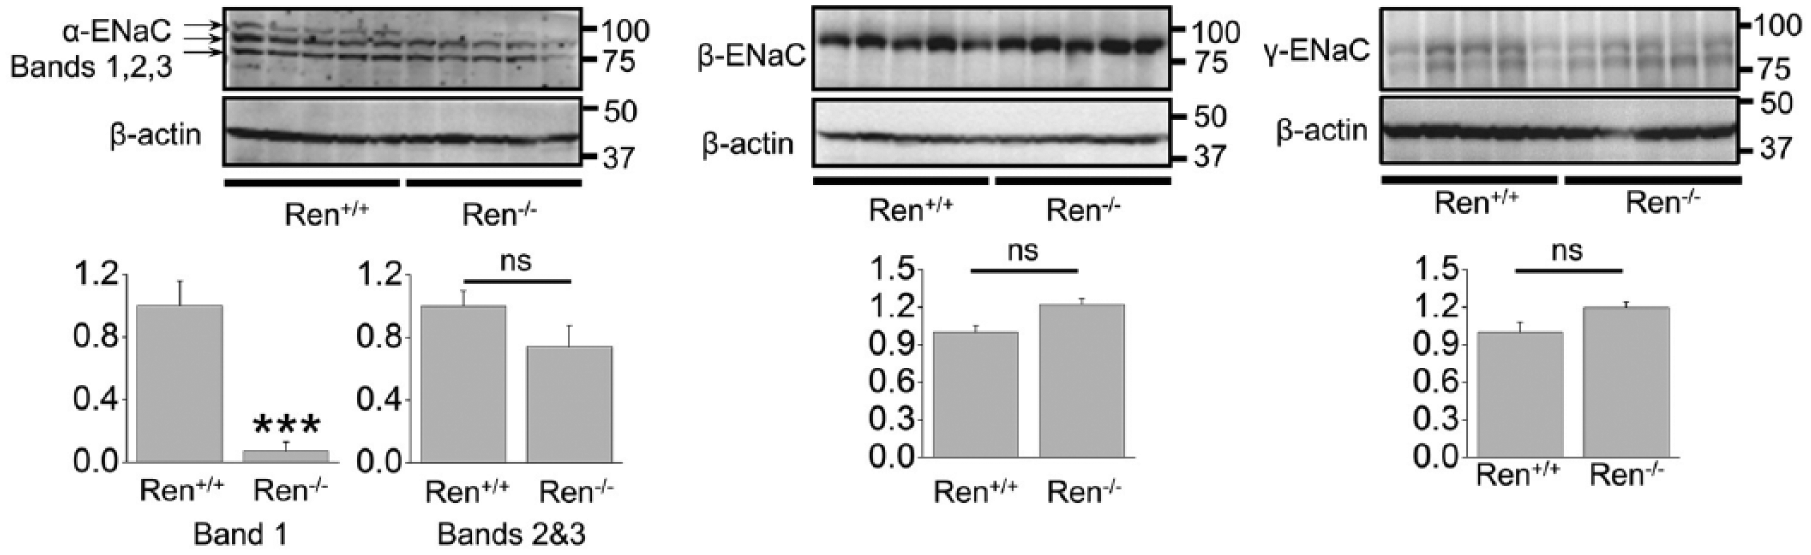
Western blot analysis of α-, β-, and γ- epithelial sodium channel (ENaC) subunits in renin knockout (Ren−/−) and wild type (Ren+/+) littermates. ***p<0.001 versus Ren+/+ rats.

Expression of epithelial sodium channel (ENaC) in renin knockout (Ren−/−) and wild type (Ren+/+) rats. Immunohistochemical staining for α-, β-, and γ-ENaC subunits in the kidney cortical sections of Ren+/+ and Ren−/− rats. 40× magnification, scale bar is 50 μM.

Patch clamp analysis of epithelial sodium channel (ENaC) in renin knockout (Ren−/−) and wild type (Ren+/+) rats. (a) Representative current traces from cell-attached patches containing ENaC and recorded from the apical membrane of split-opened connecting tubule/cortical collecting duct (CNT/CCD) tubules of wild type and Ren−/− rats. Holding potential is −60 mV. (b) Summary graphs of ENaC activity (NPo), number of channels (N) and channel open probability (Po) in cell-attached patches. *p<0.05 versus Ren+/+ rats.
Discussion
The role of the RAAS components in the management of sodium reabsorption and excretion is still not fully understood. SS rats are a low renin strain, and high salt consumption decreases plasma renin activity even further,24–26 yet SS hypertension is accompanied with activation of the paracrine RAAS system.24,26,27 Furthermore, adrenalectomized SS rats do not develop hypertension on a high salt diet, whereas exogenous aldosterone supplement reverses this phenomenon. 28 Renin knockout failed to concentrate urine and have lower plasma angiotensin I 11 and aldosterone levels. Angiotensin II and aldosterone were described as positive regulators of several channels and transporters in the kidney, including ENaC.29–31
Our goal was to investigate functions of major sodium transport proteins along the nephron in the condition of renin deficiency and the lack of aldosterone in the system. We found that NKCC2 abundance did not change in mutant compared to wild type animals whereas the other tested sodium transporters exhibited reduced functions. Thus, NHE3 abundance as well as NCC expression was lower in the mutant animals. RAAS is a potent regulator of sodium reabsorption in the distal segments of the nephron. Aldosterone stimulates thiazide-sensitive sodium reabsorption, an effect accompanied with an increase in NCC abundance.32–34 It was previously reported that salt restriction leads to increased plasma renin activity, aldosterone levels, and NCC abundance. 35 Angiotensin II positive regulation of NCC functions was also described.36–39 As mentioned above, RAAS is a powerful regulator of ENaC activity. We did not find significant differences in ENaC abundance between the groups, but Western blotting revealed diminished presence of a ~90 kDa form α-ENaC subunit in the Ren−/− rats. Previously Ergonul and colleagues demonstrated that maturation of ENaC was accompanied with glycosylation of the α-subunit, which might play a role in current conditions. 40 We further utilized the patch-clamp approach to perform a functional assay and found that ENaC activity in the Ren−/− isolated CCDs was lower due to decreased open probability of the channel.
Recent studies also identified that kidney-specific mineralocorticoid receptor (MR) knockout mice exhibited salt wasting, low BP, and hyperkalemia. 18 It was reported that knockout of MR in the kidney resulted in deficient apical orientation and cleavage of ENaC. NCC and pNCC abundances were also substantially reduced in the kidney-specific MR−/− mice. Plasma K+ was elevated in the MR−/− mice. The authors concluded that the effects on NCC were secondary to the changes in plasma K+ since dietary K+ restriction of kidney-specific MR−/− mice maintained the abundance of pNCC at a level similar to or greater than control. 18 This mechanism may be important in the Ren−/− rats since it was previously shown that serum potassium was significantly increased in Ren−/− rats. 41 The authors also demonstrated in vitro that the corticosterone basal levels and production by zona reticularis/fasciculata cells in response to cyclic adenosine monophosphate (cAMP) was unaffected in the Ren−/− rat compared with the Ren+/+ controls. Our in vivo experiments accordingly revealed equal plasma levels of corticosterone in Ren−/− and Ren+/+ littermates. We assume that the Ren−/− strain of Dahl SS rats can be considered a model of isolated hypoaldosteronism but further studies are needed to test this hypothesis.
The Ren−/− rat strain is a very exciting model which delineates the role of local intrarenal processes when systemic RAAS activity is low. For instance, recent studies using this model defined basal and cAMP-stimulated aldosterone production in the zona glomerulosa cells. 41 Further characterization of sodium balance in these animals is required as we hypothesize that low systemic RAAS activity is the cause of very low blood pressure (~60 mm Hg) in these animals. 11
Footnotes
Acknowledgements
For technical assistance, the authors wish to thank Glenn Slocum (microscopic analysis), Christine Duris (immunohistochemistry), Lisa Henderson and Camille Torres (biochemical assays) of the Medical College of Wisconsin. David H Ellison (Oregon Health and Science University, Portland) and Pablo Ortiz (Henry Ford Hospital, Detroit) are greatly appreciated for providing antibodies. The authors are grateful to Justine Abais-Battad (Medical College of Wisconsin) for critical reading of the manuscript.
Declaration of conflicting interests
The author(s) declared no potential conflicts of interest with respect to the research, authorship, and/or publication of this article.
Funding
The author(s) disclosed receipt of the following financial support for the research, authorship, and/or publication of this article: This study was supported by the National Institutes of Health grants HL108880 and HL122662 (to AS), HL82798 (to CM), HL116603 (to TSP), and DK105160 (to DVI), American Diabetes Association grant 1-15-BS-172, and American Heart Association grant 16EIA26720006 (to AS).