
Abstract
Introduction:
High spontaneous activity of the renin–angiotensin system (RAS) results in more pronounced cognitive impairment and more prolonged QTc interval during hypoglycaemia in type 1 diabetes. We tested whether angiotensin II receptor blockade improves cerebral and cardiovascular function during hypoglycaemia.
Methods:
Nine patients with type 1 diabetes and high spontaneous RAS activity were included in a double-blind, randomised, cross-over study on the effect of angiotensin II receptor antagonist (candesartan 32 mg) or placebo for one week on cognitive function, cardiovascular parameters, hormonal counter-regulatory response, substrate mobilisation, and symptoms during hypoglycaemia induced by two hyperinsulinaemic, hypoglycaemic clamps.
Results:
Compared to placebo, candesartan did neither change performance of the cognitive tests nor the EEG at a plasma glucose concentration of 2.6±0.2 mmol/l. During candesartan treatment, the QT interval in the ECG was not affected. No effect of candesartan was observed in the hormonal counter-regulatory responses, in substrate concentrations, or in symptom scores. A 36% reduced glucose infusion rate during hypoglycaemia with candesartan was observed.
Conclusion:
In conclusion candesartan has no effect on cerebral function during mild experimental hypoglycaemia in subjects with type 1 diabetes and high RAS activity. Candesartan may reduce glucose utilisation or increase endogenous glucose production during hypoglycaemia.
Keywords
Introduction
High spontaneous renin–angiotensin system (RAS) activity in terms of high serum angiotensin-converting enzyme (ACE) activity is associated with a clinically significant elevated risk of severe hypoglycaemia in type 1 diabetes. This has consistently been shown in seven studies in five different cohorts by four independent research groups.1–7 One study reported an additive effect of presence of three RAS components – high serum ACE activity, high plasma angiotensinogen concentration and homo- or heterozygosity for the A-allele of the X chromosome-located angiotensin-II receptor subtype 2 1675G/A polymorphism – on the risk of severe hypoglycaemia in type 1 diabetes. 8 This finding suggests that increased angiotensin II receptor subtype 1 activation that is not counterbalanced by subtype 2 activation is detrimental during hypoglycaemia in subjects with type 1 diabetes. Epidemiological data support this observation by showing a lower rate of severe hypoglycaemia in subjects with type 1 diabetes treated with RAS blockers (ACE inhibitors (ACEi) or angiotensin II (ANG II) subtype 1 receptor blockers (ARBs)) compared with subjects treated with other antihypertensive agents not influencing RAS. 9
The mechanism of the association between RAS activity and risk of severe hypoglycaemia is not clarified. To maintain self-care during hypoglycaemia and thereby avoid progression to severe hypoglycaemia, maintenance of normal cognitive function is crucial. We have previously reported that patients with type 1 diabetes and high RAS activity developed more pronounced cognitive impairment during controlled hypoglycaemia than subjects with low activity. 10 A decline in alpha frequency in EEG recordings similar to the shift seen during sleep or pre-coma was also observed during hypoglycaemia in these subjects, 10 thus suggesting a mechanistic explanation of the association between RAS activity and risk of severe hypoglycaemia. RAS activity also affects heart rate and prolongation of the QT interval during hypoglycaemia in type 1 diabetes.11–13 In patients with type 1 diabetes the QT interval was more prolonged in patients with high RAS activity than patients with low activity during controlled hypoglycaemia. 13 QT prolongation is a common finding during hypoglycaemia, 11 and may be involved in sudden death from ventricular tachyarrhythmia, the so-called ‘dead-in-bed’ syndrome.14,15 High RAS activity is implicated in ventricular tachyarrhythmia. 16 Thus AT1 receptor blockade may protect against unintended cardiac changes during hypoglycaemia.
The present study tested the hypothesis that angiotensin II receptor blockade may have beneficial effects during mild hypoglycaemia in type 1 diabetes by preserving cognitive function and cardiac repolarisation. Furthermore, the impact on hormonal counter-regulatory responses, substrate mobilisation and hypoglycaemic symptoms was explored. An intervention with candesartan was chosen as this drug passes the blood brain barrier, 18 has effects on the sympathetic nervous system, 19 and is associated with improved cognition in ischaemic brain conditions. 20
Methods
Subjects
Nine subjects with type 1 diabetes were recruited from the outpatient clinics at Nordsjællands Hospital – Hillerød and Steno Diabetes Centre (Figure 1). The patients were selected according to high spontaneous RAS activity defined as a total score > 8 obtained by measurements of plasma angiotensinogen concentration (1–4; 4 highest quartile), serum ACE activity (1–4; 4 highest quartile) and AT2 receptor subtype 2 genotype (1 = GG; 2 = GA; 3 = AA). Furthermore, patients were not allowed to take any RAS blocking agents (according to their medical records). Other inclusion criteria were age >18 years, duration of diabetes >5 years and negative pregnancy test or verified menopause. Exclusion criteria were use of any RAS blocking treatment (according to the patient), antihypertensive treatment or medical treatment interfering with cognitive function, presence of severe late diabetic complications defined as recently laser-treated retinopathy, symptomatic autonomous neuropathy, reduced kidney function (plasma creatinine ≥100 µmol/l for men and >88 µmol/l for women), known side effects to candesartan, heart failure (NYHA 3-4), epilepsy, drug or alcohol abuse, and plasma potassium < 3.5 mmol/l or >5 mmol/l. Baseline characteristics are shown in Table 1.

Flow chart of recruitment to the study. Data on RAS activity was obtainable for 451 patients. After excluding patients who were on RAS blocking treatment or centrally acting drugs and patients who suffered from conditions not eligible for participating in a hypoglycaemic experiment (dementia, heart failure, cancer), 49 patients were eligible to participate in the study. Thirty-three patients declined to participate, 16 patients came to the information meeting. We excluded four, two because of proliferative retinopathy that did not respond well to laser treatment, one because of excessive alcohol consumption and one because of a too tight schedule with a lot of travelling. Twelve patients were randomised. During the first experimental day one patient was excluded because we could not get intravenous access, and two patients had a vasovagal episode.
Baseline characteristics. Mean (SD) or n when indicated.
Detection limit of the assay <0.02 nmol/l.
Normal range 900–2260 nmol/l.
Design
The study is a double-blind, placebo-controlled, cross-over study (Figure 2). Randomisation was done in blocs of four patients and placebo and candesartan 32 mg capsules were manufactured by the Pharmacy of the Capital Region of Denmark. The medicine was blinded, packed and sealed in identical containers with the numbers 1 and 2 on the label. Patients were randomised 8 days before the first hypoglycaemia experiment. The patients were instructed to take one capsule each evening before bedtime for 7 days. The two experimental days were separated by at least 5 weeks, allowing for a wash-out period of >4 weeks (median 6 weeks; range: 5–14 weeks). The primary endpoint was effect of candesartan on cognitive function during hypoglycaemia. Secondary endpoints were electroencephalographic changes, cardiovascular parameters, hormonal counter-regulatory response, substrate mobilisation and symptoms during hypoglycaemia.

Flowchart of the study. The study was a double-blind, placebo-controlled, cross-over study with 32 mg candesartan or placebo. Cycles 1 and 2 were euglycaemic periods and cycles 3 and 4 were hypoglycaemic periods. In cycle 1 and 3, the following measurements were done: blood samples, symptoms of hypoglycaemia, ECG, EEG, blood pressure, cognitive tests. In cycle 2 and 4, the following measurements were done: symptoms of hypoglycaemia, blood pressure, blood samples and ECG.
The trial was approved by the Regional Ethics Committee (H-C-2009-069) and the Data Protection Agency (2009-41-3853) and registered on Clinicaltrials.gov (NCT01116180). The Danish Medicines Agency did not consider the study as an intervention trial, thus it should not be approved as such. The trial was done according to the Declaration of Helsinki, and all participants signed informed consent before entering the study.
Experimental protocol
The study was conducted according to the Declaration of Helsinki and all subjects signed informed consent before entering the trial
Eight days before the experimental day
At the first visit, demographic and clinical characteristics (including beat-to-beat analysis and biothesiometry) and diabetes history were collected, and hypoglycaemia awareness status was classified according to a validated method. 21 Blood pressure and weight were measured both at the first and the second visit. The cognitive test battery was trained. Blood was sampled to measure plasma potassium and creatinine before the treatment initiation.
The day before the experimental day
Patients had a continuous glucose monitor (CGM) (Guardian® REAL-time, Medtronic Minimed, Northridge, USA) mounted subcutaneously in order to detect possible hypoglycaemia the night before the experiment. The hypoglycaemia alarm was set at 4.5 mmol/l in order to prevent a hypoglycaemic event below 3.5 mmol/l. The CGM was calibrated with a blood glucose meter (Contour® Link, Bayer Health Care, Leverkusen, Germany) according to the manufacturer’s manual. Side effects of treatment were reported and the cognitive tests were re-trained. Patients were asked to take the capsules before bedtime to ensure a standardised medication protocol.
Day of experiment
Subjects arrived at 7:30 a.m. after an overnight fast. CGM data were downloaded and checked for hypoglycaemic values <3.5 mmol/l at two consecutive measurements. Patients were asked if they had measured any blood glucose values <3.5 mmol/l in the last 12 hours before the experiment. None of the patients had experienced symptomatic hypoglycaemia the night before the experiments. Two patients had an asymptomatic hypoglycaemic alarm and corrected per protocol on the alarm (plasma glucose <4.5 mmol/l). None of the patients had experienced plasma glucose levels >20 mmol/l during the time they wore the CGM.
The patients were placed in a comfortable resting chair and were equipped with (1) two intravenous antecubital lines for infusion of insulin and glucose and for blood sampling, (2) electroencephalography (EEG) cap, two ear lobe references and two precordial ECG leads connected to a digital EEG recorder (Cadwell, Kennewick Washington, USA), (3) twelve-lead ECG to monitor heart rate during hypoglycaemia (MAC 5500, GE Healthcare, UK), and (4) an automatic blood pressure unit (Microlife AG, Wildnau, Switzerland). Patients were introduced to the hypoglycaemia symptom score questionnaire and once more they trained the cognitive tests while being clamped to euglycaemia.
The experiment was divided into two comparable periods, a baseline period (cycle 1 and 2) and a hypoglycaemic period (cycle 3 and 4) (Figure 2(b)). Cycle 1 and 3 consisted of blood-sampling, hypoglycaemia symptom scoring, ECG, EEG, blood pressure measurements and cognitive tests. Cycle 2 and 4 consisted of hypoglycaemia symptom scoring, blood pressure measurements, blood sampling and ECG.
Hyperinsulinaemic hypoglycaemic clamp procedure
Short acting human insulin (Actrapid®, Novo Nordisk, Bagsværd, Denmark) mixed with heparinised plasma from the patient and isotonic saline was infused at a rate of 1.0 mU × kg bodyweight-1 × minute-1 with a syringe pump (Argus 600S, Argus Medical AG, Heimberg, Switzerland). Plasma glucose concentrations were measured throughout the study at 5-10 min intervals (YSI 2300 Stat Plus, Yellow Springs, USA) and adjusted with a variable infusion of 20% glucose via an infusion pump (Argus 414, Argus Medical AG, Heimberg, Switzerland). The plasma glucose target was 5–6 mmol/l for 60 min during the baseline period and 2.5–2.7 mmol/l during hypoglyceamia for 60 min (Figure 2).
Cognitive function tests
California Cognitive Assessment Package (CalCAP)
Working memory was evaluated by the Danish Abbreviated Reaction Time test (DART) of CalCAP (E.N. Miller, California Cognitive Assessment Package, Norland Software, Los Angeles, 1990). DART consists of three different reaction time tasks which run on a computer screen; CRT1: a choice reaction task with reaction to number 7; SRT1: a choice reaction task with reaction to two identical one-figure numbers in a sequence; and SRT2: a choice reaction task with reaction to a pair of one-figure numbers in ascending order (e.g. 1–2 or 5–6). The software calculates the individual mean reaction times and number of errors for each test.
Stroop’s test
Stroop’s test measures selective attention and cognitive flexibility. 22 The test consists of three pages, each with 100 items divided in 5 columns. On the first page the words yellow, blue and red are typed randomly in black; the subject must read aloud the words. On the second page the same colours are printed as “XXXX” and arranged randomly; the subject must read aloud the colours of the X’s. On the last page the ink colour is different from the typed colour and the subjects must read aloud the ink colour. The number of items completed in 45 sec on each page is used for test evaluation.
Trail-making test
The trail-making test measures visual scanning, attention, concentration speed of eye-hand coordination and information processing. 23 Trail 5 was assessed in which subjects must connect circled numbers and letters in alternating sequences (e.g. 1-A-2-B-3-C….13). The time used to complete the test is measured.
Neurophysiological tests
Electroencephalography
EEG was recorded using Cadwell standard EEG recording system and silver–silver chloride electrocaps with the 19 standard positions of the international 10–20 system using linked earlobe references. EEG was obtained in a 5-min resting period during each glycaemic period. Patients were asked to stay awake with their eyes closed during the recordings. Eight patients underwent EEG recordings on both experimental days, and they were included in the analysis.
Data were exported to edf-format in the recording montage and analysed in Matlab (Matrix Laboratory (http://www.mathworks.se/products/matlab/?s_cid). Data were filtered with an eighth order Butterworth filter with a low-cut of 0.5 Hz and a high-cut of 32 HZ. The two prefrontal electrodes were associated with artefacts in several patients and discarded in the process. Thus the following electrodes were used for analysis: F7, F8, F3, F4, FZ, T7, T8, C2, C4, CZ, P7, P8, PZ, O1 and O2. In each recording, 10 artefact-free periods of at least 5 s duration were identified. The mean centroid frequency (5–11 Hz) was used in the calculations and further five different groups were created to evaluate the effect on the different areas of the brain. Thus group F (the frontal cortex (F3, FZ, F4)), group C (the cortex of the central sulcus (C3, CZ, C4)), group T (the temporal cortex (F7, F8, T7, T8, P7, P8)), group P (the parietal cortex (P3, PZ, P4)) and group O (occipital cortex (O1, O2)) were created.
Cardiovascular parameters
ECG was measured using a MAC 5500 and saved electronically. Heart rate was calculated from the ECG. QT intervals were calculated from five 12-lead ECG recordings of 10 sec duration in each cycle (c1–c4; Figure 2). Semiautomatic QT analysis was performed by a trained electro physiologist blinded to the treatment. The QT interval was corrected for differences in heart rate (HR) according to Bazett’s (QTcb = QT / RR1/2) and Fridericia’s formulas (QTcf = QT / RR1/3).
Hypoglycaemic symptom scoring
An extended version of the Edinburgh Hypoglycaemia Scale including dummy questions was used to assess symptoms of hypoglycaemia. 24 Symptoms are divided into autonomic symptoms (sweating, trembling and warmness), neuroglycopenic symptoms (drowsiness, tiredness, hunger and weakness) and cognitive dysfunction (inability to concentrate, blurred vision, anxiety, confusion, difficulty in speaking and double vision). The highest scores possible are 21 (autonomic symptoms), 28 (neuroglycopenic symptoms) and 42 (cognitive dysfunction). The subject rates the symptoms on a Likert scale from 1 to 7, where 1 indicates that the symptom is absent while 7 indicates that the symptom is at its maximum intensity. 24
Laboratory analysis
Plasma glucagon concentrations were measured with a radioimmunoassay directed against the C-terminus of the glucagon molecule (antibody core no. 4305), which mainly measures glucagon of pancreatic origin. 25 Catecholamines were measured in blood drawn in chilled tubes which was pre-added a mixture of EGTA, glutathione and NaOH to prevent catecholamine degradation. Levels of catecholamines were determined with a commercial ELISA kit (BA E-5100, Labor Diagnostika Nord GmbH and Co, Nordhorn, Germany). Serum growth hormone concentrations were determined with a commercial fluorometric method (Delfia, Wallac, Finland) using two monoclonal antibodies against two separate antigenic determinants on the growth hormone molecule. Concentrations of free fatty acids, glycerol, ketones and lactate were determined by spectrometry (Roche Hitachi 912 Chemistry Analyzer, Roche, Glostrup, Denmark). Cortisol, C-peptide and electrolytes were measured with routine methods. All other samples were centrifuged and stored immediately at −80 ºC to be analysed after completion of the study.
Power calculation and statistics
The pre-study power calculation with a minimal relevant difference (MIREDIF) = 50 ms for mean reaction time prolongation (CalCAP, SRT2) and SD = 80 ms (10) and type 1 and type 2 error risks of 5% and 20%, respectively, showed that 20 patients should be included. Unfortunately it was not feasible to obtain that number of participants due to our rather strict in- and exclusion criteria (Figure 1). All calculations were done with SPSS software package 19. Initially all variables were tested for normality visually and using the Kolmogorov-Smirnov test. When comparing the euglycaemic and hypoglycaemic period, non-parametric analyses were used when data were not normally distributed. For the ANCOVA data were ln-transformed and back-transformed after analysis. In case normality could not be obtained an ANCOVA was not possible and Wilcoxon’s signed rank test was used instead of paired samples t-test. Euglycaemic values were compared with hypoglycaemic values using a paired t-test in order to evaluate whether the endpoint changed from baseline during hypoglycaemia. A mixed linear model ANCOVA was used to investigate the impact of candesartan on the endpoints. Analyses were done for each endpoint separately. Baseline values were included in the analysis as a covariate and fixed factor. Plasma glucose concentration at the time of the cognitive test or symptom scoring was included as covariate and fixed factor. Treatment was included as fixed factor and patient number was random factor. The analysis of counter-regulatory hormones and substrates were based on peak values during hypoglycaemia and mean values during euglycaemia.
Plasma glucose levels during hypoglycaemia on the two days of experiments were compared using a paired t-test. Calculations regarding cognitive function, EEG and ECG were done blinded to the intervention. A p < 0.05 (two-sided) was considered statistically significant.
Results
Plasma glucose and glucose infusion rate
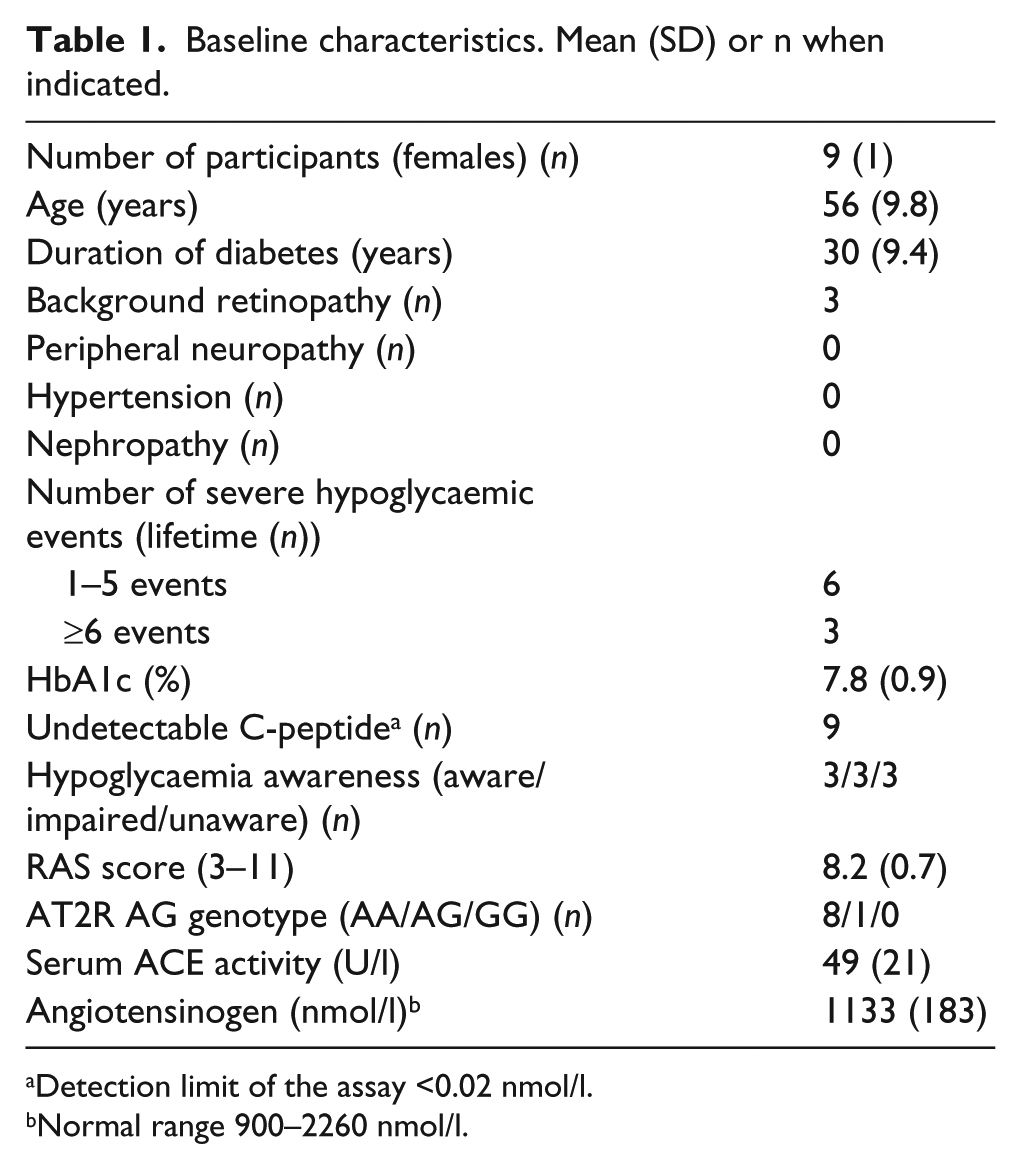
The mean plasma glucose (±SD) during euglycaemia was 5.5±0.4 and 5.2±0.3 mmol/l at the candesartan and placebo days, respectively, (p = 0.18) and similar (2.6±0.2 mmol/l) during hypoglycaemia on both experimental days (p = 0.96; Figure 3). Glucose infusion rate during hypoglycaemia were 36 % lower on the candesartan day (0.009±0.005 mmol × kg body weight-1 × min-1) than on the placebo day (0.014±0.002 mmol × kg body weight-1 × min-1) (p = 0.05). There were no differences in the lengths of euglycaemia and hypoglycaemia during the candesartan and placebo days (63±21 and 67±19 min, and 54±14 and 60±17 min, respectively (p > 0.05)).
Plasma glucose concentrations at euglycaemia and hypoglycaemia. The mean plasma glucose concentration (±SD) during euglycaemia was 5.5±0.4 and 5.2±0.3 mmol/l at the candesartan and placebo days, respectively (p = 0.18), and similar (2.6±0.2 mmol/l) during hypoglycaemia on both experimental days (p = 0.96).
Cognitive function
Reaction time did not differ between euglycaemia and hypoglycaemia at the CRT2, SRT1 and SRT2 tests either on candesartan or on placebo. Similar results were obtained for the placebo-corrected delta-values. For SRT1 error and SRT2 error there was a significant increase in errors between euglycaemia and hypoglycaemia on placebo but not on candesartan (p = 0.03 and p = 0.05 respectively) while no differences were observed for CRTerror. In the trail-making test and Stroopword, Stroopcolour and Stroopcolour/word tests deteriorations were seen in completion time (trail-making test) and number of items completed (Stroop’s test) between the euglycaemic and hypoglycaemia periods for both the candesartan and the placebo groups. In the ANCOVA no effect of candesartan treatment was observed at hypoglycaemia for any cognitive endpoints (p = 0.32–0.92). See Table 2.
Cognitive function was evaluated by the Danish Abbreviated Reaction Time test (DART) of CalCAP that measures working memory, Stroop’s test that measures selective attention and cognitive flexibility, and the trail-making test that measures visual scanning, attention, concentration, speed of eye-hand coordination and information processing. Below results of univariate analyses between euglycaemia and hypoglycaemia on the two experimental days are displayed. The effect of candesartan is displayed in the ANCOVA column. In the ANCOVA baseline values and plasma glucose at the specific test were included as fixed covariates, candesartan as fixed factor and patient as random factor. Numbers are mean (SD).
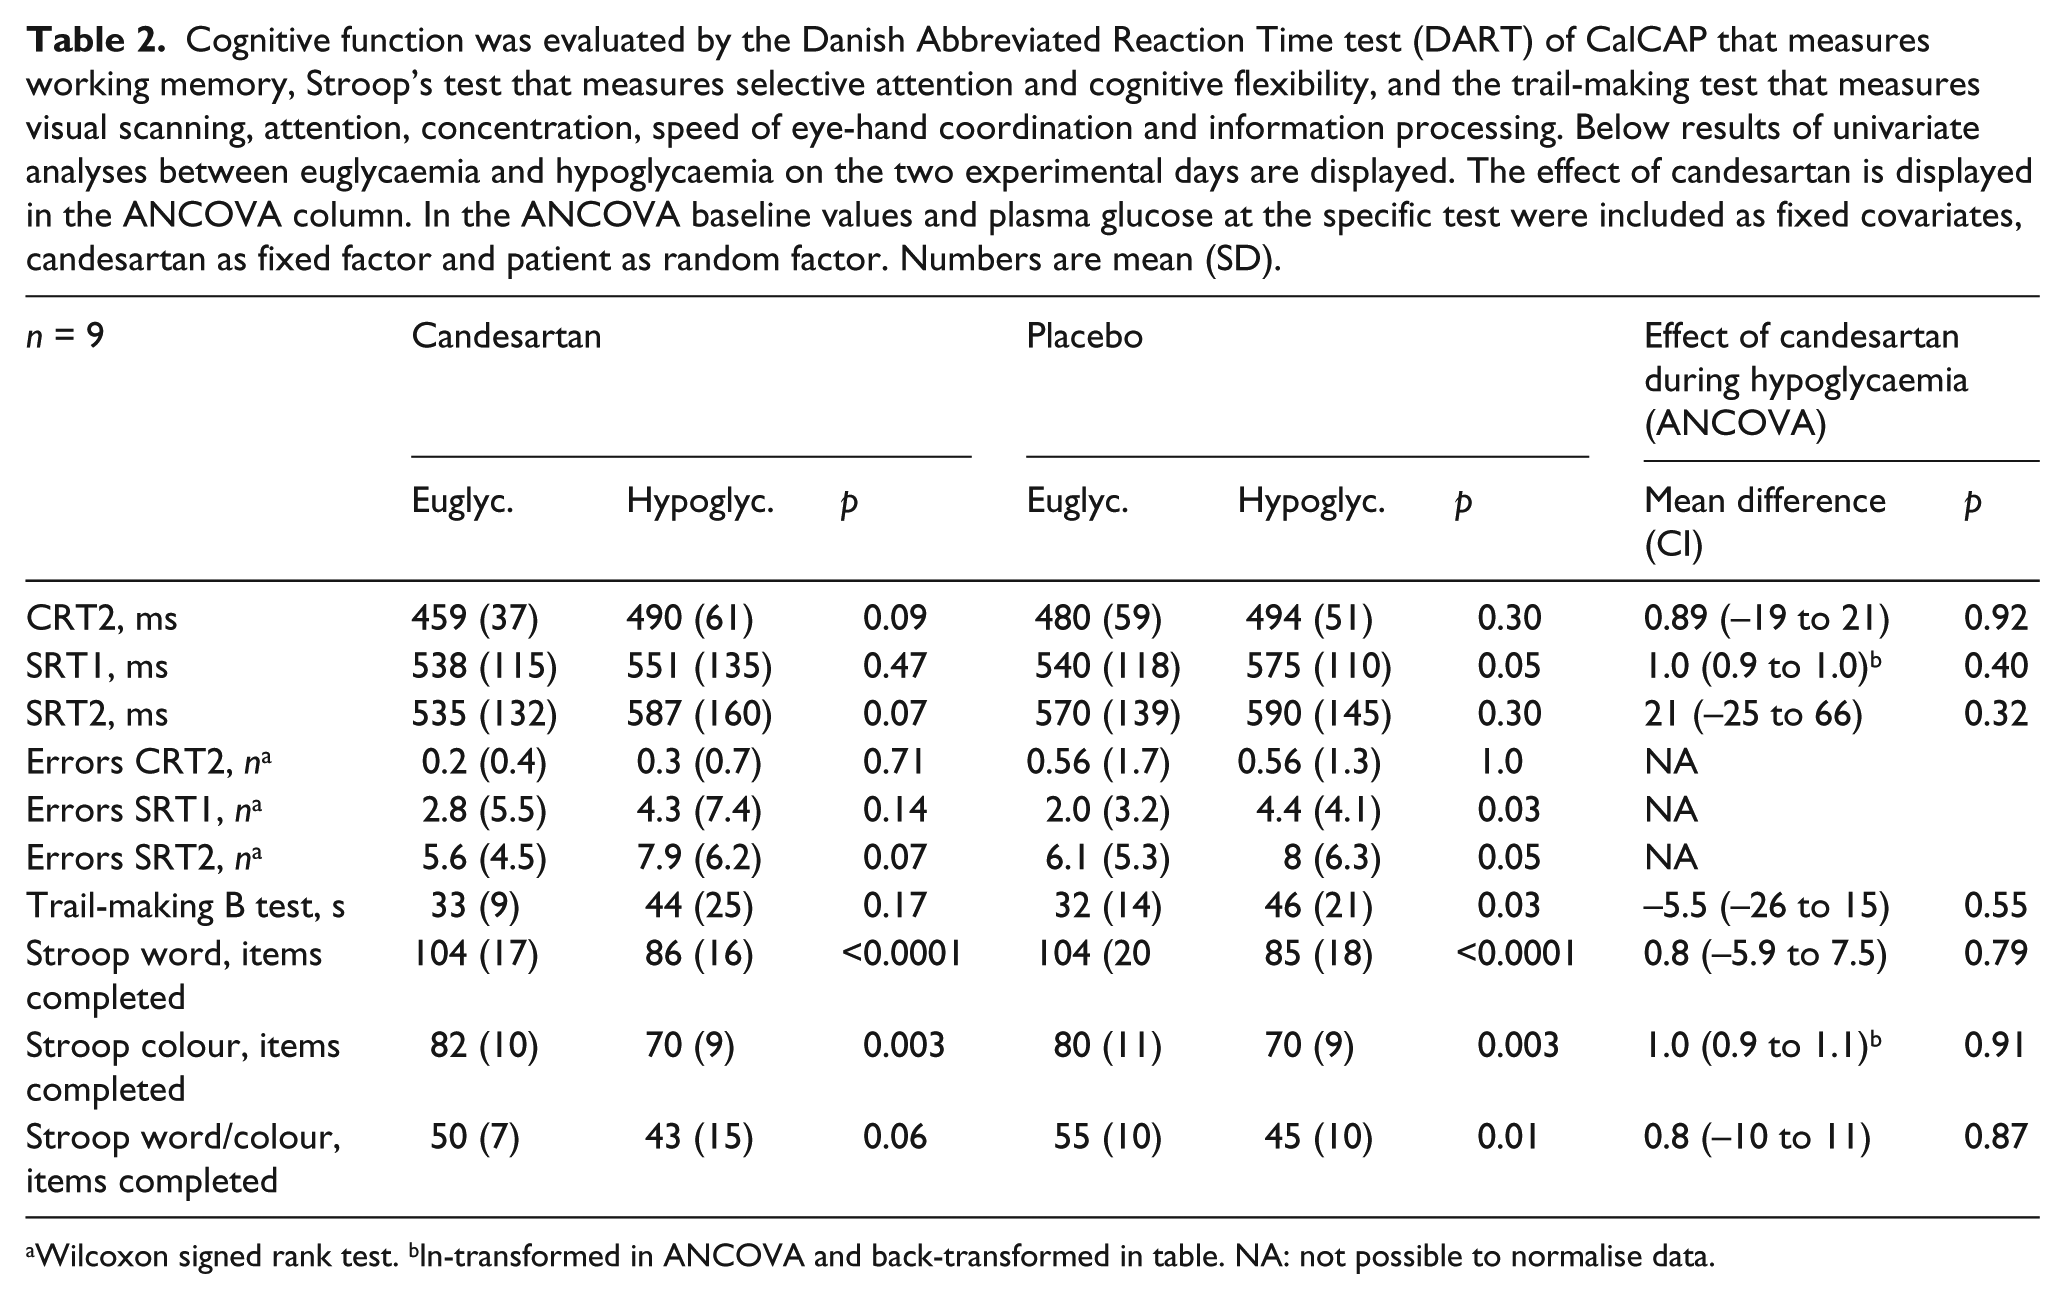
Wilcoxon signed rank test. bln-transformed in ANCOVA and back-transformed in table. NA: not possible to normalise data.
Neurophysiological test
On the EEG no differences in the mean centroid frequency (mean of all 17 electrodes included) of the 5–11 Hz band and the five groups representing the regions of the brain (group F, C, P, T and O) between euglycaemia and hypoglycaemia was observed . No effect of candesartan treatment was observed in the ANCOVA (p = 0.23–0.42). See Table 3.
EEG was evaluated by the centroid frequency (5–11 Hz). The mean centroid frequency was used in the calculations and further five different groups were created to evaluate the effect on the different areas of the brain: group F (the frontal cortex), group C (the cortex of the central sulcus), group T (the temporal cortex), group P (the parietal cortex) and group O (occipital cortex). ANCOVA was performed as mentioned in Table 2 but instead of plasma glucose at the time of the EEG mean plasma glucose during hypoglycaemia was used. Numbers are mean (SD).

Wilcoxon signed rank test.
Cardiovascular parameters
Diastolic blood pressure at baseline was lower on the candesartan day (73±16 mmHg) than on the placebo day (77±18) (p < 0.05). Systolic blood pressure showed a similar trend towards a lower level on the candesartan day (120±28) than on the placebo day (127±25) (p < 0.1). Blood pressure did not change significantly between euglycaemia and hypoglycaemia on the two days and there was no effect of candesartan in this normotensive cohort. Heart rate did not change in response to hypoglycaemia on the candesartan day and this was due to candesartan in the ANCOVA. QTcb and QTcf increased from baseline to hypoglycaemia, with no differences observed between groups. See Table 4.
Cardiovascular parameters were calculated from the ECG and by an automatic blood pressure unit. Heart rate and QTc intervals were calculated from five 12-lead ECG recordings of 10 sec duration in each cycle (c1–c4; Figure 2(b)). The QT interval was corrected for differences in heart rate (HR) according to Bazett’s (QTcb = QT / RR1/2) and Fridericia’s formulas (QTcf = QT / RR1/3). Analysis is carried out as in Table 3. Numbers are mean (SD).

Hormonal counter-regulatory response, substrate mobilisation and symptoms of hypoglycaemia
An adequate hormonal counter-regulatory and substrate mobilisation response to hypoglycaemia was observed on both days except for adrenaline that only rose on the candesartan day and glucagon that did not change in response to hypoglycaemia on neither of the experimental days. No effect of candesartan was observed for any measurements. An efficient response to hypoglycaemia in terms of hypoglycaemic symptoms was observed on both experimental days and there were no effect of candesartan. (See Supplementary tables 1–2 online).
Discussion
Treatment with 32 mg candesartan daily for 7 days did not affect the measured protective responses to hypoglycaemia during a hyperinsulinaemic hypoglycaemic clamp procedure. Thus, hypoglycaemic changes in cognitive function, cardiac repolarisation and other endpoints did not differ between candesartan and placebo. The only difference between the treatments was a 36% reduced glucose infusion rate during hypoglycaemia with candesartan, suggestive of either increased endogenous glucose production or reduced glucose consumption.
The negative result concerning cognition contrasts previous studies in patients with type 1 diabetes and healthy subjects with high spontaneous RAS activity.10,26 In these subjects cognitive function deteriorated significantly (CalCAP test) during hypoglycaemia compared to subjects with low RAS activity. Both these studies obtained a plasma glucose level during hypoglycaemia similar to that in the present study, but since they did not use a clamp approach there was no glucose infusion during hypoglycaemia. It is therefore possible that a potential effect of candesartan in this study is masked by the higher glucose infusion rate in the placebo arm. Another potential explanation for the difference between the studies is that the subjects with low spontaneous RAS activity had the G-allele of the angiotensin II receptor subtype 2 that confers high expression of the receptor, while the participants in this study had the A-allele that confers low receptor expression. The candesartan blockade blocks only the subtype 1 receptor, but does probably increase subtype 2 activity.
The QT intervals increased in both treatment arms in response to hypoglycaemia in accordance with previous findings in patients with high spontaneous RAS activity. 13
We did not observe any effect of candesartan on counter-regulatory hormone or substrate responses to hypoglycaemia. This is in contrast to a study of healthy men treated with losartan, 27 which reported an attenuated adrenaline response to hypoglycaemia in the treatment arm compared to placebo and in line with a study of healthy men treated with captopril and ACE inhibitor reporting no difference in symptoms and counter-regulation. 28 The symptom scores were not affected by candesartan treatment. A study comparing losartan (an ARB) and placebo during mild hypoglycaemia in healthy men indicated that ARB treatment attenuates hypoglycaemic symptoms and adrenaline response, 27 thus contrasting our previous findings. 28 The hormonal counter-regulatory response to hypoglycaemia is, however, different in healthy people and patients with type 1 diabetes. In type 1 diabetes the glucagon response is blunted or absent after a few years of diabetes. 29 After a decade with type 1 diabetes the adrenaline response is also blunted in some patients leaving them with weakened autonomic symptoms and the slower responding cortisol and growth hormone secretion as the salvage of hypoglycaemia. 29 The hormonal counter-regulatory response is also blunted in response to recurrent hypoglycaemia. 30 Therefore it is not possible to extrapolate data on the hormonal counter-regulatory response in healthy people to patients with type 1 diabetes.
The strength of our study is its double-blind, placebo-controlled, cross-over design and extensive examinations. The use of CGM made it possible to avoid hypoglycaemia prior to the study, thereby avoiding a blunted hormonal counter-regulatory response to hypoglycaemia. The cognitive tests were trained twice at every visit prior to the experimental day –four times in total – in order to minimise a possible learning effect.
The main limitation of the study is the number of subjects included. According to the pre-study power calculation 20 patients should be included to obtain the calculated difference. Only nine subjects were included mainly due to strict in- and exclusion criteria. Another limitation of the study may be that the patients were not effectively RAS blocked at the time of the hypoglycaemic phase. We took this into account by choosing candesartan that – even though the plasma half-life is 9–12 hours – has a blood pressure lowering effect of more than 24 hours as a measure of the blocking effect on the receptors. In the present study candesartan had an antihypertensive effect during euglycaemia, suggesting adequate RAS blockade at the time of the experiment.
In conclusion, RAS blockade with candesartan had no effects on cognitive function or other responses to hypoglycaemia, but resulted in a diminished need for glucose supply during hypoglycaemia. The reason for the lower GIR during hypoglycaemia in the candesartan arm is speculative but could be associated with the adrenaline response observed on the candesartan day but not on the placebo day. This was, however not mimicked in the glucagon response being only numerically higher during hypoglycaemia on the candesartan day. The mechanism of high spontaneous RAS activity on deteriorated cognitive function during hypoglycaemia is thus not clarified by this study using AT1 receptor inhibition. Studies of the effect of ARBs or ACE inhibitors on endogenous glucose metabolism during hypoglycaemia are warranted to further explore their potential in minimising severe hypoglycaemic events in patients with type 1 diabetes.
Novelty statement
RAS blockade with candesartan has no effect on:
Cognitive function
Counter-regulatory hormones
Symptoms of hypoglycaemia
But the glucose infusion rate is 36% lower during hypoglycaemia on the candesartan day than on the placebo day.
Footnotes
Acknowledgements
We thank research nurses P. Banck and T. Larsen, Hillerød Hospital for their expertise during the experiment. Also we thank the staff at the outpatient clinic at Hillerød Hospital for their help when needed.
Conflict of interest
None declared.
Funding
This work was supported by grants from The Jascha Foundation, The Tvergaard Foundation, The Olga Bryde Nielsen Foundation, The Foundation of Harald Jensen and Wife, The Foundation of Poul og Erna Sehested Hansen, The Aase og Ejnar Danielsen Foundation, The Foundation of A. P. Møller and Wife Chastine MC Kinney Møller, The Freemasons Frederik the IV lodge, The Gangsted Foundation, The Foundation of Brdr. Hartmann, The Beckett Foundation, and research grants from the Capital Region of Denmark and from Hillerød Hospital.