
Abstract
Hypothesis:
Cardiac hypertrophy in myocytes is in part regulated by changes in expression of a novel Ang II type 2 receptor (AT2-receptor) interacting protein identified as ATIP.
Introduction:
The role of the AT2-receptor in cardiac hypertrophy is controversial, with some reports indicating that AT2-receptor activation has detrimental effects on disease progression, whereas others indicate that it has a beneficial role.
Materials and methods:
In an effort to unravel this paradox, we examined the expression and function of ATIP in cell-based models of cardiac hypertrophy using QPCR, immunohistochemistry, cell proliferation, morphological and transfection techniques in H9c2 cardio-myoblast and myotubules.
Results:
These studies indicate that in cultured cardio-myoblast and myotubules, Ang II mediates cellular hypertrophy and proliferation solely via the AT1-receptor, the ATIP variants are abundantly expressed and that ATIP3 may play an anti-proliferative/hypertrophic role in these cells in the absence of AT2-receptor expression or activation.
Conclusions:
Previously ATIP has been shown to inhibit growth factor signalling in cancerous cells via an interaction with the AT2-receptor. This is the first report to identify that ATIP may have a similar role in other disease states characterised by excessive growth and indicates that for ATIP3, at least, an interaction with the AT2-receptor may not be necessary.
Introduction
Angiotensin II (Ang II), the main effector of the renin- angiotensin system, is directly and indirectly involved in the development of cardiac hypertrophy, which increases the risk of sudden death and heart failure.1–4 It acts locally within cardiac tissues to influence protein synthesis and cellular growth via activation of the Ang II type 1 (AT1-) receptor independently of its effects on blood pressure, which increase cardiac work.5–8 Ang II induces foetal, neonatal and adult cardiomyocyte hypertrophy;5,6,9–18 and following the development of cardiac hypertrophy both the AT1- and Ang II type 2 (AT2-) receptor levels are up-regulated.19–21 By contrast, activation of the AT2-receptor has been shown to inhibit the proliferation of vascular smooth muscle cells, endothelial cells, cardiomyocytes and fibroblasts.22–29 In AT2-receptor-deficient mice the induction of myocardial infarction resulted in a greater hypertrophic response than in wild-type controls.30,31
However, the role of the AT2-receptor in the heart is not so clear cut, and other studies indicate that the AT2-receptor may have a proliferative or hypertrophic role in the heart. For instance, mice that over-express the AT2-receptor have an increased myocyte cross-sectional area and fibrosis. 32 Moreover, in contrast to the studies described above suggesting that the AT2-receptor maybe cardio-protective, Ang II infusion, aortic banding and myocardial infarction did not induce cardiac hypertrophy in AT2-receptor-deficient mice.33–35
Clearly, the exact nature of the cardiac AT2-receptor and its signalling pathways remain elusive. Recently we identified expression of a novel intracellular protein, designated ATIP, which has been shown to interact with the C-terminus of the AT2-receptor but not with the AT1-, β2-adrenergic or bradykinin BK receptors.36,37 Five ATIP isoforms designated ATIP1, ATIP2, ATIP3a, ATIP3b and ATIP4, 38 have been identified in humans, whereas only ATIP1, ATIP3, which corresponds to human ATIP3b, and ATIP4 have been identified in the rat. 39 In a range of normal and cancer cell lines, it has been demonstrated that ATIP1, working in concert with the AT2-receptor, inhibits growth factor-induced and Ang II-induced cell proliferation via inhibition of mitogen-activated protein kinase (MAPK).37,38,40,41
Beyond this, little definite is known regarding the intracellular-signalling pathways via which the ATIP isoforms act; for instance, initial reports indicated that ATIP1 did not act as a phosphatase nor did it interact directly with protein tyrosine phosphatase 1 (SHP-1),36,37 a soluble protein tyrosine phosphatase that inhibits growth factor receptor signalling and is activated following stimulation of the AT2-receptor. 42 More recently, however, AT2-receptor activation in primary cultures of rat neural cells resulted in formation of an ATIP/SHP-1 complex which translocates to the nucleus resulting in increased expression of one of the ubiquitin-conjugating enzyme variants, MMS2, which in turn prevents neural damage and promotes neural cell differentiation.36,37,41,43 Moreover, in human breast cancer cell lines, ATIP3 expression has been shown to alter the progression of cell division by promoting prolonged metaphase, thereby leading to a reduced number of cells undergoing active mitosis; 44 however, the importance of the interaction between the AT2-receptor and ATIP3 in breast cancer cells is unknown. Even less is known regarding the function and the intracellular signalling pathways of the ATIP isoforms in cardiac tissues and cell lines. Therefore, in the present study we have examined the expression and function of the three rat ATIP variants in H9c2 cardiomyoblasts and myotubules in an attempt to gain new insights into the nature of the cardiac ATIP isoforms and their interaction with the AT2-receptor.
Methods
Cell culture
Rat H9c2 myoblasts were grown in Dulbecco’s Modified Eagle’s medium (DMEM) supplemented with 4 mM glutamine, 1.5 g/l sodium bicarbonate solution 7.5% and 10% foetal calf serum (FCS). Rat myotubule cells were converted from H9c2 cells by allowing them to become confluent prior to changing the media to DMEM media supplemented with 4 mM glutamine, 1.5 g/l sodium bicarbonate solution 7.5% and 2% horse serum for 12 days to allow cell differentiation. All cell lines were maintained at 37°C in a humidified atmosphere of 5% CO2 and 95% air.
Over-expression studies in rat H9c2 cell line
Over-expression studies utilised the full-length human ATIP1 and ATIP3 fragment, sub-cloned into a pcDNA3 vector which had been kindly donated by Dr Clara Nahmias (Institute Cochin, Paris, France). The day prior to transfection, cells were plated in six well plates at a density of 1.5 × 10⁵ cells/well in DMEM media. Extra wells were seeded to examine the level of ATIP1 and ATIP3 mRNA over-expression in the cells using real-time polymerase chain reaction (PCR). Cells were approximately 60% confluent prior to transfection. On the day of transfection, 3 μl of a pcDNA3 vector containing human ATIP1, ATIP3 or pcDNA3 vector only (negative control) were diluted in 100 μl/well of serum-free DMEM in sterile tubes. In a separate tube, 4 μl/well of Lipofectin® transfection reagent (Invitrogen, Carlsbad, CA, USA) was diluted in 100 μl/well of serum-free DMEM. Both tubes were incubated for 40 minutes (min) at room temperature, following which the two tubes were mixed together and incubated for another 12 min at room temperature to allow for the formation of transfection complexes. A 1 ml aliquot of the solution was then added to each well and gently mixed to ensure uniform distribution. The plates were then incubated at 37°C humidified atmosphere of 5% CO2 and 95% air for 24 hours. Following this incubation, the media were changed to serum-free DMEM and the cells were starved for 24 hours.
Real-time PCR
Rat myoblast and myotubule cells were seeded in 25 cm2 plastic flasks or six well plates containing complete DMEM serum (CS), 2% horse serum DMEM serum (HS) or other treatments made in serum-free DMEM (SF). RNA was extracted using the RNeasy® Mini Kit (QIAGEN, USA). The quality and concentration of mRNA, as well as DNAse treatment, were performed as previously described. 45 The oligonucleotides primers and TaqmanTM probes for the various genes (Table 1) were kindly designed by Ms Josefa Pete (Baker Heart Research Institute, Prahran, Victoria, Australia) using Primer Express v2.0 (Applied Biosystems, CA, USA). Probes for the target genes were labelled with 6-carboxy-fluoresecein (FAM) reporter dye at the 5’ end. cDNA samples for each sample were analysed using the Applied Biosystems 7500 Real-time PCR System (Branchburg, New Jersey, USA). PCR amplification was conducted as previously described. 45 To control for variations in the amount of DNA used, the expression of the candidate gene of interest was normalised simultaneously (by multiplexing) in relation to expression of the housekeeping gene 18S RNA (rRNA) (18S rRNA TaqMan Control Reagent, Applied Biosystems). The CT value of each candidate gene probe was subtracted from the CT value of 18S ribosomal mRNA to give a ΔCT value. The values are represented as ΔCT or percentage fold change.
Sequences of probes and primers used in real-time PCR studies. a

AT2-receptor: angiotensin II type 2 receptor; AT1a-receptor: angiotensin II type 1a receptor; PCR: polymerase chain reaction; VEGF vascular endothelial growth factor. aThe sequences of the probes and primers for rat ATIP, ATIP1, ATIP3 and ATIP4 are available. 25
Immunoblotting for ATIP protein
Immunoblotting for ATIP protein was undertaken as previously described. 46 In short, cells were grown in T-125 flasks to 80% confluency and then detached, centrifuged and lysed in extraction buffer for five min on ice. Lysates were centrifuged and the pellet was discarded. Protein concentration was determined using Bradford instant protein assay. 47 Following protein determination, a 0.5 volume of 2× Laemmli’s buffer was added to each sample. Lysates were heated at 95°C for five mins and separated by 10% sodium dodecyl sulfate- polyacrylamide gel electrophoresis (SDS-PAGE) and immunoblotting onto nitrocellulose. Blots were incubated with 1:1000 anti-ATIP antibody (kindly donated by Dr Clara Nahmias, Cochin Institute, Paris, France) 46 overnight at 4ºC and bands visualised with an enhanced chemiluminescence kit (ECL Western blotting analysis system, Amersham Pharmacia Biotech UK Ltd, UK). Blots were stripped and re-hybridised with anti-β-actin antibody (A5316, Sigma, St. Louis, MO, USA) as a control for protein added. Band intensities were measured as previously described. 45 Each sample was run in duplicate and the ratio of ATIP over β-actin was generated for four separate experiments.
Immunoblotting of extracellular signal-regulated kinase 2 (ERK2) phosphorylation
ERK2 phosphorylation assays were conducted as described previously. 45 In summary, cells were grown in six well plates at a density of 150,000 cells per well overnight in 37°C/5% CO2. The following day the cells were FCS-starved for 48 hours prior to stimulation with the following treatments for 15 min: epidermal growth factor (EGF) (16 nM, E9644, Sigma, St. Louis, MO, USA), Ang II (500 nM, A9525, Sigma, St. Louis, MO, USA) or CGP42112A (500 nM, C160, Sigma, St. Louis, MO, USA). Cells were then washed with ice-cold phosphate-buffered saline (PBS), lysed in ice-cold buffer and Western blots performed as previously described. 45 Blots were hybridised overnight at 4°C with 1:1000 anti-phosphorylated ERK1/2 primary antibody (Sigma Aldrich Co., Australia). The following day the membrane was washed for one hour with skim milk and incubated with 1:1000 anti-phospho ERK1/2 antibody (R&D Systems) for one hour at room temperature prior to visualisation of protein bands as described above. Anti-MAP kinase 2 (ERK-2) antibody (1:1000 dilution) was used as a control for protein. The values presented in the results are the average phosphorylation of ERK2 relative to the amount of unphosphorylated ERK2 in six separate samples. Band intensity levels were measured using the Multi Gauge program. In order to simultaneously determine ERK2 phosphorylation and ATIP over-expression in the studies that examined ERK2 phosphorylation in myoblasts over-expressing ATIP1 or ATIP3, six additional wells were plated at the commencement of the assay (three of the wells were transfected with the negative control and the remaining wells were transfected with the relevant ATIP variant) and mRNA was generated for quantitative (Q)PCR analysis directly following the end of the ERK2 phosphorylation assay.
Immunohistochemistry
Rat myoblasts and myotubules were seeded on sterilised cover-slips in six well plates at 150,000 cells per well. Cells were incubated for different periods (24, 48, 96 hours or 12 days) at 37ºC/5% CO2 incubator and then fixed by immersion in ice-cold 100% methanol for 10 min, followed by five min in PBS containing 0.1% triton X. Cover-slips were washed for five min in PBS and incubated with blocking solution (10% HS, 0.3% triton-X, 3% bovine serum albumin (BSA) made up in PBS) for one hour. The cover-slips were then washed with PBS for five min and incubated overnight at 4ºC in ATIP primary antibody, with or without a 1:3 dilution of ATIP antigen.
The following day, the cover-slips were incubated for one hour at room temperature with EnVision+® System-labelled polymer-horseradish peroxidase (HRP) anti-rabbit (DAKO, Australia) and incubated with 3-amino-9-ethylcarbazole (AEC) Chromogen for 10 min. The slides were then counterstained with haematoxylin and Scott’s tap water.
Morphological visualisation of rat myoblast and myotubule cells
Morphological changes in rat myoblasts and myotubules were detected by seeding the cells at 150,000 cells per well in six well plates on sterile cover-slips. The cells were treated as described in the legend to Figure 1. On the final day of the experiment, cells were methanol fixed and then immersed in 0.1% Triton X in PBS for four min at room temperature. Cover-slips were then incubated for two min at room temperature with haematoxylin and then for three to four seconds with 0.3% acid alcohol to remove background staining. The cover-slips were finally stained with eosin for two min at room temperature and then rehydrated in 90% and 100% alcohol and washed for 30 seconds in xylene. Cover-slips were mounted on slides and cell size was determined using the MCID program (InterFocus Imaging Ltd, UK). The outer layer of the cell was traced and the area was calculated for 10 cells in each field and five fields were chosen for each treatment.

Average myoblast (a) and myotubule (b) volume, expressed as a percentage relative to untreated cells following treatment with 500 nM CGP42112A (AT2-receptor agonist), 500 nM losartan (AT1-receptor blocker) or a combination of CGP42112A and losartan. Graphed values represent the geometric mean and 95% confidence intervals following three independent experiments. * and ** signify that cell volume in the presence of CGP42112A is significantly higher than in untreated cells, p < 0.01 and p < 0.001, respectively. #, ## and ### signify that cell volume in CGP42112A-treated cells is significantly higher than following treatment with losartan or losartan in combination with CGP42112A, p < 0.05, p< 0.01 and p < 0.001, respectively.
[3H]Thymidine incorporation assay
These studies were conducted as previously described. 45 In short, H9c2 myoblasts were seeded in 24 well plates at 35,000 cells per well and incubated in the presence or absence of 16 nM EGF, 100 nM Ang II and 500 nM CGP42112A for 18 hours. [3H]thymidine (1.0 μCi/ml) (GE Healthcare, Buckinghamshire, England) was added to each well and cells were incubated for a further two hours at 37°C and 5% CO2. Cells were then washed twice with ice-cold PBS to remove unincorporated [3H]thymidine prior to the addition of 10% trichloroacetic acid solution (TCA, AJAX Chemicals, N.S.W, Australia, 250 μl) to each well, which were then left on ice for 30 minutes at 4ºC to allow protein precipitation. Cells were washed with 70% ethanol and NaOH/SDS (0.25 M NaOH (APS Finechem, N.S.W, Australia)/0.1% SDS, 300 μl) solution was added to each well to lyse the cells. Three hundred μl of suspension was then transferred to a counter plate and 300 μl of ‘Optiphase supermix’ solution (Wallac, Turku, Finland) was added. Radioactivity present was then determined using a 1450 Microbeta PLUS liquid scintillation counter (Wallac, Turku, Finland).
Statistical analysis
Data are expressed as the mean ± SEM. Statistical differences between the mean values for real-time PCR, Western blot, immunohistochemical and hypertrophy studies were examined either using Student’s t test or analysis of variance (ANOVA) with Tukey-Kramer Multiple Comparisons Post tests (comparing all pairs of columns or by using Graphpad Instat ® v3.06 (Graphpad Software Inc, La Jolla, CA, USA)). P values of < 0.05 were considered significant. In some instances, where noted, data were log-transformed and the data graphed represent the back-transformed geometric mean and 95% confidence intervals.
Results
Expression of ATIP and Ang II receptors mRNA in myoblast and myotubule cell lines
The expression of mRNA for total ATIP (tATIP), which represents combined expression of ATIP1, ATIP3 and ATIP4 and the individual levels of ATIP1, ATIP3, AT1- and AT2-receptors, were examined in rat myoblasts and myotubules.
tATIP mRNA was expressed at high levels in both cell lines, with ATIP3 mRNA being the major ATIP isoform present (Table 2). ATIP1 mRNA was expressed at significantly higher levels (two-fold, p = 0.03) in myoblast than in myotubule cells, whereas tATIP and ATIP3 were expressed at similar levels in both cell lines. By contrast, AT1-receptor mRNA was approximately three-fold higher in myotubules than myoblasts (p = 0.01); whereas, although relatively low levels of AT2-receptor mRNA were identified in myotubule cells, it could not be consistently detected in myoblasts (i.e. it was identified in only six of the 40 independent samples examined), strongly suggesting that AT2-receptor mRNA is expressed at higher levels in myotubules than myoblasts and that there is little to no AT2-receptor mRNA expressed in myoblast cells.
Comparison of the expression of mRNA for tATIP, ATIP1, ATIP3 and AT1-receptors in H9c2 myoblasts and myotubules.
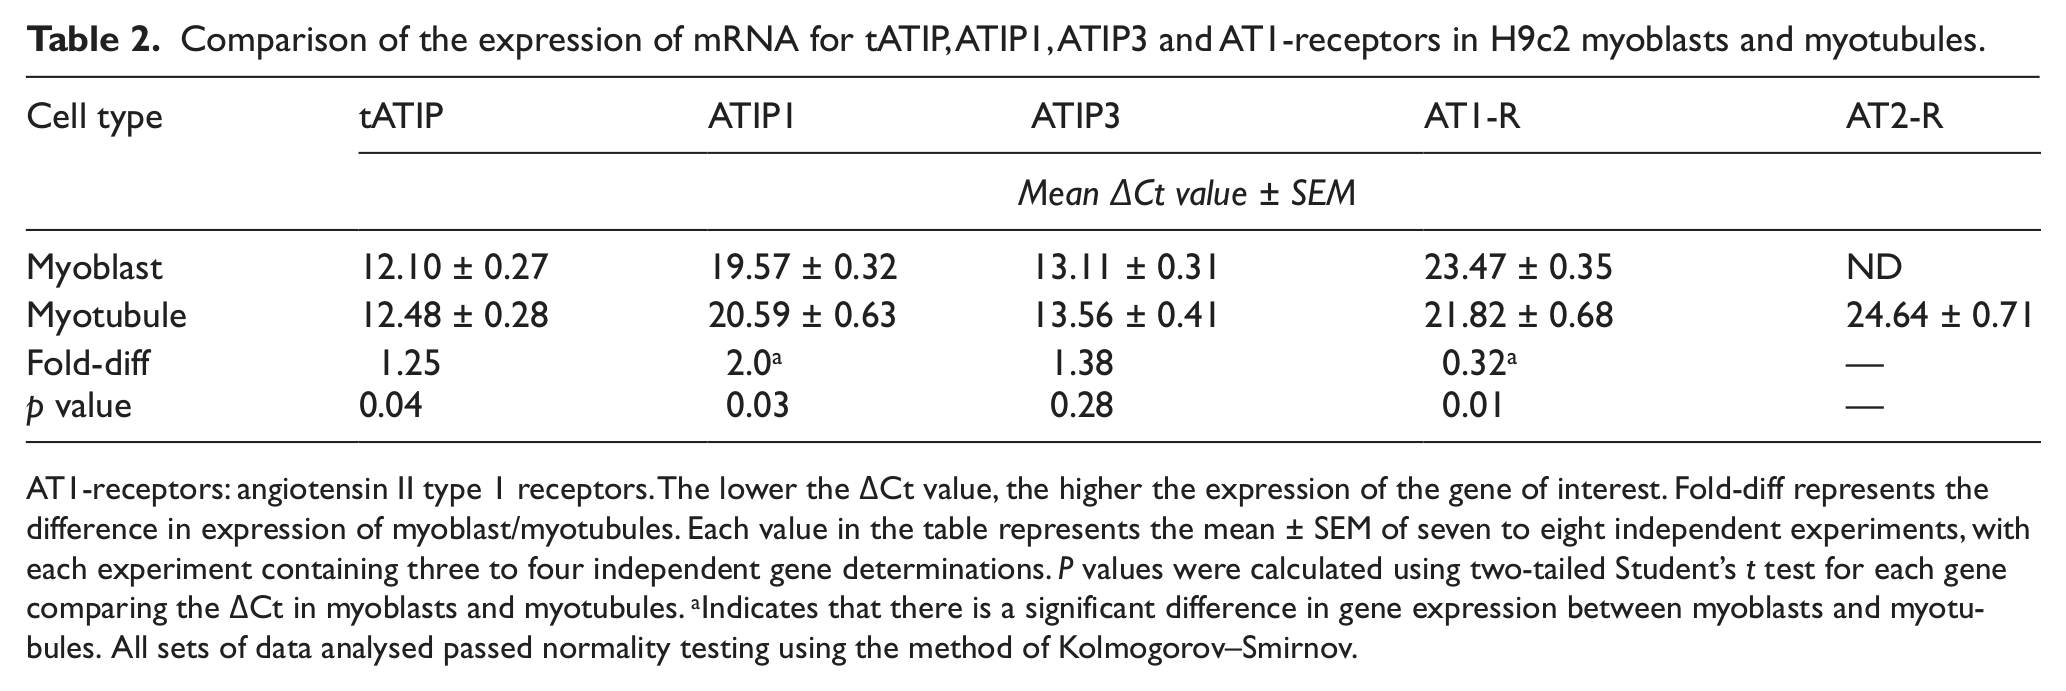
AT1-receptors: angiotensin II type 1 receptors. The lower the ΔCt value, the higher the expression of the gene of interest. Fold-diff represents the difference in expression of myoblast/myotubules. Each value in the table represents the mean ± SEM of seven to eight independent experiments, with each experiment containing three to four independent gene determinations. P values were calculated using two-tailed Student’s t test for each gene comparing the ΔCt in myoblasts and myotubules. aIndicates that there is a significant difference in gene expression between myoblasts and myotubules. All sets of data analysed passed normality testing using the method of Kolmogorov–Smirnov.
tATIP protein expression and localisation in myoblast and myotubule cell lines
Using an anti-ATIP antibody that identifies all three ATIP isoforms present in the rat (i.e. tATIP), 36 tATIP protein expression and localisation was examined in whole myoblast and myotubule cells grown on cover-slips. tATIP staining was localised to the cytoplasm of both cell lines, whereas there was little or no staining observed in the nuclei (Figure 2). Moreover, staining was inhibited when cells were incubated with an ATIP antibody that had been pre-absorbed overnight with ATIP antigen (Figure 2(b), (d), (f) and (g)).

Immunolocalisation of ATIP in myoblast and myotubule cells. ((a) and (e)) absence and ((c) and (g)) presence of haematoxylin counter-stain. Cover-slips were either incubated with a 1:1000 dilution of ATIP antibody or ATIP antibody pre-absorbed with a 1:3 dilution of ATIP antigen overnight in ((b) and (f)) absence and ((d) and (h)) presence of counter-staining with haematoxylin and Scott’s tap water. ATIP is localised to the cell cytoplasm. Arrows indicate the multinucleated cells. (i) Graphical representation of total stained area divided by number of cells on each slide calculated using the MCID program. *, p < 0.05, **, p < 0.01 vs myoblast + ATIP. Each column represents the mean ± SEM of three fields.
To quantitate ATIP levels, some cover-slips were not counterstained with haematoxylin and Scott’s tap water (Figure 2(a), (b), (e) and (f)) and four randomly chosen fields from each cover-slip were then examined (Figure 2(a) and (e)) for tATIP staining intensity, determined using the MCID program. The analysis indicated that tATIP staining was significantly (p < 0.01) higher in myoblasts than myotubule cells (Figure 2(i)).
Effect of treatment with Ang II, EGF and CGP42112A on the mRNA expression of Ang II receptors and ATIP in myoblast and myotubule cells
In both rat myoblast and myotubule cells, treatment with either 16 nM EGF, 100 nM Ang II or the specific AT2-receptor agonist CGP42112A (500 nM) did not modify the expression mRNA for either Ang II receptor or any ATIP variant (data not shown).
Effect of treatment with Ang II, EGF and CGP42112A on myoblast and myotubule morphology and hypertrophy
Rat myoblast and myotubule cells were seeded on cover-slips, treated for 48 or 96 hours with EGF or 96 hours with Ang II, or CGP42112A and cell volume was calculated following counterstaining.
As the size of cell nucleus was not significantly different in the untreated and treated cells (p = 0.23 for myoblasts and p = 0.39 for myotubules), we used mean change in cell volume as a measure of cellular hypertrophy.
Treatment of myoblasts with 16 nM EGF for 48 hours had no effect on cell volume, whereas 96-hour EGF treatment significantly induced (p < 0.001) cellular hypertrophy. Stimulation with either Ang II (100 nM) or CGP42112A (500 nM) for 96 hours also significantly increased cell volume (i.e. cellular hypertrophy) (p < 0.001).
In myotubules, 48 hours’ treatment with 16 nM EGF or 96 hours treatment with Ang II or CGP42112A induced a significant increase in myotubule volume (p ≤ 0.001). When Ang II was added in combination with the AT1-receptor blocker losartan (500 nM) it no longer induced cell hypertrophy, suggesting that Ang II-induced hypertrophy is primarily mediated through activation of the AT1-receptor in myotubule cells (data not shown).
We then examined the effects of the AT2-selective agonist CGP42112A (500 nM) in the presence and absence of AT1-receptor blockade (500 nM losartan). As in our previous studies in myoblasts, CGP42112A significantly increased cell volume (p < 0.01), whereas losartan by itself had no effect on cell volume (Figure 1(a)). However, when losartan was given in combination with CGP42112A it reversed the effects of the agonist, and cell volume was not significantly different from control cells (Figure 1(a)). The results in myotubule cells were similar, with CGP42112A significantly increasing cell volume compared to control cells (p < 0.01) and losartan reversing the effects of CGP42112A (Figure 1(b)).
Effect of Ang II, EGF and CGP42112A myoblast and myotubule proliferation
As H9c2 myotubule cells are terminally differentiated and do not undergo mitosis, H9c2 myoblasts were treated with a range of EGF (1 pM–10 nM), Ang II (10 nM–1 µM) and CGP42112A (500 nM) concentrations to determine the effect of the agonists on the rate of cell proliferation, as measured by [3H]thymidine incorporation.
Following 18 hours’ treatment there was a significant dose-dependent increase in the rate of cell proliferation following treatment with 1 nM and 10 nM EGF (Figure 3(a)); by contrast, Ang II increased proliferation significantly only at concentrations of greater or equal to 100 nM (Figure 3(b)). When cells were treated with 10 nM EGF in combination with 100 nM Ang II, [3H]thymidine incorporation was increased above the levels seen when myoblasts with treated with 10 nM EGF alone (Figure 3(c)). By contrast, the increase in proliferation seen when the cells were treated with 500 nM CGP42112A (AT2-receptor agonist) for 18 hours did not reach significance, and incubation of CGP42112A in combination with EGF did not potentiate the effects of EGF above those seen for EGF alone (Figure 3(c)). A final series of studies identified that 1 µM losartan reversed the significant proliferative effects of 1 µM Ang II (Figure 3(d)).

[3H]Thymidine incorporation in untreated (control) rat myoblast cells and following treatment with: (a) 1 pM–10 nM EGF; (b) 10 nM–1 µM Ang II; (c) 10 nM EGF, 100 nM Ang II, 500 nM CGP4212A (CGP), 500 nM CGP + 10 nM EGF and 100 nM Ang II + 10 nM EGF; and (d) 1 µM Ang II, 1 µM losartan (Los) and 1 µM Los + 1 µM Ang II. Data are expressed as percentage of [3H]thymidine incorporation in untreated cells. Each column represents the geometric mean and 95% confidence intervals of three to four independent experiments. *, ** and *** indicates that treated cells have significantly higher radioactive incorporation than untreated cells, where p < 0.05, 0.01 and 0.001, respectively; # indicates that cells treated with 10 nM EGF + 100 nM Ang II have significantly higher incorporation than cells treated with 10 nM EGF (p < 0.05); and % indicates that cells treated with 1 µM Ang II + 1 µM losartan have significantly lower [3H]thymidine incorporation than cells treated with 1 µM Ang II (p < 0.05). EGF: epidermal growth factor.
Effect of Ang II, EGF and CGP42112A on ERK phosphorylation in myoblast and myotubule cells
ERK2 phosphorylation was examined in myoblast and myotubule cells to identify whether the proliferative and hypertrophic effects of Ang II, EGF and CGP42112A seen in our preceding studies were mediated through the ERK2 pathway.
In rat myoblast cells 16 nM EGF induced ~110% increase in ERK2 phosphorylation compared to untreated cells (p < 0.01) (Figure 4(a)). By contrast, 500 nM Ang II did not significantly increase ERK2 phosphorylation (p > 0.05). However, when EGF was added in combination with Ang II, ERK2 phosphorylation was increased by approximately 170%, which was 60% higher than when EGF was given alone (p < 0.001) (Figure 4(a)). CGP42112A (500 nM) did not affect ERK2 phosphorylation (p > 0.05) (Figure 4(b)) and, unlike the effect of Ang II in these cells, CGP42112A did not potentiate the effects of EGF.

Immunoblot of cell lysates from rat (a) myoblast and (c) myotubule cells treated with 16 nM EGF and/or 100 nM Ang II or (b) myoblast and (d) myotubule cells treated with 16 nM EGF and/or 500 nM CGP42122A using an anti-phospho ERK1 and 2 antibody. (e) Basal ERK levels of untreated myoblasts and myotubules. The same blot was then re-probed with an anti-ERK2 antibody. n = 6, **, p < 0.01, ***, p < 0.001 vs control. #, p < 0.05 vs 16 nM EGF, ^, p < 0.05 vs myoblast.
In rat myotubule cells 16 nM EGF induced an approximate 125% increase in ERK2 phosphorylation (p < 0.001) (Figure 4(c)). By contrast, 500 nM Ang II alone did not affect ERK2 phosphorylation; however, in combination with EGF, it potentiated the ability of EGF to induce ERK2 phosphorylation (255%), approximately 130% higher than EGF treatment alone (p < 0.001) (Figure 4(c)). Although the increase in ERK2 phosphorylation response was of a greater magnitude following the treatment of myotubules with the combination of EGF and Ang II, a similar synergy of effect was also observed in myoblast cells (Figure 4(a)). As in myoblasts, 500 nM CGP42112A had no effect on ERK2 phosphorylation in myotubules nor did it potentiate the effects of 16 nM EGF when given in combination (Figure 4(d)). In all ERK studies we observed that the basal levels of ERK2 phosphorylation were significantly higher (approximately 50%) in rat myoblast than myotubule cells (p < 0.05) (Figure 4(e)).
Effect of ATIP1 and ATIP3 over-expression on ERK phosphorylation in myoblasts
Preliminary studies identified 48 hours as the optimum time point for over-expression studies (data not shown). In H9c2 myoblasts transfected with an empty pcDNA3 vector (control transfected) stimulation with 16 nM EGF induced an approximate 3.5-fold increase in ERK2 phosphorylation (p < 0.005) (Figure 5(a) and (b)). In myoblasts transfected with ATIP1 there was no difference in the basal levels of ERK2 phosphorylation or the ability of EGF to stimulate pERK2 compared with empty pcDNA3 transfected myoblasts.

Representative immunoblot of H9c2 myoblasts transfected with either an empty pcDNA3 vector or a pcDNA3 vector containing hATIP1 (a) or hATIP3 (c), treated with 16 nM EGF using an anti-phospho ERK1 and 2 antibody. The same blot was then re-probed with an anti-ERK2 antibody. Summary graph of phospho-ERK2/anti-ERK2 band density for hATIP1 (b) and hATIP3 (d) from three to six different samples. *, p < 0.005 vs untreated cells transfected with empty vector. ^ p < 0.05 vs EGF-treated cells transfected with empty vector.
By contrast, although the basal levels of ERK2 phosphorylation were similar in both ATIP3 transfected and control transfected myoblasts (Figures 5(c) and (d)), the ability of 16 nM EGF to induce phosphorylation of ERK2 was significantly attenuated in myoblasts transfected with ATIP3 compared with the effects of EGF in control transfected cells (p < 0.05).
Discussion
The clonal cell line H9c2, which was derived from embryonic rat heart, exhibits many of the properties of skeletal muscle and is often used as a surrogate for cardiac or skeletal muscle in vitro. 48 When cultured in low-serum medium, H9c2 myoblasts terminally differentiate into myocytes/myotubules. 49 In the present studies we have examined AT1-, AT2-receptor mRNA and ATIP mRNA and protein expression in rat H9c2 cardiac myoblast and myotubule cells under treated and untreated conditions. Moreover, we have described the effect of growth agents on cellular hypertrophy in these cells, as well as identifying the effects of ATIP1 and ATIP3 over-expression on ERK2 phosphorylation in myoblasts.
This is the first time ATIP expression has been investigated in cardiac cell lines, and we identified that ATIP mRNA was abundantly expressed in both myoblast and myotubules, with ATIP3 being the predominantly expressed variant (Table 2). Moreover, the expression of AT1-receptor mRNA was confirmed in both cell lines, and we identified that rat myotubules demonstrated higher levels of mRNA for both AT1- and AT2-receptors than myoblasts. Previously, it has been reported that H9c2 cells do not express AT2-receptors, 50 and our own results give support to this finding as we detected AT2-receptor mRNA in myoblast cells only at very low levels and not consistently in all samples. These findings are in contrast to the relative expression of the ATIP variants in rat left ventricle, where ATIP1 mRNA was the predominantly expressed ATIP variant followed by ATIP3 mRNA. 39 ATIP protein was identified in both whole myoblasts and myotubules using immunohistochemical techniques (Figure 2(a) and (b)); cytoplasmic staining for tATIP in whole cells was significantly higher in myoblasts than myotubules (Figure 1(i)). Unfortunately, due to the non-specific nature of the anti-tATIP antibody used in the immunohistochemical studies, it was not possible to determine the relative expression of the individual ATIP proteins in whole cells. Therefore, no real conclusions could be drawn regarding the efficiency of translation of the various ATIP mRNA species in the cells; however, it is tempting to speculate that the significantly higher protein expression seen in myoblasts may result from the significantly higher levels of ATIP1 mRNA identified in these cells and this possibility warrants further investigation.
As growth factors, for example, Ang II and EGF, are implicated in the development of hypertension and other cardiovascular diseases, and as the anti-tATIP antibody used in our work cannot discriminate between the various ATIP proteins in whole cells, we investigated whether these agents induced changes in the expression levels of mRNA for the ATIP isoforms and the Ang II receptors. Using the endogenous AT1- and AT2-receptor agonist Ang II and epidermal growth factor EGF, we attempted to simulate conditions similar to those that occur during hypertension. Previously, we identified that stimulation of LNCaP and PC3 cells with EGF or Ang II significantly decreased the expression of tATIP and ATIP1 mRNA but had no effect on the levels of AT1- and AT2-receptor mRNA. 46 By contrast, in rat myoblast and myotubules, treatment with either EGF or Ang II did not affect ATIP mRNA expression (data not shown).
In functional studies by contrast and consistent with previous reports,12,14,17,51–55 EGF and Ang II induced cellular hypertrophy in both H9c2 myoblasts and myotubules (Figure 3). Although some studies have linked the hypertrophic effects of Ang II to activation of the AT2-receptor,33,56–58 most studies indicate the AT1-receptor is the primary mediator of Ang II-induced cellular hypertrophy.7,12,17,28,53,59,60 As our own results (Figure 2(a) and (b)) and previous work indicate that H9c2 myoblasts contain few to no AT2-receptors, 50 we were somewhat surprised that the AT2-receptor agonist CGP42112A also induced cardiac hypertrophy in the H9c2 cell lines. However, although CGP42112A is a selective AT2-receptor agonist, at high concentrations it also has the capacity to bind to and activate the AT1-receptor.61,62 Therefore, to examine whether the cellular hypertrophy observed with CGP42112A was possibly mediated via the AT1-receptor, we first incubated the cells with losartan (an AT1-receptor selective antagonist) in the presence or absence of the equipotent Ang II receptor agonist Ang II. In these studies, losartan inhibited the ability of Ang II to induce cellular hypertrophy (data not shown), suggesting that Ang II induced cellular hypertrophy primarily via the AT1-receptor. Further studies were then conducted to determine whether the hypertrophic action of CGP42112A was also mediated by the AT1-receptor. In these studies, which were conducted in both in myoblasts and myotubules, the AT1-receptor antagonist losartan inhibited CGP42112A-mediated increases in cell volume (Figure 1(a) and (b)); therefore, indicating that the Ang II receptor primarily responsible for mediating hypertrophic responses in H9c2 cells was the AT1-receptor.
Moreover, hypertrophy of the rat myoblast and myotubules was accompanied by an increase or re-expression of AT2-receptor mRNA, although this did not reach statistical significance (data not shown). Other studies have also identified an up-regulation of the AT2-receptor with cardiac hypertrophy;19–21 however, the development of the onset of AT2-receptor re-expression is controversial and whether it occurs following or prior to the development of hypertrophy requires further clarification.25,30–35,56,63,64
We also examined the effects of EGF, Ang II and CGP42112A on myoblast proliferation using [3H]thymidine incorporation and ERK phosphorylation assays. These studies identified a dose-dependent increase in [3H]thymidine incorporation following treatment with EGF and Ang II for 18 hours (Figure 3). By contrast, but consistent with a lack of AT2-receptor-mediated growth in these cells, CGP42112A did not affect cell proliferation nor did it potentiate the effects of EGF when given in combination.
In ERK phosphorylation assays, we observed that in both myoblast and myotubules EGF increased ERK2 phosphorylation and although while not having an effect when given alone, Ang II significantly potentiated the effect of EGF (Figure 4). This latter finding is consistent with work conducted in vascular smooth muscle cells derived from porcine thoracic aortas, 65 which suggested that Ang II interacts synergistically with EGF to induce sustained proliferation via complementary actions at different cell cycle phases, as EGF has been shown to be involved in the early cell cycle phases and Ang II tends to be involved in the later cell cycle phases. 65 However, this finding contrasts with previous work in which Ang II stimulated ERK2 phosphorylation in rat myoblasts. 66 This discrepancy, however, may result from differences in the incubation medias used as in Kinjo et al. 40 Ang II was given in combination with 0.5% FCS, whereas in all of our ERK phosphorylation studies the cells were serum starved overnight and during treatment in an attempt to improve assay sensitivity. Consistent with our [3H]thymidine studies, CGP42112A did not induce ERK2 phosphorylation (Figure 4), adding further weight to the possibility that the AT2-receptor is not a pro-growth receptor in these cell lines. 50
Although there were no changes in the expression of ATIP mRNA following treatment with the hypertrophic agonists, we further investigated the role of ATIP1 and ATIP3 in these cell lines by over-expressing these variants in H9c2 myoblasts. ATIP1 is the most studied ATIP variant,36,37,41,43 and it has been shown to inhibit growth factor-induced ERK2 activation and insulin receptor autophosphorylation. 36 Moreover, loss or down-regulation of ATIP1 mRNA expression promotes cell proliferation in some tissues.37,41 In our previous studies in prostate cancer cell lines, over-expression of ATIP1 significantly decreased basal levels of ERK2 phosphorylation and EGF-induced ERK2 phosphorylation was attenuated compared to control transfected prostate cancer cells. 46 By contrast, over-expression of ATIP1 in rat H9c2 myoblasts did not affect basal levels of ERK2 activation, nor did it significantly inhibit the ability of EGF to stimulate ERK2 phosphorylation in these cells (Figures 5(a) and (b)). This was not surprising, however, as we have previously reported that the effects of ATIP1 over-expression are dependent on the co-expression of the AT2-receptor, 36 and our mRNA expression studies suggest that H9c2 myoblasts contain little to no AT2-receptors (Table 2).
We also examined the effect of ATIP3 over-expression in H9c2 myoblasts, the most highly expressed ATIP variant in these cells, as to date there are little published data available regarding the function and expression of this variant, particularly in cardiac cells. What is known is that ATIP3 expression decreases in invasive breast tumours, 44 and over-expression of this variant, much like the effects of ATIP1 over-expression in normal 36 and prostate cancer cells, 46 reduces cell division. 44 Moreover, ATIP3 has been shown to be a mitotic spindle-associated protein in breast cancer cells and prolongs mitosis. 44 In the current study we demonstrated that in H9c2 myoblasts, consistent with its action in breast cancer cells, 44 ATIP3 over-expression attenuated the effects of EGF on ERK2 phosphorylation compared to control transfected myoblasts (Figure 5(c) and (d)).
Due to the limitations of the cell lines used, it is difficult to determine the relevance of the present study to humans. Although ATIP mRNA is expressed in normal human heart, albeit at relatively low levels compared to other tissues, with the predominantly expressed ATIP variants being ATIP1 and ATIP3a, 38 the levels of ATIP expression in diseased hearts have not been investigated and it is therefore not known whether cardiac ATIP levels increase or decrease following the onset of cardiovascular disease. In spite of these shortcomings, the current study suggests that ATIP3 may at least have a role in myocardial homeostasis and the evidence indicating increased AT2-receptor expression following the development of cardiac hypertrophy possibly suggests that ATIP1 may also have a role in regulating cardiac growth.
In conclusion, the present study has identified for the first time ATIP protein and mRNA expression in rat H9c2 myoblasts and myotubules. In addition, Ang II-induced hypertrophy in these cell lines appears to be primarily mediated via activation of the AT1-receptor. In H9c2 myoblasts, which do not contain AT2-receptors, ATIP1-over expression had no effect on either basal or EGF-stimulated levels of ERK2 activation, whereas over-expression of ATIP3 retarded the ability of EGF to activate ERK2 phosphorylation, possibly indicating that ATIP3 can influence cell growth and hypertrophy independently of the AT2-receptor. These results suggest that ATIP3 and possibly ATIP1, following the re-expression of the AT2-receptor which occurs following the onset of cardiac disease, play a role in growth factor-induced cardiac myoblast hypertrophy and growth, and further exploration of the underlying mechanisms of their action warrants further investigation.
Footnotes
Conflict of interest
None declared.
Funding
This work has been kindly supported by the Austin Medical Research Foundation and the University of Melbourne.