
Abstract
Tubulin-associated unit (tau) has an important role in the pathogenesis and the diagnosis of Alzheimer's disease (AD) and other tauopathies. In view of the diversity of tau proteoforms, antibody-free methods represent a good approach for unbiased quantification. We adapted and evaluated the single-pot, solid-phase-enhanced sample-preparation (SP3) protocol for antibody-free extraction of the tau protein in cerebro-spinal fluid (CSF) mimic and in human brain. A total of 13 non-modified peptides were quantified by high-resolution mass spectrometry (HRMS) after digestion of tau by trypsin. We significantly improved the basic SP3 protocol by carefully optimizing the organic solvents and incubation time for tau binding, as well as the digestion step for the release directly from the SP3 beads of the 13 tau peptides. These optimizations proved to be primarily beneficial for the most hydrophilic tau peptides, increasing the sequence coverage of recombinant tau. Mean recovery in CSF mimic of the 13 non-modified peptides was of 53%, with LODs ranging from 0.75 to 10 ng/mL. Next, we tested the optimized SP3 protocol on pathological tau extracted from the soluble fraction from an AD brain sample (middle frontal gyrus). We could successfully identify and quantify biologically relevant tau peptides including representative peptides of two isoforms and two phospho-peptides (pTau217 and pTau181).
Introduction
Tauopathies are a group of neurodegenerative diseases characterized by the presence of tubulin-associated unit (tau) protein aggregates, forming neurofibrillary tangles in the brain.1,2 This phenomenon results in the impairment of microtubule structure stability, leading to neuronal dysfunctions as well as progressive neuronal loss.1,2 Brain neurofibrillary tangles are comprised of abnormal post-translational modifications (PTMs) on tau aggregates (e.g. phosphorylation, truncation, acetylation).1–3 These tangles are enriched in specific tau isoforms, depending on the occurring tauopathy. For example, 4R isoforms, which are isoforms that contain four carboxy-terminal repeat domains, are prominent in progressive supranuclear palsy and cortico-basal dementia. 3 Indeed, tauopathies differ by their epidemiology, clinical phenotypes, pathology, genetics, types of aggregates and dominant tau PTMs. 4 The most common tauopathy is Alzheimer's disease (AD), which affects nowadays 50 million people worldwide, 5 with an increasing prevalence mainly linked to a longer life expectancy of the population. 4 AD is characterized by a decline of cognitive functions, which leads to progressive memory loss, spatial disorientation, and deterioration of intellectual capacity. 1 Diagnosis of tauopathies is mainly based on the clinical examination, brain imaging (e.g. positron emission tomography, PET and magnetic resonance imaging, MRI) and, only in the case of AD, cerebro-spinal fluid (CSF) biomarkers (e.g. total tau, phosphorylated tau, and truncated amyloid beta levels).1,2 Nonetheless, the differential diagnosis of tauopathies remains a challenge mainly due to the lack of validated biological biomarkers (BMs) besides AD. 1
Methods for characterization and measurement of the tau protein in biological samples are needed for the identification of relevant biomarkers. 1 Mass spectrometry (MS) is most suited for this objective by providing a high level of specificity and precise quantification. 1 Efficient sample clean-up prior to MS is critical for detecting the tau protein species in biological samples of high matrix complexity,2,3 such as brain tissue or CSF. Several immunopurification (IP) methods were reported for purification of tau from human brain, CSF and plasma samples.1,2,6 Enrichment of tau species by IP provides high sensitivity and allows the detection of tau phosphorylated proteins at a trace level, that is in pg/mL range, in human plasma. 7 However, due to the presence of truncations, splice variants and PTMs, 8 antibodies may not capture all the diversity of proteoforms. 2 Antibody-free extraction protocols represent a good complement or alternative in the objective of unbiased analyses of the variety of proteoforms described for tau. 9 Top-down or intact protein analysis, which delivers the most comprehensive information on the protein sequence, 10 would benefit in the future from such extraction protocols.
Recently, the single-pot, solid-phase-enhanced sample-preparation (SP3) protocol was proposed for effective and high-throughput protein extraction from complex matrixes.2–4 The method relies on hydrophilic interactions of proteins and peptides with the surface of carboxylate-functionalized magnetic beads, 2 in a mechanism similar to hydrophilic interaction liquid chromatography (HILIC). 2 We adapted here an antibody-free extraction of tau by combining SP3 with perchloric acid precipitation (Prec-SP3). 2 The SP3 protocol was optimized on a 441 tau-recombinant protein in diluted human serum to ensure optimal recovery of a diversity of tau peptides along the sequence. The final conditions allowed extraction and quantitation of three tau proteoforms, along with 13 non-modified tau peptides, from an AD brain tissue (soluble fraction).
Experimental
Chemicals and materials
Lyophilized 14N recombinant tau (isoform 441) was purchased from Sigma-Aldrich (Saint Quentin Fallavier, France) (>90% purity by SDS-PAGE) and was suspended in water (final concentration: 100 μg/mL). The 15N-tau-441 recombinant protein was a gift from Guy Lippens (CNRS – Universite de Lille 1, UMR8576, Villeneuve-d’Ascq, France). 1 The sequencing Grade Modified Trypsin was purchased from Promega (Madison, USA). The ammonium bicarbonate was purchased from Sigma-Aldrich (Saint Quentin Fallavier, France). The RapiGest SF Surfactant and the μSPE Oasis HLB sorbent plates were from Waters Corporation (Milford, MA). Water (ChromaSolve LC–MS), and acetonitrile (HPLC grade) were obtained from Honeywell/Riedel-de Haen (Seelze, Germany) and formic acid from VWR chemicals (Fontenay sous Bois, France). Ethanol (EtOH) and all other chemicals were obtained from Sigma-Aldrich (Saint Quentin Fallavier, France) or VWR Chemicals (Fontenay sous Bois, France). SP3 clean-up used Sera-Mag SpeedBeads (GE Healthcare, cat. no. 45152105050250) and Sera-Mag SpeedBeads (GE Healthcare, cat. no. 65152105050250) combined in equal parts. We used LoBind Eppendorf tubes (Dutscher, Brumath, France) for all reactions. Human serum was purchased from Merck Millipore and the human brain soluble fractions were provided from Rita Azevedo, after extraction of brain samples from Brainbank Neuro CEB Neuropathology Network.
Tau protein solutions
For the implementation and optimization of the SP3 protocol, recombinant 441-14N tau protein was used and diluted to target concentrations (0.25–50 ng/mL) in CSF mimic composed of 0.5% human serum (diluent used: water),1,2,11 and spiked with 0.2 µg (20 µL) of 15N-tau-441 as internal standard immediately after thawing. The dilution aimed to mimic CSF protein concentration. 1
Brain sample
For the final evaluation of the optimized protocol, we used pathological tau from a soluble fraction of the middle frontal gyrus (MFG) of an AD brain sample. This was obtained from an autopsy confirmed AD subject and was extracted as follows. Frozen brain tissue (0.6 g) was homogenized using 1.5 mL/g of high-salt buffer pH 7.4 (0.75 M NaCl, 100 mM Tris–HCl pH 8.0, 1 mM EGTA, 0.5 mM MgSO4, 0.02 M NaF (Sigma)). The buffer included protease inhibitors cocktail (cOmplete), 0.1% phosphatase inhibitors cocktail 3, and 0.1% deacetylase inhibitors IV (from Thermo Scientific). The sample was centrifuged at 14,000 × g for 45 min at 4°C to remove the cell debris. The collected supernatant (S1) was ultracentrifuged at 180,000 × g for 30 min at 4 °C (Optima Ultracentrifuge, TLA-55 rotor, Beckman Coulter). The second supernatant obtained (S2) was collected, and the protein amount of this soluble fraction was determined using the Pierce Detergent Compatible Bradford Assay (Thermo). Finally, this second supernatant sample was diluted 100-fold with 0.5% human serum to match the matrix first evaluated in this work. The brain sample was collected through a brain donation program dedicated to neurodegenerative dementias coordinated by the NeuroCEB Brain Bank Network. The informed consent for post-mortem examination and research studies was signed by the legal representative of the patient in patient's name, as allowed by the French law and approved by the local ethics committee. All procedures performed in this study involving human participants were in accordance with the ethical standards of the institutional research committees and with the 1964 Helsinki Declaration.
Acidic precipitation (Prec)
Ten microliters of 70% perchloric acid were added to 200 µL of 14N-tau diluted in 0.5% serum or 200 µL of the soluble protein fraction (i.e. the supernatant) from brain tissue diluted a 100-fold in 0.5% serum to precipitate proteins. The samples were kept on ice for 15 min before centrifugation for 15 min, 4 °C, at 18,800 × g. Finally, the supernatants were collected for purification, with a final volume of 200 µL.
µSPE clean-up
The supernatants from acidic precipitation were mixed with 20 μL of 1% trifluoroacetic acid (TFA) before μSPE extraction on Oasis HLB sorbent, which was previously conditioned with 300 μL of methanol and equilibrated with 500 μL of 0.1% TFA. The samples were loaded and washed with 500 μL of 0.1% TFA in 10% acetonitrile. Tau proteins and proteoforms were eluted with 100 μL of 0.1% TFA in 50% acetonitrile. This sample was then diluted in 100 µL of 50 mM ammonium bicarbonate.
SP3 clean-up
SP3 beads were prepared following the protocol from Hughes et al. After acidic precipitation, the tau protein solution was mixed with 500 µg of SP3 beads (concentration of the beads solution: 50 mg of beads/mL) for a bead to protein ratio of 10:1 (w/w). After gentle homogenization in 210 µL of acetonitrile (ACN) (the volume of ACN must be the same as the total volume of the sample −200 µL – and the beads − 10 µL-), the mixture was incubated for 1 h at 24°C, 1000 r/min to bind the proteins with the beads. After incubation, 200 µL of 80% ACN was used to rinse the beads twice before re-suspending in 25 µL of Rapigest 0.05% in 50 mM ammonium bicarbonate containing 0.5% ACN). Finally, the samples underwent 30sec of sonication (ultrasonic bath) to help re-solubilizing the beads correctly before enzymatic digestion.
Enzymatic digestion
The purified proteins were digested on-beads overnight with 5 µL of trypsin at 200 µg/mL in water (enzyme final concentration: 100 ng/mL) at 37 °C, 1000 r/min in a ThermoMixer. The tubes were then placed on a magnetic rack until the beads had settled onto the tube wall. The supernatant was removed to a fresh tube before incubation with 5 µL of 1 M HCl to stop the reaction. This incubation step was done at 37 °C and 350 r/min, for 45 min. Then, the digest was centrifuged at 14,000 r/min for 10 min to discard precipitated Rapigest before transferring supernatant to MS vials.
LC–HRMS/MS conditions
LC–HRMS/MS analysis was performed on a Dionex Ultimate 3000 capillary chromatography system coupled to a Q-Exactive Quadrupole-Orbitrap mass spectrometer (Thermo Fisher Scientific, Bremen, Germany) operated in the parallel reaction monitoring (PRM) mode. Ten microliters of sample were loaded onto the column. An Acclaim PepMap 300 C18 reverse phase column (150 mm × 0.3 mm; 5 μm, 300 Å; Thermo Fisher Scientific, Bremen, Germany) maintained at 35 °C, was used for chromatographic separation with a 6-μL min−1 flow rate. A 60-min gradient of mobile phase was delivered with LC–MS grade water containing 0.1% formic acid (phase A) and 80% ACN containing 0.1% formic acid (phase B). An isocratic step of 3 minutes at 4% of phase B was applied before increasing the gradient to 35% during the next 60 min. Then for the next 6 min, phase B was increased to 95%. Finally, the column was re-equilibrated for 21 min with 4% of phase B. Instrument parameters of the electrospray ionization source (ESI) were set as follows: sheath gas flow rate at 30 a.u., spray voltage at 2.6 kV, capillary temperature at 200 °C. Q-Exactive instrument was operated in positive ion mode under time-scheduled sequential PRM acquisition conditions. Precursor ions were selected in the quadrupole with an isolation mass window of 2 m/z. Precursors were fragmented in the HCD cell with nitrogen. The collision energy for each peptide is reported in Supplemental Table S2. Resolution was set to 35,000, automatic gain control to 1e6, and maximum injection time at 50 ms. Instrument control and data processing was done with Xcalibur 2.2 software (Thermo Fisher Scientific, Bremen, Germany).
Quantification by PRM acquisition
Selected peptides covering the N- to C-terminal sequence of tau (Supplemental Figure S1 and table S2) were targeted with a time-scheduled sequential PRM method. The signal of up to 6 major and non-interfered fragment ions at high resolution and mass accuracy (5 ppm) from a common peptide precursor were summed up to provide one extracted ion chromatogram (XIC) for each peptide. Isotope-labeled peptides counterparts incorporating 15N labeled amino acids were used for signal normalization and quantification. Fragments used for confirmation of each peptide are from Barthélémy et al (2019) 12 for unmodified tau peptides. For the 3 PTM representative peptides, fragments are listed in Supplemental Table S3. For specific quantification, we applied the following inclusion criteria (i) similar peak shape and retention time to 15N-tau peptides from internal standard (±0.05 min), (ii) detection of the most intense PRM transitions, and (iii) similar area ratio among transitions between endogenous and spiked 14N-tau for signals presenting with enough intensity (i.e. >103). Raw MS data were exported to Skyline 4.1301 to verify the transition ratio of unlabeled and labeled peptides. Xcalibur 2.2 software (Thermo Fisher Scientific, Bremen, Germany) was used for quantitative data analysis. Unlabeled/labeled peak area ratios were calculated for the different peptides and used for further calculation. An external calibration curve was made by spiking tau in 0.5% human serum, used as a CSF mimic, from 0.25 to 50 ng/mL, respectively. Linear regression with 1/x weighting was applied to generate a standard curve.
Statistical analysis
All statistical analyses were performed using R software (version 4.2.2) and Graphpad Prism software (version 5.04, GraphPad Software, Inc., La Jolla, CA). The significance of the difference between means was assessed by a Student's t-test (in case of 2 conditions) or by an analysis of variance followed by the Tukey's honest significance post-hoc test (for the comparison of 3 conditions). The significance threshold was set to 5%.
Results and discussion
SP3 was evaluated here for antibody-free tau protein extraction from 0.5% human serum, mimicking the CSF protein charge, 13 and from human brain tissue samples including the pathological proteoforms. We combined extraction of tau by SP3 with the precipitation of other sample proteins by perchloric acid (Prec-SP3)14,15 (Figure 1).
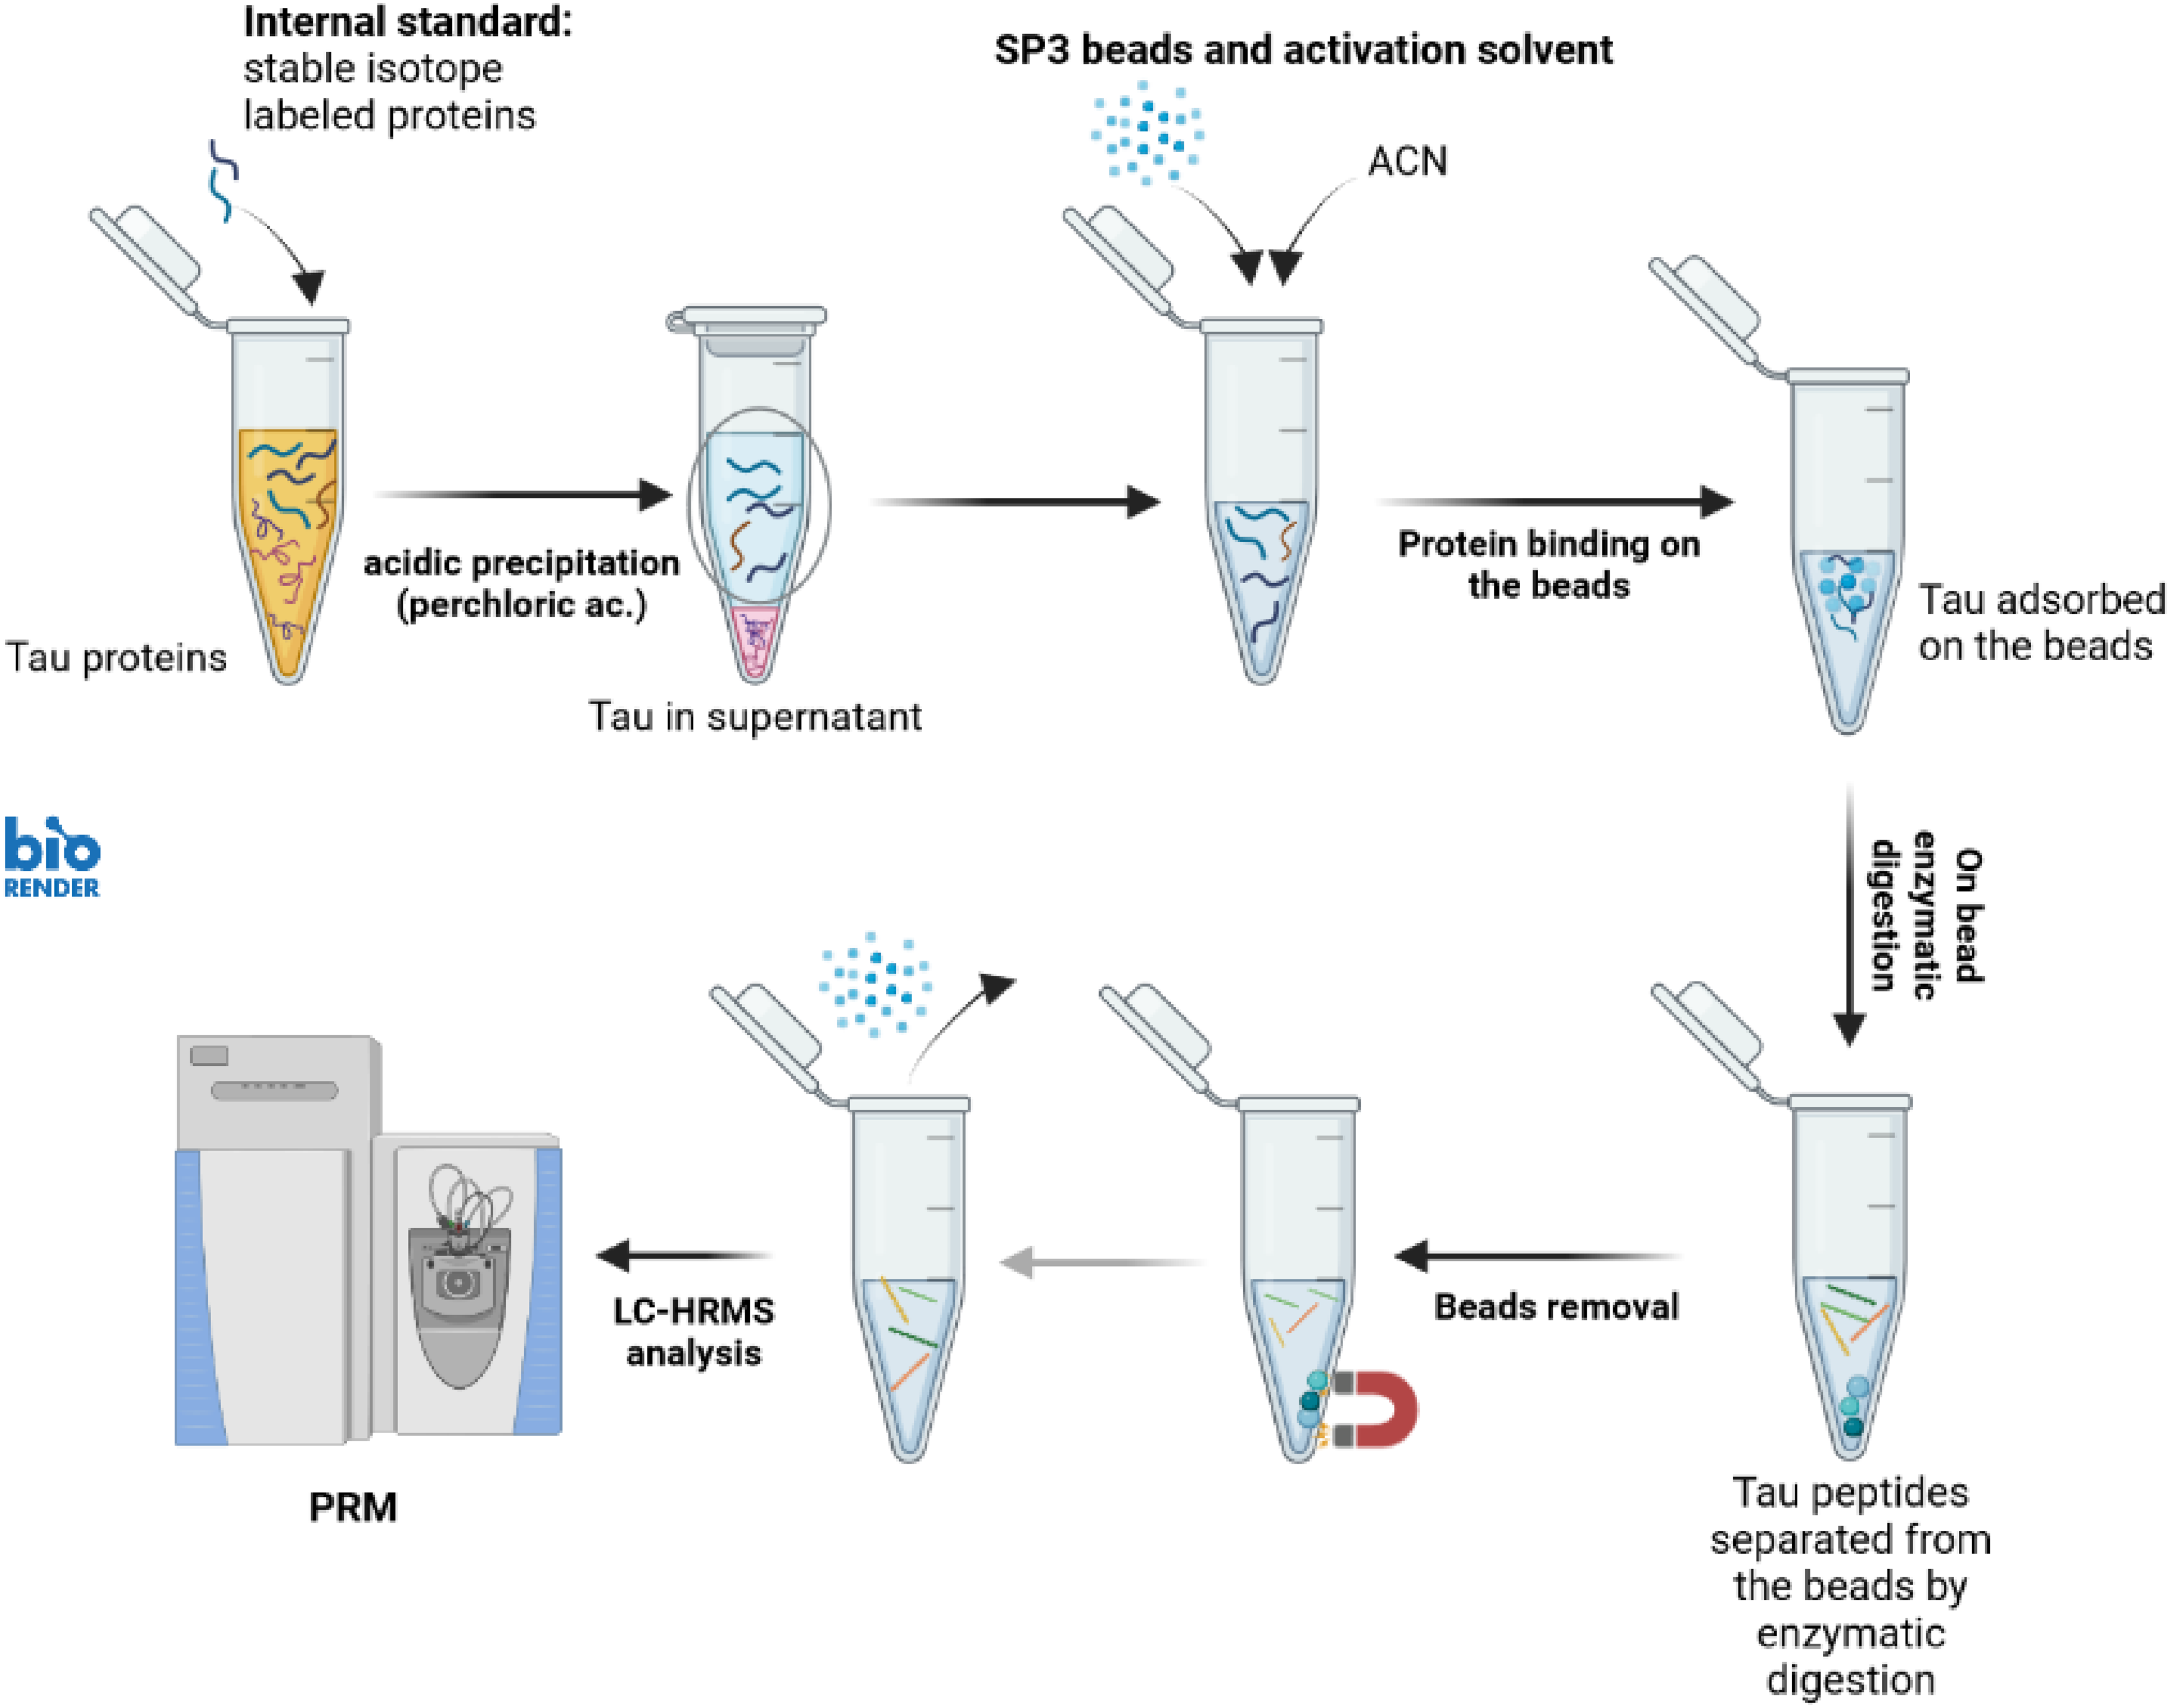
Final workflow for antibody-free extraction of tau protein from diluted serum and brain soluble fraction, by SP3 beads and acid precipitation (Prec-SP3). LC–ESI-MS/HRMS (PRM) acquisition.
Initial assessment of the Prec-SP3 antibody-free tau extraction
Based on previous work on tau detection by MS,14,15 we selected 13 peptides not containing methionine, having high ionization efficiency, and covering the N- to C-terminal sequence of non-modified tau, including isoform-specific peptides, for targeted detection in the PRM mode (Supplemental Figure S1A). The 13 peptide sequences contrast widely in length and polarity (Supplemental Figure S1B). The first results obtained when testing the SP3 conditions taken from Hughes et al. 16 showed low or no signal for many tau peptides, particularly among the most hydrophilic ones (50 ng/mL tau in 0.5% diluted serum; concentration higher than expected in CSF but more relevant for method optimizations) (Supplemental Figure S2). A similar experiment was conducted using our previous Prec-SPE 14 condition without SP3 and resulted in a well-detected signal for the 13 tau peptides, as reported in the same matrix (Supplemental Figure S2). 14 Optimization of the SP3 conditions was then initiated to improve signals of tau peptides for higher coverage of the tau sequence and better detection sensitivity. We focused on most critical conditions for tau binding to the beads, for example, incubation time or nature of the organic solvent and release of tau peptides from the beads16–18 (Supplemental Table S1). Overall, 7 different experimental conditions were evaluated for their ability to improve the recovery and detection sensitivity of targeted tau proteoforms. At first and considering the potential impact of the acidic supernatant containing 3.5% perchloric acid on tau binding to SP3,16–18 SP3 extraction was performed consecutively to µSPE clean-up during preliminary method development. 15
Optimization of the Prec-SP3 extraction for high sequence coverage of tau
We optimized the on-beads digestion conditions for efficient release of the peptides using recombinant 441-tau protein spiked in CSF mimic consisting of 0.5% human serum. During these optimizations, signal interference was also evaluated using experimental blank samples unspiked with the 14N tau protein. As a part of the optimization, we added Rapigest surfactant to improve tau protein digestion by trypsin and recovery of peptides from the beads. The on-beads digestion protocol was tested with or without Rapigest (conditions 3 and 4) and removal of the beads using a magnet before or after acidification to stop the digestion (conditions 1 and 2) (Supplemental Table S1). Adding Rapigest as protein denaturant improved the tau peptides’ signal by a mean (±SD) factor of 7.40 ± 7.35 (Figure 2(B)). Improvement in signal was found significant for 5 peptides (Student's t-test). This condition was therefore kept for the rest of the experiments
Optimization of the Prec-SP3 antibody-free extraction. Representative signals of 6 peptides, from hydrophilic to hydrophobic (determined from their respective elution times), are illustrated. Signal intensity is evaluated through peak areas; mean ± standard error of the mean (SEM) for n = 3. Legend and commentaries: *p < 0.05.
Regarding the binding of tau protein to the SP3 beads, significant gains were obtained by increasing incubation time and changing the nature of the organic solvent (i.e. replacing EtOH by ACN). In protocol 2, the incubation time was set at 5 min, as used in Hughes et al.
16
Longer incubation times were tested with 15 min (condition 4) and 1 h (condition 5). A slight increase in signal intensities was obtained for all peptides in condition 5 (mean gain factor 1.60 ± 0.98 for condition 5 compared to condition 2), probably favoring tau recovery (Figure 2(C)). The gain in signal allowed by condition 5 was found significant for 3 peptides. Our results for the tau protein differ from Moggridge et al.,
17
where the authors did not observe any significant differences between the different incubation times tested. More recently, ACN was proposed to replace EtOH to bind the proteins to the beads and for beads washing.
18
In our case, ACN strongly increased the signal of the most hydrophilic peptides by a factor of around 2 (condition 6) and was selected in the final conditions. The overall peptides gain factor was 1.3, with a similar or slightly lower signal for hydrophobic peptides (Figure 2(D))
In a second step, the binding of tau to SP3 was done directly from the acidic supernatant after perchloric acid precipitation using the optimized conditions (condition 7), that is, by removing the µSPE step. We observed a significant increase in signal for 4 peptides, and a significant but acceptable decrease for the more hydrophobic peptide TPSLPTPPTR (Figure 3). No significant difference was observed for the other peptides. Globally, the acidic nature of the supernatant from the precipitation step seemed had no deleterious impact on the SP3 process, in contrast to what has been reported previously.16–18 For all these reasons, the µSPE clean-up was removed from the final protocol, resulting in an important gain in experimentation time.
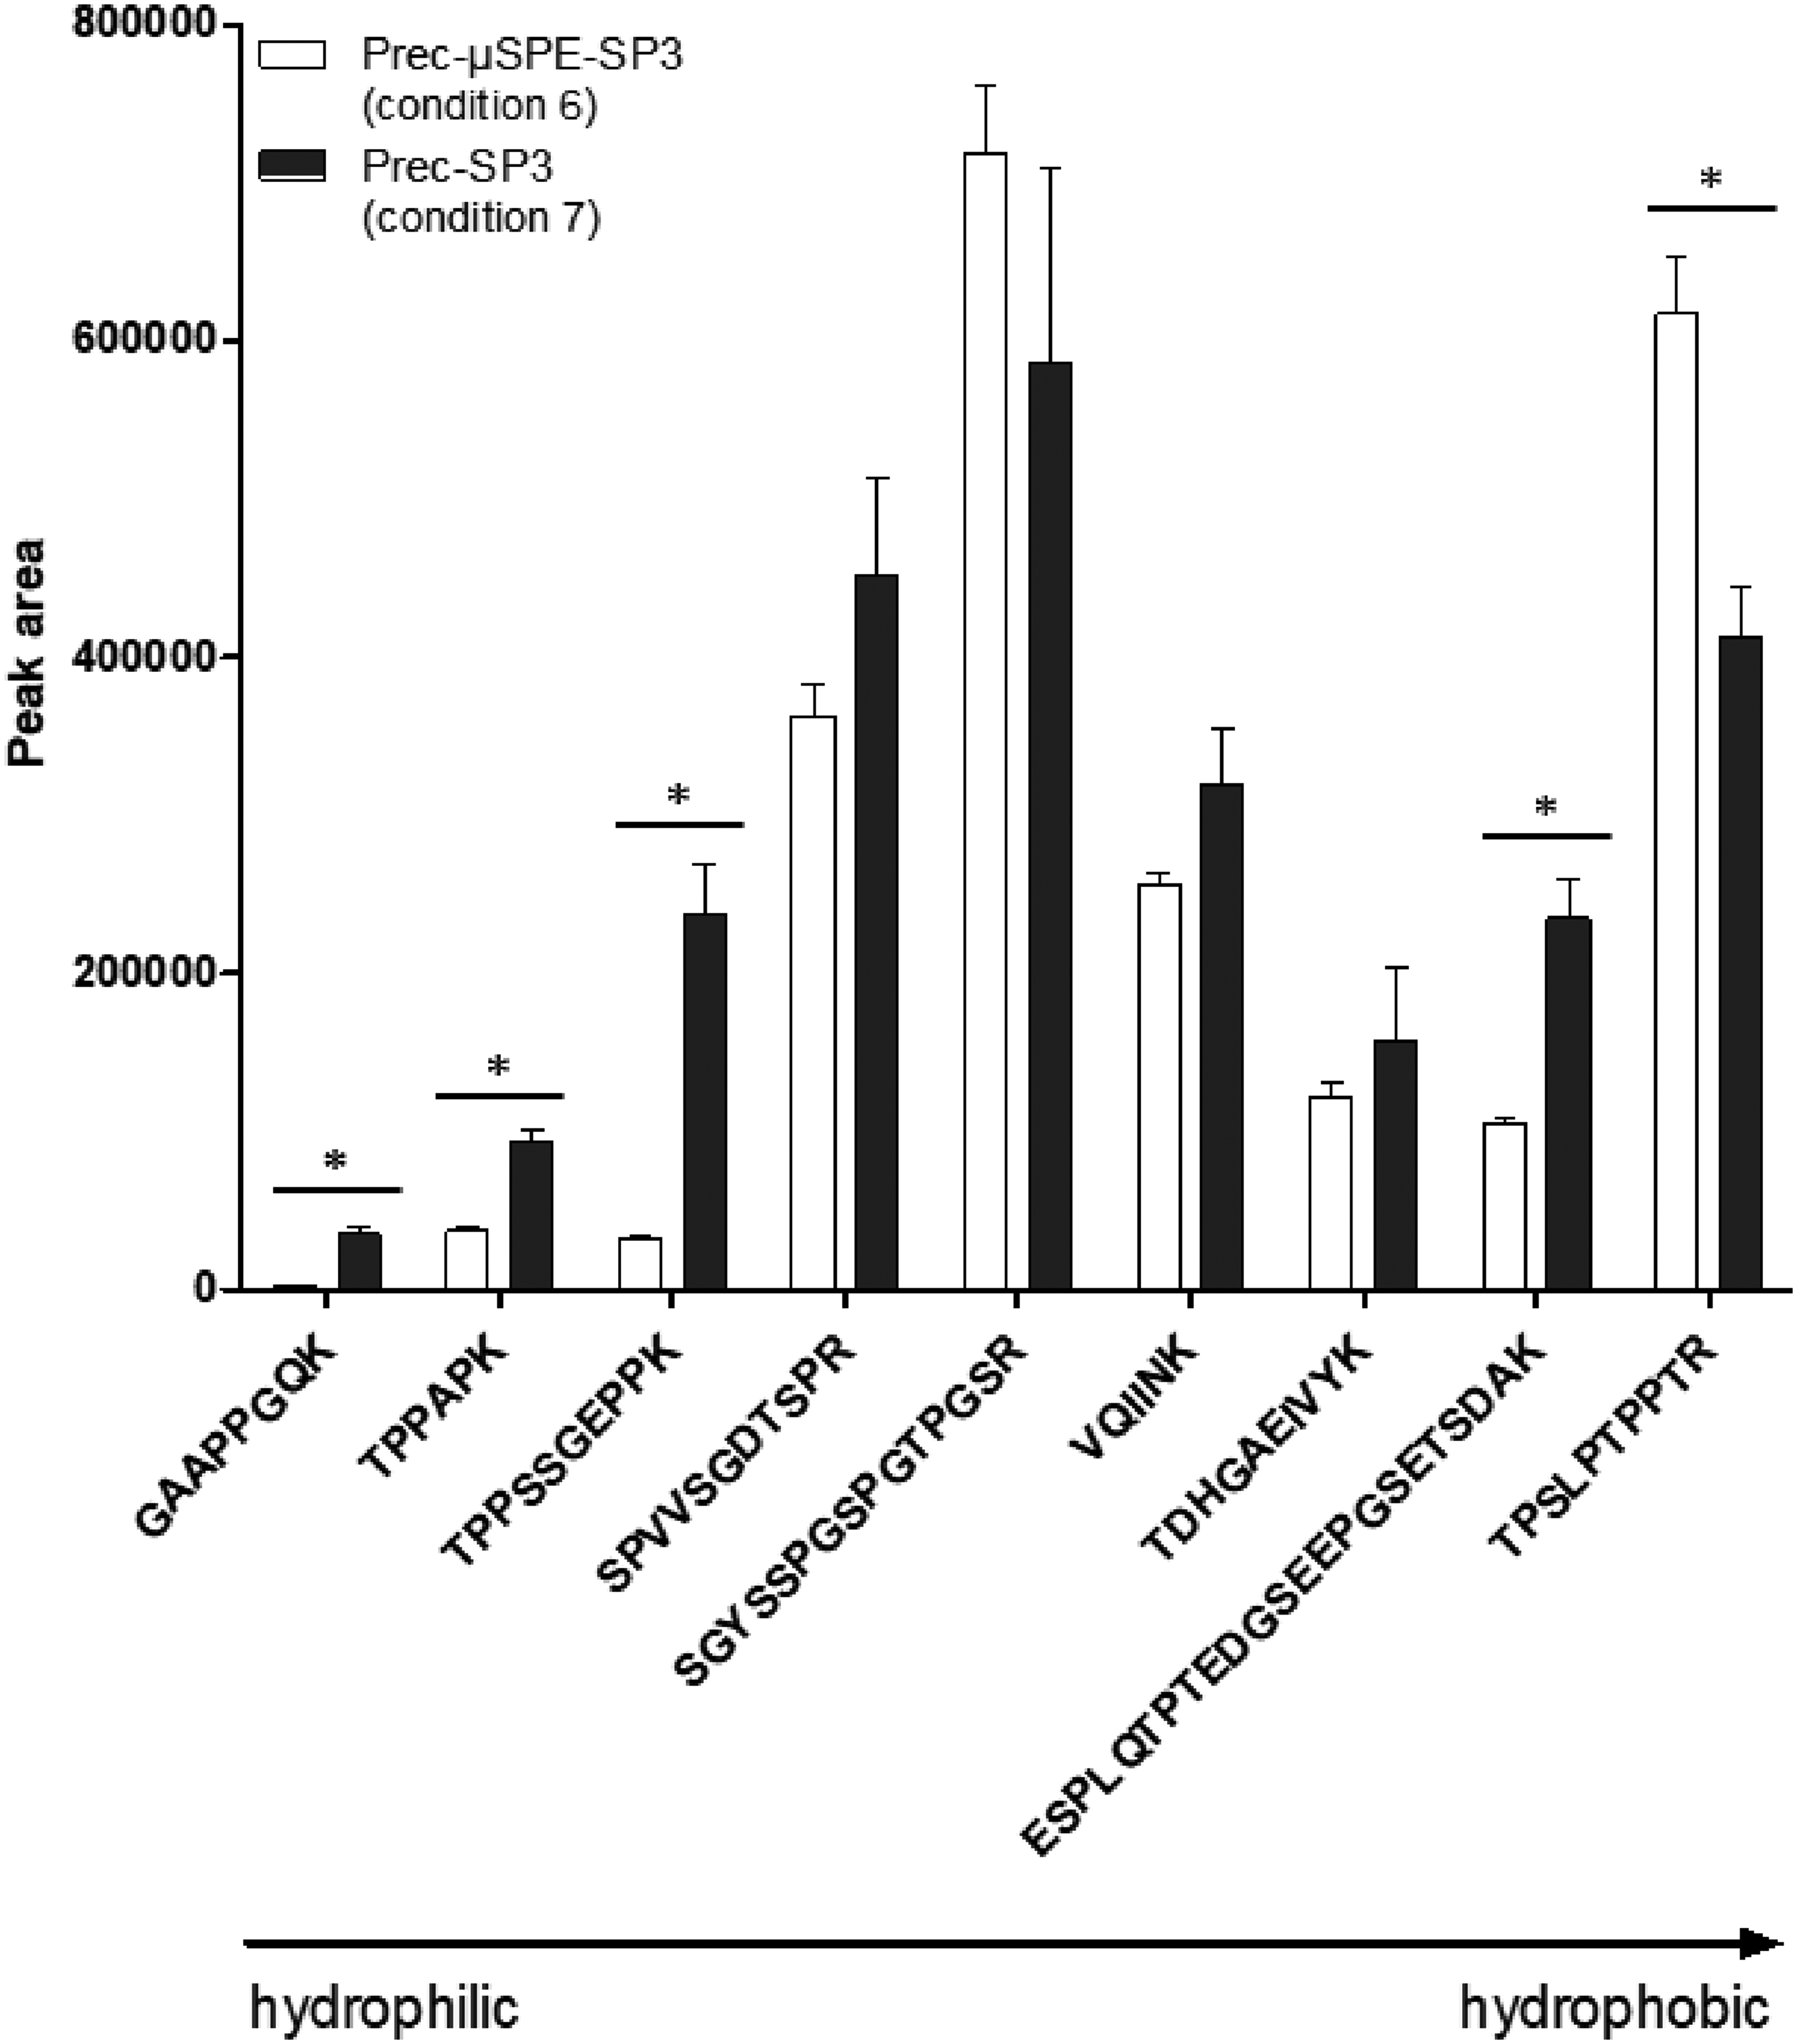
Comparing Prec-SP3 with and without µSPE (conditions 6 and 7, respectively). Nine representative peptides are ranked according to their elution times, i.e. from the least to the most hydrophobic ones; signal intensity is evaluated through peak areas; mean signal ± standard error of the mean (SEM) for n = 3. Legend and commentaries: Comparison of Prec-µSPE-SP3 (condition 6) with Prec-SP3 free of any µSPE step before SP3 processing (condition 7).
Comparison between initial and optimized Prec-SP3 extractions in CSF mimic
Finally, the initial 16 and the optimized Prec-SP3 conditions were compared regarding the 13 tau peptides’ signals (Figure 4) to better evaluate protocol improvements. The gain in signal ranged from 1 to 630, with a median value of 22.7 (Figure 4). The results also confirmed an important signal increase for the most polar peptides following optimization of the SP3 conditions. Indeed, polar peptides were almost lost in the initial conditions. Tau recovery in these conditions was determined using each peptide, by spiking 1 ng of tau recombinant protein in diluted serum (0.5%), before (B) or after (A) performing SP3 (triplicates). The recovery corresponds to the A/B ratio using the mean signal obtained for each peptide, and was found between 31% and 67% (Figure 4 and Supplemental Table S2).
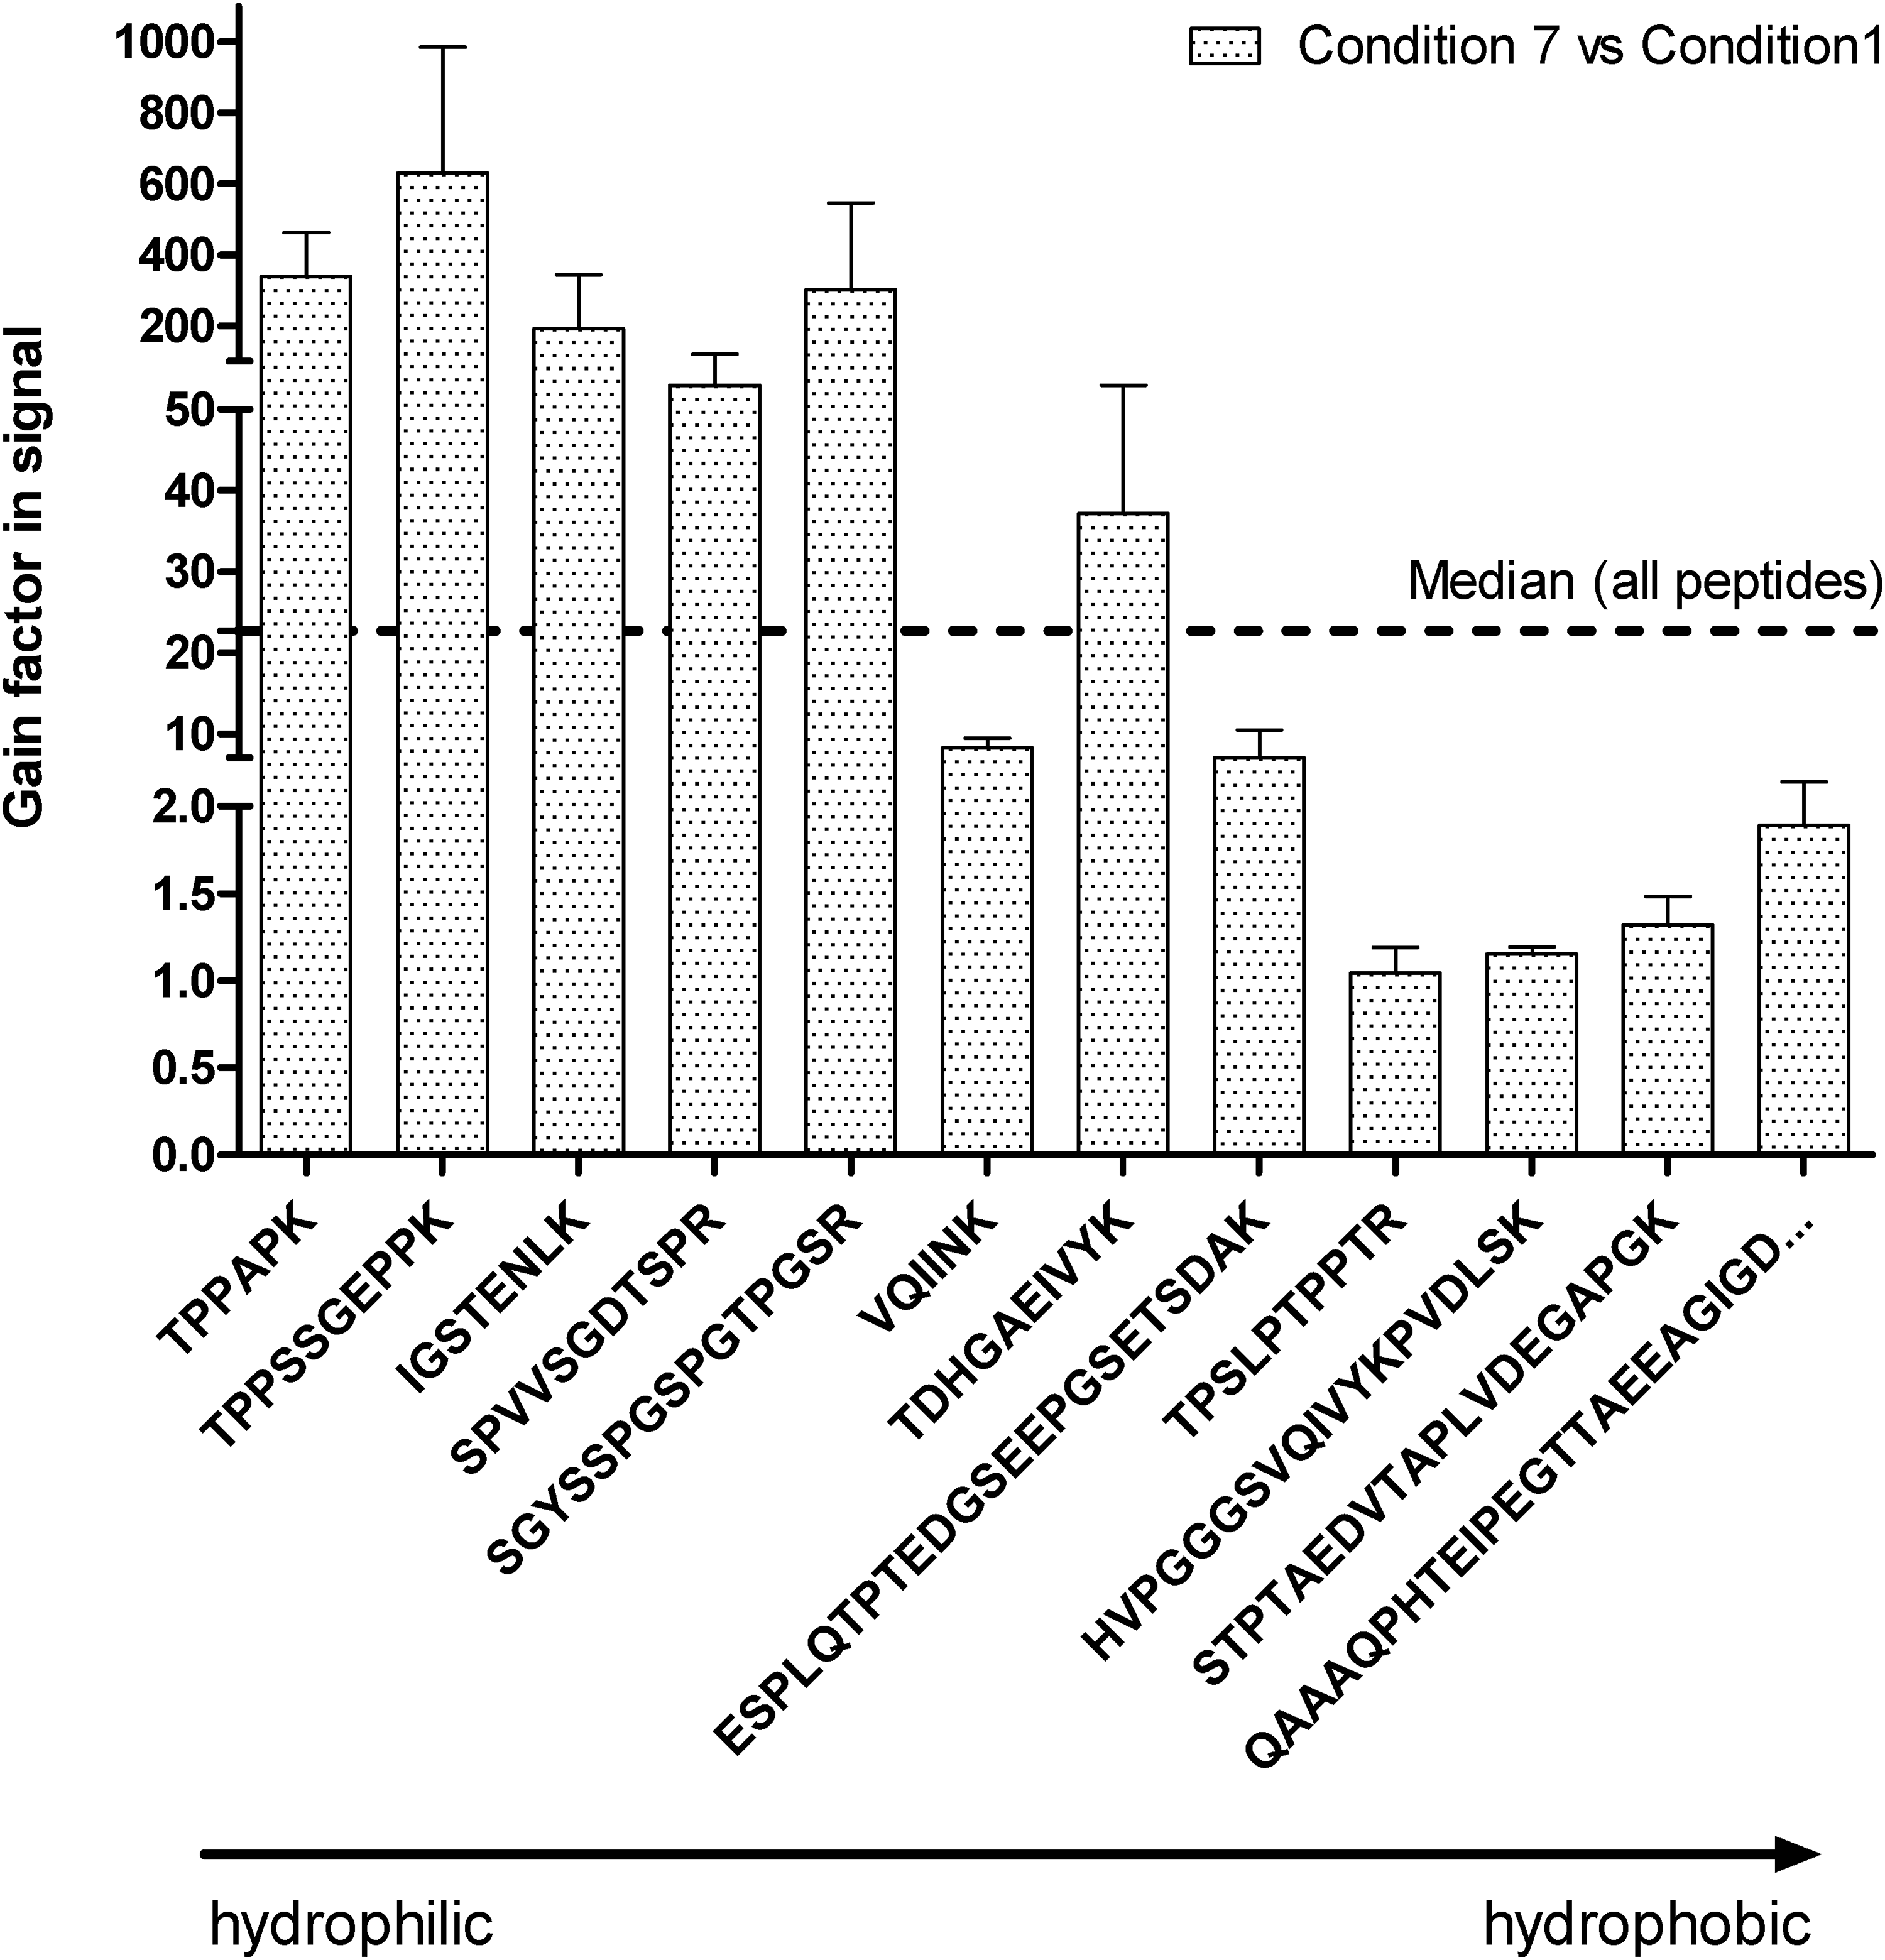
Gain obtained for each tau peptide with the optimized SP3 protocol (condition 7) compared to the initial conditions (condition 1), calculated by the ratio of the mean signal condition 7 on the mean signal condition 1 (n = 3). Standard error of the mean (SEM) is also featured. Peptides are ranked according to their elution times, i.e. from the least to the most hydrophobic ones. Peptide GAAPPGQK was removed from the graph and calculations, as no signal was observed in condition 1. For this particular evaluation, the median for all gains among the searched peptides is represented by a discontinuous line on the graph and was of a factor 23.
Evaluation of the optimized Prec-SP3 extractions in CSF mimic
The optimized Prec-SP3 protocol was further evaluated considering linearity and limits of detection (LODs) in CSF mimic (Figure 5; Supplemental Table S2). The LODs were determined with the last detected concentration point (at least 2 MS/MS transitions) on a calibration range from 0.25 to 50 ng/mL. For most tau peptides, linear correlations were observed in optimized conditions between tau peptide concentration and MS signal (peak area ratios with labeled peptides), as shown in Figure 5 for some representative peptides. A loss of signal was observed at lower concentrations for some more hydrophobic peptides, for instance, QAAAQPHTEIPEGTTAEEAGIGDTPSLEDEAAGHVTQAR (Figure 5), resulting in LODs between 0.75 and 10 ng/mL depending on the peptide (Supplemental Table S2).
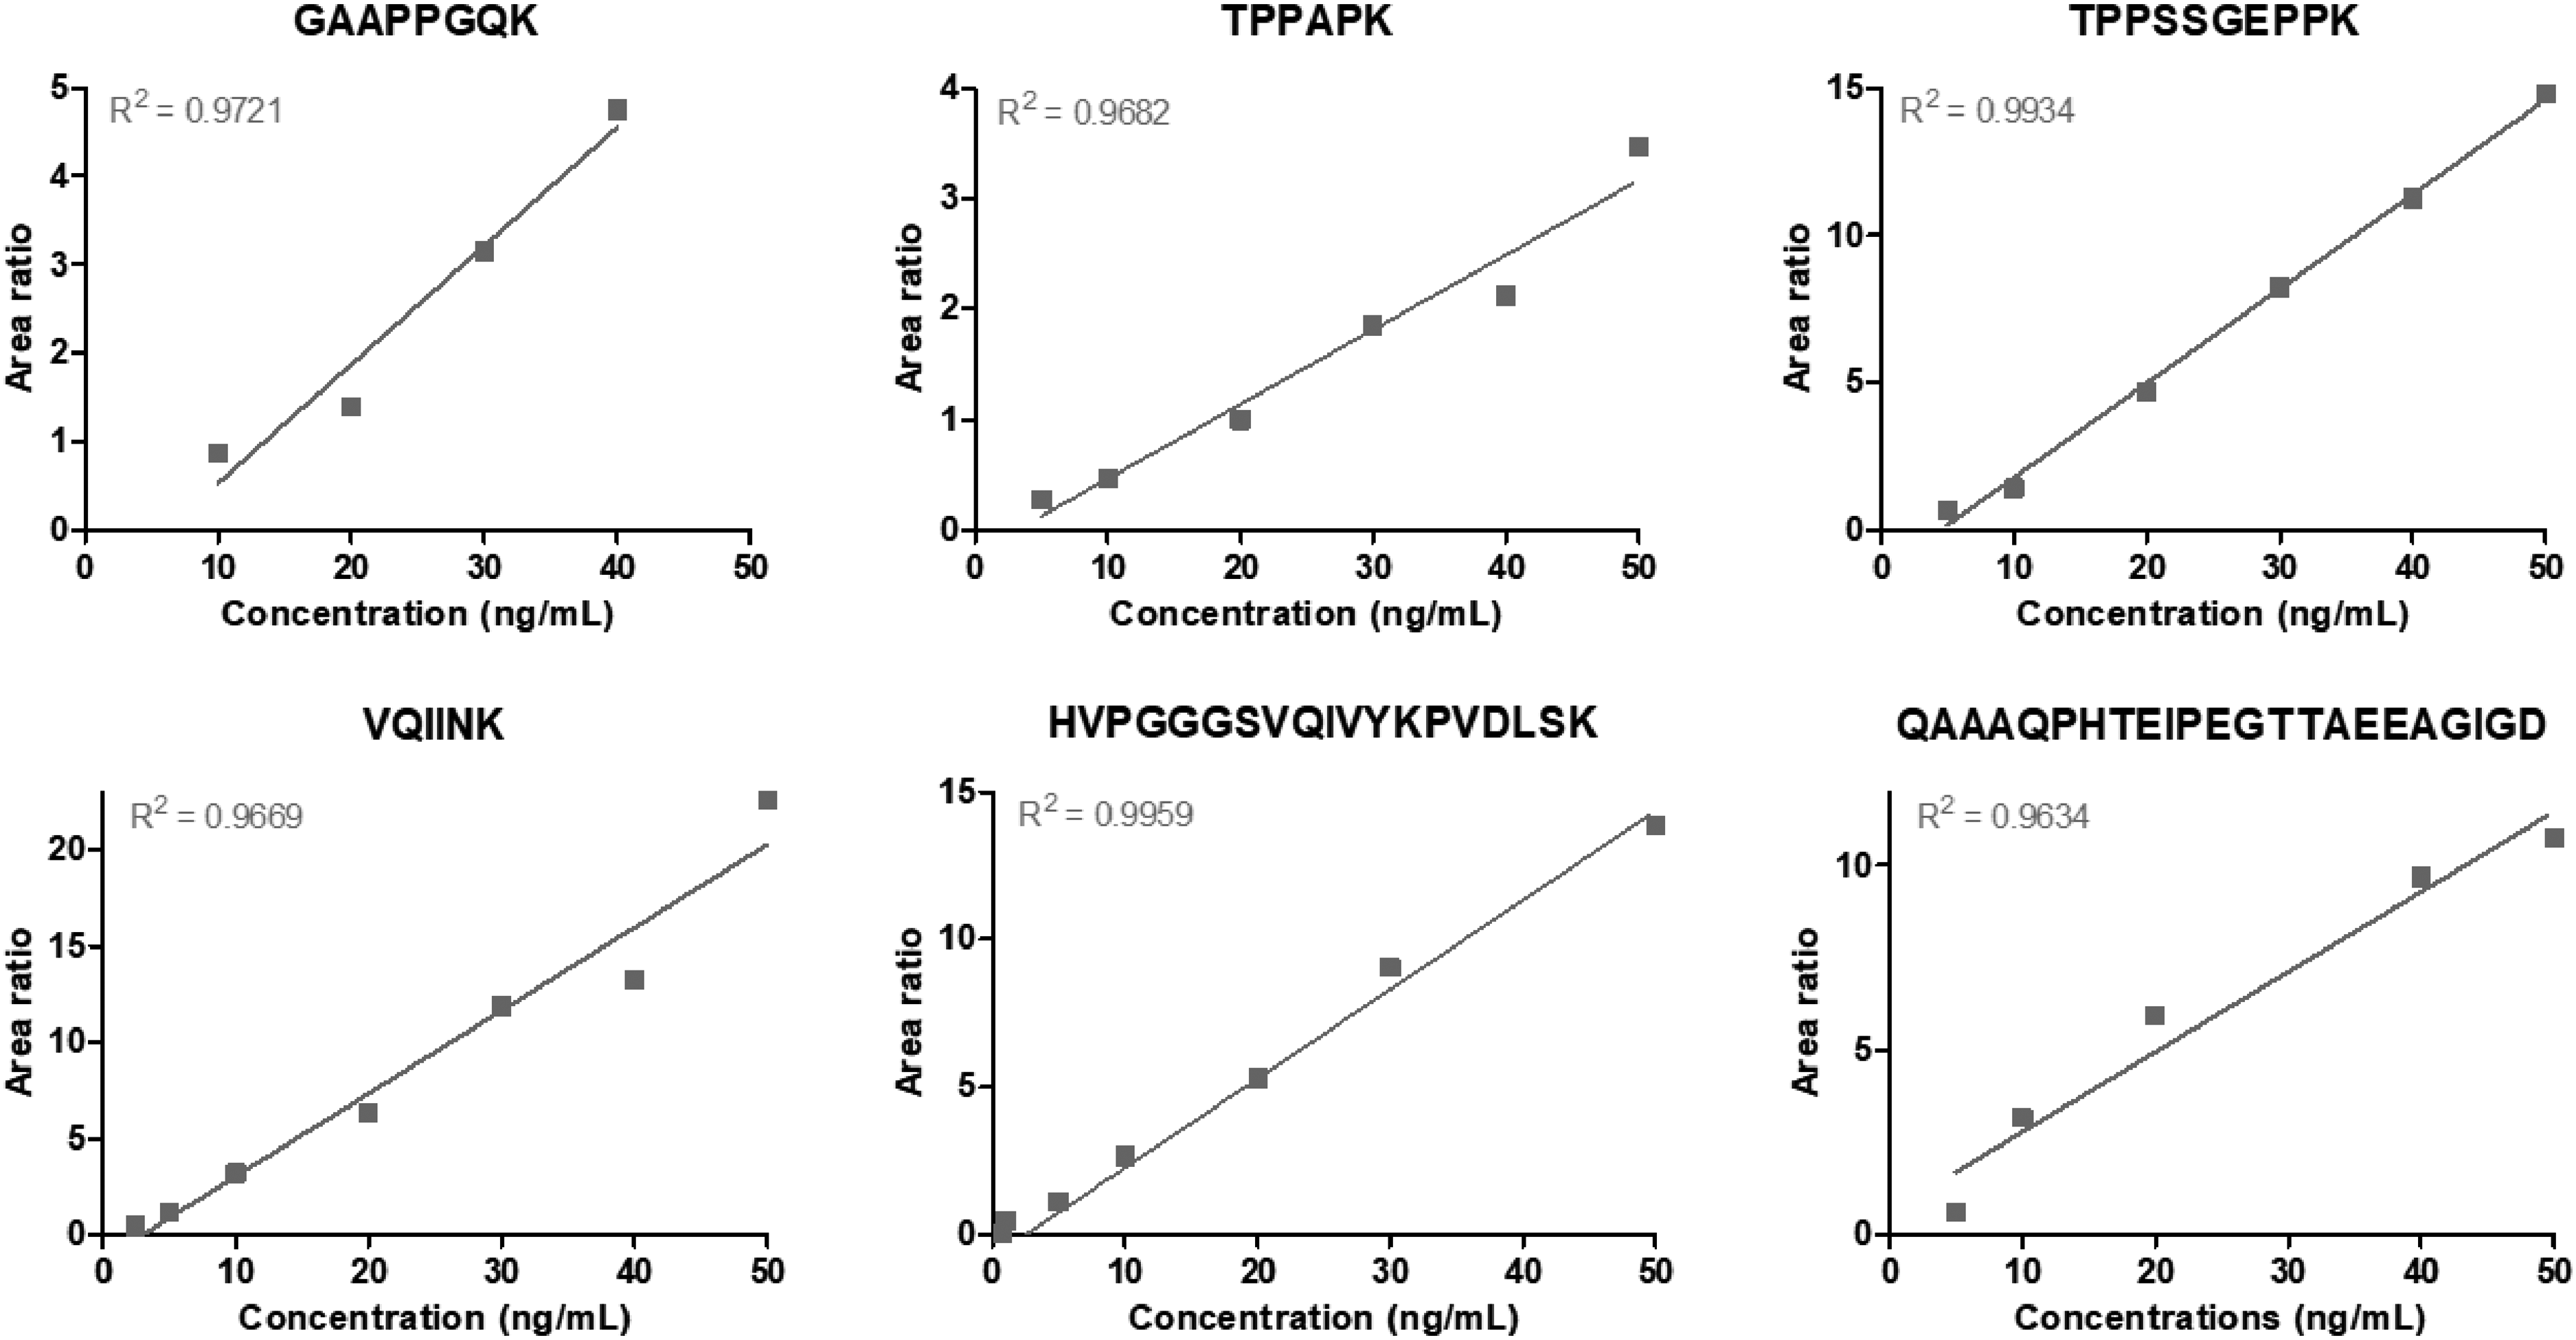
Calibration curves obtained with representative tau peptides in the optimized Prec-SP3 antibody-free extraction conditions (condition 7) in CSF mimic. Peptide concentration is given in ng/mL. Good linearity is observed for most peptides, allowing tau quantification.
The newly established method was also evaluated in terms of repeatability. To this end, quality control samples were spiked with tau at 50 ng/mL in diluted serum (n = 3). Almost all peptides presented with CVs below 30%, showing acceptable repeatability of the protocol. CV% was clearly above 30% for peptide GAAPPGQK, but this peptide eluted early in our LC system, near the dead volume of the LC system (Rt = 6.3 min) and was probably impacted by ion suppression (Supplemental Table S2). The linearity and repeatability of the optimized Prec-SP3 conditions thus enabled the quantification of tau in 0.5% human serum. Automating the SP3 protocol on a robot, for instance on a KingFisher robot often used for IP with magnetic beads, could improve the robustness further. In summary, the optimizations made to the SP3 protocol improved tau peptides’ signal, with a median gain in the signal of 23 compared to the initial conditions, and markedly improved tau sequence coverage thanks to the better detection of the more hydrophilic peptides (Figure 4).
Evaluation of the optimized Prec-SP3 extraction on AD's brain tissue
Considering the numerous sequence modifications of tau reported in biological fluids and brain, including phosphorylations and truncations at both N- and C-termini,14,19 evaluation of the sample-preparation protocol on endogenous tau is necessary. We thus applied the protocol to the soluble protein fraction from one AD brain tissue (middle frontal gyrus: MFG). This sample was diluted 100-fold with 0.5% human serum to match the matrix evaluated during the optimizations. Brain tau was extracted with the Prec-SP3 protocol before MS quantification of tau peptides. All targeted peptides were quantified separately to get information on the brain tau protein structure, which can be modified by truncations resulting in different peptides abundance. 19
All 13 targeted tau peptides ranging from N- to C-terminus were detected in the soluble brain fraction following Prec-SP3. Tau protein structure is divided into a glycine-rich N-terminal region, a proline-rich region, a microtubule binding region (MTBR, comprising the 3R and 4R domains) and a C-terminal region. 20 Quantification based on each tau peptide revealed that peptides from the central domain (from position 156 to 221) were globally more abundant than 1N-, 2N- isoforms (from position 45 to 126), MTBR-4R isoform (from position 275 to 317) and C-ter (from position 317 to 406) peptides (Figure 6). The higher abundance of the central peptides and the truncated C-terminus was reported previously, 19 resulting in a similar tau peptide abundance profile as we determined here by Prec-SP3.
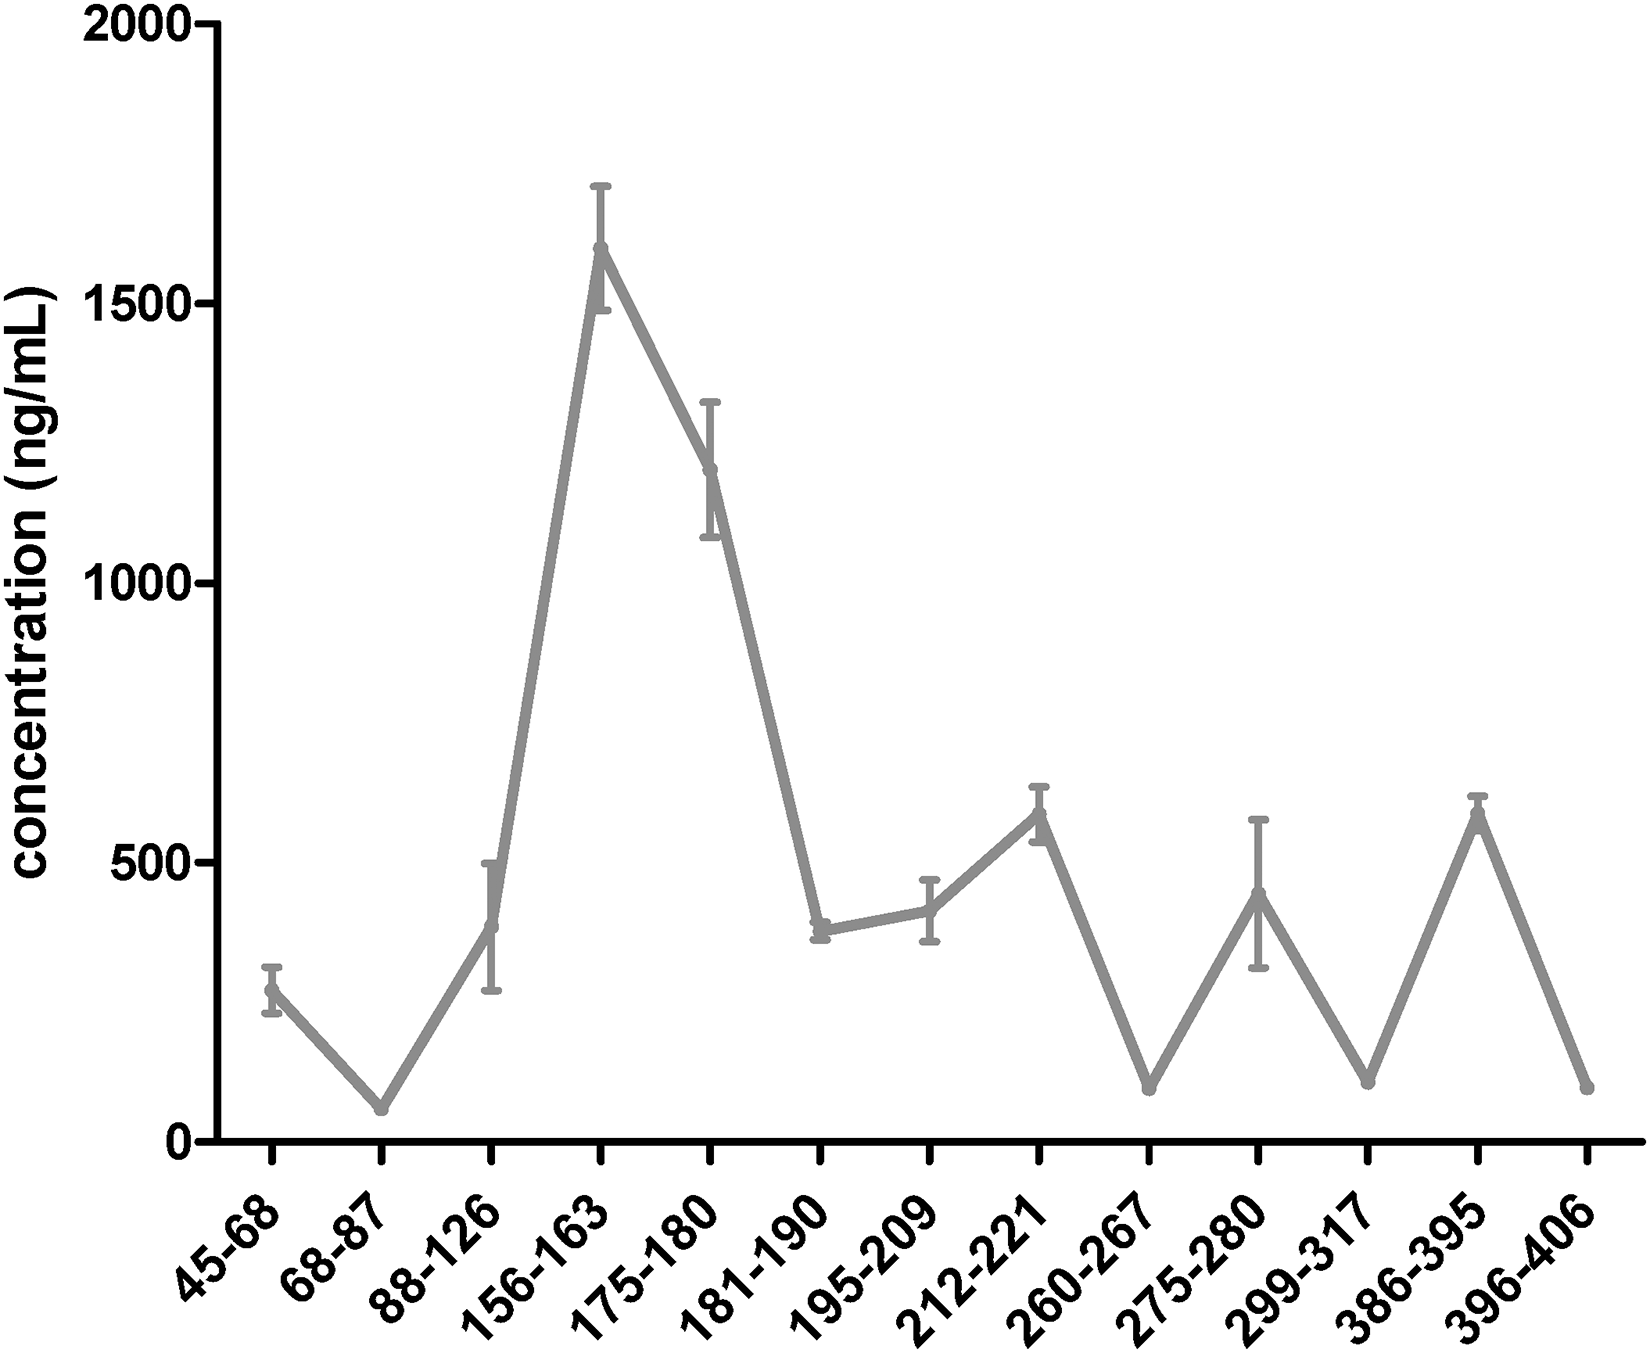
Peptides are in sequence order. For the corresponding amino acid sequence to the position on the protein, see Supplemental Table S2. Tau concentration, using each targeted peptides, determined by Prec-SP3 antibody-free extraction in a diluted (100 fold) brain tissue sample (soluble fraction) (n = 3). The signal of the labeled peptide was not used for tau quantification with peptides STPTAEDVTAPLVDEGAPGK (68–87), TPPSSGEPPK (181–190), SGYSSPGSPGTPGSR (195–209), TPSLPTPPTR (212–221) and IGSTENLK (260–267).
Additionally, two critical endogenous PTMs of tau (pTau 217, pTau 181) and the 3R-isoform-specific peptide were screened and identified in the brain soluble fractions (Figure 7, Supplemental Table S3). Absolute quantification of the phosphorylated species was achieved by spiking AQUA standards. pTau217 was quantified at 0.116 fmol/µL with Prec-SP3 while pTau181 was quantified at 7.88 fmol/µL. The higher abundance of pTau181 over pTau217 corroborates previous measurements in the human brain. 15 Globally, our results illustrate the ability of the Prec-SP3 protocol to detect and measure diverse tau peptides representative of total tau, tau isoform or phospho-tau.
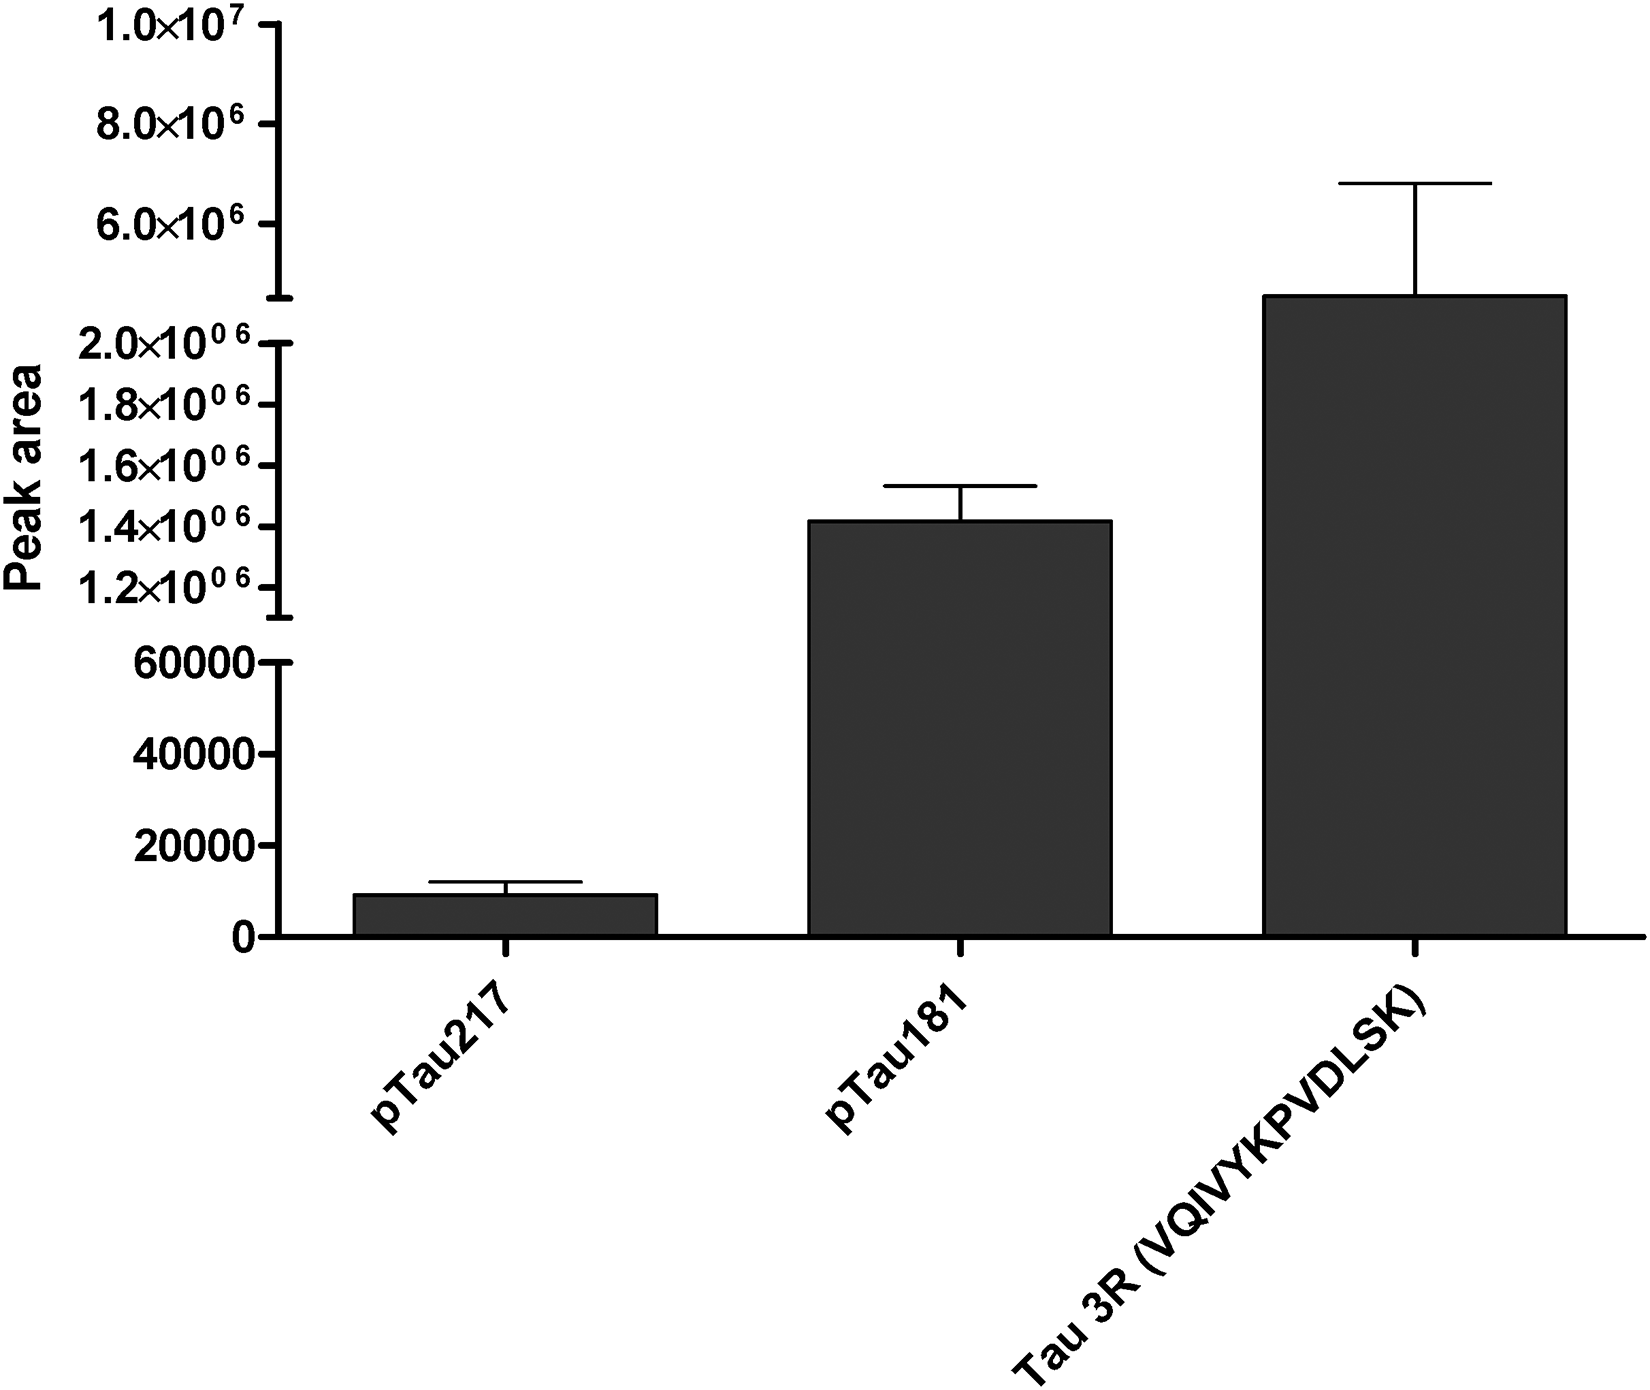
Mean signals for pTau 217, pTau 181 and 3R specific peptides, detected in the brain samples by Prec-SP3 ± standard error of the mean (SEM) for n = 3. pTau217 was quantified at 0.116 fmol/µL (Prec-SP3), and pTau181 was quantified at 7.88 fmol/µL (Prec-SP3). The 3R specific peptide could not be quantified.
Conclusion
We adapted and evaluated an antibody-free protocol based on SP3 beads for straightforward tau quantification by MS. Optimization made to the SP3 protocol (e.g. acetonitrile for tau binding, addition of Rapigest for improved digestion efficiency) improved the overall signal of tau peptides and the coverage of the tau sequence through the detection of polar peptides when tested on a 441-tau recombinant protein diluted in CSF mimic. The optimized Prec-SP3 protocol proved efficient for quantifying a diversity of peptides in AD brain tissue, from total tau, tau isoforms, and even low abundance phosphorylated species. As a perspective, further evaluation of the Prec-SP3 protocol in diverse biological samples would be needed to confirm its relevance for the deep characterization of tau PTMs in plasma, CSF or brain tissue. Gain in sensitivity would be necessary to compete with immuno-enrichment protocols for quantification of phosphorylated tau from plasma or CSF, for instance through nano-liquid chromatography or additional fractionation protocols. This antibody-free protocol might in turn offer the possibility to discover new tau biomarkers for AD and non-AD tauopathies.
Supplemental Material
sj-docx-1-ems-10.1177_14690667231218912 - Supplemental material for Evaluation of SP3 for antibody-free quantification of tau in CSF mimic and brain by mass spectrometry
Supplemental material, sj-docx-1-ems-10.1177_14690667231218912 for Evaluation of SP3 for antibody-free quantification of tau in CSF mimic and brain by mass spectrometry by Chloé Jacquemin, Nicolas Villain, Rita Azevedo, Susana Boluda, Etienne A. Thévenot, François Fenaille, Foudil Lamari and François Becher in European Journal of Mass Spectrometry
Footnotes
Author contributions
Brain soluble fractions were extracted by AR, SP3 experiments and validation were done by JC. The first draft of this article was written by JC and BF. LF, FF, BS, AR, VN, TE and BF reviewed the manuscript and contributed to its correction and validation. Statistical analysis on R software was done by TE.
Declaration of conflicting interest
The authors declared no potential conflicts of interest with respect to the research, authorship, and/or publication of this article.
Ethical statement
All subjects gave their informed consent for postmortem donation.
Funding
The authors disclosed receipt of the following financial support for the research, authorship, and/or publication of this article: The authors thank the Fondation-Recherche Alzheimer (Mass-Spec-ND) for funding the research. They thank the donors and the Brain Donation Program of the Brainbank. Neuro-CEB Neuropathology Network for providing the brain samples used in this study.
Supplemental Material
Supplemental material for this article is available online.
Abbreviations
References
Supplementary Material
Please find the following supplemental material available below.
For Open Access articles published under a Creative Commons License, all supplemental material carries the same license as the article it is associated with.
For non-Open Access articles published, all supplemental material carries a non-exclusive license, and permission requests for re-use of supplemental material or any part of supplemental material shall be sent directly to the copyright owner as specified in the copyright notice associated with the article.