
Abstract
Accurate thermal decomposition mechanism and kinetic parameters are helpful to analyze the combustion process of flexible polyurethane foam. The thermal decomposition process of flexible polyurethane foam products (amine derivatives) was ignored in the past. Three thermal decomposition mechanisms of flexible polyurethane foam were proposed according to the thermogravimetry experiment of flexible polyurethane foam in the nitrogen atmosphere, two of which included the thermal decomposition of amine derivatives. The global search algorithm was proposed to estimate the kinetic parameters of the thermal decomposition of solid material. The results show that the global search algorithm is efficient and accurate in estimating kinetic parameters. The results also show the thermal decomposition mechanism including the carbodiimide and polycarbondiimide can well describe the thermal decomposition process of flexible polyurethane foam and amine derivatives. The activation energy, pre-exponential factor, and reaction order of flexible polyurethane foam are 187.3 kJ mol−1, 1015.6 s−1, and 1.22, respectively.
Keywords
Introduction
Flexible polyurethane foam (FPUF) is a polymer synthesized from polyols, isocyanates, and so on. 1 It has the advantages of low density, aging resistance, easy molding, and good elasticity, so it is widely used in furniture products. It is flammable and produces toxic smoke when burning, which is not conducive to fire safety. 2 The high flammability of these FPUF furniture products was deemed to be the main reason for the increase in fire deaths over the past 20 years. 3 Therefore, it is very important to study the thermal decomposition behavior of FPUF.
The thermal decomposition process of fuel in an inert atmosphere reflects the thermal decomposition process of fuel during flaming combustion. Over the past 60 years, the thermal decomposition mechanisms of FPUF in the inert atmosphere have been investigated. The results show that FPUF was a complex multi-step thermal decomposition process in an inert atmosphere.1–17 It is generally believed that most of the isocyanates produced in the process of FPUF decomposition are either volatilized or converted into amine derivatives and then volatilized. Therefore, the thermal decomposition of FPUF is simplified as a two-step continuous thermal decomposition mechanism. The first step is the decomposition of the urethane bonds to release and volatilize isocyanates and amines containing R-N=C=O functional groups, leaving behind polyols in the condensed phase. The second step is the volatilization and decomposition of the polyols, leaving behind solid residues.3,4,10
However, some research show that there are amine derivatives in the condensed products formed by thermal decomposition of FPUF. Rogers and Ohlemiller 11 studied the thermal decomposition residue of FPUF at about 207°C, and the results showed that some isocyanates were retained in the condensed phase by the form of carbodiimide (CD). Chambers et al. 17 believed that CD remained in the condensed phase would eventually polymerize into the polycarbondiimide (PCD) which was decomposed at about 600°C. Bilbao et al. 16 reported that the isocyanate formed by thermal decomposition of FPUF may form CD in the condensed phase. CD was decomposed and evaporated at about 320°C. Ravey and Pearce 12 analyzed the solid residue of thermal decomposition of FPUF at about 340°C. They found that the nitrogen content in the solid residue was higher than the original FPUF. Chun et al. 13 and Guo et al. 14 also confirmed that the isocyanates trapped in the condensed phase were irreversibly converted into amine derivatives. In previous work, it was also found that about 20% of isocyanates formed by thermal decomposition of FPUF remained in the condensed phase. 18
As amine derivatives are nitrogen-containing materials, they directly affect the production of hydrogen cyanide in the fire. 15 The thermal decomposition mechanism and kinetic parameters of amine derivatives formed by thermal decomposition of FPUF are not clear. Accurate kinetic parameters are the precondition for the reliability of fire numerical simulation of FPUF, so it is necessary to obtain the thermal decomposition mechanism and kinetic parameters of amine derivatives during the thermal decomposition of FPUF.
Experimentally, thermogravimetry (TG) is the most widely used technique for estimating the mechanism and the corresponding kinetic parameters of the thermal decomposition. The thermal decomposition kinetic parameters of solid materials are estimated by appropriate calculation methods. There are two kinds of calculation methods for kinetic parameters of thermal decomposition of solid materials. 19 One is the isoconversional method, such as the Kissinger–Akahira–Sunose method, 20 the Flynn–Wall–Ozawa method, 21 and the Friedman method. 22 This kind of method cannot calculate all kinetic parameters at the same time and is not suitable for the calculation of complex multi-step reactions of kinetic parameters. 6 The other is the model-fitting method. It can identify complex multi-step reaction models and systematically calculate kinetic parameters. 19 There are two main methods of model fitting. 23 One is the direct method which is suitable for a single-step reaction. The other is the global optimization algorithm, such as the genetic algorithm (GA), the particle swarm algorithm (PSO), the global search algorithm (GS), and so on, which are suitable for a multi-step reaction.
GA is a common algorithm to solve the kinetic parameters. Not only the kinetic parameters but also the stoichiometric parameters can be calculated by the GA method. GA appears to be particularly well adapted to the difficult problems of optimization on strongly non-linear and very unstable models. 23 However, its convergence speed is slow and the results are random because of the natural selection principle of GA.1,24,25 Therefore, some researchers proposed other methods to improve the accuracy and efficiency of GA. For example, the Kissinger’s method was used to quickly find the possible values of the kinetic parameters to reduce the search range of GA, 24 or the hybrid function was combined with GA to improve the calculation accuracy and efficiency, 25 or PSO was used to replace GA for thermal decomposition research.26,27 Although these methods effectively improve the accuracy and speed of solving the kinetic parameters, it still takes a long time to converge when the amount of data is larger or the thermal decomposition process is more complicated.
GS is a highly efficient optimization algorithm,28,29 which can efficiently find a global minimum on a single-core processor. 30 Moazami et al. 31 predicted the kinetic parameters of the cobalt-silica catalyst by GS, and the results showed that the predicted values of GS were agreed well with the experimental values. But GS needs to determine the initial value of the calculation parameters in advance. Blind selection of the initial value of the calculation parameters will lead to a large deviation in the calculation accuracy. Fortunately, Kissinger’s method can quickly provide the initial value for GS to solve the accurate kinetic parameters of thermal decomposition.20,24 At present, the feasibility and reliability of the GS to estimate the kinetic parameters of thermal decomposition of FPUF have not been studied.
Therefore, there are three purposes for this study. (1) The efficiency and accuracy of the GS are verified. (2) The thermal decomposition mechanism of commercial FPUF in the nitrogen atmosphere is estimated by the TG experiment. This thermal decomposition mechanism includes the thermal decomposition process of amine derivatives. (3) The kinetic parameters of each thermal decomposition reaction of commercial FPUF in nitrogen are calculated by the GS.
Experiment and method
Experimental work
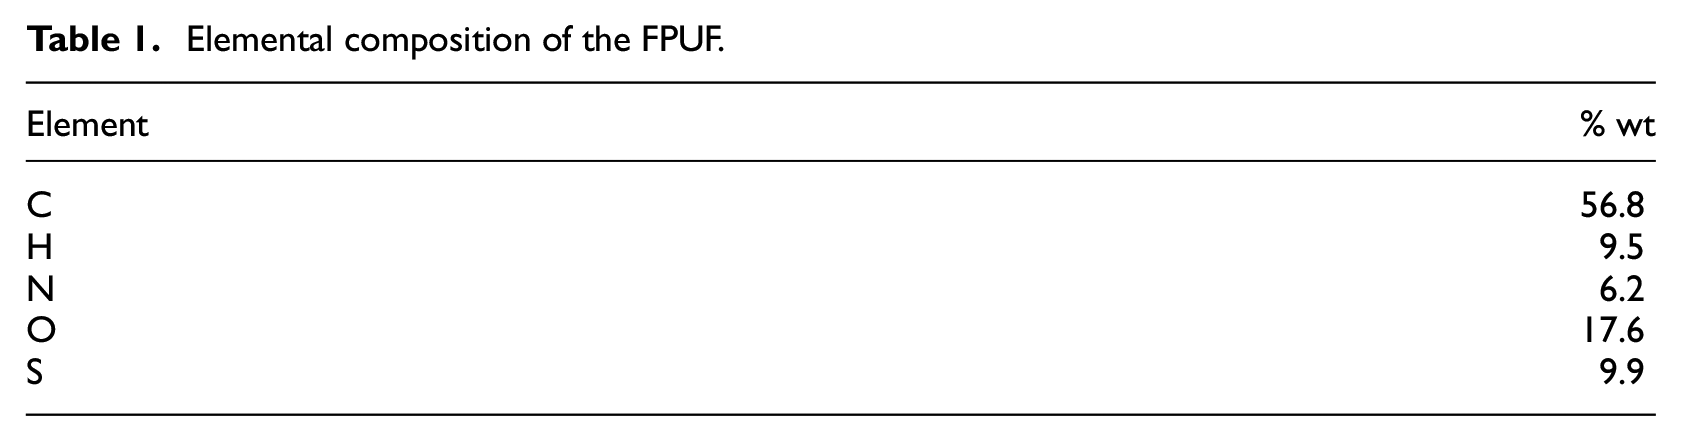
The FPUF used in this study was obtained from a sponge manufacturer (Hangzhou, China). The mass proportion of reactants used in the FPUF was approximately 40% of isocyanate and 60% of polyols. The density of the FPUF is 24 kg m−3. The elemental analysis determined in the Vario MICRO cube apparatus is shown in Table 1. According to the results of elemental analysis, the chemical formula of the FPUF can be estimated as C4.7H9.5O1.1N0.4S0.3.
Elemental composition of the FPUF.
The TG instrument is a Mettler Toledo TGA/DSC1. The accuracy of its temperature and mass is ±0.5°C and ±1 μg, respectively. The nitrogen atmosphere was provided by a nitrogen bottle. The flow rate of nitrogen was adjusted to 40 mL/min. TG experiments with heating rates (β) of 5, 10, 15, and 20 K/min were carried out in the nitrogen atmosphere, respectively. The mass of the FPUF sample is about 2.0–3.2 mg. Each sample was heated linearly from room temperature to 800°C. The data collection interval of TG experiments was set to 1 s.
GS method
Principle of GS algorithm
The fitness function (φ) should be established when the model-fitting method is used to solve the kinetic parameters. It is defined as the differences between the calculated values and the target values. The principle is that when φ reaches the minimum, the calculated parameters are obtained. The target values were m and MLR curves of TG.
The global search algorithm (GS) is an algorithm in the global optimization toolbox of MATLAB® software. When GS calculates the fitness function φ, it starts the hybrid function (fmincon) from the initial value of the calculated parameters. When the fmincon converges, GS records the initial and final values of the calculated parameters, and then generates multiple starting points within the range of the calculated parameters according to a scatter search mechanism. These starting points are taken as the initial values of GS, and then the global search is carried out. In the search process, GS analyzes the starting points and rejects those points that are unlikely to improve the best φ so far, to obtain accurately calculated parameters.28–30
The residual of φ was set as 10−6 in the GS code. When GS converged, the φ and calculated parameters were obtained.
The overall structure of the GS method takes the form of three parts: (1) according to the analysis of the thermal decomposition mechanism, the mathematical expression of φ of the GS was constructed; (2) the upper and lower limits of parameters were estimated by the results of TG experiment and the Kissinger’s method 20 ; (3) the upper and lower limits of parameters were input into GS to calculate φ, to obtain more accurate parameter values.
Fitness function
The thermal decomposition of solid materials is assumed to be composed of multiple reactions. Each reactant corresponds to a single-step thermal decomposition process.9,23,24,26 The number of thermal decomposition reactions is approximatively determined by the number of peaks on the MLR curve of TG.24,32 Each reactant produces non-gas and gaseous products. The reaction equation of thermal decomposition reactant (i) is expressed as equation (1)

The Arrhenius formula is suitable for gas-phase reactions. Many studies have also confirmed that this formula can also be applied to micro-scale solid-state thermal decomposition reactions. This approach still requires much research because there are often significant shortfalls when applying the approach to practical problems such as fire spread, large-scale burning behavior, and so on. In this study, the micro-scale solid-state thermal decomposition reaction is simplified to follow the Arrhenius formula.1–17,24–27,31 When the heating rate is β, the reactant i undergoes a single-step thermal decomposition at time τ. According to equation (1), the Arrhenius reaction rate ri,β,τ of the reactant (i) is defined as equation (2)

According to the law of conservation of mass and equations (1)–(2), the mass fraction of reactant i and thermal decomposition product at τ and β are deduced, respectively
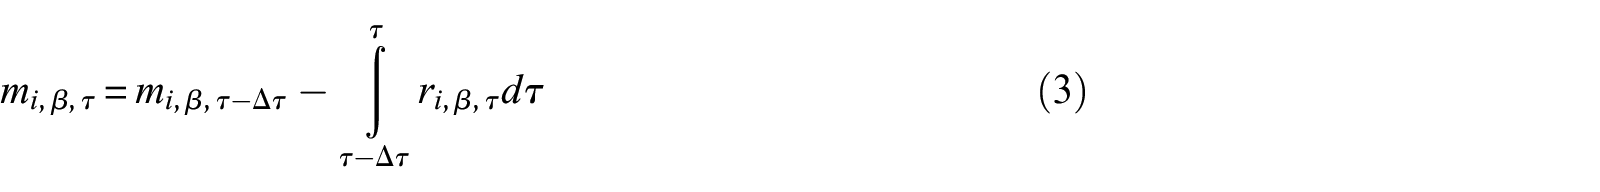
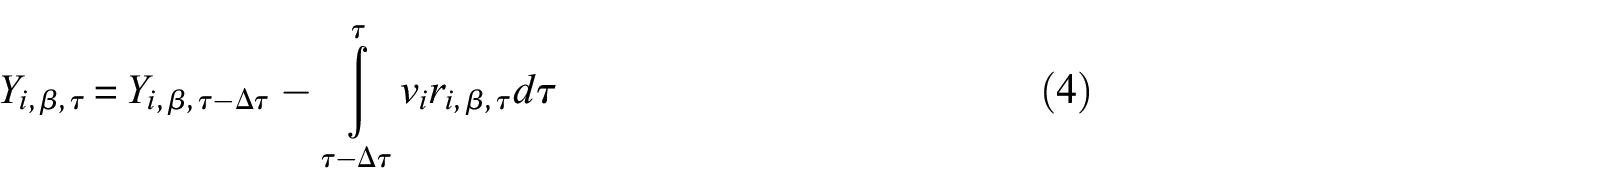
where Yi,β,τ is the mass fraction of non-gas product for reactant i at τ and β; Δτ is the data collection interval, 1 s.
Accordingly, the total mβ,τ, and MLRβ,τ of original solid material at τ and β are expressed as


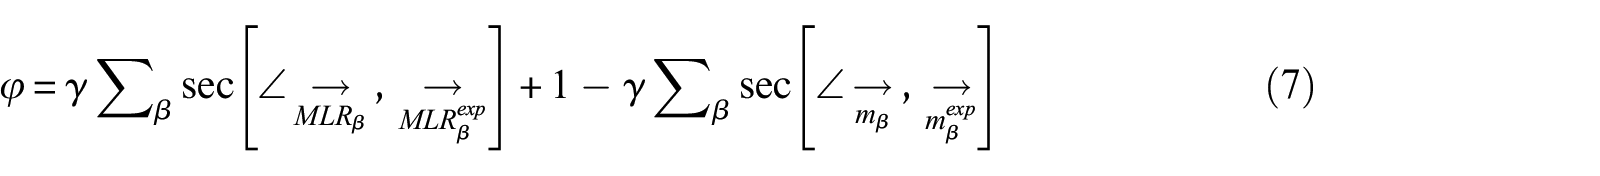
The key to validation of data is the ability to quantify the difference between model predictions and experimental measurements or between two model predictions or two experimental data sets. Functional analysis is provided to verify the experimental data and prediction data in the standard ISO 16730: 2015. Rogaume et al. 4 also used this method to predict the kinetic parameters of FPUF. Since the target values are m and MLR curves, and they are equally important. Therefore, the weight coefficient (γ) of the two target values are set to 0.5. The fitness function φ of the GS method is expressed as equation (7)
Upper and lower limits of parameters
According to equations (1)–(6), the kinetic parameters to be estimated were vi, ni, Ai, and Ei, respectively. Kissinger’s method can provide initial guesses for model fitting by nonlinear regression. 20 The precondition is that Ei is roughly constant over the entire conversion range. That is, it is suitable for single-step thermal decomposition. The thermal decomposition process of FPUF in an inert atmosphere is a complex multi-step process.1–17 Therefore, the thermal decomposition process of FPUF is assumed to be composed of several single-step thermal decomposition processes. The initial values of Ei and lgAi for each single-step thermal decomposition can be preliminarily predicted by the Kissinger’s method.19,20,24 The simplified calculation formula of Kissinger’s method is shown in equation (8)
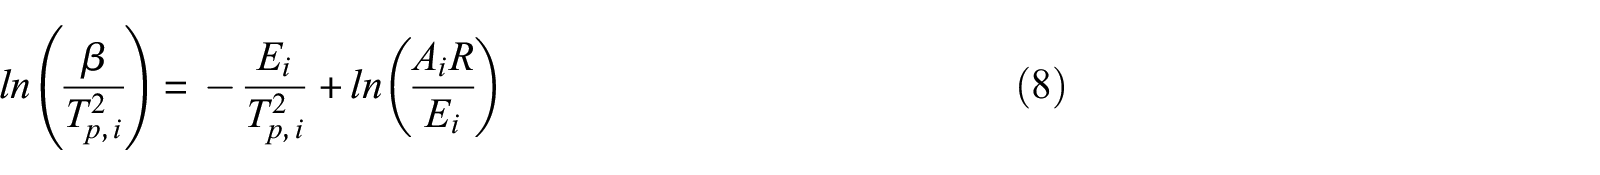
According to equation (8), Tp,i of each reaction was selected at different heating rates, and a linear fitting curve of 1/Tp,i and ln(β/T2 p,i ) was plotted. The initial value of Ei was estimated from the slope of −(Ei/R) by a linear fitting, and substituting back into equation (8) gave the initial value of Ai. Blind solution range will lead to the low efficiency of the GS. Therefore, the upper and lower limits of Ei and lgAi are set to 50% and 200% of their initial values, respectively. This range setting is nearly sufficient for solving the exact value. 24
It should be noted that equation (8) is suitable for the case of ni = 1. In fact, ni is not the same value in each thermal decomposition reaction. Because the ni of the thermal decomposition reaction of most of the reactants is about 1,1,7,20,24,33,34 the upper and lower limits of ni for each single-step thermal decomposition reaction are set to 0 and 3, respectively.
The upper and lower limits of vi can be estimated by the relative area underneath each peak of the MLR curve of TG at different β or the mass fraction of solid material at the end of the thermal decomposition. 32
Results and discussion
Experimental results and thermal decomposition mechanism
Experimental results
Figure 1 presents the experimental TG curves of the FPUF under the nitrogen atmosphere with four heating rates. Figure 1(b) shows the thermal decomposition process of FPUF. At about 200°C, FPUF releases gases such as isocyanates (the first peak) due to urethane bonds rupture, leaving the polyol mixtures. It is followed by thermal decomposition and volatilization of the polyol mixtures (the second peak). However, there is a third peak after 600°C in Figure 1(b). Correspondingly, the mass fraction of the sample is reduced from 0.13 to 0.08 between 600°C and 800°C in Figure 1(a). This indicates that there are thermal decomposition reactions of other substances besides thermal decomposition of FPUF and polyol mixtures. This is different from the TG experiment results of most FPUF.1–17 The elemental composition of the polyol mixtures was determined. The content of nitrogen is about 1.32% of the polyol mixture. The nitrogen content indicates that some isocyanate was trapped in the melts.
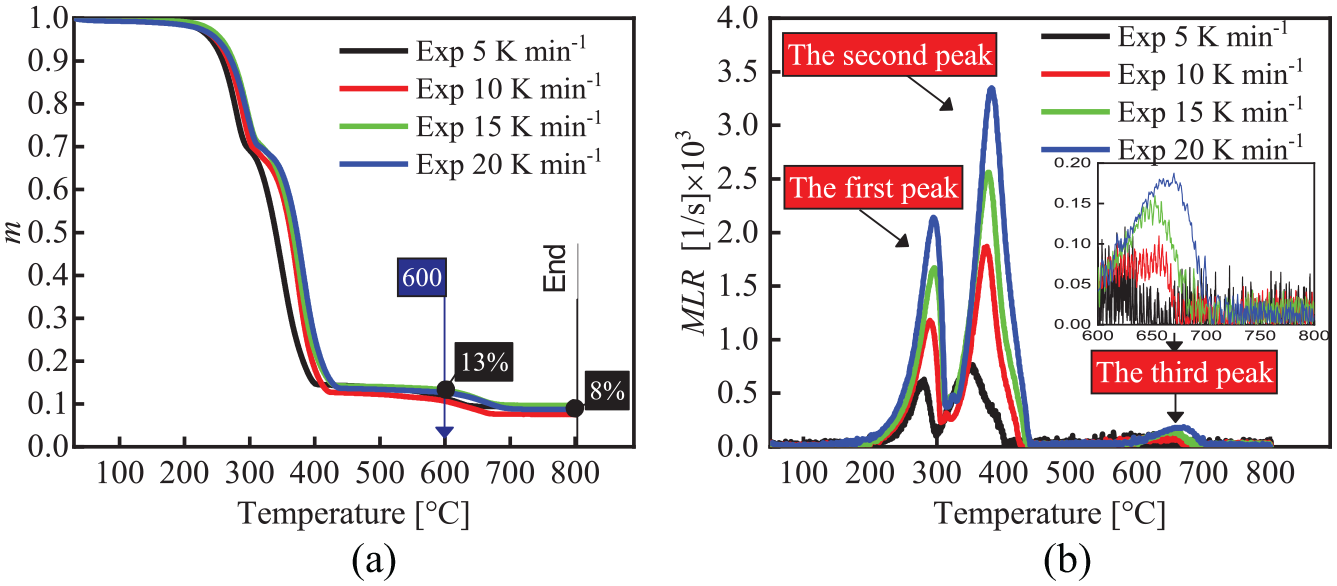
Experimental TG curves of the FPUF: (a) m and (b) MLR.
Research have shown that some isocyanate gases were trapped in the condensed phase of the polyol mixtures to form amine derivatives when the urethane bond of FPUF breaks and the foam structure collapses.11–14,16,17 Because the mass proportion of isocyanate (40%) in the synthesis of the commercial FPUF is much higher than that of FPUF studied by other researchers,4,8 parts of isocyanate gases released by thermal decomposition of FPUF are inevitably trapped in the condensed phase. The results of Chambers et al. 17 showed that parts of isocyanates retained in the condensed phase condensed to the CD. The ultimate product would probably be PCD under rigorously anhydrous conditions. PCD decomposed at temperatures above 600°C, generating a large number of volatile fragments. Therefore, it is reasonable to interpret the third peak as the thermal decomposition and volatilization of PCD.
Three thermal decomposition mechanisms
Due to the formation of amine derivatives in the condensed phase during the thermal decomposition process of FPUF, the traditional two-step continuous thermal decomposition mechanism (mechanism 1 in Table 2)3,4,10 is not suitable for the solution of the thermal decomposition kinetic parameters of the commercial FPUF.
Three thermal decomposition mechanisms of FPUF.
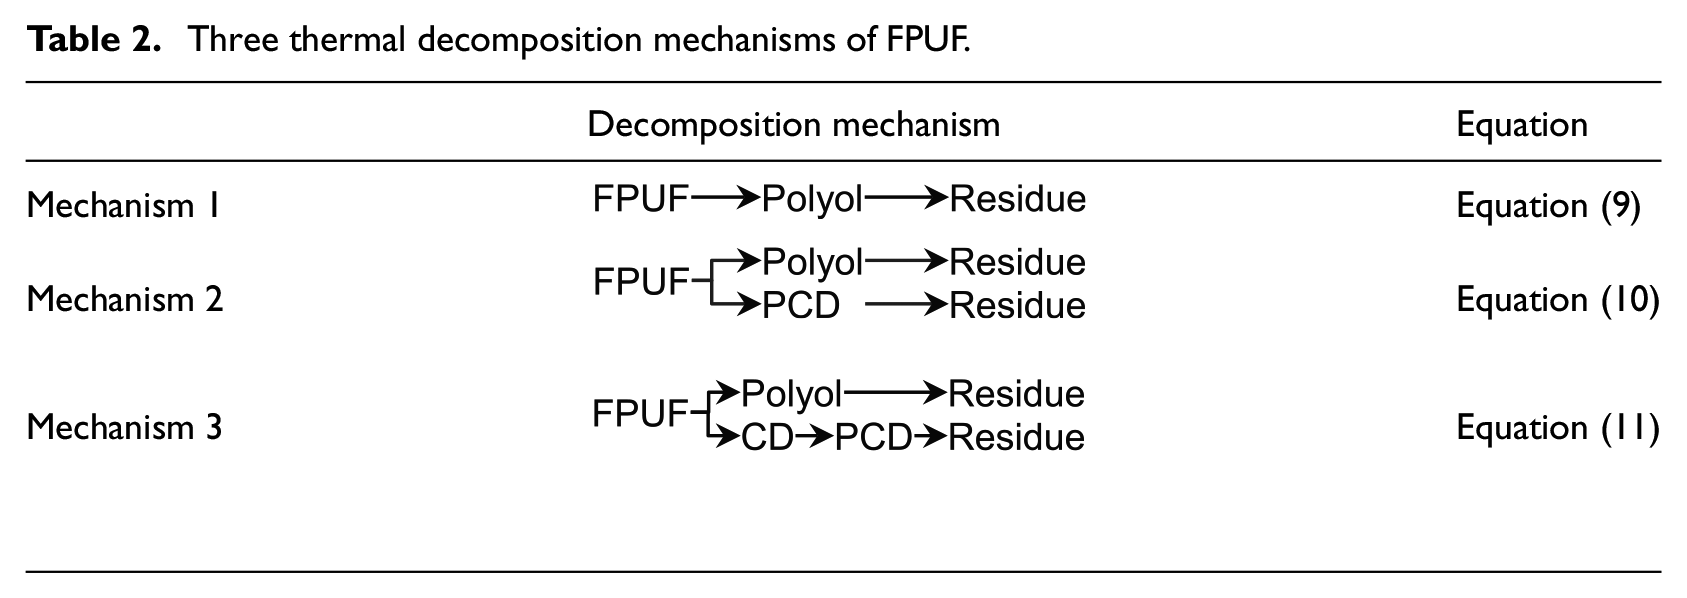
The two mechanisms proposed in this research are the ones presented in Table 2. Mechanism 2 does not consider the thermal decomposition of CD in the condensed phase. It is assumed that the first thermal decomposition of FPUF leaves polyols and PCD. The polyol and PCD are decomposed, respectively, leaving solid residues. Due to the thermal decomposition of CD at about 320°C, 16 mechanism 3 assumes that the first step of FPUF thermal decomposition generates polyols and CD. Thermal decomposition of the polyols leaves the solid residue. Further heating of CD results in the decomposition of the isocyanurate groups. Parts of the isocyanate gases are released. The other part of the isocyanate trapped in the polyol will further react with CD to form CO2 and PCD. 17 The thermal decomposition reaction of CD is a complicated process. Regardless, the overall thermal decomposition of CD produces gaseous and non-gaseous products. Hence, the thermal decomposition reaction of CD is simplified as the process of generating PCD from CD. The thermal decomposition of PCD leaves solid residues. Both mechanisms are allowed to explain the TG results presented in Figure 1. Nevertheless, they are hypothetical. The following work will use the GS method to find evidence that one of these mechanisms is correct. The equations of the three thermal decomposition mechanisms are shown in equations (9), (10), and (11), respectively
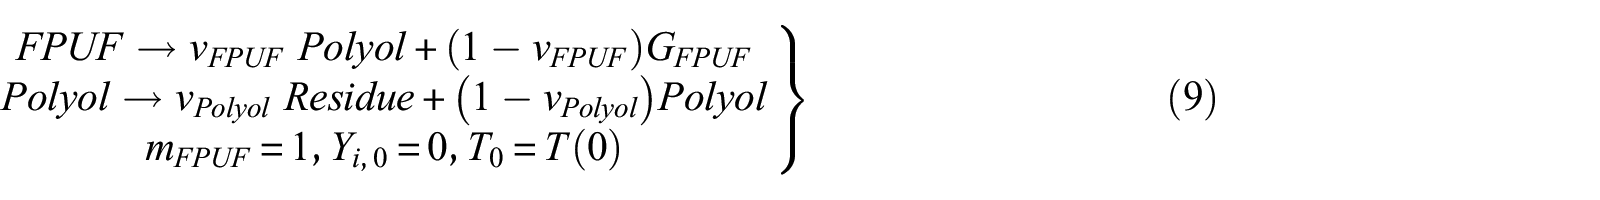
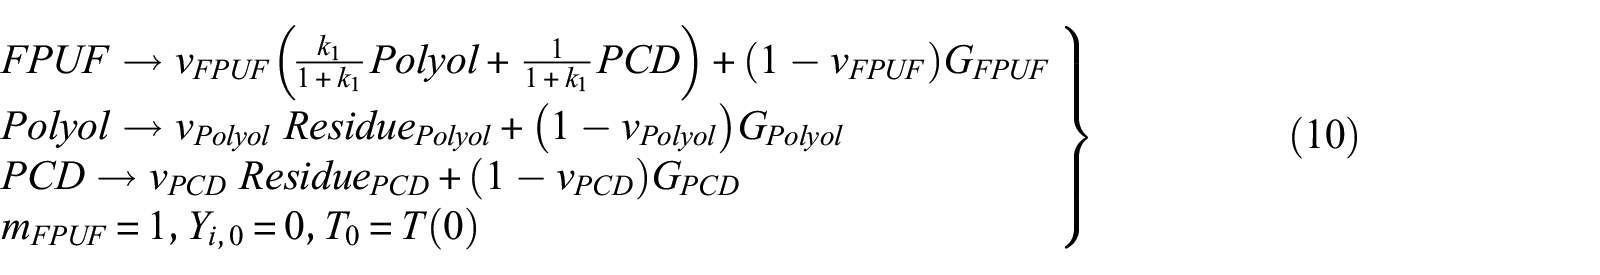
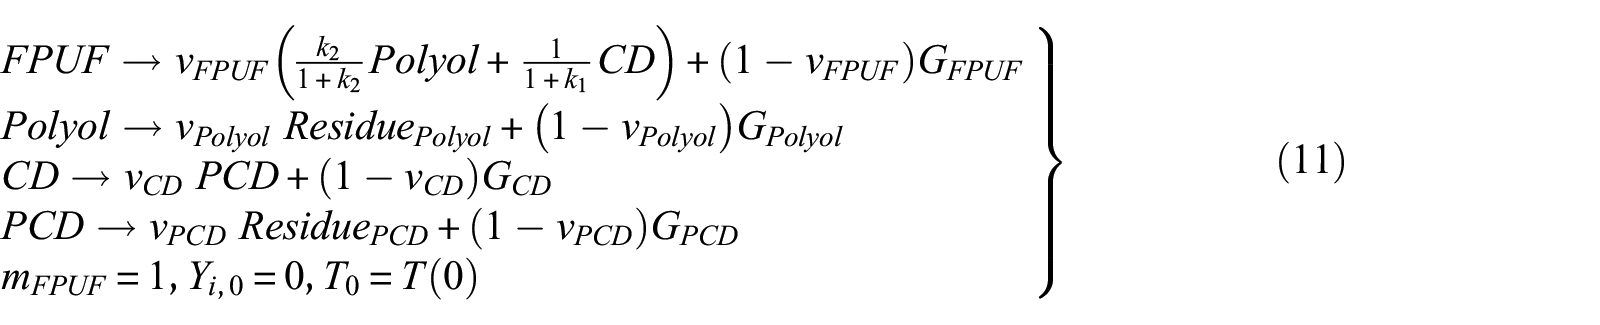
where the amount of PCD and CD generated is about 20% of the mass of the original FPUF.11,34 The mass of the polyol accounts for about 60% of the original FPUF. Therefore, the upper and lower limits of k1 and k2 are estimated to be 1 and 7, respectively.
Validation of the GS
The validity of the GS should be verified before it was applied to analyze the thermal decomposition mechanism of the FPUF. The results of the GS were compared with GA, PSO, the hybrid genetic algorithm (HGA), and the hybrid particle swarm optimization (HPSO) in MATLAB® software. These five algorithms are all global optimization algorithms, which are often used for nonlinear model fitting.
The principles of the four algorithms are different from GS. GA randomly selects an individual from the current population as a parent and uses them to produce the children for the next generation in each step. Over successive generations, the population evolves toward the best solution.1,24,25 The principle of PSO is similar to GA. PSO evaluates the objective function of each particle in each step. After the evaluation, the algorithm will determine the new velocity of each particle. The particles move, and the algorithm reevaluates.26,27 HGA and HPSO are calculated with the results of GA and PSO as the initial values of the hybrid function (fmincon), respectively.
The range of calculated parameters of four algorithms was consistent with the GS. The population sizes of GA and HGA were set at 200–500.1,24 The swarm sizes of PSO and HPSO were determined at 30–60. 26 The total number of times (FuncCount) of calling φ was used to evaluate the efficiency of the algorithms. The smaller the value of FuncCount is, the more efficient the calculation is. The accuracy of the calculation was evaluated by φ. The smaller the value of φ, the more accurate the calculation is.
Verification of single-step thermal decomposition reaction
Although the thermal decomposition process of the cellulose under the nitrogen environment should be a multi-step thermal decomposition reaction, it can be considered as a single-step reaction in the lower thermal decomposition temperature range (200°C–400°C). Grønli et al. 33 conducted TG experiments of the cellulose from room temperature to 400°C in the nitrogen atmosphere with β = 5 and 40 K min−1. The standard deviation (SD) of Ecellulose obtained at the two heating rates is about 13 kJ mol−1, and the relative error (RE) is about 5%. Therefore, it can be approximated that Ecellulose is roughly constant in the entire conversion rate range. That is, the cellulose is a single-step thermal decomposition process from room temperature to 400°C. 20 The kinetic parameters of thermal decomposition of cellulose were obtained by the least square method, as shown in Table 3. Rein et al. 1 verified the accuracy of the GA according to the TG data of Grønli et al. 33 (β = 5 K min−1, curve 7 of Figure 2). 33 But the calculation efficiency of the GA was low. To verify the accuracy and efficiency of the GS, this section does not discuss the multi-step thermal decomposition process of cellulose. The thermal decomposition process of cellulose under nitrogen environment is assumed to be a single-step reaction. The validity of the GS was verified with the TG experimental data of cellulose by Grønli et al. 33 (β = 5 K min−1, curve 7 of Figure 2). 33
The results of five algorithms for the kinetic parameters of cellulose at β = 5 K/min.
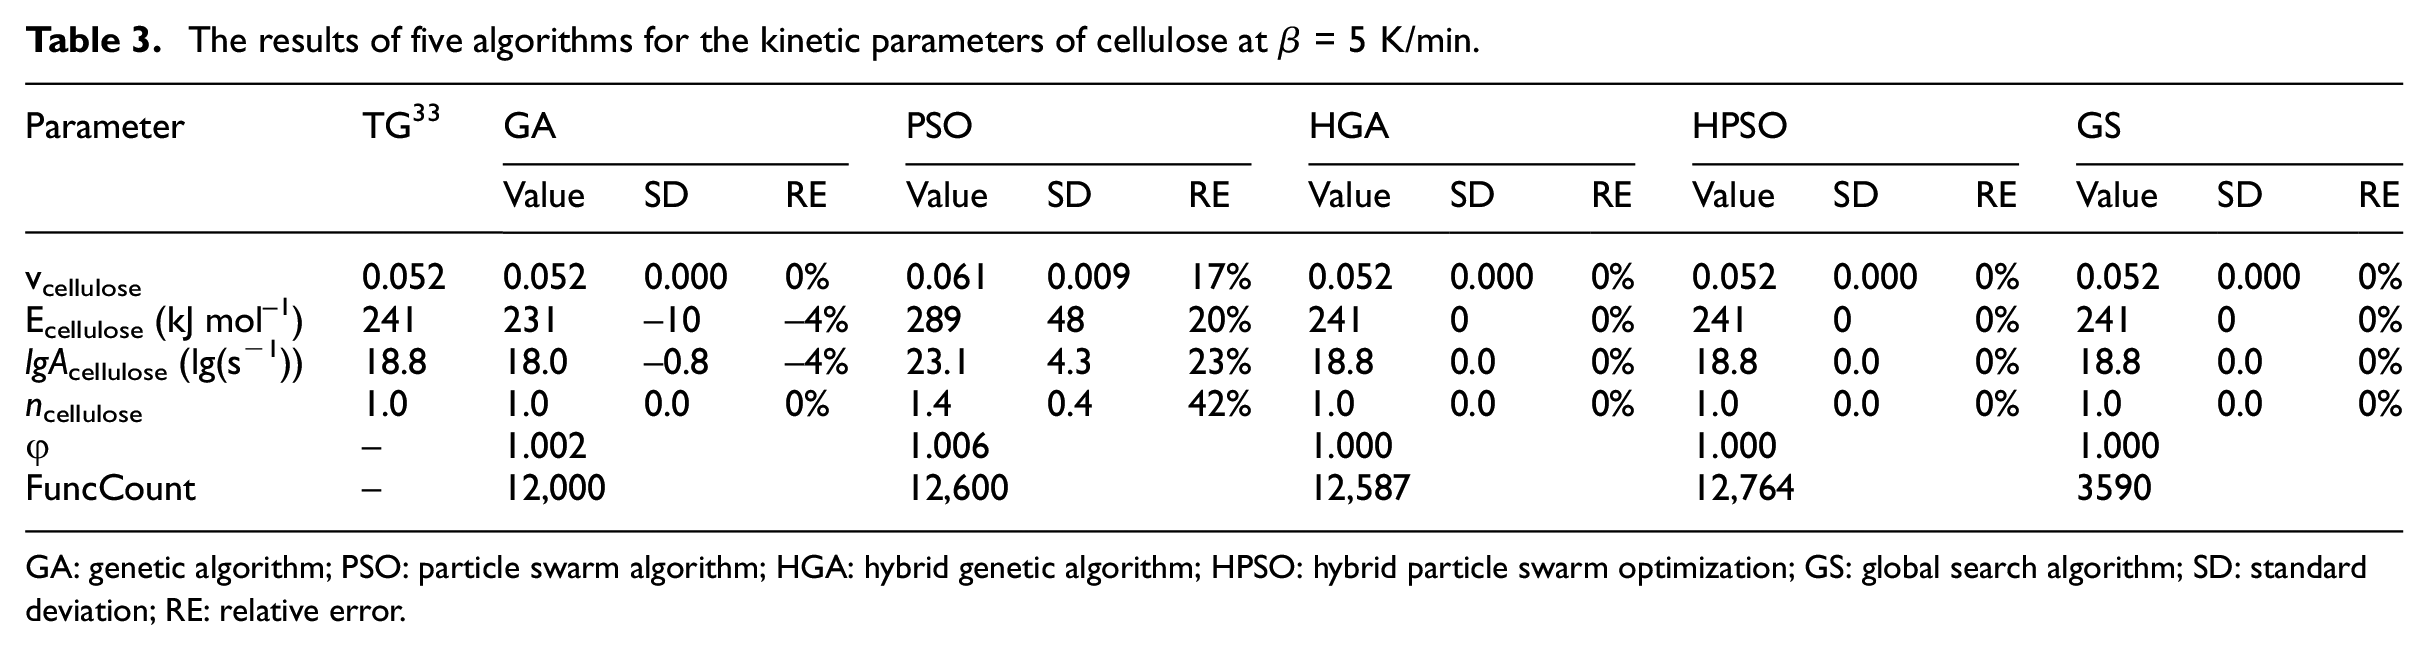
GA: genetic algorithm; PSO: particle swarm algorithm; HGA: hybrid genetic algorithm; HPSO: hybrid particle swarm optimization; GS: global search algorithm; SD: standard deviation; RE: relative error.
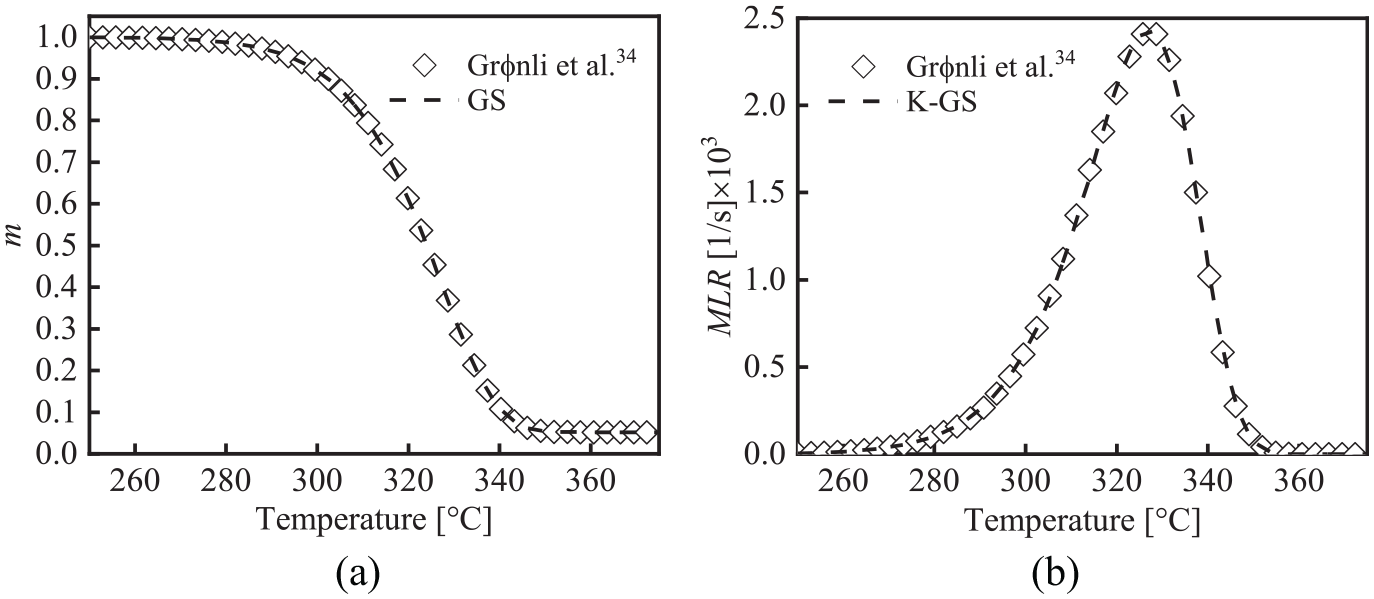
TG curves of cellulose at β = 5 K min−1: (a) m and (b) MLR.
Because cellulose is a single component, mcellulose,0 was determined as 1. The upper and lower limits of vcellulose were estimated by the TG curve of Grønli et al. 33 (β = 5 K min−1, curve 7 of Figure 2), 33 which was about 0–0.09. Using the parameter estimation method in “Fitness function” section, the upper and lower limits of the parameters of lgAcellulose, Ecellulose, and ncellulose were about 7–30 lg(s−1), 90–360 kJ mol−1, 0–3, respectively.
Table 3 lists the calculated results of five algorithms for the parameters of cellulose at β = 5 K/min. It can be seen from Table 3 that the error of the PSO is the largest. the SD of Ecellulose is about 48 kJ mol−1, and the RE is about 20%. The SD of Ecellulose estimated by GA is about −10 kJ/mol, and the RE is about −4%. It can be approximated that the error is within a reasonable range. The parameters calculation results of the HGA, HPSO, and GS are in good agreement with Grønli et al. 33 The GS is the most efficient of the five methods, and its FuncCount is 28%–30% of other algorithms.
According to the parameters of the GS in Table 3, The TG fitting curves of cellulose at β = 5 K/min are shown in Figure 2. It is seen that the TG fitting curves are highly consistent with the experimental curves in Grønli et al. 33 Therefore, it is feasible to use the GS to analyze the thermal decomposition kinetic parameters of the single-step reaction of solid materials. The method can not only meet the calculation accuracy but also greatly improve the calculation efficiency.
Verification of multi-step thermal decomposition reaction
The thermal decomposition of FPUF is a multi-step thermal decomposition reaction process in the nitrogen atmosphere. The calculation efficiency and accuracy of the GS are verified by three thermal decomposition mechanisms of FPUF in Table 2. According to the TG experimental results of FPUF at four heating rates in Figure 1, the upper and lower parameters for each thermal decomposition reaction of FPUF are shown in Table 4. The upper and lower limits of each calculation parameter in Table 4 are brought into the algorithms to obtain the φ and FuncCount of the five algorithms, as shown in Table 5.
The upper and lower limits of the parameters of the three mechanisms.

FPUF: flexible polyurethane foam; CD: carbodiimide; PCD: polycarbondiimide.
The φ and FuncCount of the five algorithms under three thermal decomposition mechanisms.
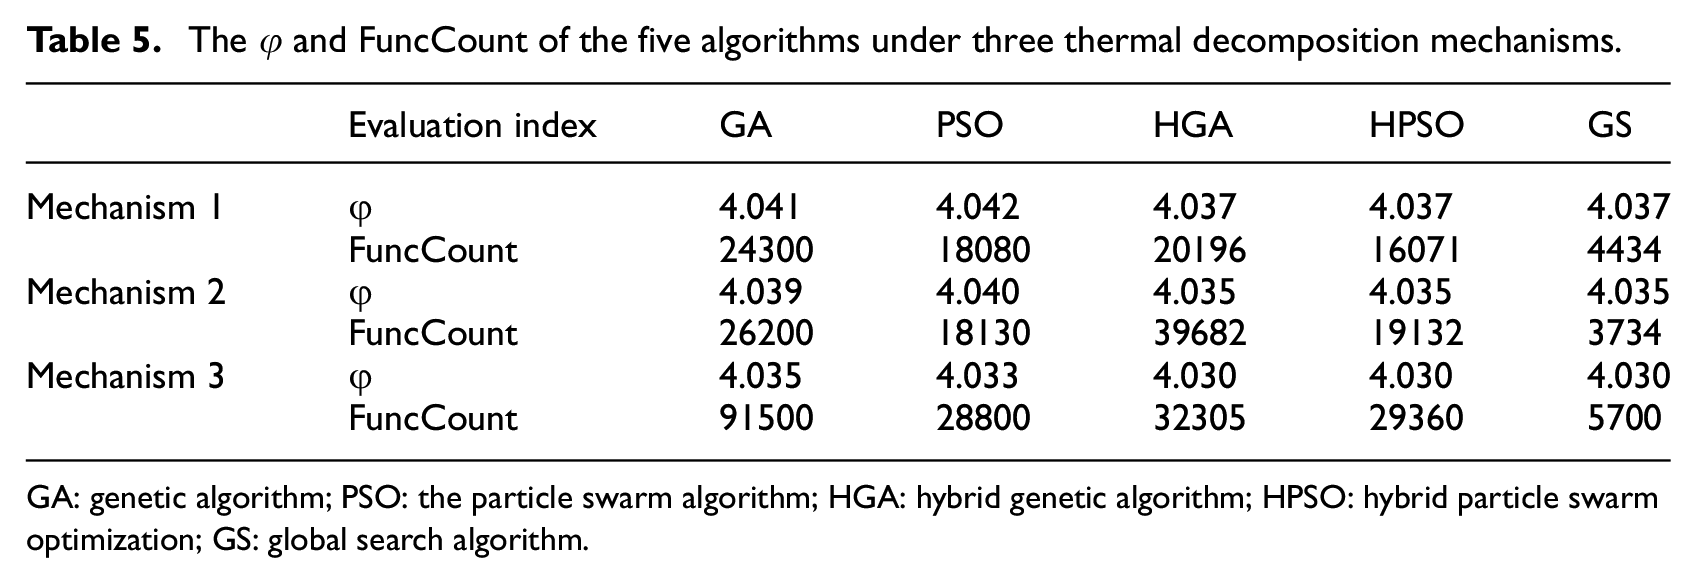
GA: genetic algorithm; PSO: the particle swarm algorithm; HGA: hybrid genetic algorithm; HPSO: hybrid particle swarm optimization; GS: global search algorithm.
It can be seen from Table 5 that the φ of GS, HGA, and HPSO is the smallest and consistent. The GS is the most efficient of the five methods, and its FuncCount is 7%–28% of other algorithms. Therefore, it is feasible to use the GS to solve the kinetic parameters of the multi-step thermal decomposition reaction of FPUF. The GS improves the calculation efficiency of solving the kinetic parameters.
Results of three thermal decomposition mechanisms
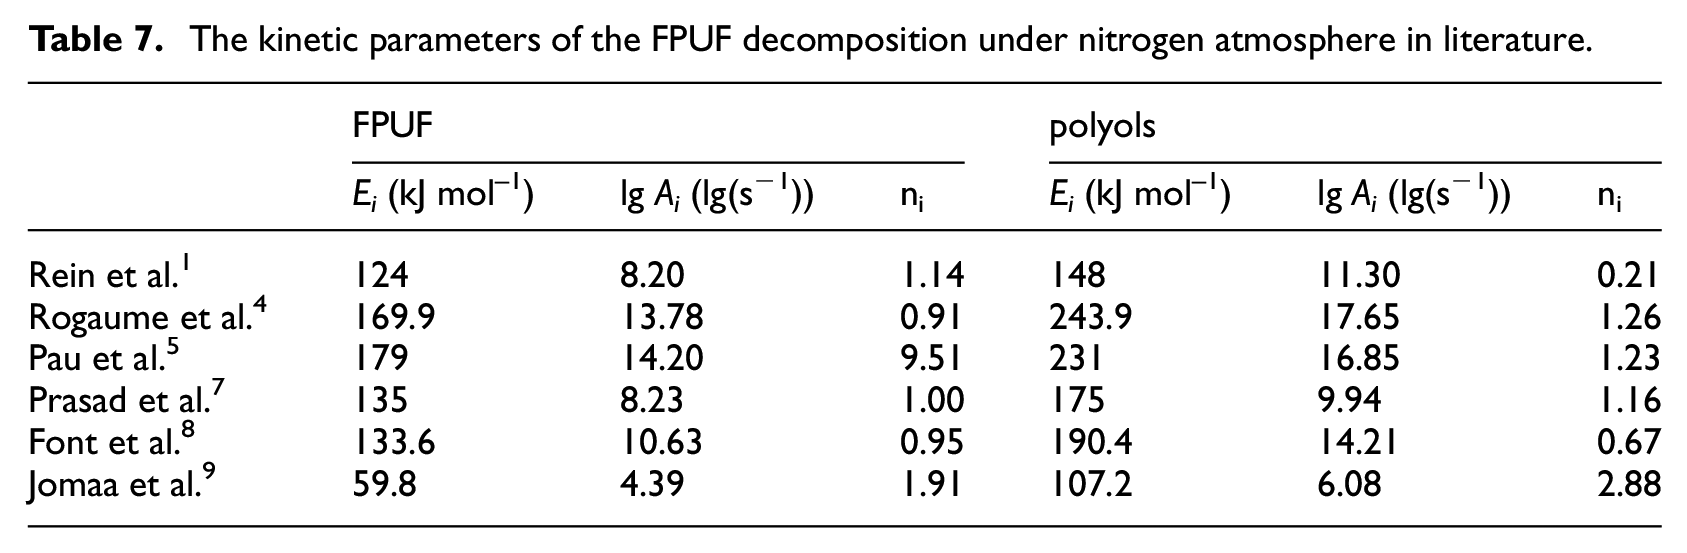
The parameters of the three thermal decomposition mechanisms of FPUF calculated by the GS are shown in Table 6. Due to the different thermal decomposition reaction mechanisms, the kinetic parameters of the three thermal decomposition mechanisms are quite different. Most of the literature is based on the traditional two-step thermal decomposition mechanism of FPUF (mechanism 1 in Table 2) to estimate the kinetic parameters of each thermal decomposition reaction. Due to different calculation methods and differences in material composition, proportions, and so on, the thermal decomposition reaction kinetic parameters of FPUF obtained from the literature are also differences, as shown in Table 7.
The results of the parameters of three mechanisms of FPUF.
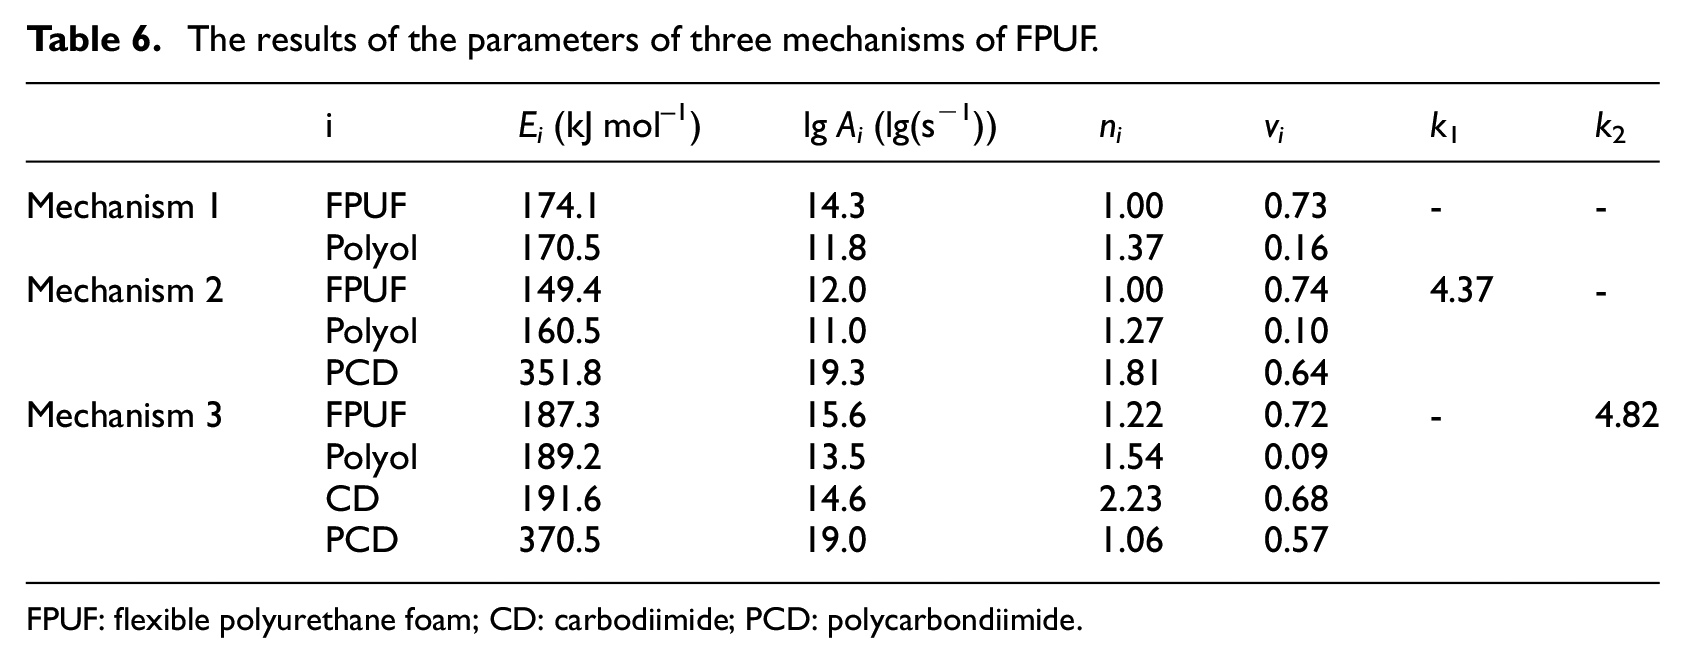
FPUF: flexible polyurethane foam; CD: carbodiimide; PCD: polycarbondiimide.
The kinetic parameters of the FPUF decomposition under nitrogen atmosphere in literature.
According to vi, k1, and k2 in Table 6, the mass ratio of isocyanate and polyol for FPUF synthesis under three mechanisms can be deduced from equations (9)–(11). The mass ratios of isocyanate and polyol of mechanism 1, mechanism 2, and mechanism 3 are 27:73, 40:60, 40:60, respectively. Obviously, the calculation results of mechanism 2 and mechanism 3 are consistent with the proportion provided by the manufacturer. To find the best thermal decomposition mechanism, the TG fitting curves of FPUF under the three thermal decomposition mechanisms were drawn (Figures 3 and 4) according to Table 6.
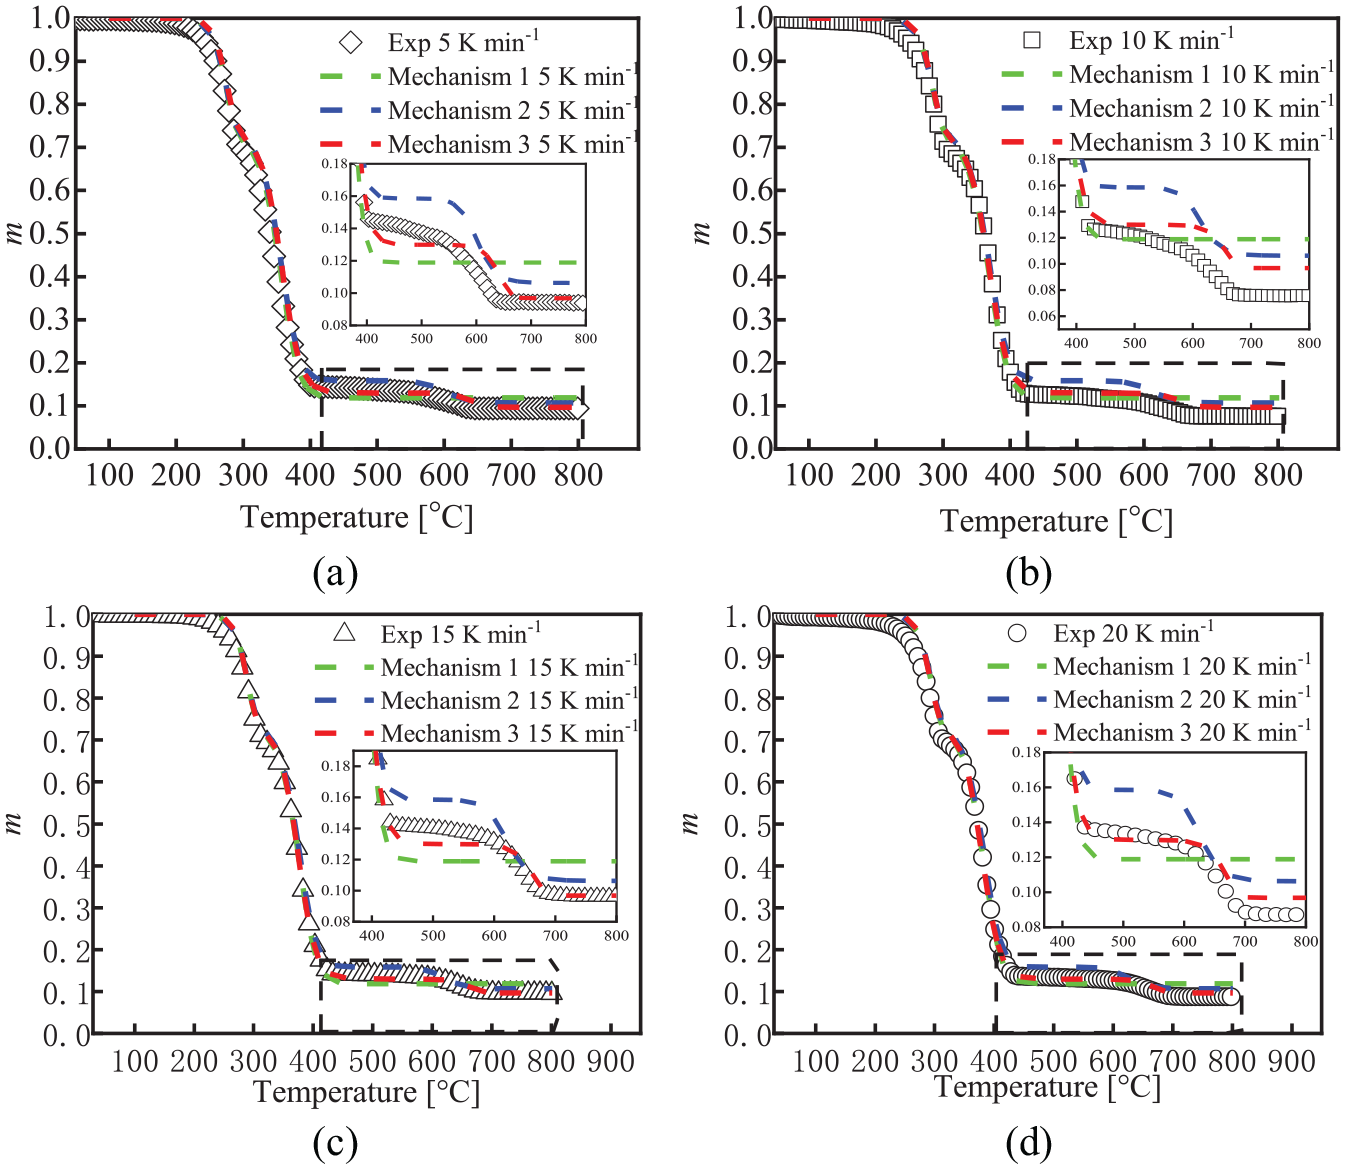
The fitting curves of TG mass fraction of FPUF under three mechanisms: (a) β =5 K min−1, (b) β = 10 K min−1, (c) β = 15 K min−1, and (d) β = 20 K min−1.
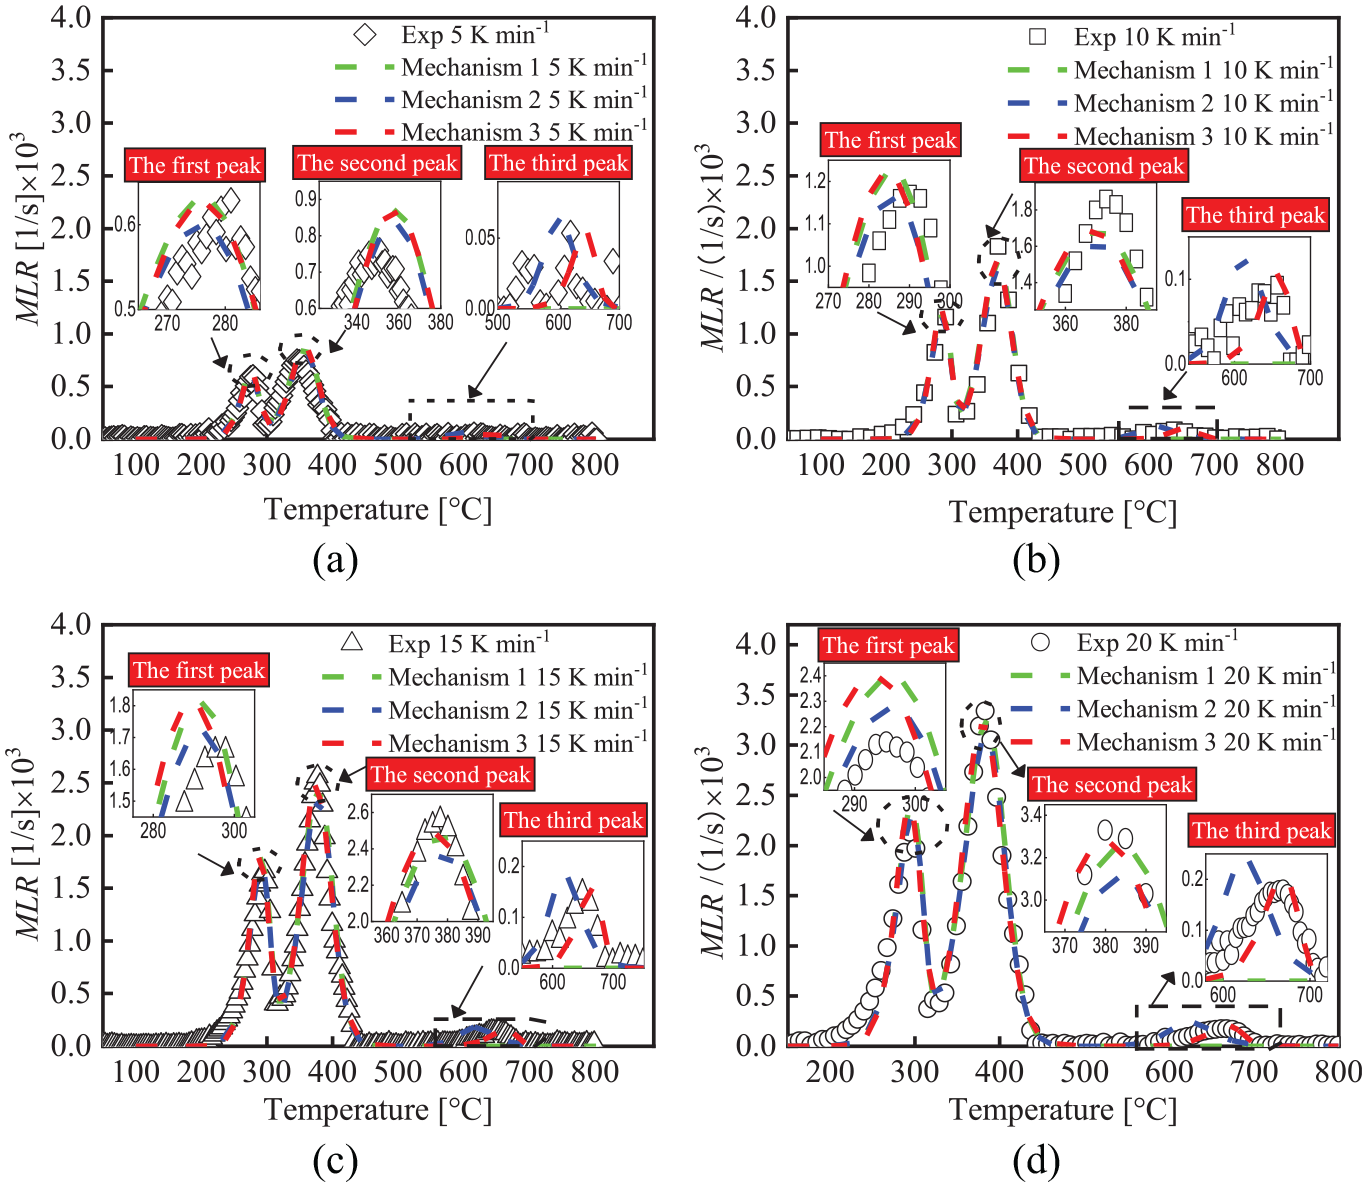
The MLR fitting curves of TG for FPUF under three mechanisms: (a) β =5 K min−1, (b) β = 10 K min−1, (c) β = 15 K min−1, and (d) β = 20 K min−1.
The fitting curves of the TG mass fraction of FPUF under three mechanisms are shown in Figure 3. The mass fraction of FPUF with three thermal decomposition mechanisms agrees well with the experimental value at four heating rates when the thermal decomposition temperature is from room temperature to 400°C. When the thermal decomposition temperature is 400°C–600°C, mechanism 2 has the largest error with the experimental value, followed by mechanism 1. Mechanism 3 agrees well with the experimental value. Since mechanism 1 has no thermal decomposition reaction after 600°C, mechanism 1 has the largest error with the experimental value when the thermal decomposition temperature is 600°C–800°C, followed by mechanism 2. Mechanism 3 still agrees well with the experimental values. Therefore, the TG mass fraction fitted by mechanism 3 is most consistent with the experimental value.
The MLR fitting curves of TG for FPUF at four heating rates under three mechanisms are shown in Figure 4. The first peak fitted by mechanism 2 is in good agreement with the experimental values, except for β = 5 K min−1. Although the first peak fitted by mechanism 1 and mechanism 3 is slightly higher than mechanism 2, they have a little deviation from the experimental value. The second peak fitted by mechanism 3 is in good agreement with the experimental value. The second peak fitted by mechanism 1 and mechanism 2 is slightly lower than that fitted by mechanism 3. The third peak fitted by mechanism 3 can well describe the position and shape of the third peak of the experimental curve. The third peak fitted by Mechanism 2 has a large deviation from the experimental value. Mechanism 1 cannot fit the third peak. Therefore, mechanism 3 can well describe and capture the position and shape of the peaks of the MLR curve of the TG of FPUF.
In summary, mechanism 3 is the best thermal decomposition mechanism of the FPUF. It can well describe the TG mass fraction and MLR curves of FPUF.
Analysis of the thermal decomposition process of mechanism 3
The thermal decomposition process of the FPUF was similar under the four heating rates. The TG experiment of the FPUF with heating rate β = 20 K min−1 was used to analyze the thermal decomposition process of mechanism 3 of the FPUF. The thermal decomposition process of the FPUF and its products in Mechanism 3 is shown in Figure 5.
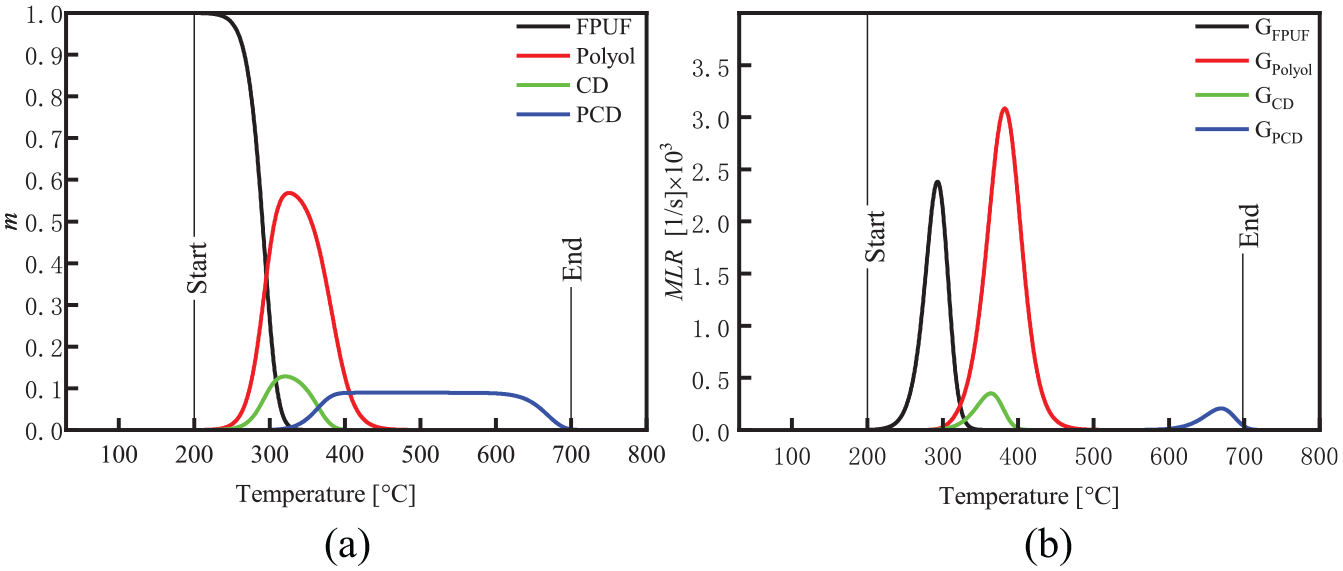
The thermal decomposition process of FPUF and its products at β = 20 K min−1 in mechanism 3: (a) m and (b) MLR.
Due to the urethane bond rupture, FPUF begins to thermally decompose at about 200°C, releasing gaseous products while leaving polyols. The thermal decomposition of FPUF is completed at about 350°C. The remaining polyols begin to decompose at about 300°C, leaving a solid residue. At about 480°C, the thermal decomposition of the polyol mixtures is completed. This thermal decomposition process is basically consistent with the results of Rogaume et al. 4
Due to the collapse of the foam structure, parts of the isocyanate gases are trapped in the condensed phase of the polyols, forming CD at about 260°C. CD begins thermal decomposition at about 310°C, releasing the isocyanate gases. Although CD begins to thermally decompose at around 310°C, the polyols are not yet thermally decomposed, and part of the isocyanate is still trapped in the polyols. Under strict anhydrous conditions, the isocyanate will further react with CD to form CO2 and PCD. 17 The decomposition of CD is completed at about 400°C. The thermal decomposition process of CD is basically the same as that of Bilbao et al. 16
PCD begins thermal decomposition at about 600°C, and ends at about 700°C, leaving a solid residue. The thermal decomposition process of PCD is basically consistent with Chambers et al. 17
Conclusion
According to the TG experiment of FPUF in the nitrogen atmosphere, three thermal decomposition mechanisms were proposed. The GS was proposed to estimate the kinetic parameters of the thermal decomposition of solid material in the inert atmosphere. The GS was validated with single-step and multi-step thermal decomposition mechanisms, and the GS was applied to the thermal decomposition mechanism analysis and kinetic solution of FPUF. The major findings included the following:
The GS algorithm is superior to GA, PSO, HPO, and HGA in predicting single-step and multi-step thermal decomposition kinetic parameters.
The mechanism 3 can accurately describe the thermal decomposition process of commercial FPUF under the nitrogen atmosphere. FPUF decomposes at 200°C–350°C, leaving the polyols. Polyols are decomposed at 300°C–480°C. Due to the collapse of the foam structure, part of the isocyanate gas is trapped in the condensed phase of the polyols to form CD. CD is thermally decomposed at 310°C–400°C, leaving PCD. PCD is decomposed at 600°C–700°C.
The thermal decomposition kinetic parameters of FPUF calculated by the GS under mechanism 3 can be used in the fire numerical simulation of FPUF.
Footnotes
Appendix 1
Declaration of conflicting interests
The author(s) declared no potential conflicts of interest with respect to the research, authorship, and/or publication of this article.
Funding
The author(s) disclosed receipt of the following financial support for the research, authorship, and/or publication of this article: This study is supported by the Fujian Provincial Natural Science Foundation (2019J01710 and 2018J01486) and the Scientific Research Foundation of Jimei University (ZQ2016006).
Data availability
The raw data required to reproduce these findings are available to download from ![]() . The processed data required to reproduce these findings are available to download from https://data.mendeley.com/datasets/ymjczxv89d/draft?a=cee3406b-5a63-4feb-bbd9-0b03fc7abdcc.
. The processed data required to reproduce these findings are available to download from https://data.mendeley.com/datasets/ymjczxv89d/draft?a=cee3406b-5a63-4feb-bbd9-0b03fc7abdcc.