
Abstract
Using [H2O2] in the molar range, the reaction with Fe2+ has two phases: in the first rapid phase, only a small fraction of the total O2 is evolved; the bulk of the gas is formed in a slow second phase. In interpretations based on the free radical model of Barb et al., the first phase has been identified with the ‘Fenton reaction’ (reaction of Fe2+with H2O2), while the second with catalytic decomposition of H2O2 by Fe3+ ions. This interpretation is not correct. A new analysis of the model shows that (1) it is a chain reaction having no termination steps and (2) the ‘Fenton part’ alone consists of two phases. It starts with rapid evolution of O2 via a five-membered chain reaction (first phase). When [Fe2+] becomes low, evolution of O2 continues in a three-membered chain reaction at a greatly reduced rate (second phase). In later stages of the second phase, Fe3+ catalysis contributes to O2 evolution. Thus, the amount of O2 formed in the rapid phase cannot be identified with the total amount formed in the ‘Fenton reaction’ but only with that formed in its first phase. Computer simulations of O2 evolution based on the model of Barb et al. and rate constants show a definite dependence of this quantity on the initial [H2O2] – in contrast to the experimentally found independence. More satisfactory, but not complete, agreement with measured data could be reached in simulations using a non-radical model. Some of the difficulty has been due to the determination of the exact position of the end of the first phase. The transition between the two phases of the reaction occurs in a short, but finite time interval. It has been shown that the quantity ‘total amount of O2 evolved in the Fenton reaction’ (subtracting the part due to Fe3+catalysis) is not accessible to experimental determination nor to theoretical calculation.
Introduction
It has been observed that when concentrated H2O2 was mixed with a salt of Fe2+, there was an initial burst of O2 followed by a slow evolution of the gas (catalase burst). 1 The question of the mechanism of the reaction (Fenton reaction) remains the subject of research to this day. Haber and Willstaetter 2 suggested that free radicals derived from H2O2 are active intermediates in the reaction. Haber and Weiss 3 worked out a model built on a chain reaction carried by free radicals. It offered an explanation for the until-then-unexplained variation of the stoichiometry of the reaction as a function of the concentration of the reactants. Later experiments revealed additional features of the reaction requiring modification of the scheme.
The model of Haber and Weiss
The model (H) consists of four steps


Step H1 is the initiation reaction, steps H2 and H3 form an O2-producing chain while H4 is a termination step. The course of the reaction is determined by the relative rates of steps H2 and H4, which in turn depends on the ratio RR = [H2O2]/[Fe2+] in the reaction mixture. At low RR, termination suppresses chain propagation and no O2 is evolved. The ratio RP = [O2]/[Fe3+] when the reaction is complete is then 0. On increasing the initial reagent ratio
The model of Barb et al
To account for a limit to the production of O2 when [H2O2] is increased, step B4 has been substituted for H3 of the Haber and Weiss 3 scheme


It is a chain reaction in which B0 has a double role: it both initiates and propagates the chain. In contrast to the Haber–Weiss model, this chain reaction has no termination steps. Namely, by substituting step B4 for H3, steps B1 and B3 (which only appear to be termination steps) become chain carriers as their product Fe3+ reacts again in B4 while HO2− will react, after protonation, in B0. Such a reaction stops only if one of the reactants in the initiation step has been used up.
There are two reaction chains possible in the system: (a) a long one involving all five reactions and (b) a short one involving B0, B2, and B4 only. This fact has a decisive influence on the course of the reaction. Let us consider the case of the long chain (a).


Subscripts of the rate constants refer to scheme B and follow the designation of Barb et al. The rate of O2 evolution is given by

where A = (k1/k2) [Fe2+] + [H2O2] and B = (k3/k4) [Fe2+] + [Fe3+].
The term d[O2]/dt will become zero (apart from at t = 0 when [Fe3+] is zero) only if [H2O2] or [Fe2+] becomes zero. It has been shown that, in a sufficiently large initial excess of H2O2, the final concentration of Fe2+ is zero. 5 The decrease of [Fe2+] in the course of the reaction will lead, at some stage, to a state in which the following relations will exist: vB1 << vB2 and vB3 << vB4 (v denotes rate). As a result, the course of the reaction will change and will include steps B0 – B2 – B4 only (short chain). The kinetics will change from those of phase (a) to those of phase (b). There will be a sharp decrease in the rate of evolution of O2, because low [Fe2+] will cause a low rate in step B0, causing low rates of reaction in the chain including in the O2 producing step B4. In phase (b), in every cycle B0–B2–B4, two molecules of H2O2 disappear with no loss of Fe2+. It can be regarded as a decomposition of H2O2 catalysed by Fe2+. As stated above, at this stage the rate of step B1 is negligible compared to those constituting the short chain, but it is not zero. From time to time, step B1 occurs, causing a small disturbance in the balance among the chain reactions. After a few cycles, a new balance will be established at a lower [Fe2+]. Catalytic decomposition of H2O2 will go on at this lower level. Because of lower [Fe2+], but mainly due to the loss of H2O2 through catalytic decomposition, the rate of step B0 will decrease. As a consequence, the rates of all reactions of the chain will decrease. This sequence of events with ever-slowing chain reactions will repeat itself many times until the final stage of the reaction has been reached. It follows then from the two-phase evolution of O2 that the amount of O2 evolved per dm3 of reaction mixture (ΔO2) in the rapid phase is not the total amount formed in the Fenton reaction. The interpretation of this quantity by Barb et al. was incorrect. Ferric catalysis (starting with a direct reaction between Fe3+ and H2O2) plays no part in these considerations. It does occur also, but only in the later stages of the slow phase, in overlap with it.
Making no distinction between rapid and slow phases, Barb et al. have derived equations for the dependence of ΔO2 on the concentration of the reactants. For high [H2O2]/[Fe2+], the expression becomes

(equation (AVIII) in Kremer 5 (with term [Fe2+]/[Fe2+]o missing) and the equation on p. 480 in Barb et al. 4 ). [Fe2+]o is the initial concentration of Fe2+, [Fe2+] is its concentration after time t and ΔO2 is the amount of O2 evolved in time t. The equation is based on the set of all five free radical reactions. Its notable feature is the absence of [H2O2] in the equation, implying that, under these circumstances, ΔO2 is independent of [H2O2]. Experimental results supported this conclusion (Figure 6 in Barb et al. 4 ). However, there were difficulties in using this equation. Namely, the meaningful range of its application is the time interval in which there is a substantial change of [Fe2+] (say 90%). Computer simulations show that this occurs during the first second of the reaction (Figures 1 and 2). During 1 s, no measurements of both ΔO2 and [Fe2+] could be made. To overcome this difficulty, [Fe2+] was taken at the end of the reaction ([Fe2+]e) and, accordingly, ΔO2 as the total amount of O2 formed in the Fenton reaction. Thus, this leaves only a single point in a run with a given [Fe2+]o. Far more disastrous is the fact that it has been shown that [Fe2+]e is zero, causing the right hand side of equation (4) to become infinite! 5 In order to avoid the ‘infinity catastrophe’, Barb et al. 6 have substituted ‘the stationary concentration of Fe2+ during the subsequent ferric ion + peroxide reaction’ for [Fe2+]e. This idea is, however, unsound. In calculating [Fe2+]e, it was not logical to introduce the ‘ferric ion + peroxide reaction’ only at the endpoint of the Fenton reaction and to neglect it during all other parts of it. This step was even less justified in interpreting results of experiments in which Fe3+ was added initially to the reaction mixture ‘in a big excess over [Fe2+]o’. The way out of this dilemma is a computer simulation of the reaction – a facility not available at the time when the classical investigations of Barb et al. were performed.
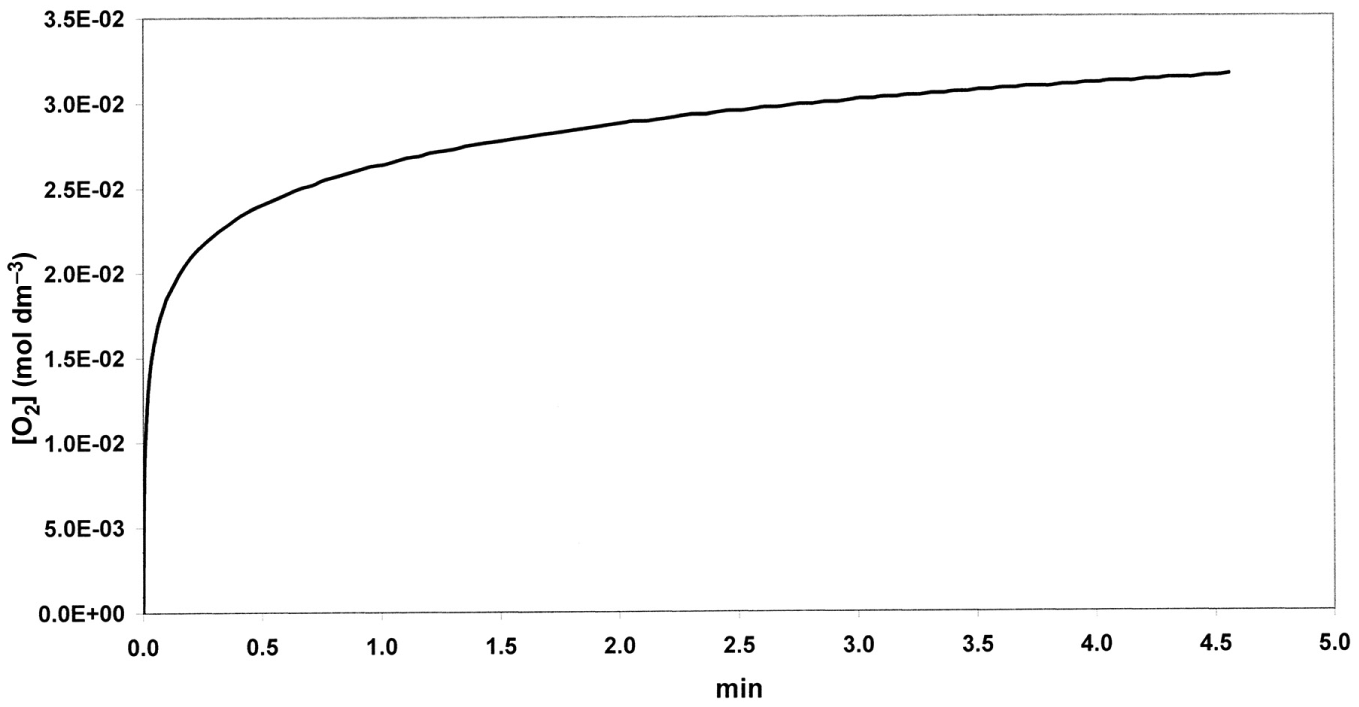
Simulated curve of O2 evolution (Barb et al.’ scheme): ko = 12.6 mol dm-3; k1/k2 = 69; k3/k4 = 3.3; [Fe2+]o = 0.04 mol dm-3; [H2O2]o = 1 mol dm-3.
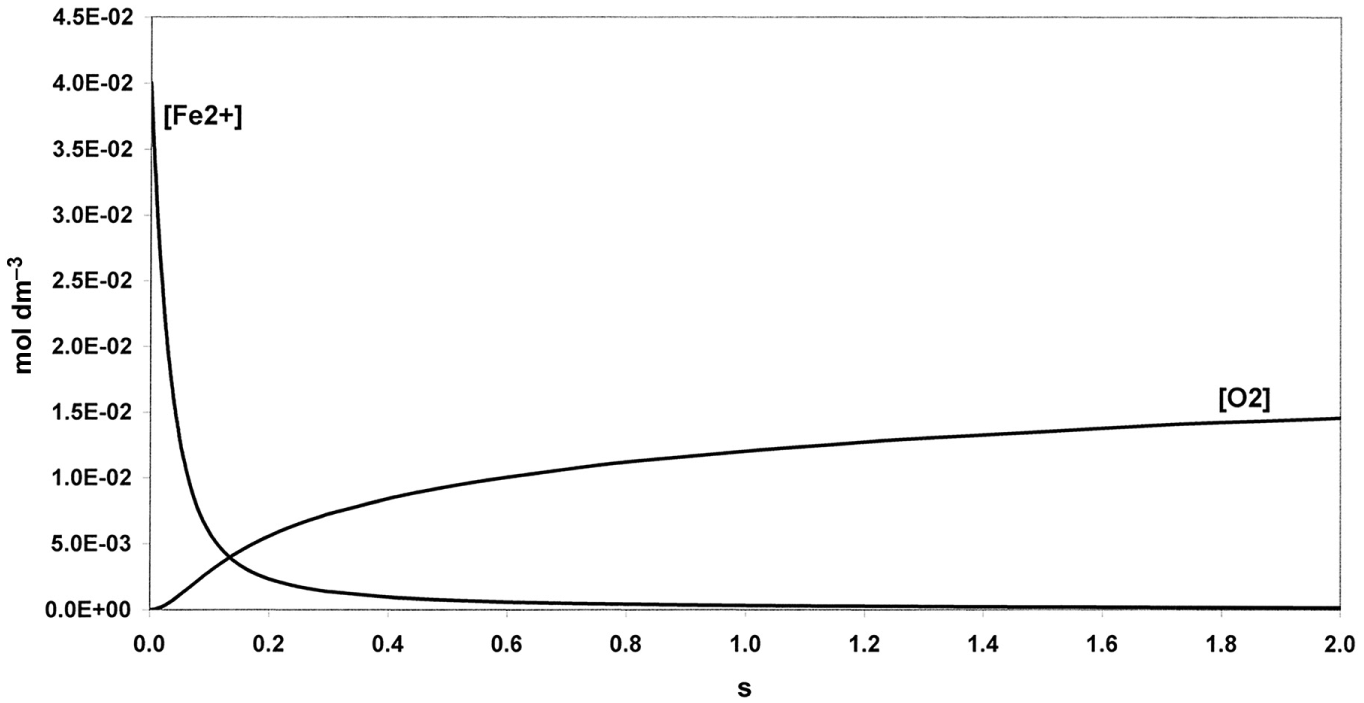
[O2] and [Fe2+] versus time at the beginning of the reaction (Barb et al.’s scheme). Rate constants as in Figure 1, [Fe2+]o = 0.04 mol dm−3 and [H2O2]o = 1 mol dm−3.
Simulation of the Fenton reaction using the model of Barb et al
The set of differential rate equations relevant to reactions of model B0–B4 were integrated numerically. [Fe2+] and [O2] versus time curves were constructed. Rate constants of Barb et al. (k0 = 12.6 mol−1 dm3 s−1, k1/k2 = 69, k3/k4 = 3.3, at 0°C and pH = 1.8) were used as parameters. Figure 1 shows the evolution in time of O2 at [H2O2]o = 1 mol dm−3 ([Fe2+]o = 0.04 mol dm−3). The evolution of O2 in two phases is clear from the graph: an initial rapid phase followed by O2 production at a reduced rate. It is reasonable to identify the first phase with the five-membered chain reaction (phase a) and ΔO2 as the amount of O2 evolved in it ([O2]a). Figure 2 shows in more detail phase (a) lasting for about 1 s. In 1 s, Fe2+ disappears nearly completely, while only about 5% or less of the maximum possible amount of O2 is formed. Transition between the phases has been defined as the state in which both ratios vB1/vB2 and vB3/vB4 have decreased to ≤ 10−3.
Since k1/k2 and k3/k4 are not identical, reaching this state between steps 1 and 2, and steps 3 and 4, respectively, occurs at different times: there exists no single transition point, but there is a transition period, the length of which varies with [H2O2]. Table 1 shows the results of some calculations. Data in the second and third columns are time elapsed since the start of the reaction until the respective transition. The upper entry in the last column gives the number of moles of O2 evolved until the first transition. The lower entry is the total amount when both transitions are complete ([O2]a). The data in the table show that by increasing [H2O2], transitions occur at shorter times and that the time difference between the transitions decreases. At high RR, transition 1–2 occurs first and transition 3–4 occurs second. The phenomenon is due to competition between steps 1 and 2.
Transition points between five- and three-membered chain reactions in the free radical model.
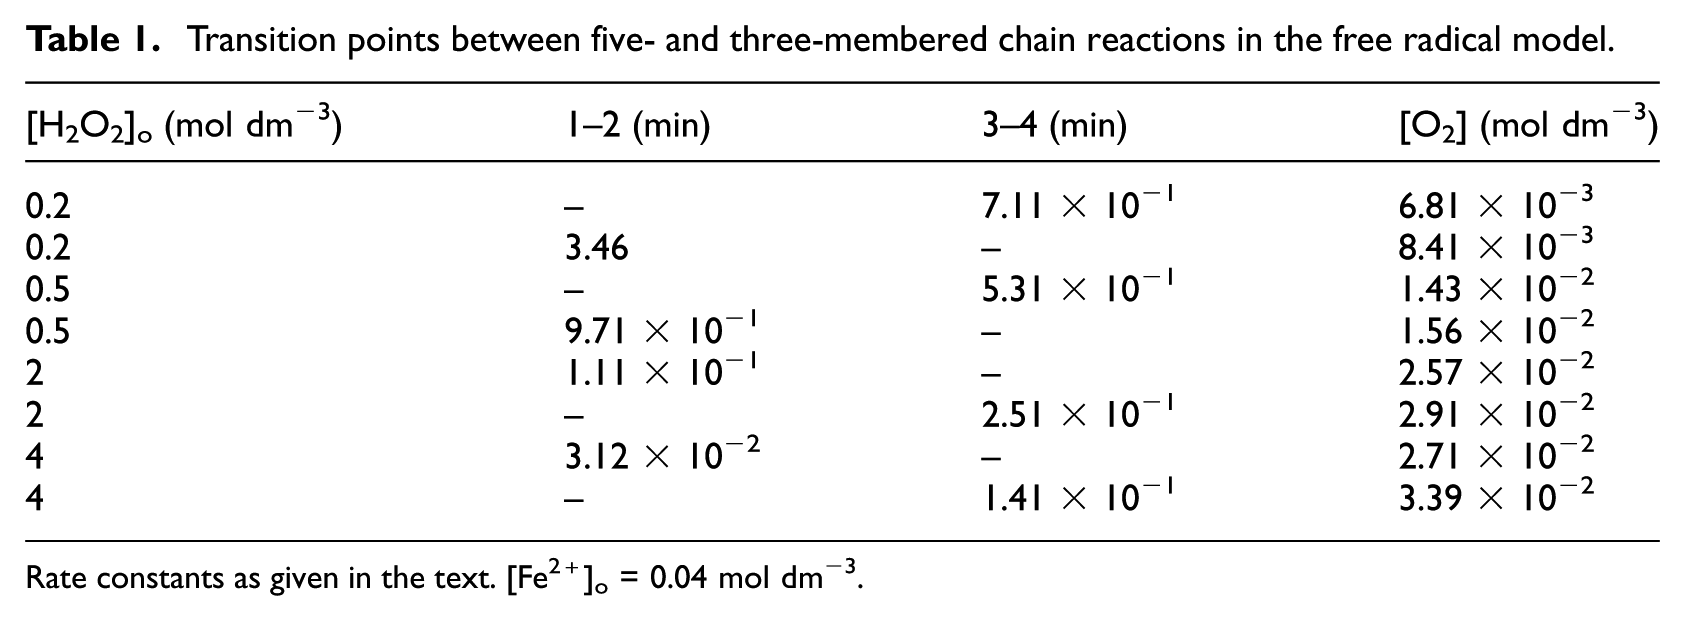
Rate constants as given in the text. [Fe2+]o = 0.04 mol dm−3.
At high RR, step 2 suppresses step 1. It retards the formation of Fe3+, and therefore tips the balance of the rates of steps 3 and 4 in favour of step 3: it retards the transition 3–4. At low RR, the situation is reversed: the competition between reactions 1 and 2 is in favour of reaction 1 (transition 1–2 retarded), formation of Fe3+ is favoured: step 4 is favoured in comparison to step 3 (transition 3–4 favoured). Viewed differently, high RR increases the rate of formation of
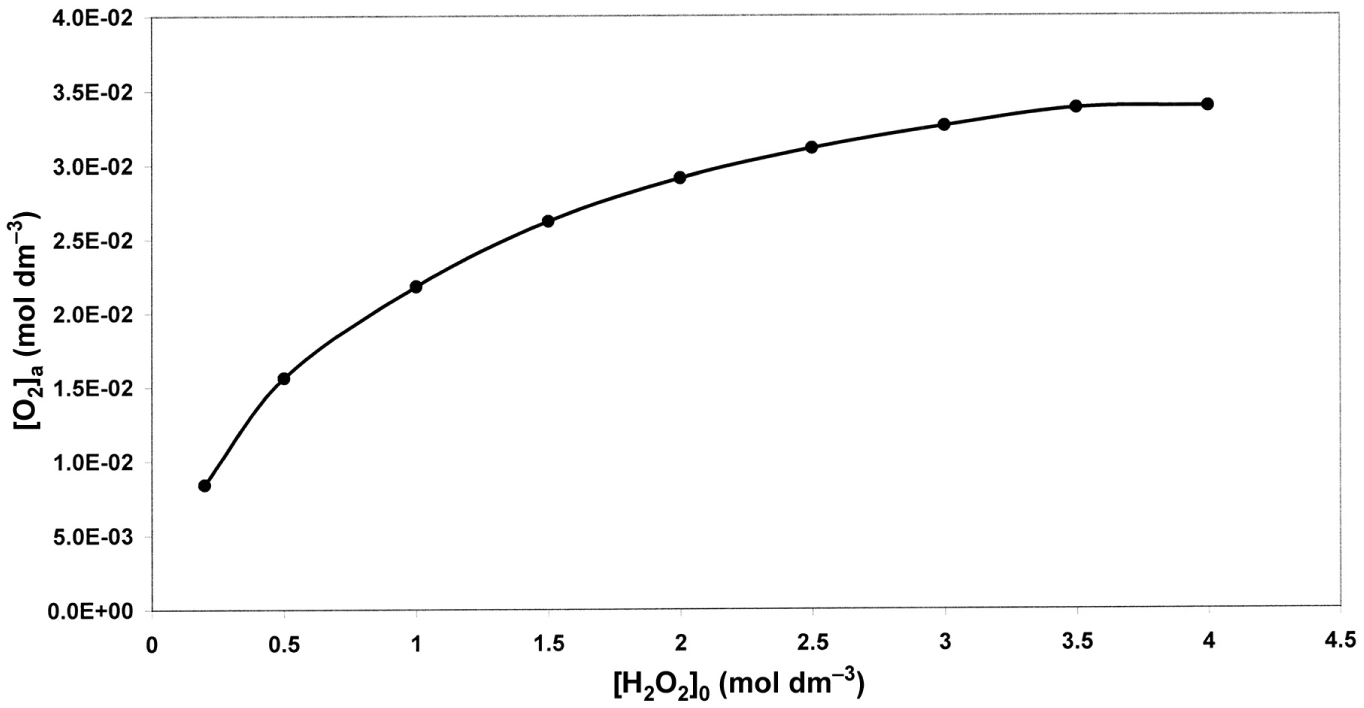
[O2] at the end of phase (a) as a function of [H2O2]o (Barb et al.’s scheme).
Non-radical model of the Fenton reaction
The alternative, non-radical model for the Fenton reaction is presented in Figure 4.5,7 The scheme departs from the principle of ‘compulsory one-eq14 oxidation and reduction of H2O2’ requiring the formation of free radicals. It starts with the formation of a precursor complex {Fe2+•H2O2}. The active intermediate FeO2+ is formed from the precursor by an internal rearrangement involving the splitting off of H2O. The active intermediate is involved in (1) the evolution of O2, (2) the oxidation of Fe2+ and (3) the oxidation of substrates, if present. There exist two channels for O2 evolution: steps 4 and 7. Step 4 is a direct reaction of the active intermediate with H2O2, and step 7 requires the participation of Fe3+ ions.
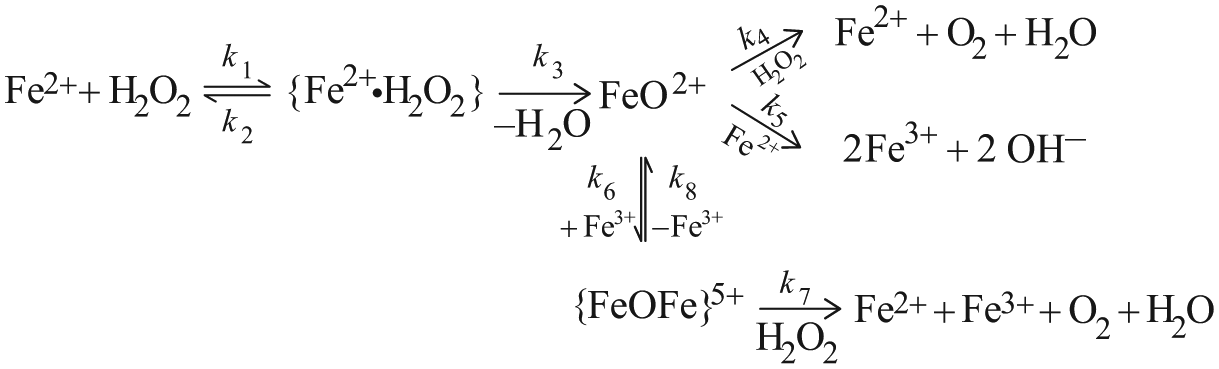
FeO2+ ion-based model of the Fenton reaction.
To reconstruct the experimental results of Barb et al., it was necessary to find rate constants which yielded [O2] versus t curves such that (1) they had a rapid initial part followed by a slow, approximately linear section and (2) when using [H2O2]o in the range 1–3.5 mol dm−3 at constant [Fe2+]o (0.04 mol dm−3), a back extrapolation of the linear section to t = 0 yielded a constant intercept (equated with the amount of O2 evolved in the rapid phase). This mode of calculation follows closely the method used by Barb et al. to determine this quantity experimentally. The curve chosen for simulation corresponds to experimental results obtained at pH = 1.8 and 0°C (Figure 6 in Barb et al. 4 ). The constant intercept to simulate was 1.4 × 10⁻² mol dm−3. Rate constants for the non-radical scheme have been obtained at 25°C using low concentrations of reactants (10−4–10−5 mol dm−3).5,7 Modifications of the kinetic treatment were therefore necessary:
Due to a 104 times increase of [H2O2] and the proportional increase of the rate of production of FeO2+, its concentration could not be assumed to be in a steady state, at least not as an initial assumption.
Due to increased [H2O2], [FeOFe]5+ could be regarded as being in a steady state. In addition, the validity of the approximation k7 [H2O2] + k8≈k7 [H2O2] at high [H2O2] was assumed.
Simulated concentration versus time curves of [FeO2+], [Fe2+] and [O2] were calculated using rate parameters
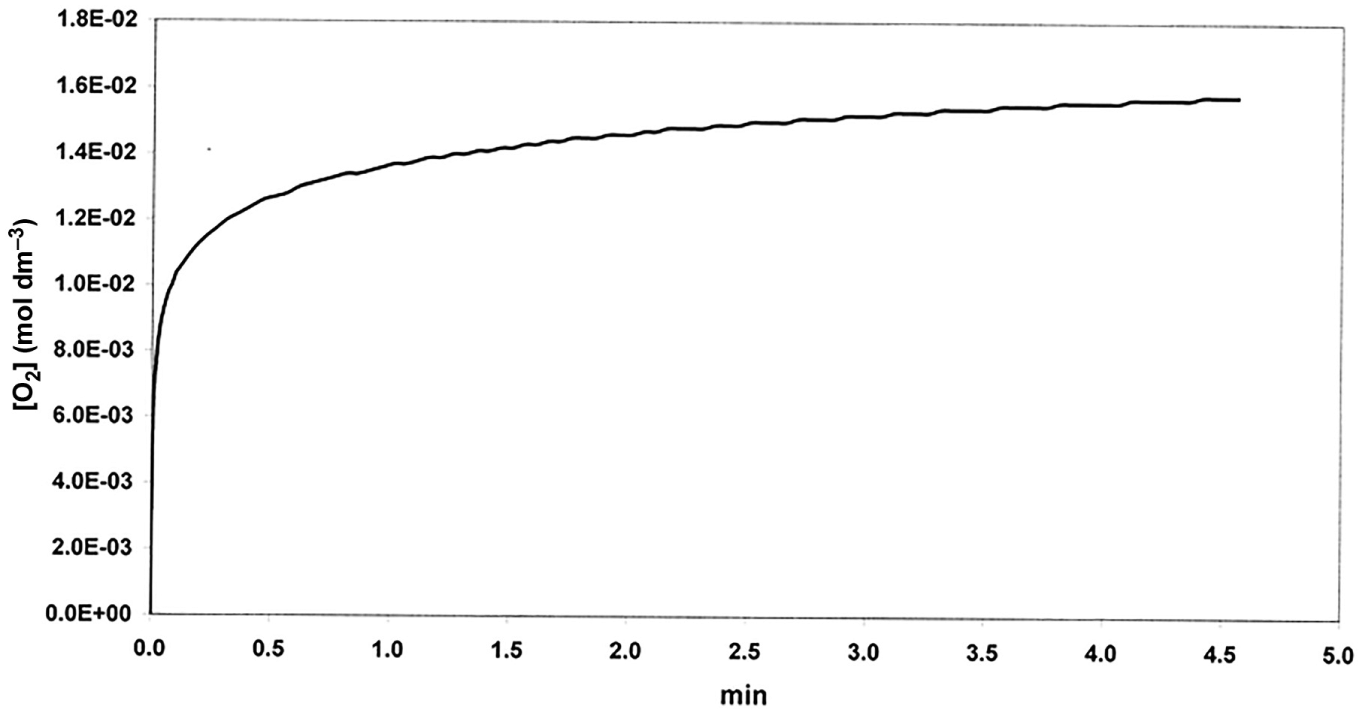
Simulated curve of O2 evolution (non-radical model).
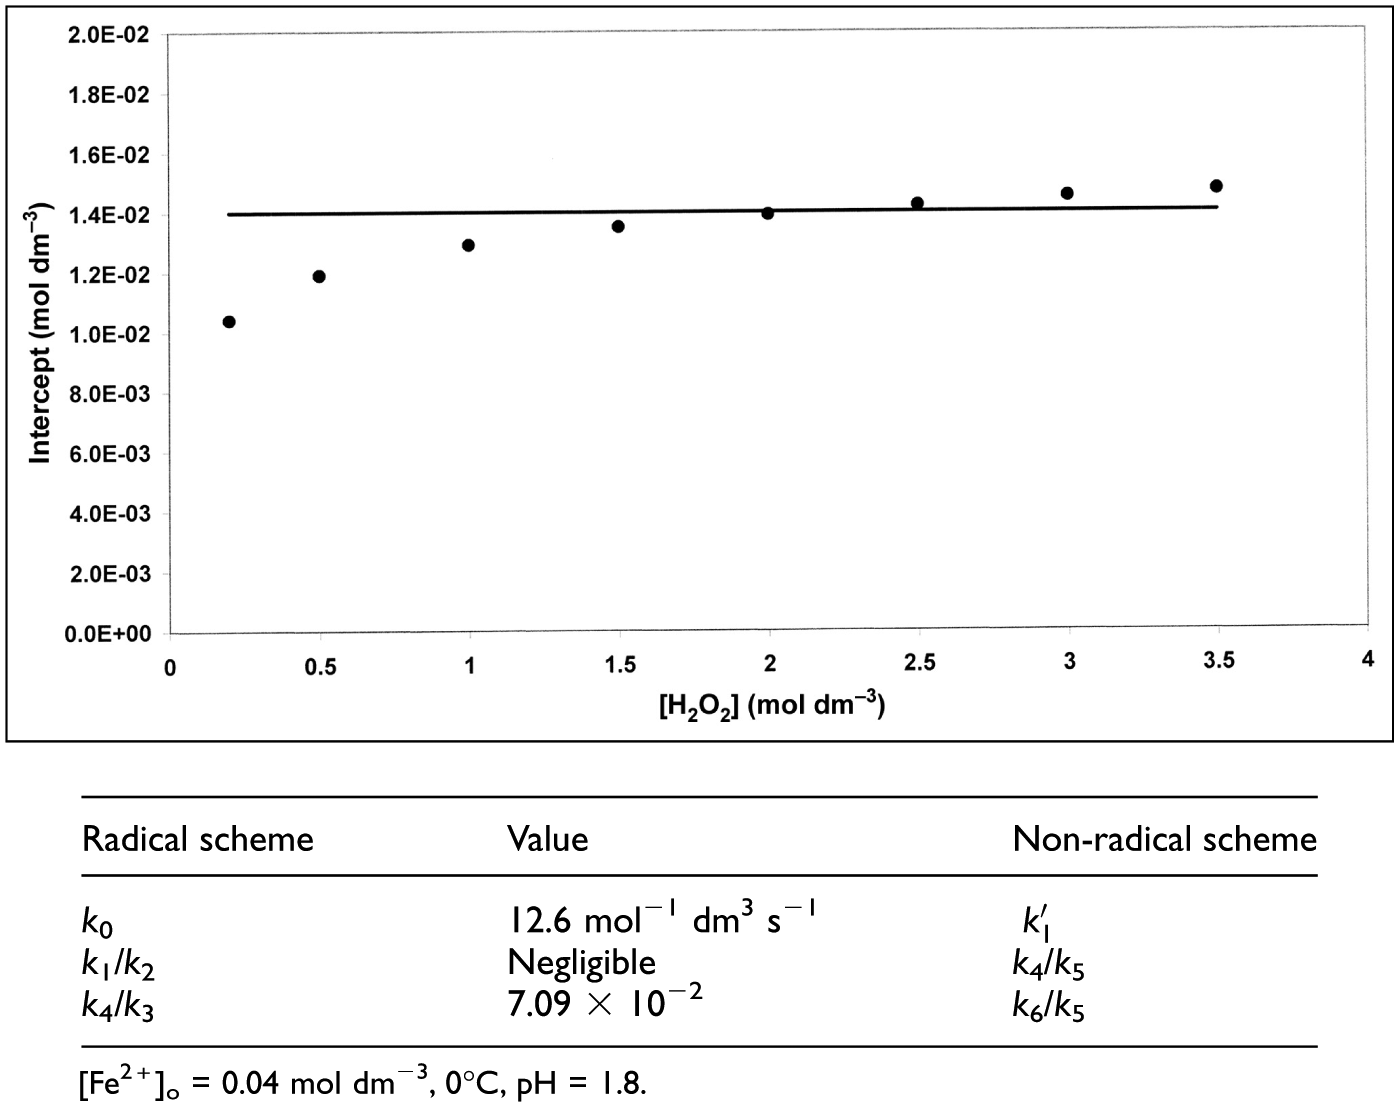
Intercepts of quasi-linear sections of simulated [O2] versus time curves (radical and non-radical models).
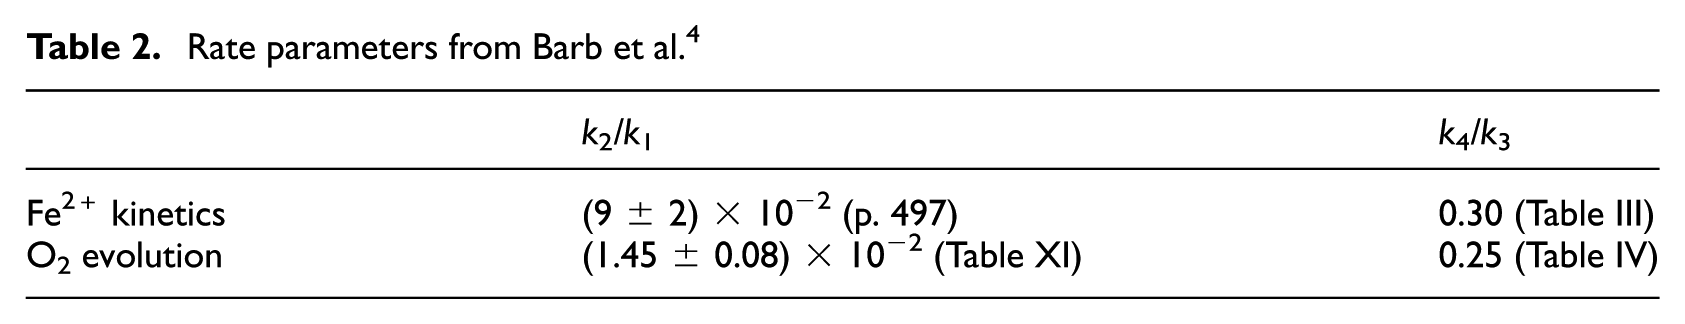
It seemed of interest to investigate the results of a curve fitting process using the free radical scheme of Barb et al. as a basis. This implied varying k1/k2 and k4/k3 while keeping k0 = 12.6 mol−1 dm3 s−1 constant. Reagent concentrations were identical to those used in simulations of the non-radical model. The legend to Figure 6 shows that identical fits were obtained when kinetically equivalent rate constants were used. An explanation of this result is given in Appendix 1. The difference between the two simulations lies in the matter of compatibility of rate constants in the models obtained under different experimental conditions. In the non-radical model, the (pH dependent) value of k6/k5 was found to be 8.1 × 10⁻² (25°C, pH = 1.8, see Kremer, 7 Table 4). Taking into account compensating changes in rate constants upon reducing the temperature to 0°C, the value obtained in the present work (7.09 × 10⁻²) is reasonable. k4/k5 is about 40 times lower than k6/k5 at 25°C. This ratio may become even lower at 0°C. In Table 2 the free radical rate parameters (0°C, pH = 1.8) from Barb et al.’s work are summarized. A comparison of these data with those appearing in the Legend to Figure 6 shows that there is no agreement between them. It appears thus that a more consistent, though still not complete account of O2 evolution data of Barb et al. can be given on the basis of the non-radical model. It may be noted however that there are uncertainties (1) in determination of the transition point between the two phases of the reaction (there is a finite time interval) and (2) identification of the intercept, obtained by back extrapolation, with [O2]a is only an approximation. It gives only an approximate value. Discussion of further aspects of radical versus non-radical mechanisms can be found in the literature.7–10
Rate parameters from Barb et al. 4
Total amount of O2 formed in the Fenton reaction
An important quantity in the analysis of the kinetics of the free radical model is the total amount of O2 formed in the Fenton reaction. This term deserves a closer examination. It is defined as O2 formed from the initial amounts of Fe2+ and H2O2 via reactions B0–B4. It consists of O2 formed partly in phase (a) and partly in phase (b) of the reaction. Phase (b) itself can be divided into two sections. Section 1 covers the time interval before the onset of the direct reaction between the Fe3+ ion and H2O2

As the reaction progresses, Bi becomes important once the ratio [Fe3+]/[Fe2+] in the reacting mixture increases beyond a certain limit (section 2). It starts a catalytic cycle for the decomposition of H2O2 (Fe3+ catalysis).
6
However, Bi will also change the course of the Fenton reaction itself (B0–B4): it will reduce the rate of disappearance of Fe2+ in two ways: (1) directly by regeneration of Fe2+ and (2) indirectly by formation of
Finally, we note that the observation of coupling of the formation of O2 to the regeneration of Fe2+ is accounted for equally well by the radical and non-radical models4,5


Conclusion
The Haber Weiss reaction
The basic assumption of Haber and Weiss was the formation of OH•. radicals in the reaction between H2O2 and Fe2+. It was regarded as the key intermediate involved in the formation of O2. Reacting with H2O2 it was assumed to produce


These reactions have been examined and found also to lead to incorrect kinetics. 9 This exhausts the possibilities of forming O2 within the free radical scheme. It is concluded therefore that the reaction.

does not occur.
Footnotes
Appendix 1: Two models,identical kinetics
One has to follow the route of O2 evolution. In the non-radical case, the active intermediate FeO2+ participates in three simultaneous competitive reactions: reaction with H2O2 (step 4), with Fe2+ (step 5) and reaction with Fe3+ (step 6). Provided that k4/k5 << 1, the rate of O2 evolution will be determined (1) by the rate of the initial step (
Declaration of conflicting interests
The author(s) declared no potential conflicts of interest with respect to the research, authorship, and/or publication of this article.
Funding
The author(s) received financial support for the research, authorship, and/or publication of this article: The research was supported by a grant from the Hebrew University for Emeriti.