
Abstract
The full-hybrid system with a spark ignition engine is essential for the future powertrain systems in passenger cars. However, many aspects of three-way catalysts remain unclear, necessitating urgent clarification. Simultaneously, modeling the phenomenon and establishing numerical prediction technology are required. The effect of surface oxidation after exposure in abundant O2 surroundings encountered during not only fuel cut-off at deceleration, but also engine stop of HEV on the purification performance of Rh, which is one of the highest performing precious metals supported on three-way catalysts, was investigated by CO-O2 light-off test and XPS analysis in the previous research. The light-off curve started to rise at higher temperature in the case of pretreatment in the lean atmosphere than in the rich atmosphere, and the results of XPS analysis showed that the reversible oxide film was formed in the lean atmosphere. In this study, the CO-NO light-off test was repeated twice after lean atmosphere pretreatment. The rise of the second light-off curve was significantly faster and almost coincided with the light-off curve after hydrogen reduction treatment, suggesting that the oxide film formed in the lean atmosphere may be decomposed during the CO-NO light-off test. By adding the reactions that describe the decomposition of oxide film by carbon and nitrogen adsorbed on the surface to the detailed surface reaction model developed in the previous research, CO-NO light-off on Rh surface were simulated and could reasonably reproduce the result of experimental results. Through this research, the phenomenological model of oxide film formation and decomposition on Rh surface and the effect of Rh oxidation to the purification performance have been proposed.
Keywords
Introduction
It is projected that even in 2030 and 2050, internal combustion engine vehicles and hybrid vehicles will still account for more than 80% of new passenger car sales. Because automotive exhaust gas emission regulations have become increasingly stringent, the use of three-way catalysts, which are essential for reducing emissions from spark-ignition engine vehicles, will remain indispensable.1–3 A three-way catalyst is a device that converts the three harmful components found in the exhaust gas of spark-ignition engines—carbon monoxide (CO), hydrocarbons (HC), and nitrogen oxides (NOx)—into harmless substances such as nitrogen (N2), water (H2O), and carbon dioxide (CO2). The active metals used in three-way catalysts include platinum (Pt), palladium (Pd), and rhodium (Rh).
The surface state of these precious metals decides the purification performance of the catalyst. It is said that the surface state of these precious metals may be changed by driving conditions of vehicles with spark-ignition engines. When the power demand increases because of sudden acceleration or towing on long slope, and the charge temperature decreases due to both the enrichment and the latent heat of the evaporation of fuel under high power conditions, the excess air ratio in spark ignition engines becomes rich and it causes HC poisoning on the metal surface. On the other hand, when the engine stops in a strong hybrid system, fuel supply is cut off during deceleration or disturbance of λ switching happens, air suddenly pours in and the excess air ratio in spark ignition engines becomes lean, which forms an oxide film on the metal surface. These phenomena result in deterioration of purification performance. Thus, it is necessary to elucidate the mechanisms by which these phenomena occur and to implement countermeasures that can recover from these phenomena as soon as possible for maintaining high catalytic purification performance.
When comparing the characteristics of precious metals, Rh has been shown to retain its small particle size even after prolonged high-temperature use, resulting in a higher number of active sites than Pt and Pd. This is considered as the main reason for Rh’s superior exhaust gas purification performance. Although Rh is approximately five times more expensive per gram than Pt and Pd, 4 many Rh atoms remain exposed on the catalyst surface even after durability testing at 1000°C, despite its lower loading amount. Iwachido compared the number of atoms exposed on the surface of various precious metal particles per 1.0 l of catalyst volume after 40 h of pretreatment under the SLR (Stoichiometric, Lean and Rich) cycle at 1000°C. 5 It is evident that Rh exhibits the highest increase in surface atom count with increasing loading amount. Rh at 0.8 g/l, Pt at 10.0 g/l, and Pd at 4.0 g/l all have the same number of surface atoms. Therefore, when comparing cost per surface atom, Rh and Pd are approximately equivalent, while Rh is about 40% the cost of Pt. Iwachido also compared the emission characteristics of Rh, Pt, and Pd catalysts with the same loading amount of 2.0 g/l. 5 It shows that Rh has significantly better NOx purification performance than Pt and Pd at the same loading level. This is presumed to be due to its high dispersion resulting from its small particle size. Based on these findings, this study focuses on Rh catalysts, which maintain relatively high performance even after thermal aging and are most suitable for NOx purification.
Although Rh catalysts possess such favorable characteristics, it has been confirmed that their purification performance varies depending on the oxidation state of the precious metal surface as mentioned earlier. Gustafson et al. 6 investigated the relationship between catalyst surface state and its activity. The SXRD (Surface X-Ray Diffraction) measurements were performed for Pd and Rh and these two precious metals showed different characteristics on the surface oxidation effect. Figure 1 illustrates the progression of oxide formation on Pd in panels a, b, and c. Panel a represents the surface oxide, panel b shows the thin epitaxial bulk oxide, and panel c depicts the state where the oxide has grown sufficiently thick. In states a and b, the PdO surface exposing coordinatively unsaturated Pd atoms (light blue spheres in the figure) acts as active sites. However, in state c, the surface exposes a more stable plane without any coordinatively unsaturated Pd atoms, resulting in decreased activity. In other words, it has been clarified that Pd noble metal exhibits activity comparable to its metallic state even under oxidized conditions, as long as a sufficiently thick oxide film does not form on the surface.
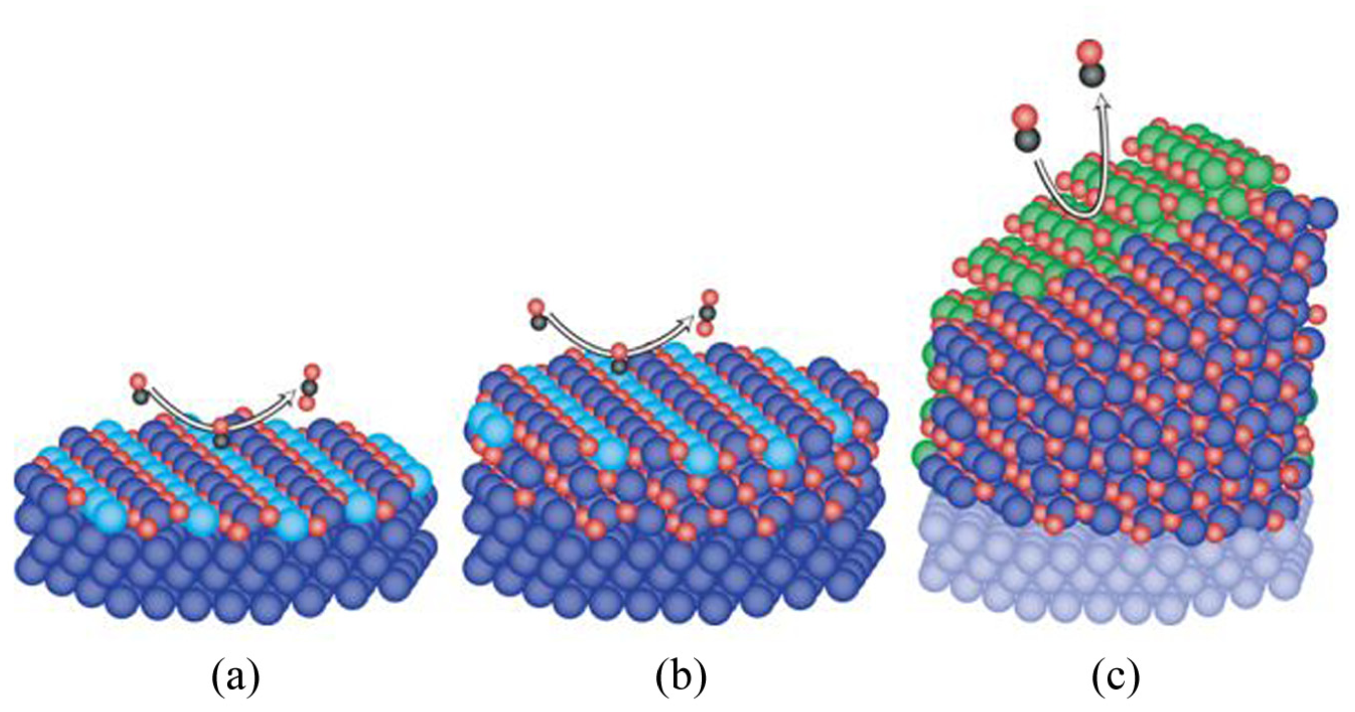
The models of the oxide structures on Pd. 6 (Red spheres represent oxygen atoms, black spheres represent carbon atoms, light blue spheres represent coordinatively unsaturated Pd atoms (active sites), light green spheres represent many crystallites with random orientation (non-active sites)).
On the other hand, Gustafson et al. 6 concluded that metallic Rh exhibits higher catalytic activity than oxidized Rh by the following experimental results. From the temperature change of the analysis sample and the variation in CO2 production based on MS (Mass Spectrometry) analysis when 59 ml/min of O2, 33 ml/min of CO, and 8 ml/min of Ar were supplied at 1 atm and 0°C, it is evident that the amount of CO2 produced remains constant even as the temperature decreases, indicating that the reaction is not temperature-dependent but rather limited by mass transport. Furthermore, comparing this and the signal of surface oxides obtained from SXRD analysis, it can be inferred that even as oxidized Rh decreases, CO2 production remains unchanged. This suggests that after the oxide is removed and oxygen supply from the oxide ceases, the reaction continues on the metallic surface via mass transport, leading to sustained CO2 generation. Figure 2 shows that CO oxidation reaction occurs only on the metal surface and surface oxide hinders the reaction.
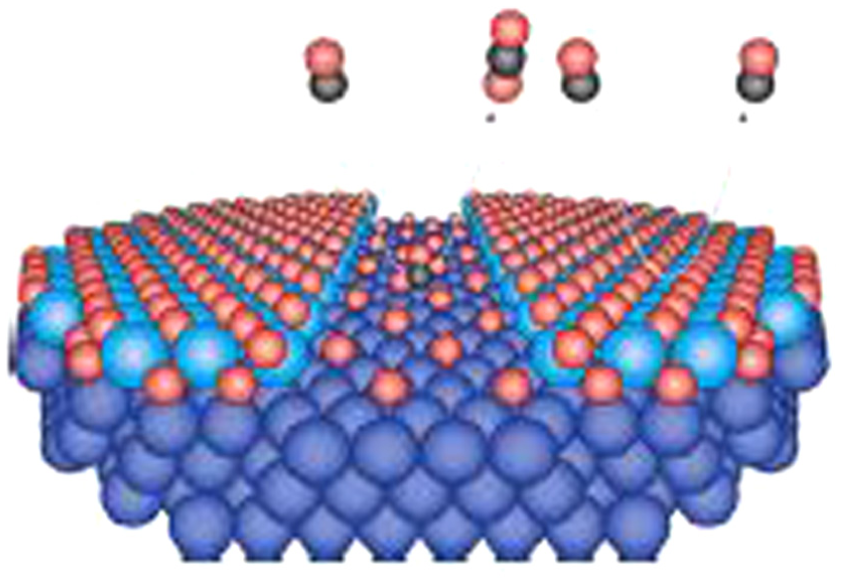
The models of the oxide structures on Rh. 6 (Red spheres represent oxygen atoms, black spheres represent carbon atoms).
In addition to CO oxidation reactions, the oxidation state of the Rh surface has also been shown to affect the purification performance of gas mixtures containing the four major exhaust components: CO, NO, C3H6, and C3H8. Li et al. conducted light-off tests using Rh/Al2O3 catalysts. 7 Compared to the untreated catalyst, the temperature at which the purification rate reaches 50% (T50) increased by approximately 60°C for all chemical species in using the catalyst oxidized at 950°C. This suggests that the oxidation treatment at 950°C altered the state of the Rh catalyst surface, leading to a decline in purification performance.
Furthermore, similar phenomena have been observed not only with Rh but also with Pd. Xiong et al. 8 investigated the effect of Pd surface states on C3H6 light-off performance using Pd/Al2O3 catalysts. The fastest light-off curve rise was observed when the catalyst was reduced at 225°C for 1.5 h using 5% H2, which is believed to result in a fully metallic Pd surface due to hydrogen reduction. When the same catalyst was reused for the second light-off test after the initial one, the light-off curve rose more slowly, suggesting that the gas composition during the first test partially oxidized the Pd surface, leading to reduced purification performance. Additionally, when the catalyst was treated with 20% O2 at 450°C for 2 h, the light-off curve shifted to a temperature approximately 100°C higher. This is presumed to be due to the complete oxidation of Pd to PdO. These results confirm that, like Rh, Pd also experiences a decline in purification performance upon oxidation.
Kang et al. 9 compared the durability effects of oxidation on Pd and Rh catalysts by exposing them to atmospheres with oxygen concentrations ranging from 3% to 21% at 600°C. In this study, Rh catalysts were found to degrade more severely under oxidizing conditions, and it was concluded that the diffusion of Rh2O3 into the catalyst support is one of the main causes of reduced three-way catalytic activity.
Based on these findings, the development of three-way catalysts that improve low-temperature activity, high-temperature durability, and NOx purification performance is particularly important. While Rh remains a promising candidate due to its ability to maintain high performance even after thermal aging, it has also been suggested that the oxidation state of Rh has a greater impact on durability compared to other precious metals.
Previous studies have confirmed that the light-off characteristics, which indicate purification performance at various temperatures, vary depending on the oxidation state of precious metals such as Rh and Pd. However, the underlying mechanisms remain largely unclear. Although detailed surface reaction mechanisms for the CO–O2 system on Pt/Al2O3 and Rh/Al2O3 have been developed by Shimokuri et al. 10 based on measurements of gas-phase and surface species, the influence of oxide film was not considered.
In spark-ignition engines, exposure of three-way catalysts to oxygen-containing atmospheres at relatively high temperatures can occur during fuel cut-off in deceleration, idle-stop conditions, and repeated engine start-stop cycles in strong hybrid systems as mentioned earlier. Since strong hybrids are expected to be central to passenger car powertrains, it is crucial to clarify the oxidation behavior of Rh metal and the degradation mechanisms of purification performance caused by oxidation.
We also investigated the effect of catalyst pretreatment conditions on light-off test performance. 11 To isolate the oxygen supply pathway, we used a Rh/Al2O3 catalyst without oxygen storage functionality. Using XPS analysis, we examined the surface state after pretreatment under rich (CO 6800 ppm, O2 3200 ppm, 600°C × 20 min) and lean (CO 6500 ppm, O2 3500 ppm, 600°C × 20 min) atmospheres. The results indicate that even after rich pretreatment, the catalyst surface does not become fully metallic; about 30% remains covered by trivalent oxide films. Lean pretreatment further increases the oxide fraction and decreases the metallic fraction. From this, we infer the presence of two types of oxide films: a reversible type that forms and decomposes depending on rich ⇄ lean conditions, and an irreversible type that does not decompose even under rich conditions. Here, “irreversible” means it cannot be removed under typical spark-ignition engine operating conditions. The oxide film observed after rich pretreatment is considered irreversible, whereas the additional oxide formed under lean conditions is likely reversible.
Furthermore, after pretreatment under rich (CO 6750 ppm, O2 3200 ppm) and lean (CO 6400 ppm, O2 3350 ppm) atmospheres, CO + O2 light-off tests were conducted. It was confirmed that the light-off curve rises in the order of rich followed by lean pretreatment. Comparing the temperatures at which the purification rate reaches 50% (T50), the catalyst pretreated under lean conditions showed a temperature approximately 10°C higher than that of the catalyst pretreated under rich conditions. Combined with the XPS analysis results, it is inferred that the 20% difference in metallic Rh content contributed to the 10°C increase in T50.
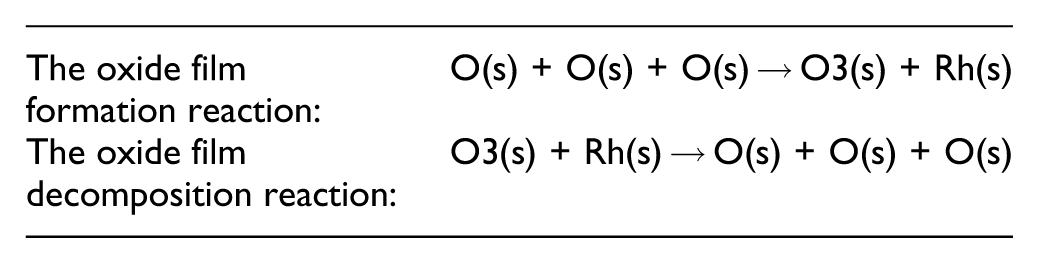
Based on these experimental results, two hypotheses regarding the Rh surface state and purification performance were proposed. To verify them, numerical simulations were conducted by a phenomenological model that describes the formation and decomposition of oxide films, incorporated into the reaction scheme of “Catalytic Oxidation of Carbon Monoxide over Rhodium” by Karadeniz et al. 12 as the following. Here, it is noted that O3(s) possesses two active sites.
The first hypothesis states that trivalent Rh (Rh2O3:O3(s)) forms as an oxide film via the intermediate RhO:O(s), reducing the number of active sites and thereby deteriorating light-off characteristics. The second hypothesis assumes that under relatively high-temperature lean conditions, the conversion from RhO:O(s) to Rh2O3:O3(s) is approximately 9%, based on XPS results. Under rich conditions at the same temperature, Rh2O3 converts back to RhO:O(s), resulting in final surface compositions of 20% RhO:O(s) and 28% Rh2O3:O3(s), also supported by XPS data. The simulation results reasonably explained the experimental findings from XPS and light-off tests. 13
As the next step in clarifying the effect of Rh oxide films on purification reactions, this study conducts experiments and numerical analysis on the CO + NO system by adding NO to the supplied gas. This approach aims to reveal the influence of NO on the formation and decomposition processes of surface oxides, including Rh2O3, which were not considered in the previous models. Although the actual structure of Rh oxide films remains under investigation, the purpose of this numerical model is not to precisely describe the structure or formation process of the oxide film. Rather, it is to reasonably explain the degradation in three-way catalyst purification performance caused by Rh oxide films and to provide predictive insights from the perspective of spark ignition engine model-based development.
Catalyst specifications
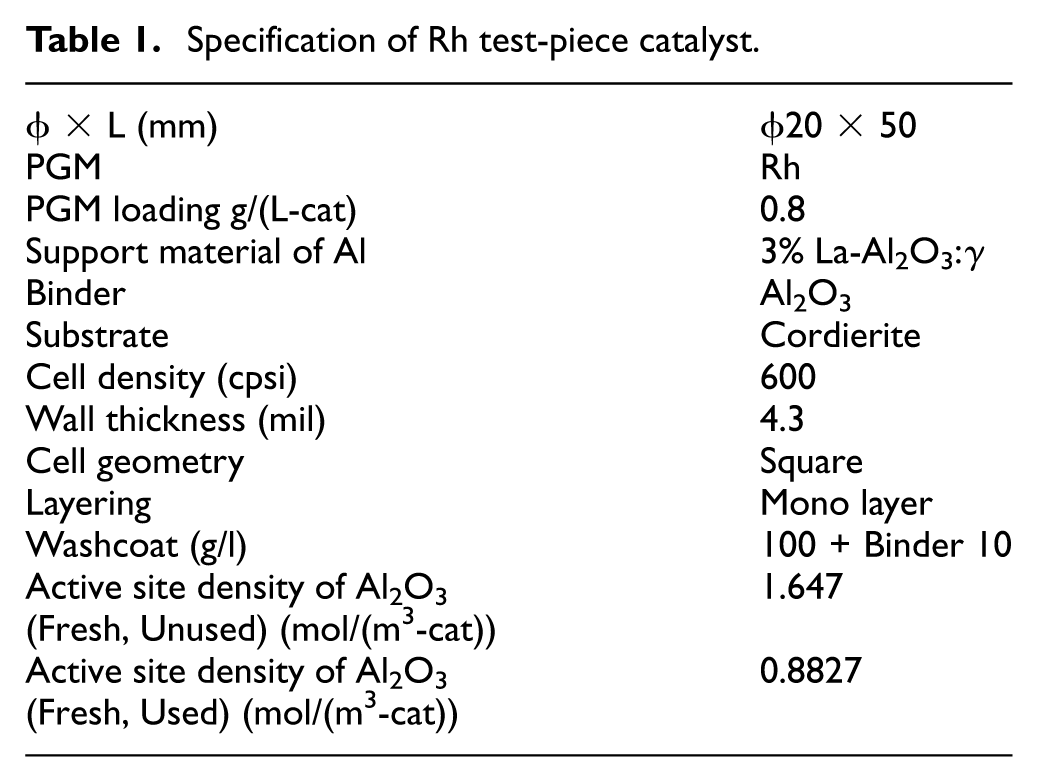
The catalyst targeted in this study is a fresh Al2O3 catalyst, as previously reported, in order to simplify the oxygen supply path to the Rh surface from the gas phase only. Detailed specifications of the catalyst are shown in Table 1. Regarding the active site density, both the value for the unused catalyst and the value estimated by the CO adsorption 14 method in the previous report for the used one are listed. In the model calculations described later, the value obtained by the CO adsorption method is used.
Specification of Rh test-piece catalyst.
Synthetic gas test bench
Via high-pressure gas cylinders, oxygen (O2 100%), carbon dioxide (CO2 100%), carbon monoxide (CO + N2 20%), nitrogen oxide (NO + N2 20%) and propylene (C3H6 + N2 20%), and nitrogen (N2 100%) generated by a nitrogen generator are introduced into the cylindrical reactor of the Synthetic Gas test Bench (SGB). Additionally, when supplying water (H2O), liquid H2O is pressurized using a liquid chromatography pump, allowing arbitrary gas compositions to flow into the reactor. The composition and flow rate of the synthetic gas are controlled by mass flow controllers operated via a personal computer. The gas is then heated to the target temperature by an infrared furnace with temperature control provided by a chiller (Orion, RKE1500A-V), before being introduced into the reactor. The gas concentrations at the inlet and outlet of the reactor, where the catalyst test piece is mounted, are simultaneously measured using a Fourier Transform Infrared Spectroscopy (FTIR) exhaust gas analyzer (HORIBA, MEXA-ONE-FT).
Surface area of the catalyst
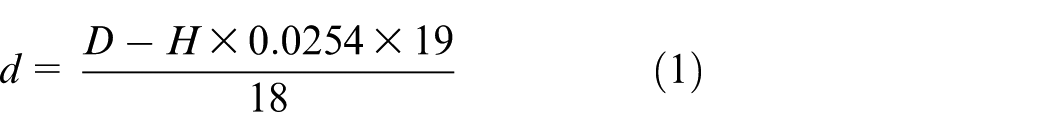
The surface area of the catalyst is calculated by summing the surface areas of individual cells (channels), assuming each cell coated is cylindrical as shown in equation (4). Each side of the test piece contains 18 cells. Therefore, the diameter of a single cell is calculated using equation (1), and the surface area of one cell is determined using equation (2). The total number of cells is calculated from the cell density using equation (3). This value is used in simulation.


Conversion rate
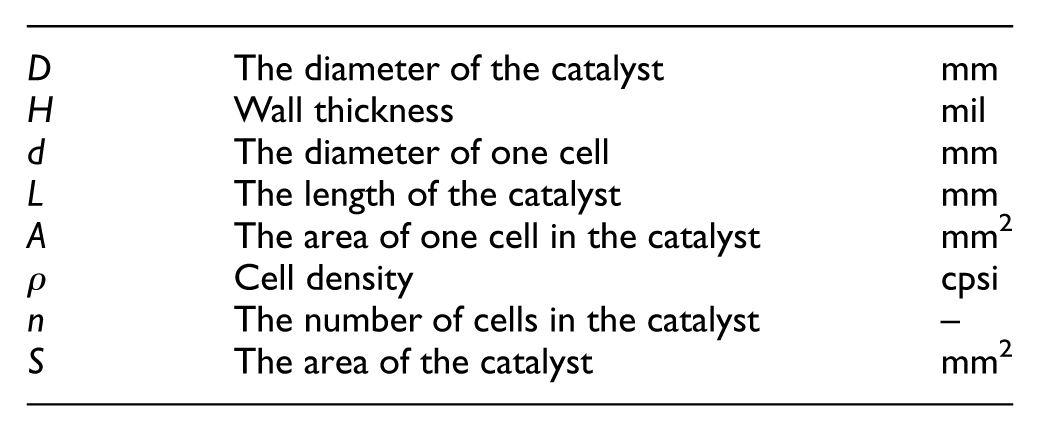
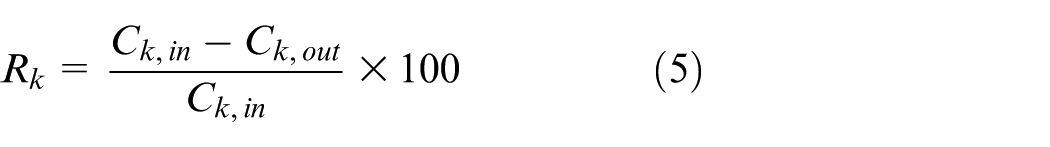
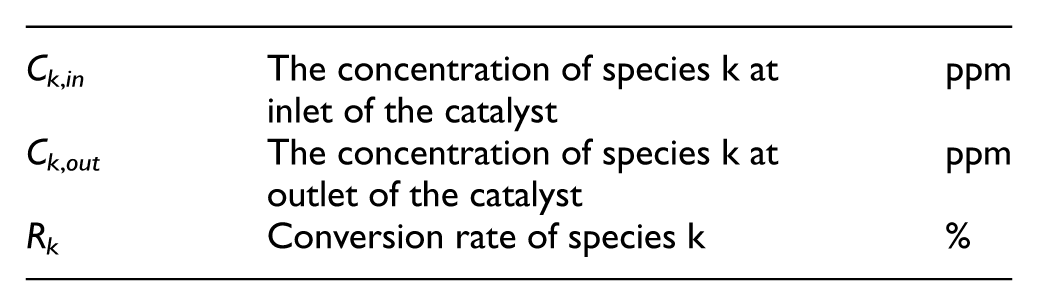
As indicated in equation (5), the purification rate is calculated from the difference between the catalyst inlet and outlet concentrations.
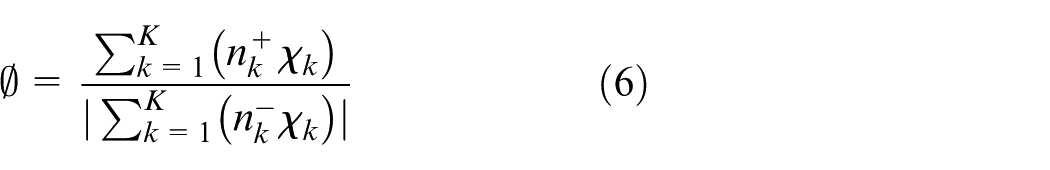
Equivalence ratio
The equivalence ratio (Φ) is calculated by the following equation using valencies of C(+4), H(+1), O(−2), and N(0) atoms.
Results and discussions
Light-off experiment after rich or lean pretreatment
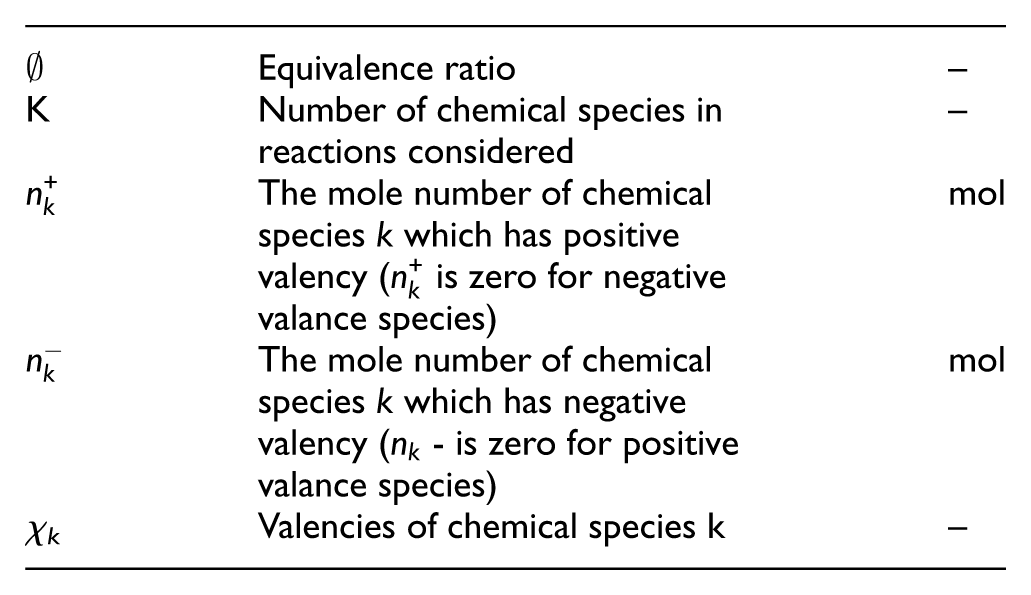
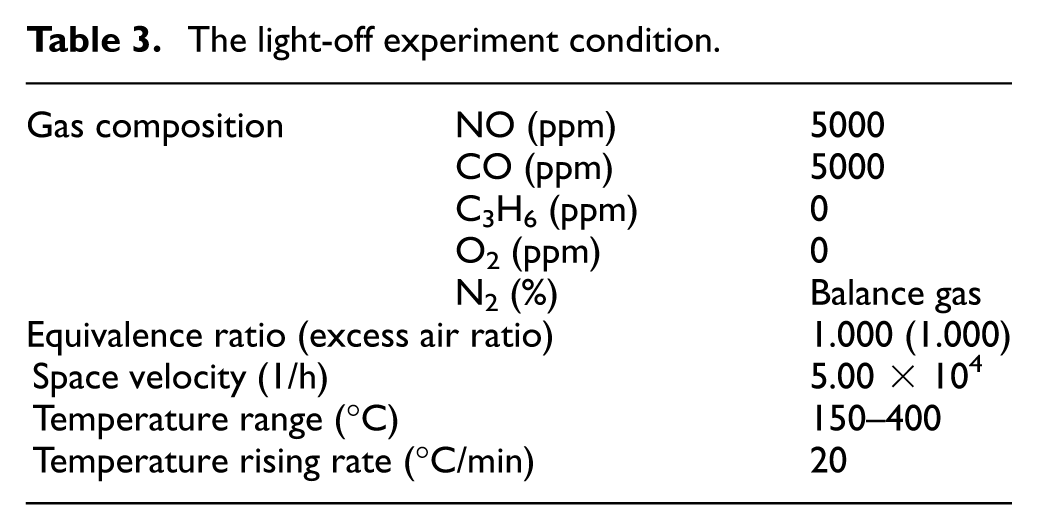
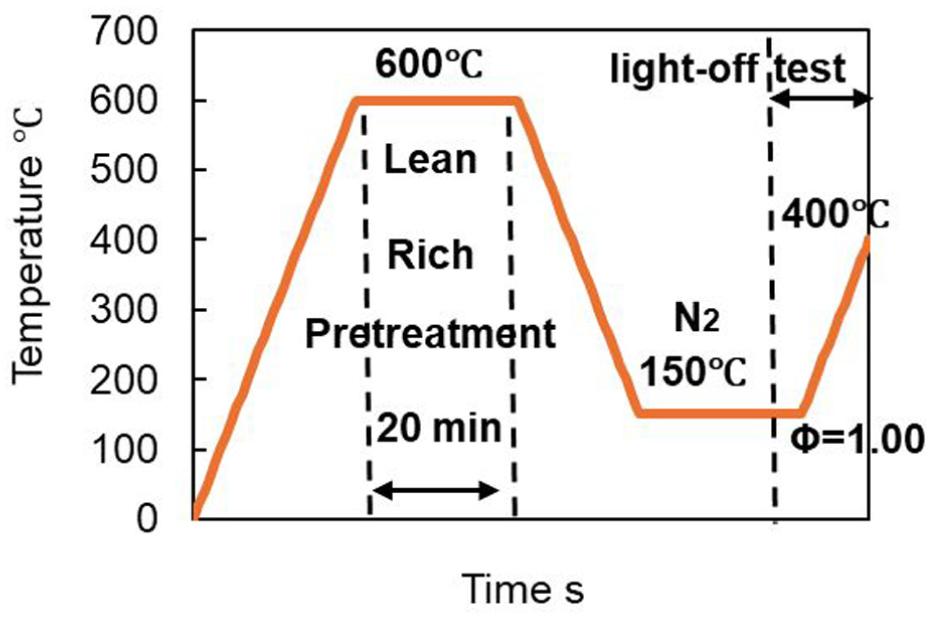
To investigate the difference in purification performance of the catalyst between the oxidized and metallic states of Rh, a pretreatment was conducted by flowing two gases—CO and O2—under either rich or lean equivalence ratio conditions. After the pretreatment, a light-off test was performed by flowing CO and NO under stoichiometric conditions. The pretreatment conditions for rich and lean atmospheres are shown in Table 2, and the experimental conditions for the light-off test are shown in Table 3. The test program is illustrated in Figure 3.
Gas composition of pretreatment prior to the light-off test.
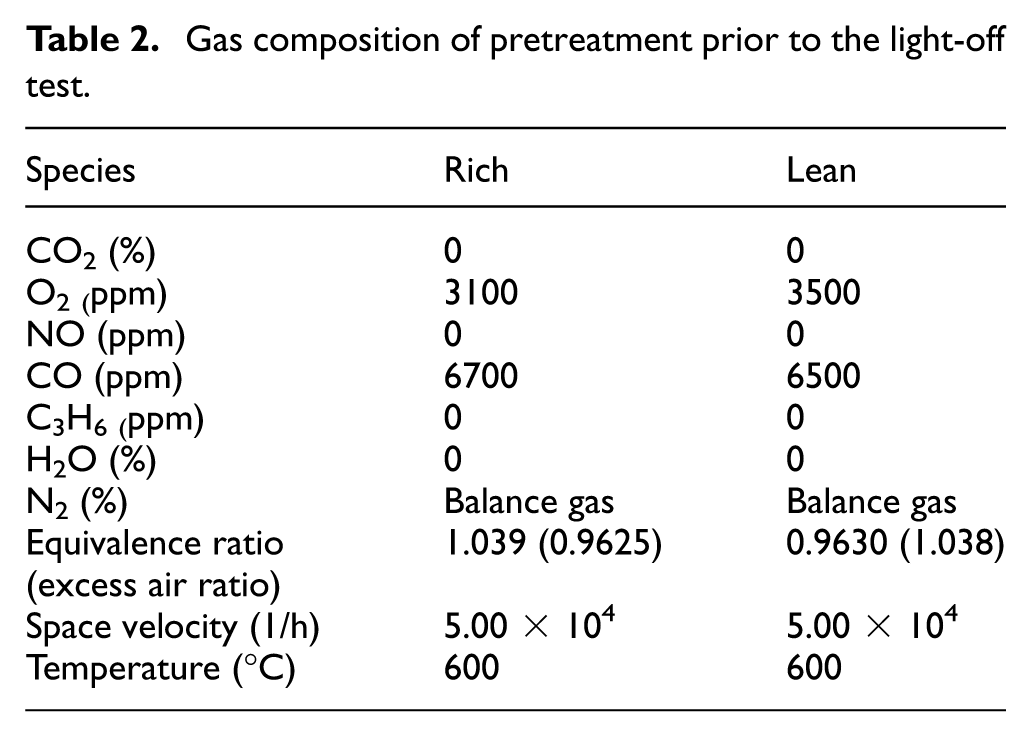
The light-off experiment condition.
The light-off experiment program after rich or lean pretreatment.
First, the temperature was raised to 600°C, and CO and O2 were flowed with a composition that resulted in either a rich or lean equivalence ratio to perform the pretreatment. Then, under an inert atmosphere of 100% N2, the temperature was lowered once and subsequently raised from 150°C to 400°C at a rate of 20°C/min. During this process, a mixed gas containing 5000 ppm of CO and 5000 ppm of NO, as specified in Table 3, was introduced into the reactor, and the concentrations of CO, NO and CO2 at each temperature were measured.
Figure 4 shows the results of the light-off tests for the CO-NO gas mixtures with different pretreatment equivalence ratios. In the figure, the 50% conversion rate is indicated by a dashed line. It was confirmed that for both CO and NO, the light-off curves rose in the order of rich pretreatment followed by lean pretreatment. Thus, it is suggested that the surface after rich pretreatment is more active than that after lean pretreatment. Comparing the temperatures at which the purification rate reached 50% (T50), the lean pretreatment resulted in a temperature approximately 16°C higher than that of the rich pretreatment. These results suggest that pretreatment under a lean atmosphere may lead to the formation of an oxide film on the surface, which slows down the purification reaction rate and consequently increases the light-off temperature.
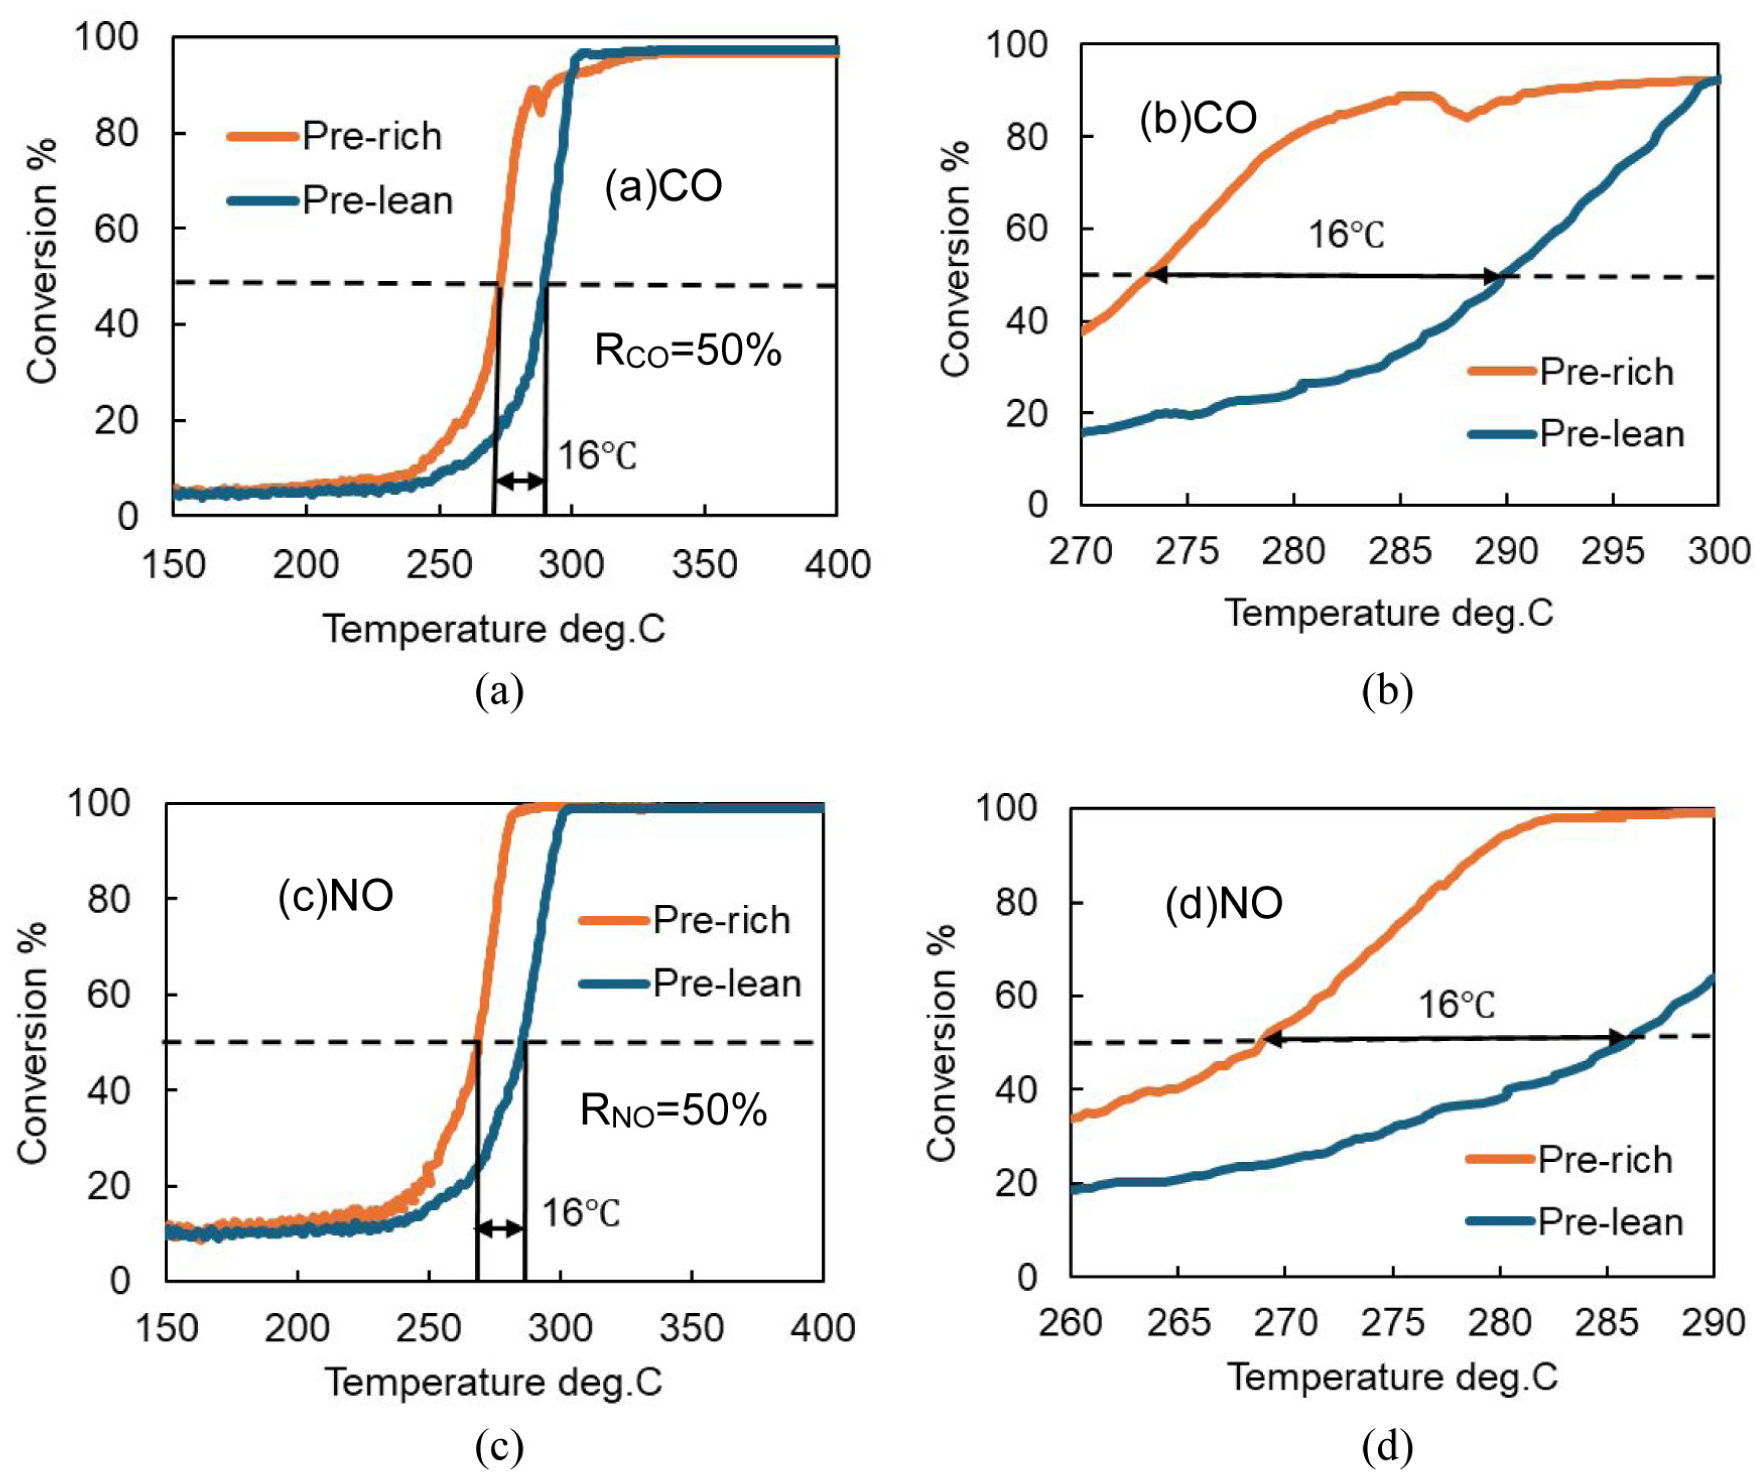
Comparison of CO-NO light-off curves between rich and lean pre-treatment conditions. (a) CO, horizontal axis range: 150–400°C; (b) CO, enlarged range: 270–300°C; (c) NO, horizontal axis range: 150–400°C; (d) NO, enlarged range: 260–290°C, pre-lean (CO 6500 ppm, O2 3500 ppm, 600°C × 20 min), pre-rich (CO 6700 ppm, O2 3100 ppm, 600°C × 20 min), light-off (CO 5000 ppm, NO 5000 ppm, 150–400°C, 20°C/min).
Light-off tests repeated twice after lean pretreatment
Next, to determine whether the oxide film presumed to have formed during lean pretreatment remains intact or decomposes after the first light-off performance, the light-off test was repeated twice. Specifically, the catalyst that underwent lean pretreatment as described in Section 3.1 and was used in the first light-off test was subjected to a second light-off test. The test program is shown in Figure 5. Additionally, to compare surface conditions based on changes in the light-off curves, a light-off test was also conducted using a catalyst whose surface was fully reduced to the metallic state via hydrogen reduction, under the same gas composition. The lean pretreatment composition and the gas composition for the light-off test are shown in Tables 2 and 3, respectively, while the hydrogen reduction conditions are presented in Table 4.
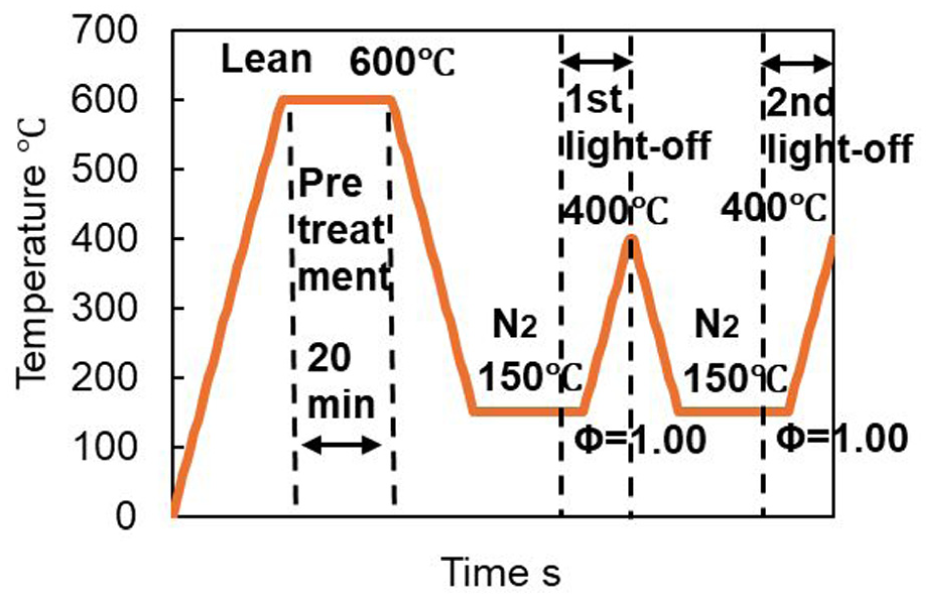
The light-off experiment program repeated twice after lean pretreatment.
H2 reduction condition.
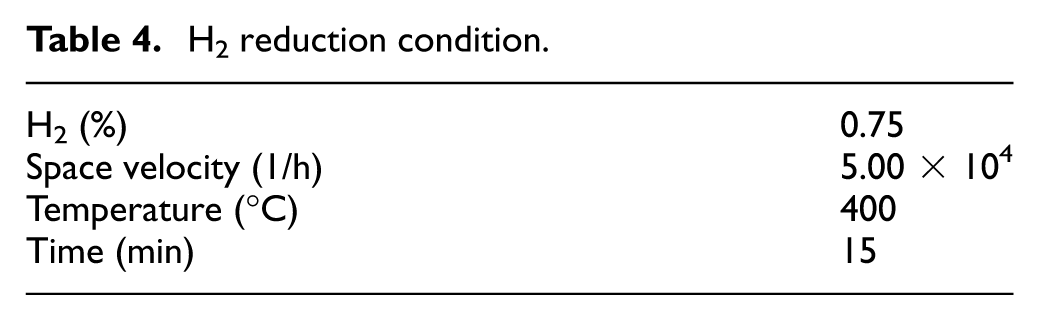
Figure 6 shows the results of the repeated light-off tests after lean pretreatment, as well as the results of the light-off test conducted after the oxide film was removed by hydrogen reduction. Compared to the first light-off curve, the second light-off curve showed a much faster rise and closely matched the curve obtained after hydrogen reduction. This suggests that the oxide film formed during lean pretreatment was completely decomposed during the first light-off test, returning the surface to a metallic state and thereby improving purification performance which is almost the same as that after hydrogen reduction.
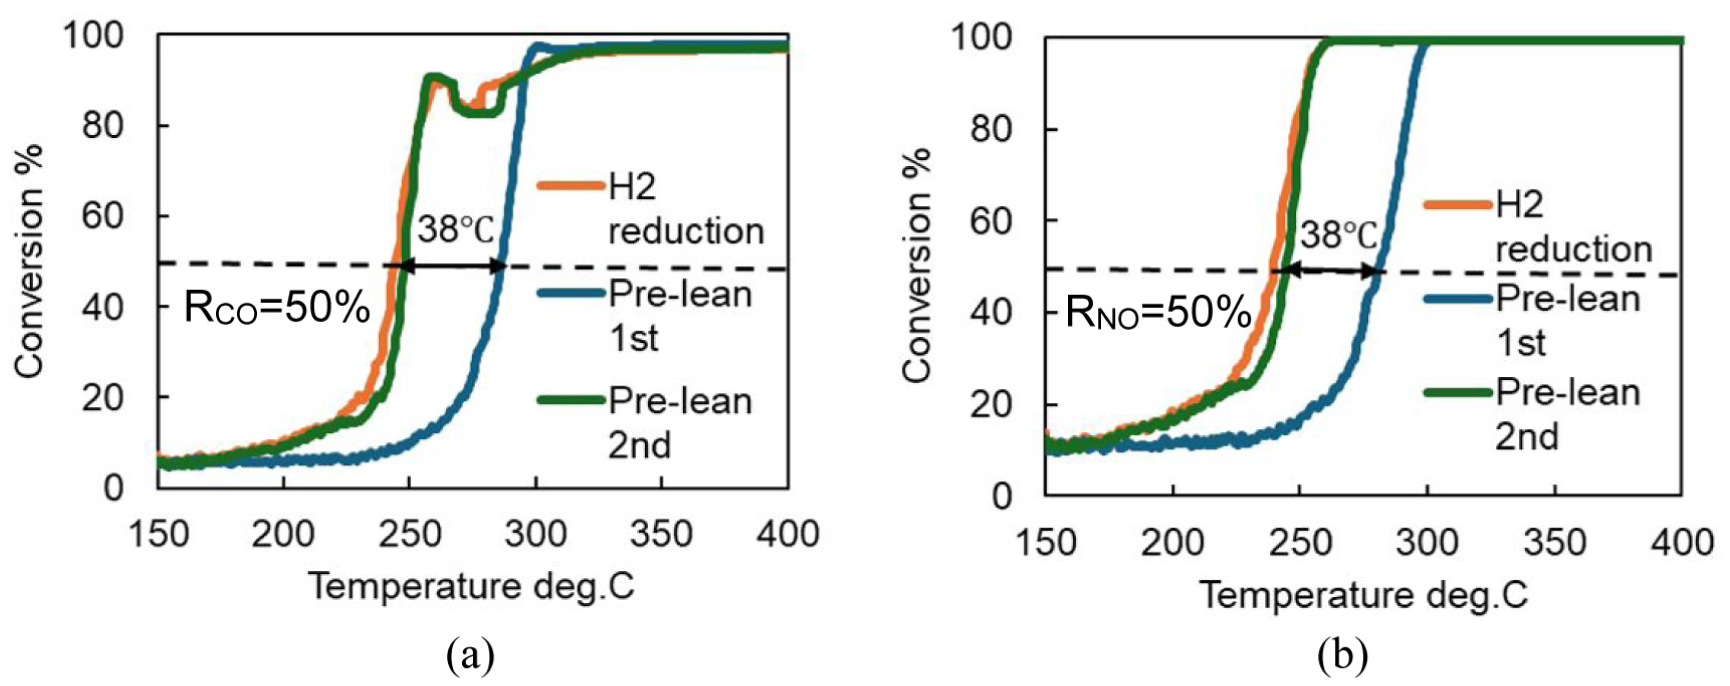
Comparison of CO-NO light-off curves between the first and the second. (a) CO. (b) NO.
Numerical simulation results and discussion
Numerical analysis was conducted using the PSR (Perfectly Stirred Reactor) aftertreatment model in Chemkin-Pro, a chemical simulation software developed by Ansys. Based on the surface reaction mechanism “Catalytic oxidation of carbon monoxide over rhodium” developed by Karadeniz et al. 12 at the Karlsruhe Institute of Technology, the NO reaction schemes proposed by the same group 15 were added, and modified schemes considering the oxide film were devised and incorporated. This chapter mainly describes the model overview, the chemical reaction schemes considered, the simulation conditions, and the parameters that were adjusted. The model overview follows the SURFACE CHEMKIN framework. 16
Overviews of the numerical model
Figure 7 illustrates an overview of the PSR aftertreatment model. It is assumed that the catalyst surface exists within a perfectly stirred reactor. By specifying the inlet gas flow rate and the composition of the incoming gas, the flow rate of each chemical species entering the reaction vessel can be determined. For an inlet gas with a mass flow rate of
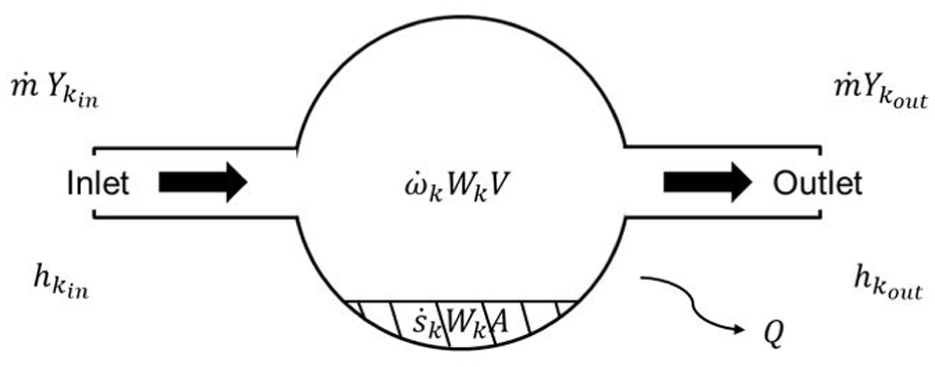
Perfectly stirred reactor. 16
The reaction rate parameters
In general, the i-th chemical reaction in a reaction mechanism is expressed using the stoichiometric coefficients of the reactants
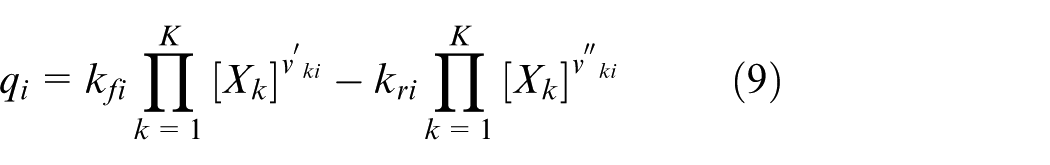
In the simulation conducted with the model developed in this study, the reaction rate constants for each reaction scheme are individually defined for both the forward and reverse directions. It is assumed that the reaction rate constants in both directions follow the Arrhenius form. These Arrhenius equations are modified to account for the influence of surface species coverage, and the reaction rate constants are calculated using the modified form shown in equation (8). Furthermore, the reaction rate for each reaction scheme is calculated from the forward and reverse reaction rate constants using equation (9). Based on this, the production rate of chemical species k is expressed as shown in equation (10).

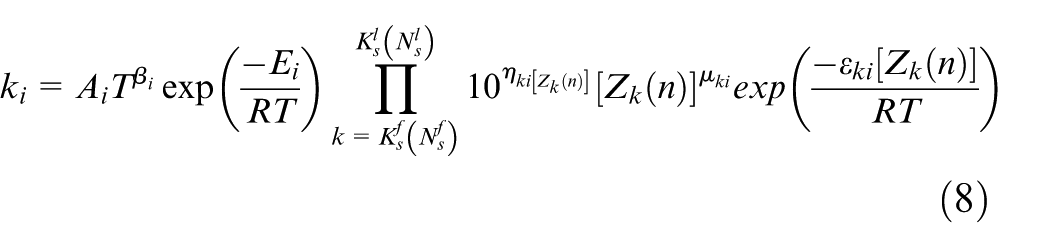

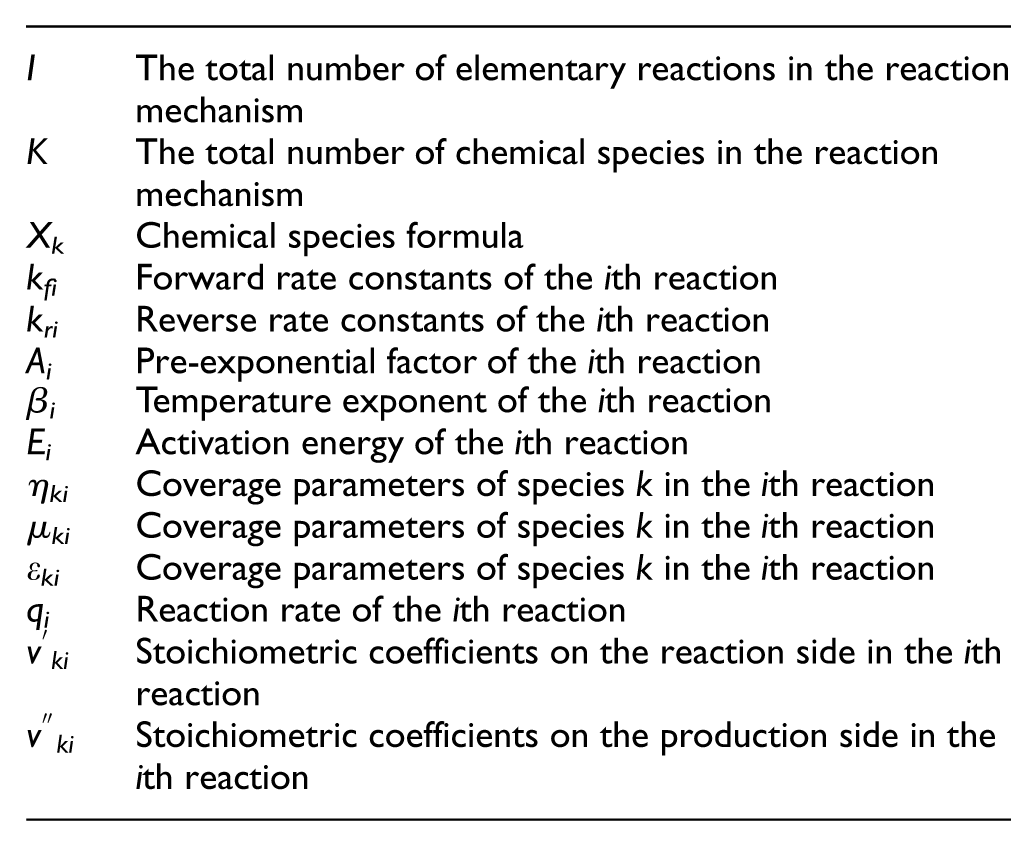
Equation (8) adds three correction terms to the standard Arrhenius equation—each dependent on the frequency factor, temperature exponent, and activation energy. These correction terms are each influenced by the coverage, which represents the occupancy of active sites. To reproduce experimental results in the simulation, six parameters in equation (8) were adjusted to determine the reaction rate constants for each reaction scheme.
Calculation condition
In a previous study, the adsorption/desorption reactions and surface reactions parameters of the CO oxidation model on Rh surfaces 12 were adjusted based on experimental results using Rh/Al2O3 catalysts, thereby constructing a Rh/Al2O3 model. This model reasonably reproduced the results of light-off tests for CO + O2 system and surface state analyses conducted using XPS (X-ray Photoelectron Spectroscopy). In the present study, by adding reaction schemes involving NO to the model, it became possible to reproduce the results of light-off tests conducted with CO and NO as the target gas species.
The reaction schemes considered and initial conditions for the simulation are presented below.
Surface reaction mechanism
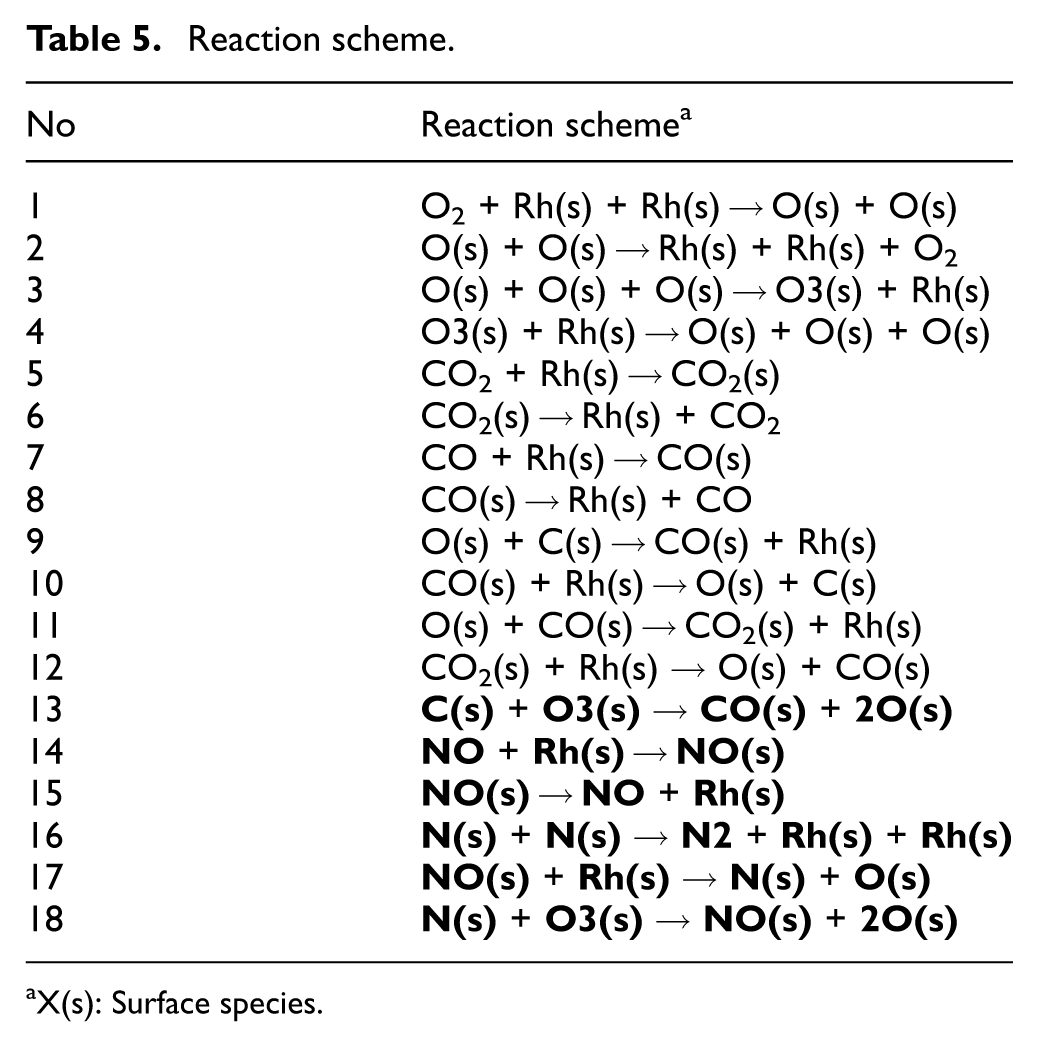
Table 5 lists the surface reaction mechanism used in the work. The reactions written in bold are added to the previous study. 13 In addition to the CO + O2 reaction schemes from the previous study, reaction schemes from No. 14 to No. 17 related to NO are based on the three-way catalytic reaction model on Rh surfaces. 15 As previously mentioned in Section 3.2, the possibility of oxide film decomposition after the first light-off test was suggested experimentally, and therefore, Scheme No. 18 was added. Furthermore, considering the possibility that C(s) (Rh-C) may decompose O3(s) (Rh2O3), Scheme No. 13 was also included. With these additions, the model represents the decomposition of Rh2O3 during the light-off test by nitrogen or carbon adsorbed on the surface, resulting in a complete return to the metallic state via RhO. Thus, as mentioned earlier, O3(s) possesses two active sites.
Reaction scheme.
X(s): Surface species.
Initial conditions
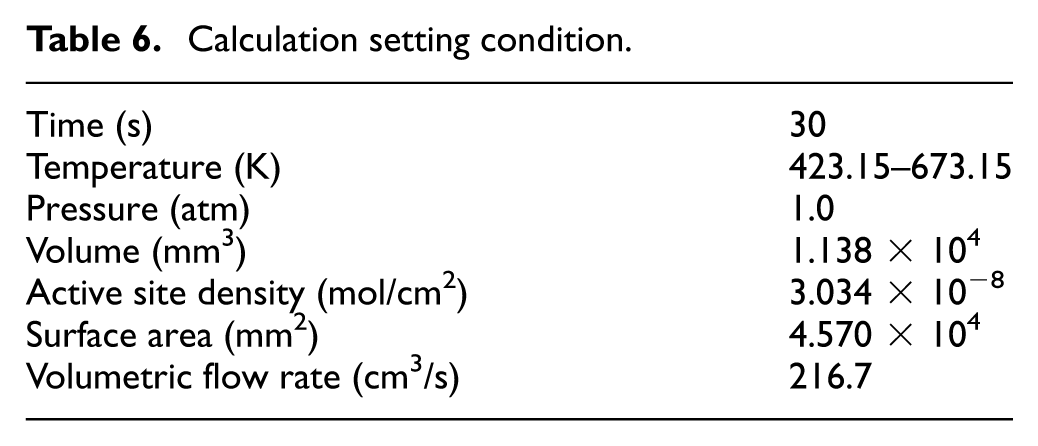
The simulation conditions in the model include the volume, surface area and the active site density of the catalyst used in the light-off test, the flow rate during the light-off test, the measured inlet gas temperature, and the inlet gas composition.
In the light-off test simulation, the outlet gas composition of the catalyst was examined, and fitting reaction rate parameters was performed to reproduce the light-off curve shown in Figures 4 and 6. The conditions used in the simulation are listed in Table 6.
Calculation setting condition.
Numerical results and discussion
Among the reactions listed in Table 7, reactions from No. 1 to No. 12 related to CO were parameterized in the previous study, 13 and the same reaction rate constants were used in this study. For the newly added NO-related schemes, the parameters for reactions from No. 14 to No. 17 were adopted without modification from the three-way catalytic reaction model on Rh surfaces developed by Deutschmann et al. 15 The fitting parameters are written in bold in Table 7. Firstly, the parameters for reaction No. 18 were determined in this study. To ensure that the decomposition of O3(s) occurs only at temperatures above the light-off onset, the activation energy was set to a high value. Additionally, Scheme No. 13 was newly introduced in this study. To allow the reaction rate to vary depending on the amount of C(s) and temperature, a coverage-dependent coefficient ε for C(s) was applied to the activation energy. A relatively large positive value was assigned to ε, so that the reaction occurs more readily at high temperatures but proceeds less in rich atmospheres where C(s) is abundant.
Reaction rate parameters.
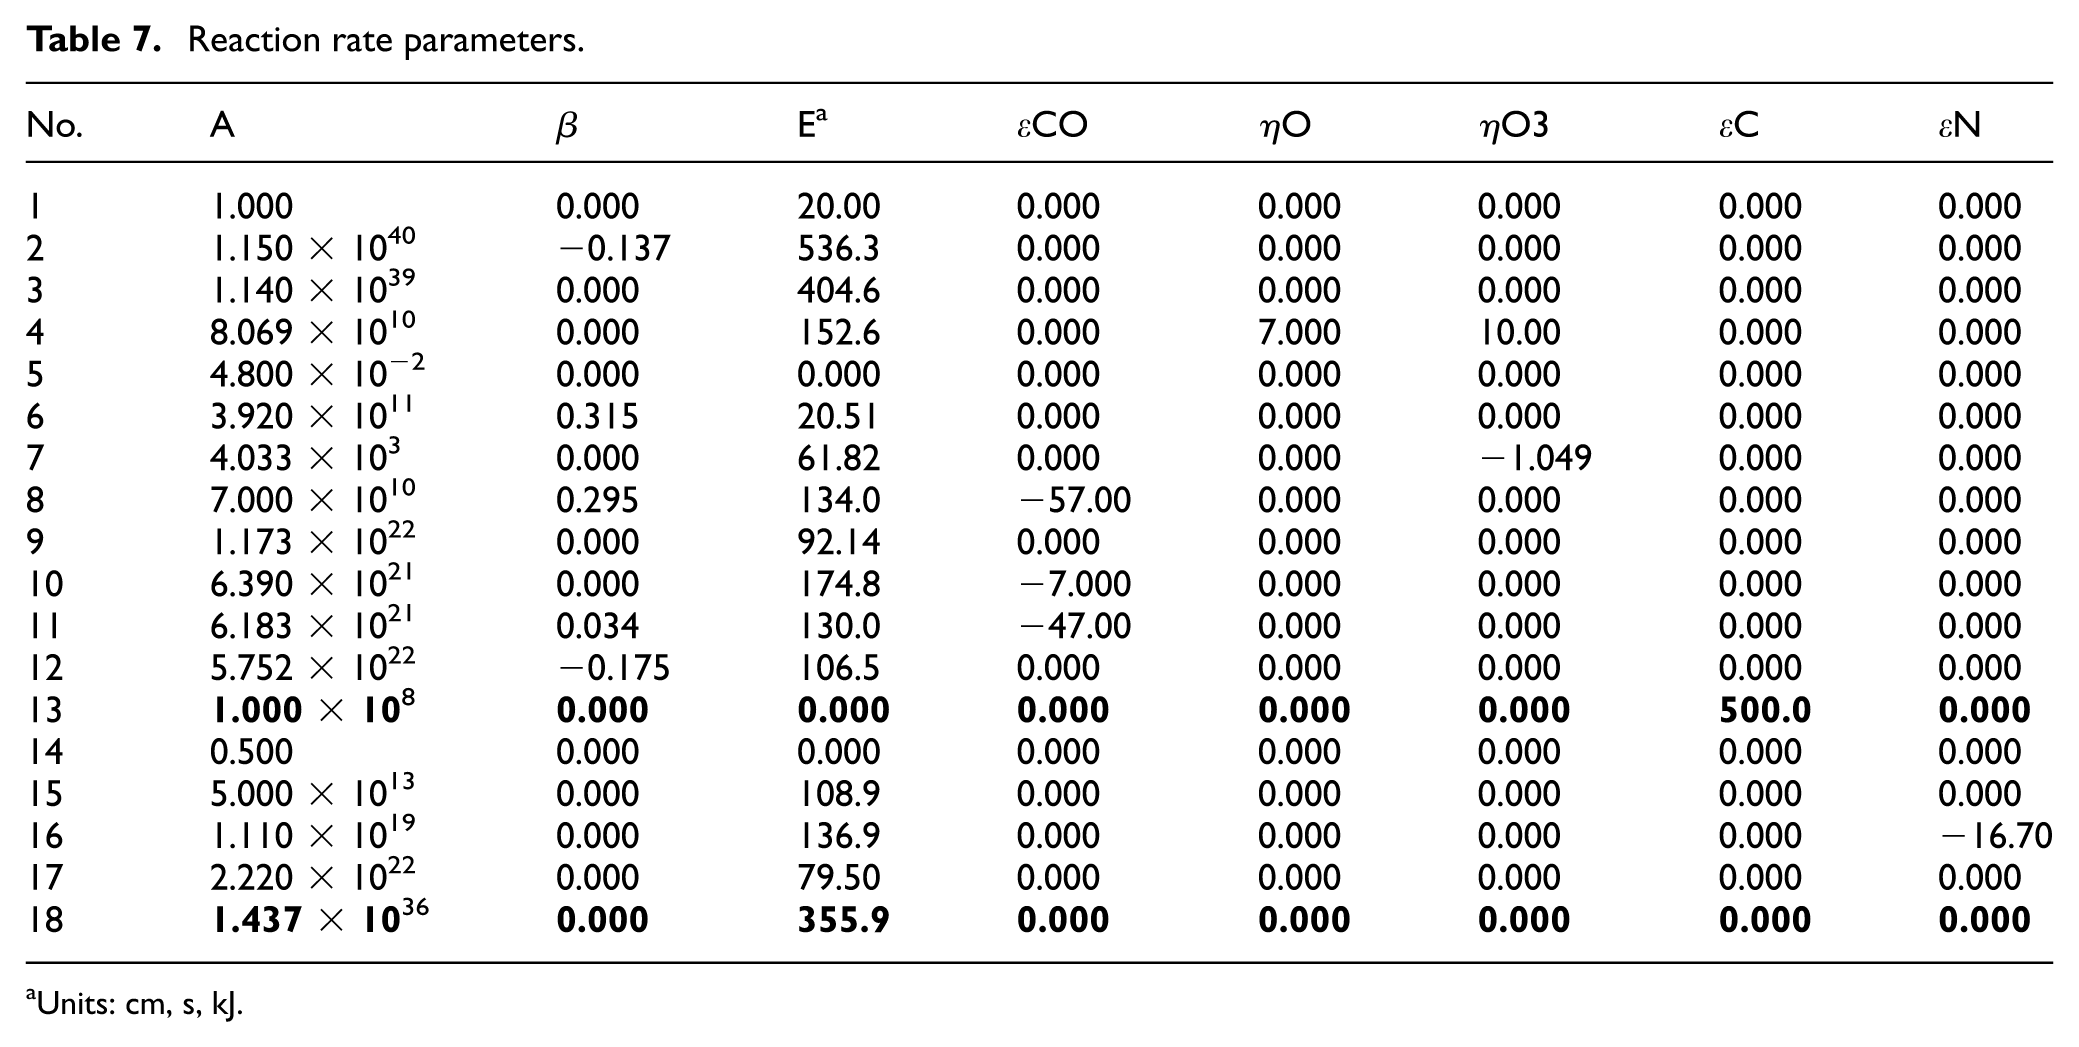
Units: cm, s, kJ.
Simulations on light-off test
Using the predicted catalyst surface state after lean or rich pretreatment that reproduced the XPS analysis results as the initial condition, a simulation was conducted to reproduce the light-off test by gradually increasing the temperature. The results are shown in Figure 8. In the calculation, although there were some discrepancies in the purification rate at lower temperatures, the trend of differing light-off curve behavior depending on the equivalence ratio used in the pretreatment was successfully reproduced through numerical simulation. At low temperatures, a purification rate of about 10% has been observed in the experiments, and this point requires further investigation. The light-off curve rise was captured within a temperature range that closely matches the experimental results. Furthermore, simulations were also conducted for two consecutive light-off tests following lean pretreatment. The second light-off test showed a significant improvement in purification performance, which was successfully reproduced in the simulation.
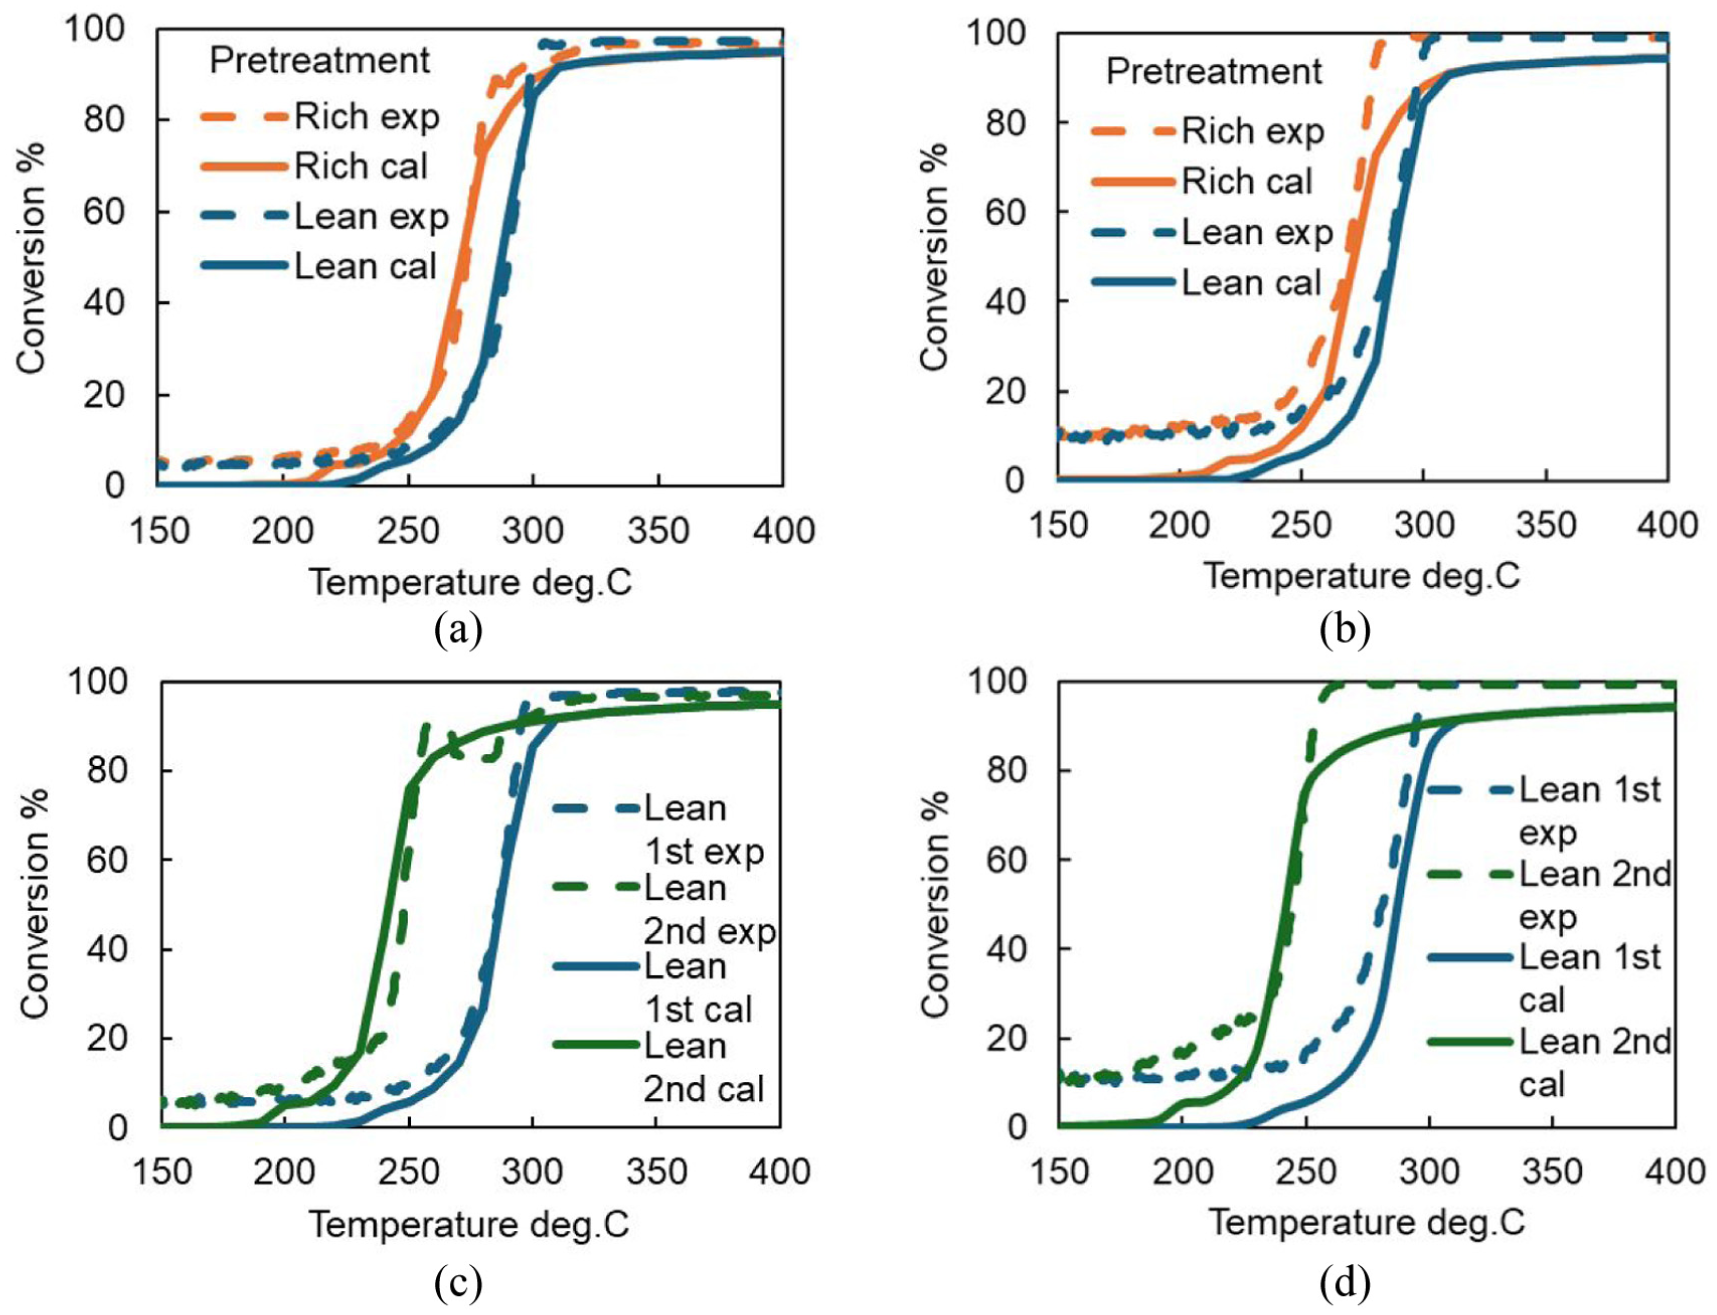
Comparisons of light-off curves after rich or lean pretreatment between experiment and calculation: (a) CO (pre-rich, pre-lean); (b) NO (pre-rich, pre-lean); (c) CO (pre-lean first, pre-lean second); (d) NO (pre-lean first, pre-lean second).
Figure 9 shows the simulated changes in the surface state of the Rh catalyst during the light-off test.
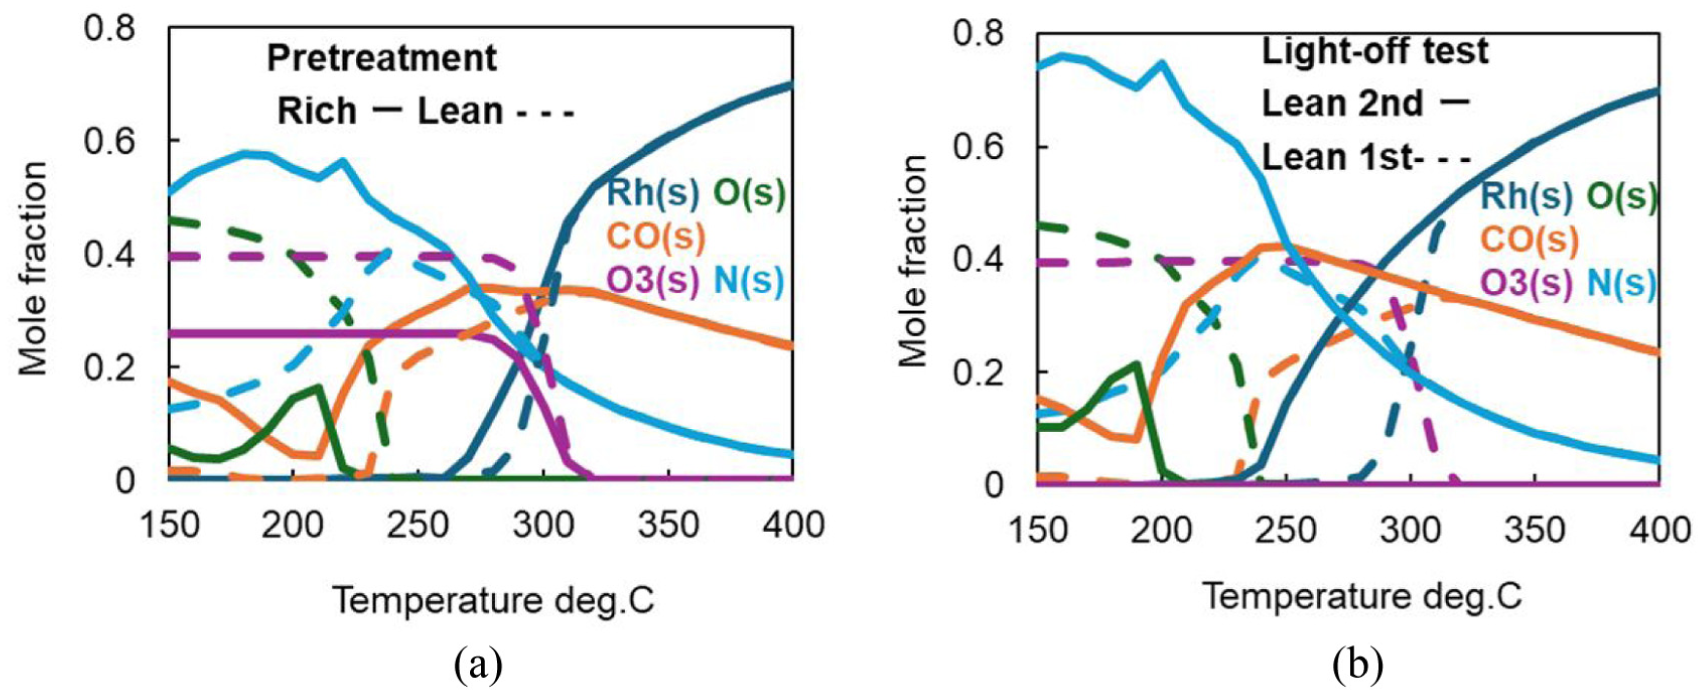
Predicted coverage profiles of surface species: (a) during light-off test after rich or lean pretreatment; (b) during the first or the second light-off test after lean pretreatment.
By comparing Figures 8(a), (b) and 9(a), the following interpretation can be made regarding the cause of the differences in light-off curve behavior due to variations in pretreatment equivalence ratio. When pretreatment is conducted under a lean atmosphere, the proportion of oxide species such as O3(s) and O(s) covering the surface is higher than in the case of rich pretreatment. As a result, it takes longer for the metallic Rh(s) surface to begin increasing, leading to slower adsorption rates of CO and NO, and consequently, reduced purification performance.
The reactions occurring in each temperature range can be inferred as follows:
After rich pretreatment, from 150°C to 210°C: Excess CO(s) adsorbed under rich conditions desorbs, allowing O to adsorb onto the vacant sites, increasing O(s).
From 210°C to 220°C: The adsorbed O(s) desorbs again, and NO(s) adsorbed onto the vacant sites decomposes to form N(s), resulting in a decrease in O(s) and an increase in N(s).
After lean pretreatment, from 150°C to 240°C: Excess O(s) adsorbed under lean conditions desorbs, and NO(s) adsorbed onto the vacant sites decomposes, increasing N(s).
After rich pretreatment, from 220°C to 270°C, and after lean pretreatment, from 240°C to 280°C: N(s) begins to participate in the decomposition of O3(s), leading to a decrease in N(s) and O3(s). As N(s) decreases, CO adsorbs onto the newly available sites, increasing CO(s).
After rich pretreatment, from 270°C to 310°C, and after lean pretreatment, from 280°C to 320°C: The decomposition of O3(s) by N(s) progresses further, reducing O3(s) and increasing the proportion of Rh(s). This leads to a rapid improvement in purification, causing the light-off curve to rise.
After rich pretreatment, from 310°C to 400°C, and after lean pretreatment, from 320°C to 400°C: CO(s) and N(s) adsorbed on the surface are purified into CO2 and N2, respectively, freeing up sites and further increasing Rh(s). At this point, the purification rate reaches its maximum and O3(s) (Rh2O3) is disappeared.
Furthermore, by comparing Figures 8(c), (d) and 9(b), the difference in behavior between the first and second light-off tests after lean pretreatment can be interpreted as follows: Since the oxide film O3(s) is completely decomposed during the first light-off test, the second test begins with a surface state that is nearly fully metallic, with no remaining oxide film. This results in significantly faster adsorption of CO and NO at low temperatures, greatly improving purification performance and producing a light-off curve similar to that obtained after hydrogen reduction to a fully metallic surface.
Figure 10 shows the summary of reactions considered for 1st light-off tests after lean pretreatment. Initially, oxygen absorbed and reacted to form oxide film on the Rh surfaces during 600°C lean pretreatment as shown in ①. After the pretreatment, light-off test was performed. As depicted in ② for the temperatures ranging from 150°C to 240°C, oxygen species adsorbed on the surface during lean-atmosphere pretreatment desorb, creating vacant sites that are subsequently occupied by NO. Two adsorption pathways for NO are possible: adsorption as an intact NO molecule or instantaneous dissociation into N and O atoms upon adsorption, with the latter being more prevalent. In this temperature range, CO adsorption is not expected to occur, nor does the decomposition of the oxide film take place at such low temperatures. As shown in ③ between 240°C and –280°C, the oxide film remains intact; however, CO adsorption commences. Concurrently, N atoms derived from adsorbed NO undergo recombination to form N2. In the subsequent range of 280°C–320°C (④), the recombination of N atoms to N2 continues, and the decomposition of the oxide film is initiated. CO adsorbed on the surface reacts with oxygen species originating either from NO dissociation or from oxide film decomposition, producing CO2. Consequently, the proportion of metallic surface sites progressively increases. As illustrated in ⑤ within the range of 320°C–400°C, the oxide film is completely removed. At this stage, only the reactions converting CO and NO into CO2 and N2 occur, maintaining an approximate purification efficiency of almost 100% and promoting further surface metallization. Thus, the oxide film generated during lean-atmosphere pretreatment is decomposed during the temperature ramp of the light-off test, restoring the metallic surface. Furthermore, when the surface is once again exposed to a lean atmosphere, it reverts to state ①.
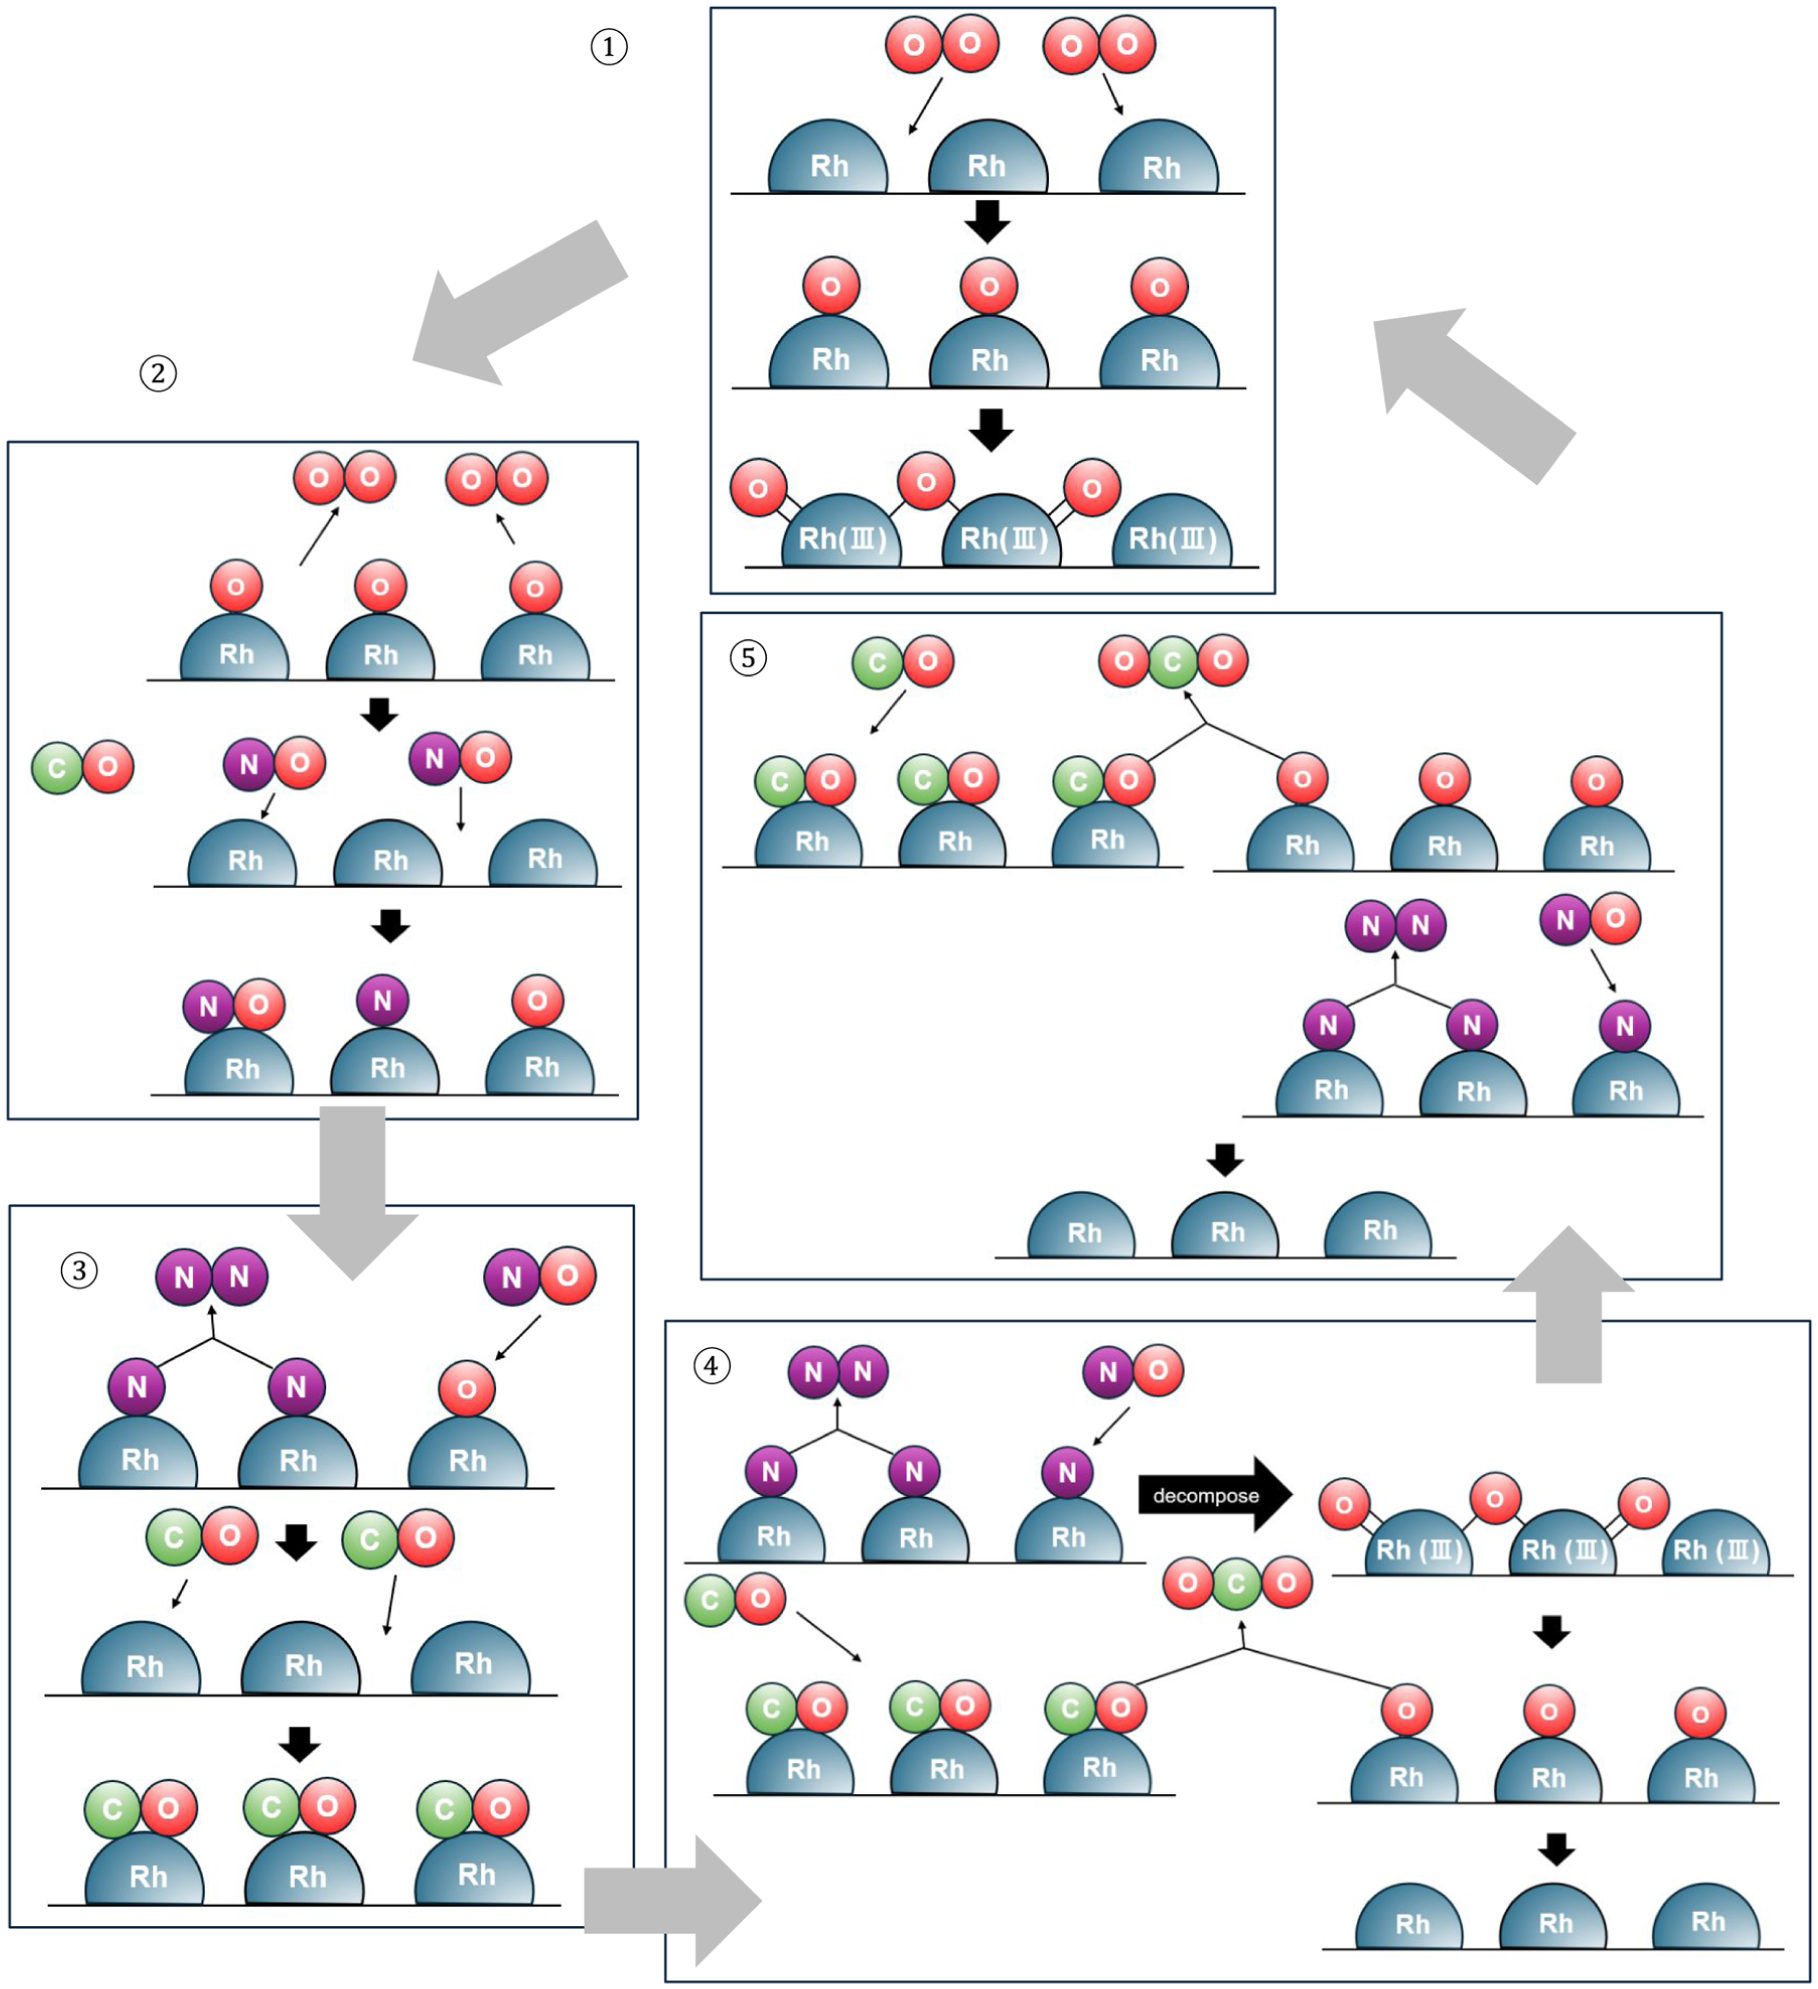
Schematic of reaction process during first light-off after lean pretreatment.
Conclusions
In this study, we experimentally investigated the effect of oxide film formation on the Rh surface of a three-way catalyst on the CO oxidation and NO reduction characteristics. Furthermore, we introduced reaction schemes and constants that could reproduce the experiments and performed numerical simulations that considered detailed surface reactions. This enabled us to reproduce the experimental results through calculations. Furthermore, we analyzed the surface state through calculations and obtained the following conclusions.
Not only in the CO oxidation reaction but also in the NO reduction process, differences in pretreatment atmosphere affected the light-off performance. Specifically, the light-off curve after pretreatment in a lean atmosphere shifted to higher temperatures compared to that after pretreatment in a rich atmosphere, with the temperature at which the purification rate reached 50% (T50) being approximately 16°C higher.
After pretreatment in a lean atmosphere, when the light-off test was repeated twice, the second light-off curve matched that obtained after H2 reduction treatment. This suggests that the oxide film formed during lean atmosphere pretreatment was completely decomposed during the light-off test, and the surface returned to its metallic state.
We devised a process in which adsorbed nitrogen species N(s) on the Rh surface during the light-off test decompose the oxide film O3(s) at temperatures above 300°C and successfully reproduced the changes between the first and second light-off curves through numerical simulation.
Based on the numerical simulation results, it is inferred that the increase in light-off temperature caused by lean pretreatment is primarily due to the delayed reaction resulting from a higher oxide film coverage compared to rich pretreatment. Furthermore, under both pretreatment conditions, the oxide film is removed during the light-off test.
Since O3(s) is absent from the beginning during the second light-off test, the proportion of Rh(s) is higher compared to the first test. As a result, the adsorption rates of CO(s) and O(s) increase, improving CO purification performance. Additionally, the adsorption rate of NO(s) and the formation rate of N(s) also increase, which is expected to enhance NO purification performance.
Footnotes
Acknowledgements
I would like to express my sincere appreciation to Professor. Olaf Deutschmann and Mr. Daniel Hodonj at Karlsruhe Institute of Technology for thoughtful advice on this research.
Funding
The authors received no financial support for the research, authorship, and/or publication of this article.
Declaration of conflicting interests
The authors declared no potential conflicts of interest with respect to the research, authorship, and/or publication of this article.