
Abstract
Hydrogen is a promising option to decarbonize energy conversion in internal combustion engines (ICE). A key limiting factor of high-load hydrogen ICE operation is the occurrence of combustion anomalies, including pre-ignition, backfiring into the intake manifold and knocking combustion. The existing literature indicates that there currently exists no generally accepted conceptual model that is able to explain the occurrence of all combustion anomalies for hydrogen-fueled internal combustion engines. This publication is intended to help fill this research gap based on experimental investigations on a single-cylinder research engine (SCE) with hydrogen port fuel injection and spark ignition in the 3 dm3 displacement per cylinder class and related 3D-CFD simulation work. To enable in-depth combustion analysis and particularly to identify the origin and root cause of pre-ignition, the SCE was instrumented with AVL List GmbH’s “Visiolution” system, an advanced optical instrumentation that relies on fiberoptic sensors in the combustion chamber. Different types of pre-ignition including backfire, early and late pre-ignition could be provoked during engine operation. Backfire and early pre-ignition were found to originate from the piston-liner edge at the “bottom” of the combustion chamber and tend to occur in specific areas at the piston circumference where comparatively rich local mixture prevails. Mixture homogeneity may be key to reduce the risk of backfire and early pre-ignition to occur. The locations of origin suggest that various ignition sources emerging from the piston top land crevice such as hot residual gases or reactive species (e.g. due to reverse blowby) are possible. Late pre-ignition events (i.e. shortly before ignition timing) occurred in large numbers with a random spatial distribution in the combustion chamber and appear to be mostly related to lubricant oil droplet combustion. Future research must study the impact of mixture homogeneity on pre-ignition and strive to better understand the root causes for the underlying processes that provide the required ignition energy.
Keywords
Introduction
Global warming is one of the greatest challenges the world faces in the 21st century. The global carbon dioxide concentration is continuously rising by 2–3 ppm each year. In January 2025 the Copernicus Climate Change Service reported that 2024 has been confirmed as the warmest year on record and the first year with an annual average global temperature more than 1.5°C above the pre-industrial level. 1 Governments worldwide have put forward ever more ambitious greenhouse gas (GHG) emission reduction targets. The 2030 Climate Target Plan of the European Commission proposes to reduce GHG emissions by at least 55% of the 1990 levels by 2030. 2 In February 2024 the European Commission recommended a 90% net GHG emission reduction by 2040 to reach climate neutrality by 20503 (cf. Figure 1).
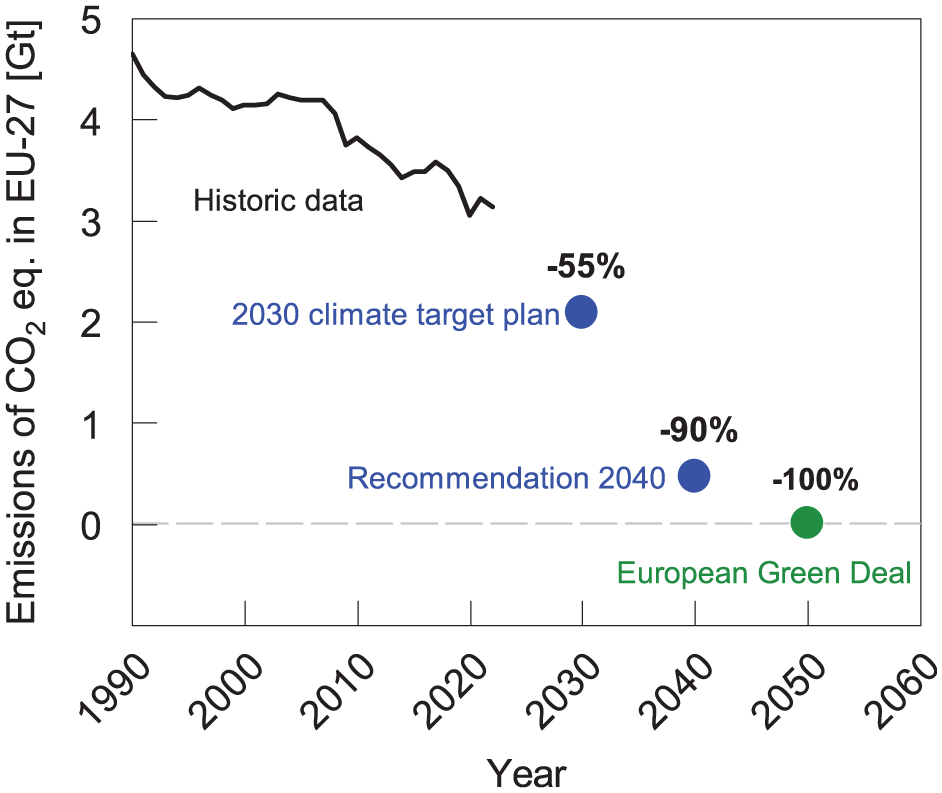
EU Commission targets for greenhouse gas emission reduction. Historic data from European Environment Agency. 4
The key element to achieving such ambitious targets is a global transition from a fossil fuel-based energy system to a system that is built on renewable energy sources. Internal combustion engines are well suited to serve as climate-neutral, zero environmental impact sources of mechanical energy if the transition from fossil to renewable fuels can be achieved.5–8 Hydrogen is easily produced from renewable energy sources via electrolysis during times of an oversupply of electricity and may be used for propulsion or power generation in internal combustion engines when electricity demand exceeds the supply.7,9,10 Today nearly all major large engine manufacturers are developing hydrogen-fueled power plant solutions and several products are already commercially available. While some engines in the portfolio are currently designed for admixing of hydrogen only (mostly limited to 25% by volume), 11 others can operate on pure hydrogen.9,12,13 The latter, however, operate at significantly lower rated power than their natural gas-fueled counterparts. One of the limitations to higher power density is the occurrence of combustion anomalies. In Kapus et al. 14 it was reported that load limitations due to them could be eliminated with either exhaust gas recirculation or liquid water injection. Yet these mitigation measures greatly increase the system complexity and do not necessarily eliminate the root cause of the combustion anomalies.
Combustion anomalies can be differentiated by location, time of occurrence and impact on the cylinder charge (or even the intake manifold) as well as by the underlying root cause. The latter, however, is not always easy to identify. Figure 2 illustrates basic types and differentiations of combustion anomalies. Regular combustion exhibits the expected behavior of cylinder pressure increase and heat release after the ignition timing. During combustion cycles in which pre-ignition occurs, the heat release starts during the compression stroke before the ignition timing, and both cycles exhibit significantly higher peak cylinder pressures (PCP) than the regular combustion cycle, thus posing the risk of damage to components affected by the processes inside the combustion chamber. In Xu et al. 15 it was found that the knock intensity in cycles experiencing pre-ignition was significantly impacted by the location of the pre-ignition. Backfire occurs earlier in the combustion cycle when the intake valves are still open so that the intake manifold pressure increases; thus a risk of severe damage to the intake system exists.
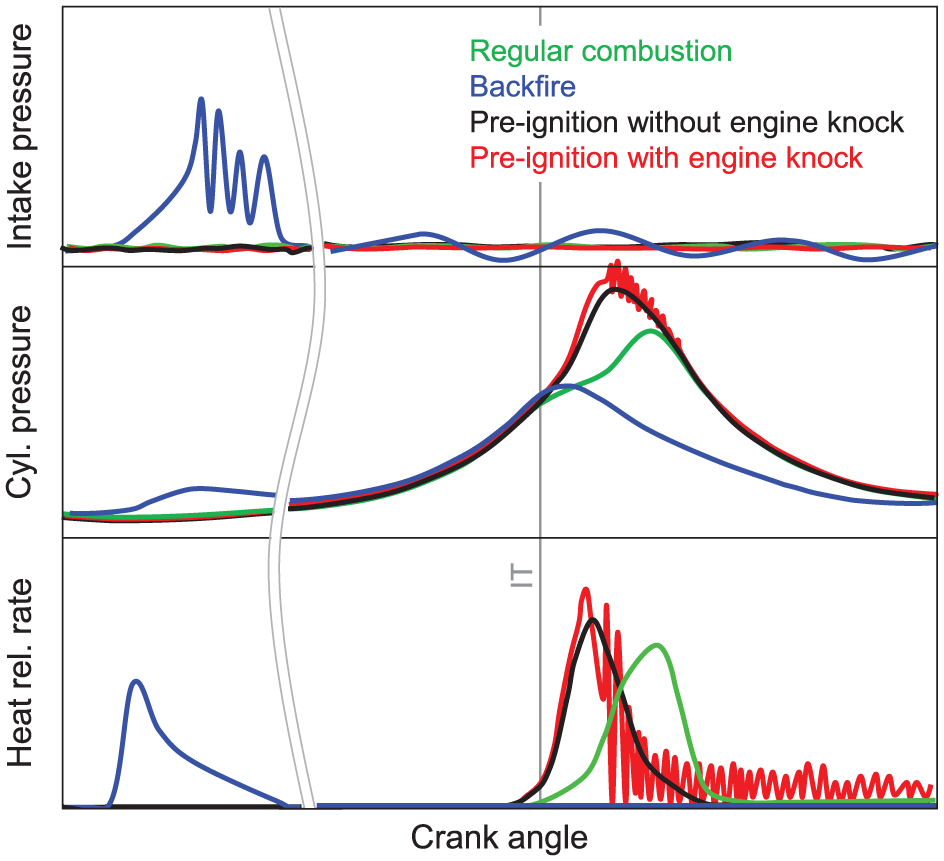
Cylinder and intake manifold pressure traces and heat release rate curves of characteristic regular and irregular combustion cycles.
Numerous studies—not only of hydrogen but also of other low-flashpoint fuels such as methane—have been reported in the literature that are investigating individual aspects or processes in order to gain a deeper understanding of the mechanisms leading to combustion anomalies. Specific attention has been paid to the impact of hot spots (such as exposed surfaces and deposits), residuals from the previous combustion cycle and lubricants in the combustion chamber.
Rajasegar et al. 16 investigated hot spot-induced pre-ignitions with a glow plug as a temperature-controlled hot surface. In experiments with hydrogen direct injection, they found that hot spot-induced pre-ignition required glow plug temperatures exceeding 1100 K, a value unlikely to be reached by any engine component. They furthermore found via chemical kinetics simulations that the ignition delay of hydrogen sharply increases at elevated pressures, thereby explaining the observed tendency of the fuel-air mixture to pre-ignite during the intake stroke or early in the compression stroke.
Residual gas from the previous combustion cycle that was not scavenged during the exhaust stroke remains in the combustion chamber and may trigger pre-ignition or backfire at the interface between the fresh charge and the combustion residuals. Salvi and Subramanian 17 studied the impact of various engine design parameters on pre-ignition and backfire and concluded that high residual gas fractions promoted combustion anomalies in tests with a low compression ratio of 4.5:1. It is uncertain how this finding can translate to modern gas engines with compression ratios above 10:1. In a different study on an optically accessible engine, the measurement results led to the hypothesis that not only the residual fraction and/or temperature are impacting the likelihood of the occurrence of pre-ignition but that also the pressure difference between the intake manifold and the cylinder and therefore the velocity of the fresh charge play a significant role. High velocities might lead to fast mixing of fresh gas and residuals and reduce the pre-ignition propensity. 18
The impact of lubricant on pre-ignition was studied extensively in gasoline and natural gas engines and in recent years has also been examined in hydrogen engines. Köser and Tian 19 experimentally investigated pre-ignitions in a high-speed gas engine and developed a conceptual model for the oil transport mechanism. They were able to correlate the location of pre-ignitions to the position of the oil control ring gap. The detected pre-ignitions occurred toward the end of the compression stroke. A different study 20 focuses on both the correlation and the underlying mechanisms of pre-ignition in gasoline engines. Its authors concluded that there was no evidence of droplet induced pre-ignition. Instead, they suggest that the formation of deposits from partially oxidized fuel and lubricating oil over several engine cycles results in highly reactive detachments that can surpass the minimum surface temperature required during the compression stroke. Disasto et al. 21 proposed a different mechanism: Chemical kinetics simulations showed that the presence of lubricants increased the cylinder charge reactivity (i.e. reduced the ignition delay time) due to the introduction of intrinsically more reactive species as well as the simultaneous enrichment of the charge near an oil droplet.
In summary, the existing literature indicates that there is no generally accepted conceptual model that is able to explain the occurrence of all combustion anomalies in hydrogen-fueled internal combustion engines. In particular, a detailed understanding of the root causes of various types of pre-ignition events, required as a starting point to consider specific approaches for eliminating their occurrence, has not been obtained yet. This publication intends to contribute to filling this research gap and answering the question of how to overcome the limitations imposed by combustion anomalies. The specific aim of the study is to obtain a detailed understanding of combustion anomalies occurring in hydrogen-fueled lean burn operation by investigating the impact of engine operating parameters on the type, probability of occurrence, initial location and root cause of pre-ignition and by employing multiple standard and special measurement devices. Significant novelty compared to prior studies of pre-ignition events in hydrogen-fueled internal combustion engines is achieved by obtaining in-depth information about the origin and potential root causes of pre-ignition from optical measurement data and related simulation work.
Methodology
The methodology applied in this study consists of experimental investigations on a single-cylinder research engine (SCE) as well as 3D-CFD simulation work. The latter serves to support the analysis of the experimental results.
SCE investigations
Engine and test bed setup
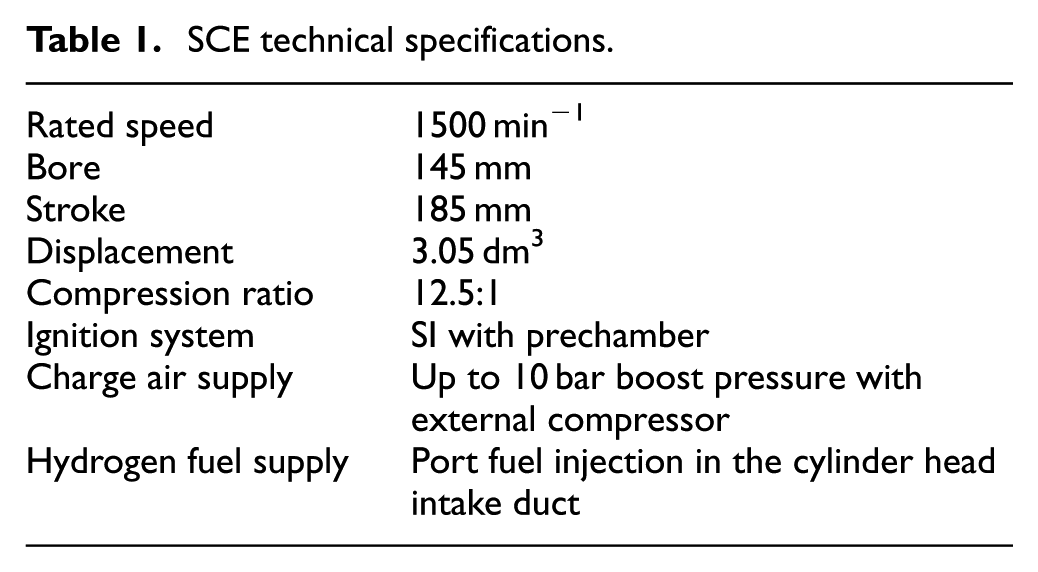
SCE investigations were carried out on one of the LEC’s test beds at Graz University of Technology. The employed high-speed single-cylinder research engine has a rated speed of 1500 min−1 and a displacement of 3.05 dm3. The SCE was configured for the investigations with a compression ratio of 12.5:1 and a prechamber spark ignition system. Since the research engine does not have a turbocharger, the charge air pressure in the intake manifold was generated with a screw type external compressor and the backpressure in the exhaust pipe was controlled by a flap. Defined and accurately reproducible engine operating conditions were ensured by employing comprehensive external conditioning systems for coolant, lubricating oil, charge air and ambient air at the test bed.
Hydrogen was stored in its gaseous form in pressurized tanks and supplied to a port fuel injection (PFI) valve in the cylinder head intake duct via a gas control system that enabled accurate control of a constant target differential pressure of 3 bar upstream of the PFI valve compared to the intake manifold pressure. The fuel mass admitted to the engine was adjusted via the energizing time of the PFI valve. Table 1 summarizes the SCE specifications.
SCE technical specifications.
Measurement technology
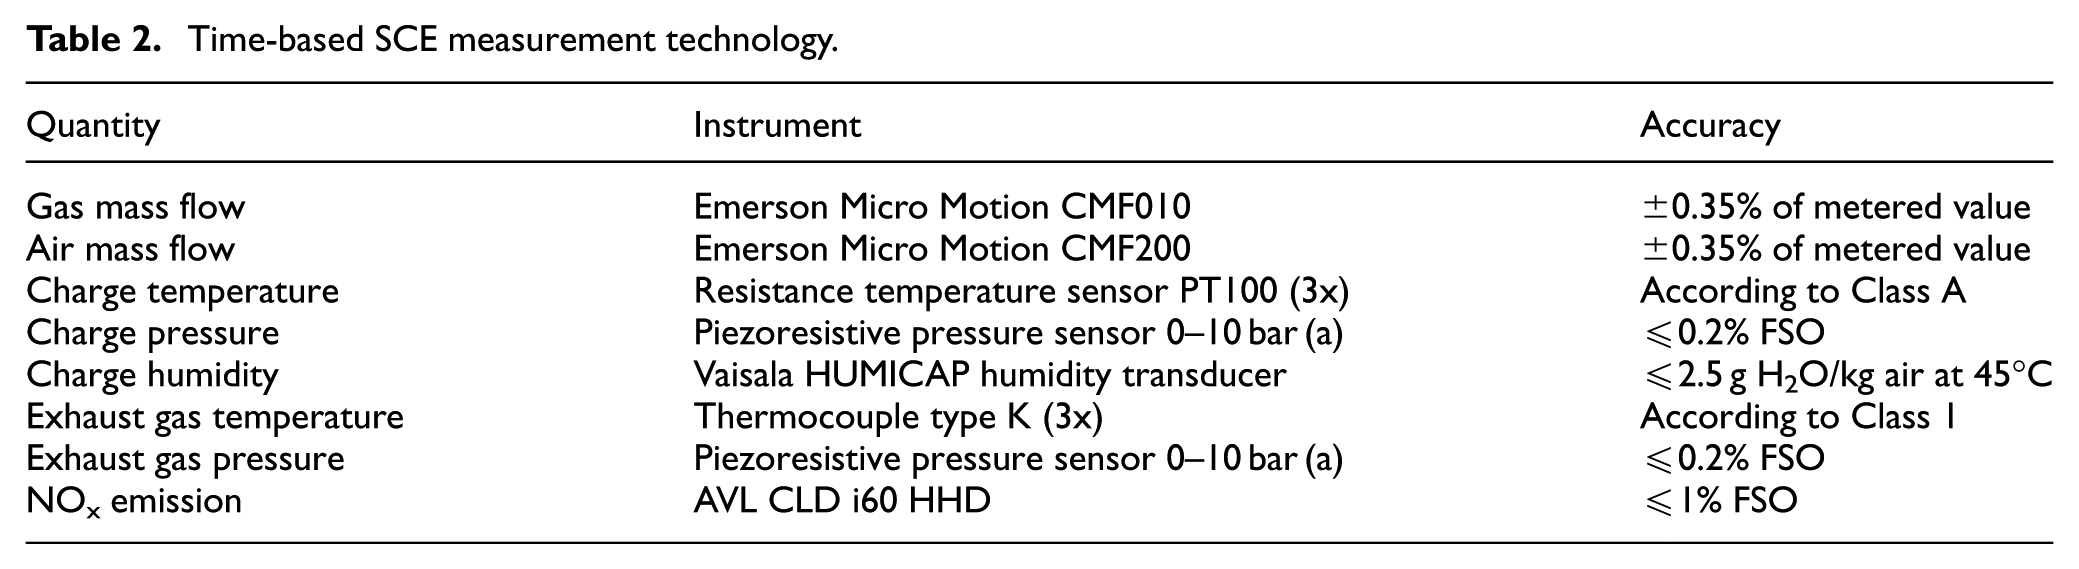
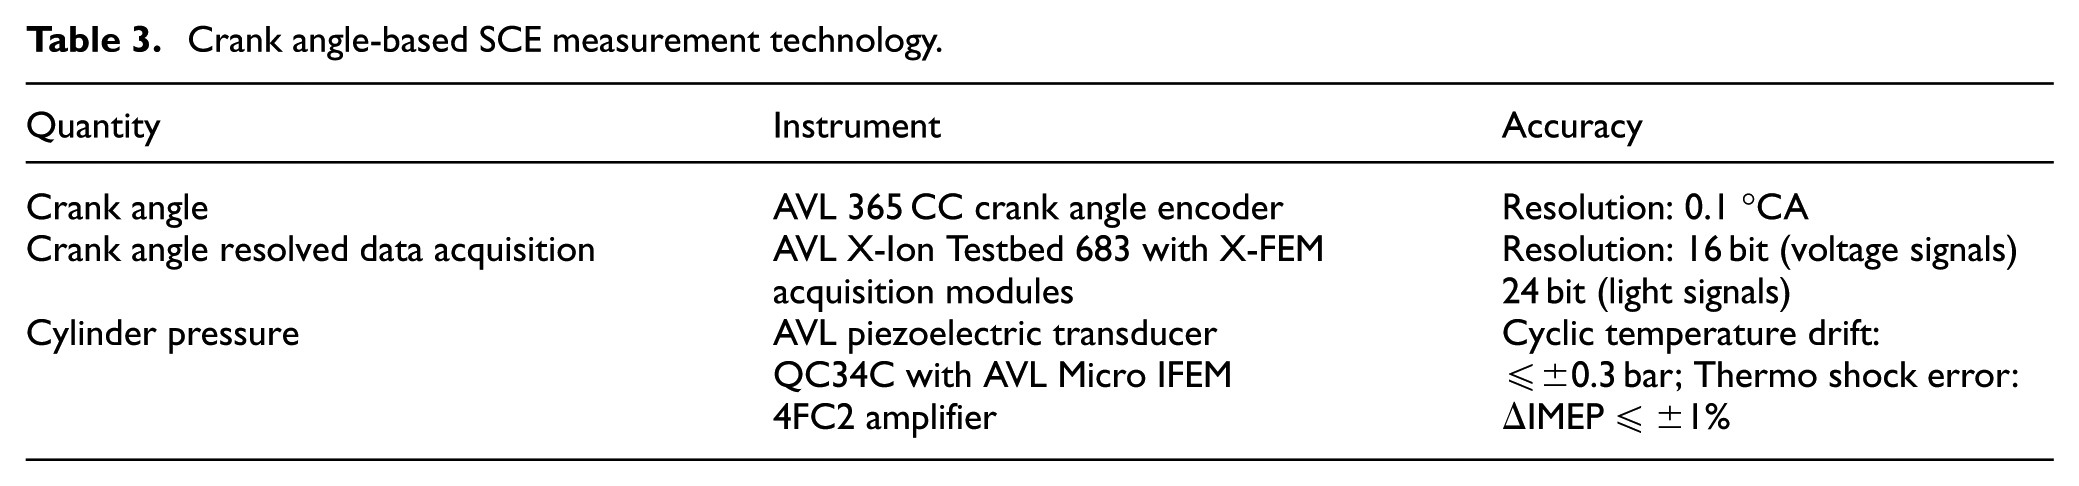
The test bed automation system “Tornado” from Kristl Seibt & Co. GmbH was employed to control and monitor engine operation and to acquire time-based measurement parameters at comparatively low sampling rates in the range of 1–100 samples per second. Crank angle-based measurements were obtained with AVL List GmbH’s X-Ion system. This indication system is capable of continuously recording consecutive combustion cycles for an unlimited amount of time and capturing any significant combustion events such as pre-ignitions that occur sporadically during engine operation. Tables 2 and 3 provide a detailed summary of the time-based and crank angle-based measurement technology relevant to this study.
Time-based SCE measurement technology.
Crank angle-based SCE measurement technology.
Besides capturing standard parameters such as pressures in the combustion chamber and the intake and exhaust manifolds, the indication system simultaneously recorded data generated by the special optical instruments outlined below. The crank angle (CA) resolution was about 0.5 °CA with regard to all data obtained from the combustion chamber, with further refinement of the resolution in the CA range during which the main combustion takes place.
AVL List GmbH’s “Visiolution” system was employed at the test bed for in-depth combustion analysis. It consists of one or more optical sensors in the combustion chamber, an AVL X-FEM Visio signal conditioning unit (to convert light signals from the fiber optic sensors to digital signals) and the previously described AVL X-Ion system for crank-angle-based data acquisition. The X-FEM and X-Ion systems are controlled with the software AVL IndiCom. 1 The Visiolution system is capable of achieving the following key objectives:
Detect time and location of flame kernel as well as spatial and temporal development of flame propagation in both regular and irregular combustion events.
Detect glowing particulates and combustion of lubricant oil droplets before and after the main combustion process.
The optical instrumentation detects electromagnetic radiation emitted by the combustion process. Each sensor has a group of micro-optical elements made of sapphire at its tip which serve as an interface to the combustion chamber. Each of these elements is connected to several optical fibers with a diameter of 200 µm which transmit the individual light signals through the sensor body. Outside the body, additional optical extension lines connect the sensor to X-FEM Visio modules which record the light signals using photodiodes, whose spectral sensitivity ranges from wavelengths of approx. 300 nm to approx. 1100 nm, with a peak photosensitivity of 0.5 A/W at 950 nm. No filter was used. The photodiodes emit current signals proportional to the luminous power that are converted into digital voltage signals. These signals are then processed digitally. 22 The spectral content of hydrogen flames, which ranges from near ultraviolet to near infrared, 23 can be transmitted by the sensor materials and is covered by the spectral sensitivity of the selected photodiodes.22,24 The instrumentation is also capable of detecting broadband soot radiation 25 arising from phenomena such as diffusion combustion of lubricant oil droplets.
While optical sensors as described above can be integrated into spark plugs, this was not considered useful in the present study due to the spark-ignited prechamber setup. Thus, two identical “high power engine” optical sensors22,24 were fitted in the cylinder head in specially tailored access bores. With this setup, a comprehensive optical access to the main combustion chamber was obtained without any modification of the spark plug design. The specific optical sensor layout employed in this study is illustrated in Figure 3. The sensor contains 30 individual optical channels that are aligned in different directions from the sensor tip and whose fields of view are indicated by cones. The colors refer to three rows of optical channels with the top and middle rows comprising 12 channels each and the bottom row comprising six channels. Due to sensor design restrictions, some of the fields of view overlap.
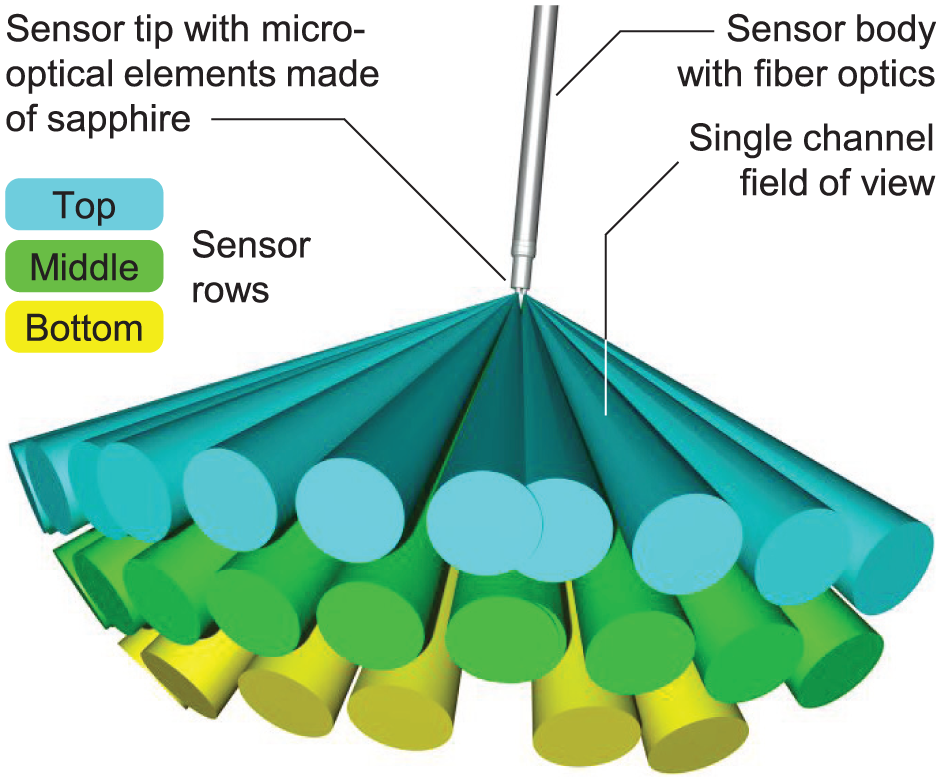
High power engine optical sensor layout.
The CAD mock-up in Figure 4 shows the assembly of the two optical sensors in relation to the parts surrounding the combustion chamber. The access bores in the cylinder head (hidden) are arranged so that the sensor tips protrude slightly into the combustion chamber through the fire deck at opposite positions near the cylinder liner. Sensor 1 (S1) is located near the exhaust valves and sensor 2 (S2) near the intake valves. A relatively high spatial resolution of the entire combustion chamber can be achieved with this sensor layout by combining the fields of view of both sensors. In the range from 80 °CA before to 80 °CA after bottom dead center, the piston surface is outside the region observed by the optical sensors. In addition, small areas near the fire deck on the cylinder head are not captured by any of the sensors. However, these shortcomings are not expected to affect the overall conclusions made in this study. The top view of the combustion chamber in Figure 4 shows the central location of the spark plug and the prechamber between the valves in the cylinder head. In addition, the intake and exhaust flange sides of the cylinder head are indicated as reference directions concerning the orientation of the individual optical channels when results are interpreted.
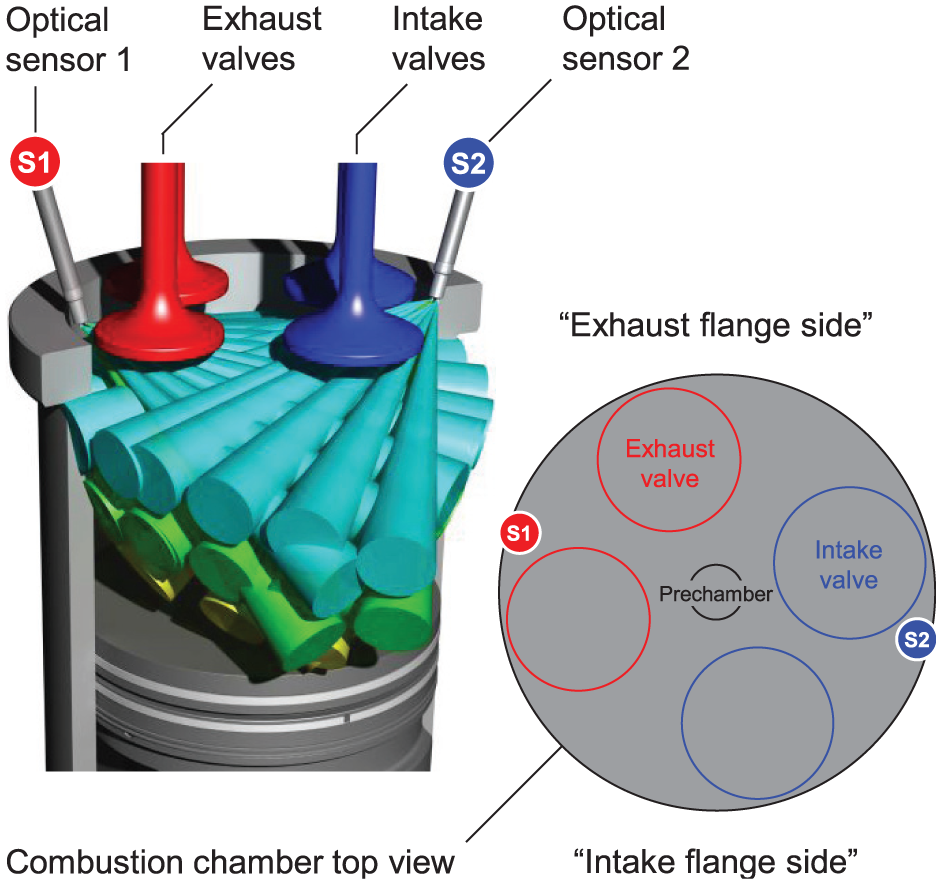
Combustion chamber instrumentation layout with two optical sensors.
The optical sensors are designed to withstand high thermal loads and high absolute peak pressures (such as those encountered during early pre-ignition at comparatively high engine loads, “cf. section ‘Results and discussion’”), but they are prone to damage when knocking combustion with pressure amplitudes greater than 50 bar occurs.
Figure 5 presents an example result comprising optical measurement data and standard measurement data from one selected combustion cycle. In the upper diagram, the light intensity traces of all 60 individual optical channels are plotted in combination with the cylinder main chamber and prechamber pressure traces. This allows a quick overview of any significant events captured by the optical sensors and illustrates how these events relate to the combustion chamber pressures. The signals are displayed in volts, which correspond to the output of the photodiodes. This example result serves as a reference case for a regular combustion cycle, in which the onset of combustion in the main chamber is detected several crank angle degrees after ignition timing and can be found consistently in the main chamber cylinder pressure trace as well as the light intensity traces. To obtain a better understanding of both the temporal and the spatial aspects of the combustion process, the individual optical signals are plotted in the lower graph in Figure 5. A false color scale with a relatively small signal range from −3 to 40 mV is employed so that the details around start of combustion can be thoroughly analyzed. The same signal range is also used in the illustrations of the same type in “section ‘Detailed analysis of pre-ignition events based on optical measurement data’”. The arrangement of the individual channels is explained by the designations in Figures 3 and 4, which show the two sensors S1 and S2 as well as their channel rows (top, middle, bottom) and orientation (outermost channels oriented either toward the intake or exhaust flange sides).
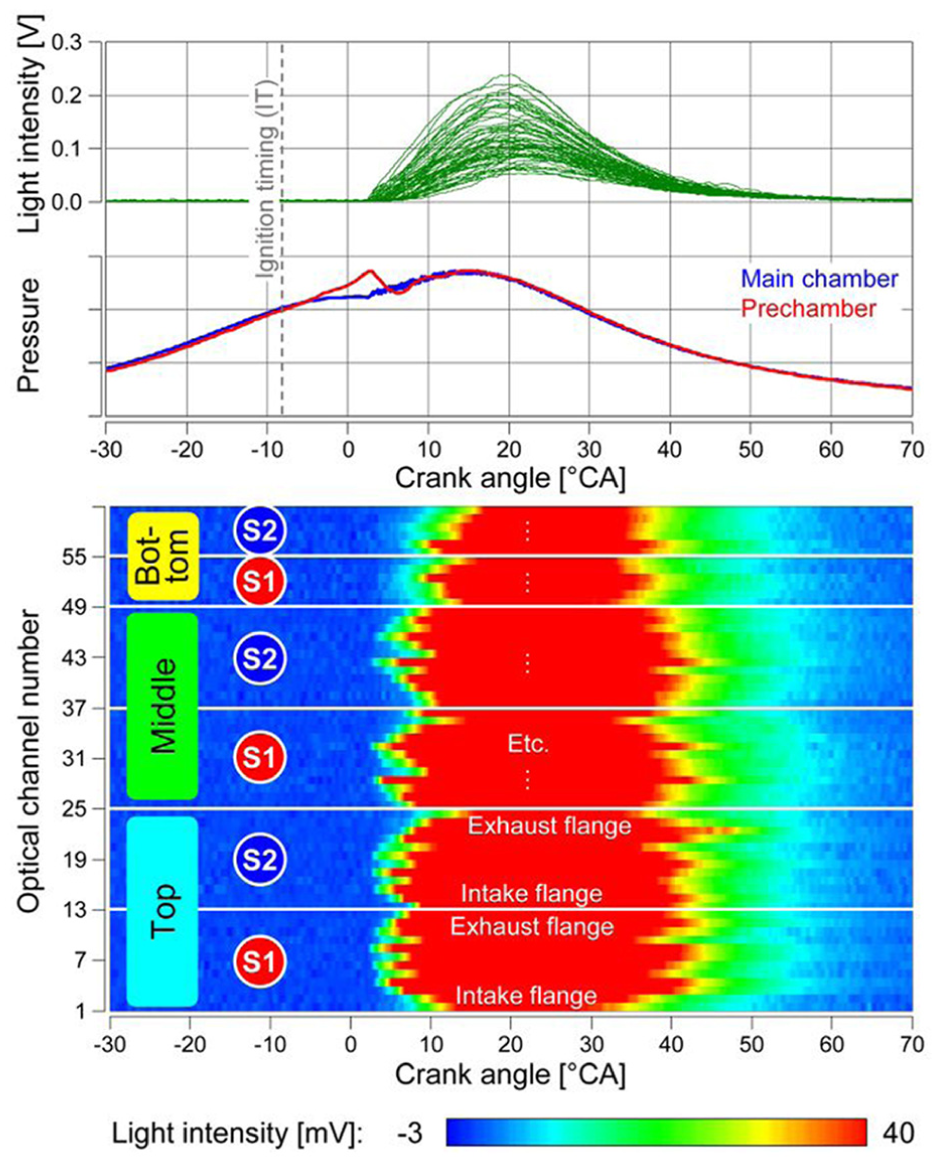
Results structure of optical (and standard) SCE measurement data based on a regular combustion cycle example.
Since in the example result, the onset of combustion in the main chamber originates from the prechamber, which is located in the center of the fire deck, the top channel rows of both sensors exhibit the earliest increase in light intensity signals at approximately 2.5 °CA, succeeded by the middle and bottom rows. Within each channel row, the channels near the center tend to detect an earlier light intensity increase compared to those in outer positions (intake and exhaust flange sides). This signal pattern found in each of the sensor channel row plots is considered to be characteristic of regular combustion processes. From the optical signals, additional parameters such as the optically detected start of combustion (optical SoC) can be derived. The optical SoC is defined as the crank angle at which at least one optical signal indicates onset of combustion by exceeding a defined signal threshold of 20 mV, followed by consistent exceedance of the threshold for a duration of at least 5 °CA. This duration ensures that short optical signal spikes, for example, resulting from short-lived lubricant oil droplet combustion during compression, are not regarded as the onset of a significant combustion process.
Engine operating strategy
This study focused on pure hydrogen-fueled, lean burn engine operation without any additional mixture dilution measures such as exhaust gas recirculation or water injection. With the one specific hardware setup outlined in “section ‘Engine and test bed setup’”, engine operating parameter variations were undertaken to investigate their impact on pre-ignition behavior. The parameters examined included indicated mean effective pressure (IMEP), excess air ratio (EAR), charge air temperature, scavenging pressure ratio and injection timing of the PFI valve.
An increase in IMEP was found to significantly increase the probability of pre-ignition occurrence. The variations of the other parameters were performed slightly below the “borderline” IMEP level where it was observed that pre-ignition starts to occur. With the given hardware setup, the impact of these parameters on pre-ignition behavior was determined to be small. Thus, pre-ignition was provoked by adjusting an elevated IMEP level of 18 bar that had been found to be prone to sporadic pre-ignition. At this IMEP, the SCE was operated under steady-state conditions for approximately 2 h to record multiple pre-ignition events, which allowed not only an individual cycle but also a statistical analysis of the results.
3D-CFD Simulation
3D-CFD simulation work was carried out to support the analysis of the experimental results. The objective was to provide information about local mixture quality at the time and location at which pre-ignition occurs since this information may not be obtained with the measurement equipment of the SCE.
For this purpose, the experimentally investigated SCE operating point was simulated in the 3D-CFD software AVL FIRE from AVL List GmbH. The simulation domain included the intake duct (including the PFI valve tip geometry) and the pre- and the main combustion chambers. The number of cells in the computational grid varies between 3,643,293 cells shortly after intake valve opening, 623,122 at bottom dead center during the high-pressure phase and 896,598 at top dead center firing. The global cell size of 4 mm was determined on the basis of extensive experience from previous simulation studies with the same engine platform and is considered to enable a sufficiently accurate resolution of local phenomena with the available computing resources. Smaller cell sizes were used where needed, for example, inside of the prechamber or in the intake and exhaust valve gaps. The simulation performed covers the exhaust, intake and compression stroke, starting at 592 °CA before firing top dead center (TDC) and ending at ignition timing. Turbulence was modeled with a Reynolds-averaged Navier-Stokes (RANS) approach (k-ζ-f model). Diffusion of gaseous species and wall heat transfer were modeled with the respective standard species transport and wall models of AVL FIRE. For the calculation of a time step to be considered as converged, the relative reduction of the residual of the continuity equation to 10−4 and 10−5 was chosen before and after IVC, respectively.
The boundary conditions, that is, mass flow rate at the intake duct inlet interface and static pressure at the exhaust duct outlet interface, as well as the initial pressure conditions in the intake and exhaust duct and in the pre- and main combustion chamber were derived using a “three-pressure analysis” (TPA) of the experimentally investigated SCE operating point in the engine cycle simulation software GT-Power from Gamma Technologies, LLC, in which the SCE was appropriately modeled. The wall temperature boundary conditions (constant values for different engine components such as intake and exhaust port, liner, piston, intake and exhaust valves) were set based on previous experience with this engine type. The use of the TPA approach resulted in only small deviations between measured and simulated data, concerning for example, IMEP (relative error of 0.2%), peak cylinder pressure (0.1%) as well as air mass flow rate (3.3%). The 3D-CFD simulation was then again validated against the GT-Power simulation results. Likewise, both simulation results show only small deviations in for example, cylinder pressure (mean relative error from IVC to IT of approx. 2.0%) and trapped mass (1.5%).
Results and discussion
To investigate pre-ignition behavior on an individual cycle basis and on a statistical basis, the SCE was operated in a steady state for approximately 2 h at defined engine operating conditions. The engine speed was set at 1500 min−1. The elevated IMEP level of 18 bar (cf. “section ‘Engine operating strategy’”) was key to provoke pre-ignition events while conservative levels of EAR (3.0), manifold air temperature (50°C) and ignition timing (IT, −8 °CA) were intended to strictly avoid knocking combustion while at the same time not limiting the occurrence of pre-ignition. For series engine application, the selected operating point is not considered ideal, for example, with regard to thermal efficiency due to the comparatively late ignition timing. The PFI valve was actuated during the intake stroke, with its energizing duration ranging from −360 °CA to −295 °CA. Based on these settings, stable engine operation at a comparatively low engine-out NOx level of approximately 20 mg/Nm3 (at 5% O2) was achieved. The mass fraction burned (MFB) 5%, 50% and 90% points were observed at 3.4 °CA, 14.0 °CA and 26.9 °CA, respectively. Manifold air pressure was 4.1 bar and exhaust pressure 3.4 bar.
Overview of pre-ignition events encountered during SCE operation
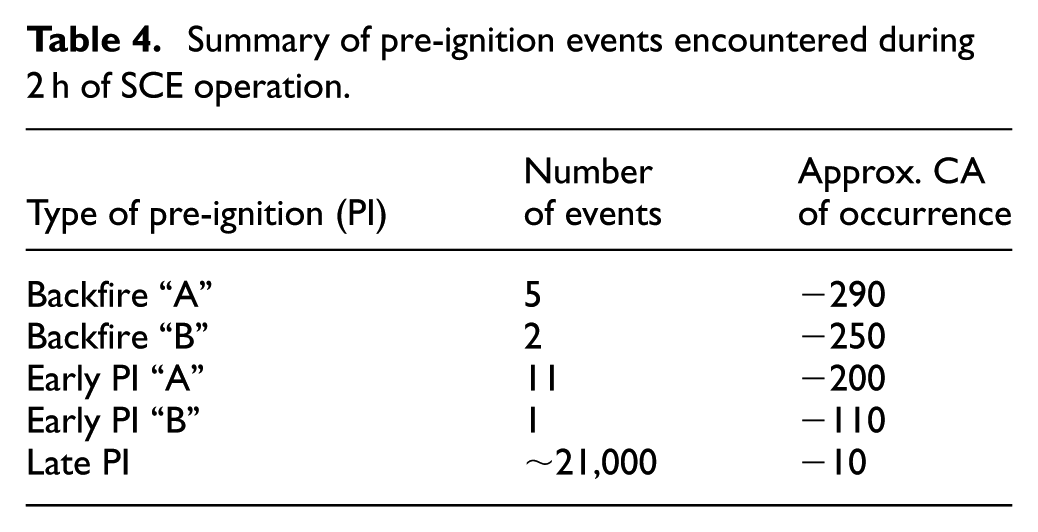
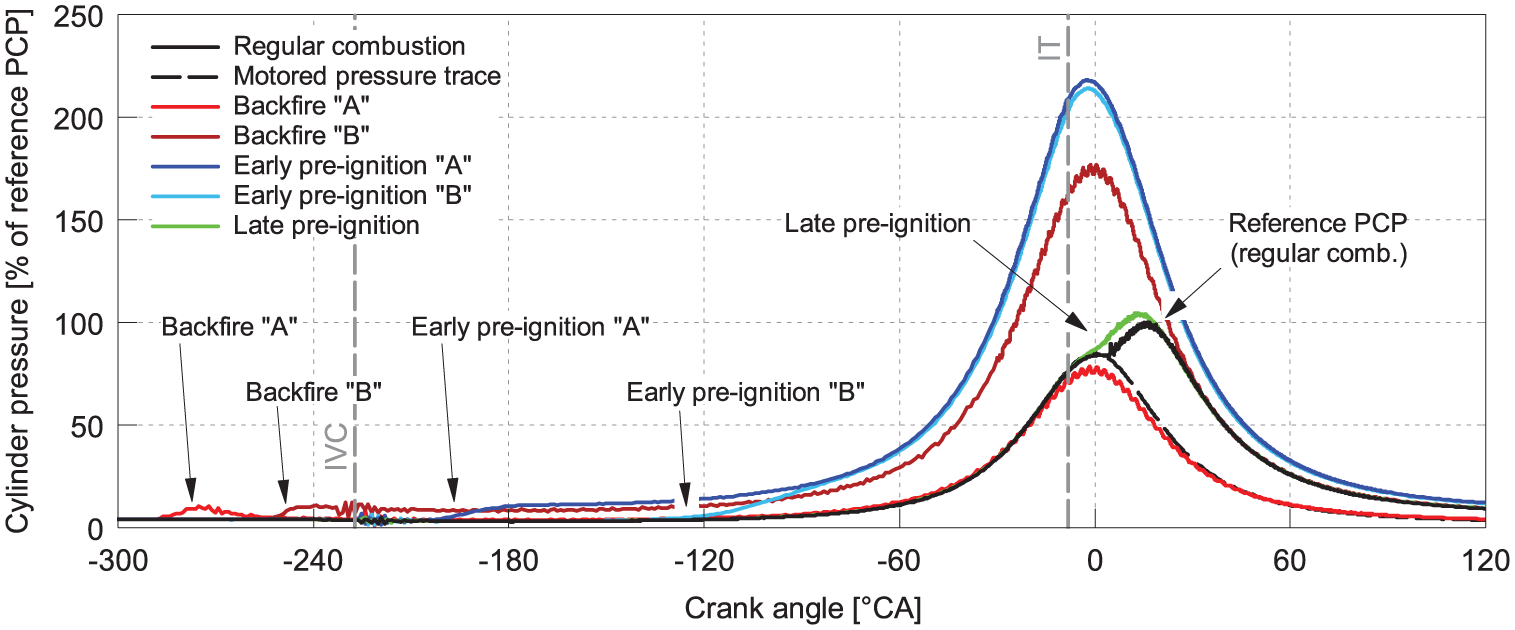
During the 2 h of SCE operation, different types of pre-ignition were observed; their number and approximate crank angle of occurrence are summarized in Table 4. Figure 6 shows example pressure traces of individual combustion cycles of each of the pre-ignition types. The peak cylinder pressure (PCP) of the regular combustion cycle serves as a reference value (100%) for all other relative pressure values plotted in the diagram.
Summary of pre-ignition events encountered during 2 h of SCE operation.
Types and characteristics of pre-ignition observed during SCE operation.
Backfires are characterized by ignition (and thus optical SoC) occurring during the time when the intake valves are still open so that the intake manifold pressure increases. This is due to the combustion and the related pressure increase in the combustion chamber and potentially combustion in the intake manifold, where the hydrogen is admitted through the PFI valve and mixes with fresh air. In the present study, two main types of backfire (labeled “A” and “B”) were observed. As illustrated in Figure 6, backfire type A occurs at comparatively early crank angles in the region of −290 °CA. Thus, combustion of the entire fresh cylinder charge is completed before intake valve closing (IVC). The resulting high-pressure cycle cylinder pressure trace is similar to a motored pressure trace yet at a slightly lower level. This behavior may be attributed to a different in-cylinder charge mass than in regular cycles that is caused by the combustion before IVC. In addition, the isentropic exponent of the hot burned gas in the combustion chamber is smaller and heat transfer to the combustion chamber walls during the entire high-pressure cycle is significantly greater, thus leading to a decrease in cylinder pressure. Backfire type B occurs closer to IVC at approximately −250 °CA. Compared to type A, the increase in cylinder pressure level due to combustion is not entirely lost through the open intake valves, but results in an elevated charge pressure at the onset of the compression stroke and thus in a significantly higher PCP than in regular combustion cycles.
Similarly, early pre-ignition events, which are defined here as pre-ignition whose optical SoC occurs after IVC at comparatively early crank angles during the compression stroke (i.e. up to −70 °CA, where cylinder pressure is still below 10% of the pressure at the end of compression of a cycle without combustion anomaly), have in common that the heat of the fresh mixture is released relatively soon during the high-pressure cycle, which leads to high pressure and temperature levels before the majority of the compression occurs and thus the highest observed PCPs. These PCP levels pose a significant risk of damage to the components loaded by the processes in the combustion chamber.
Two types of early pre-ignition were found and once again designated “A” and “B.” Type A, the most frequent type of early pre-ignition, occurred at approximately −200 °CA. Type B, which only occurred once, was observed at approximately −110 °CA. The resulting PCP levels of both types are similar as shown in Figure 6.
This study considers late pre-ignition events as pre-ignition whose optical SoC occurs close to the regular start of combustion (i.e. not earlier than −15 °CA, which corresponds to cylinder pressures of approx. 75% or beyond compared to the pressure at the end of compression of a cycle without combustion anomaly). Such events were found to take place at crank angles around −10 °CA and are thus characterized by an earlier combustion phasing and a slightly higher PCP compared to regular combustion cycles.
In summary, only 7 backfires and 12 early pre-ignition events were observed in approximately 85,000 recorded consecutive cycles, thus in roughly 0.02% of all cycles. In contrast, a significantly larger number of approximately 21,000 late pre-ignition events were recorded, or 24.7% of all cycles. This count includes late pre-ignition events yielding an optical SoC between −15 °CA and 0 °CA.
Detailed analysis of pre-ignition events based on optical measurement data
To provide the basis for a thorough understanding of the spatial origin and potential root causes of the types of pre-ignition events observed, this section discusses the detailed analysis of the optical measurement data of specific pre-ignition cycles.
Figure 7 shows light intensity and pressure traces acquired during a backfire type A cycle. As expected, the optical signals exhibit a significant increase during pre-ignition and the subsequent combustion process in the range of approximately −290 °CA to −230 °CA. The pattern of evolution of the individual optical signals plotted in the bottom diagram differs significantly from that of the reference case (cf. Figure 5) and is useful for explaining how the spatial origin of the combustion process caused by pre-ignition is determined. In general, the location of the onset of combustion (or the first location at which light emitted by the combustion process is detected by one of the sensors) is determined by finding the individual optical channels on both sensors with the first light intensity increase and by identifying the area where the fields of view of these specific channels intersect. In the example cycle, the onset of combustion is first detected by a channel in the center of the bottom row of sensor 1. The first light intensity signal increase at sensor 2 occurs in the outermost channel (exhaust flange side) of the bottom row. It is thus concluded that the location of pre-ignition origin is at the piston-liner edge at the 3 o’clock position (i.e. the angular position expressed as clock time based on the top view in Figure 4). While not presented here, all the other 18 backfire and early pre-ignition cycles were evaluated using the same approach.
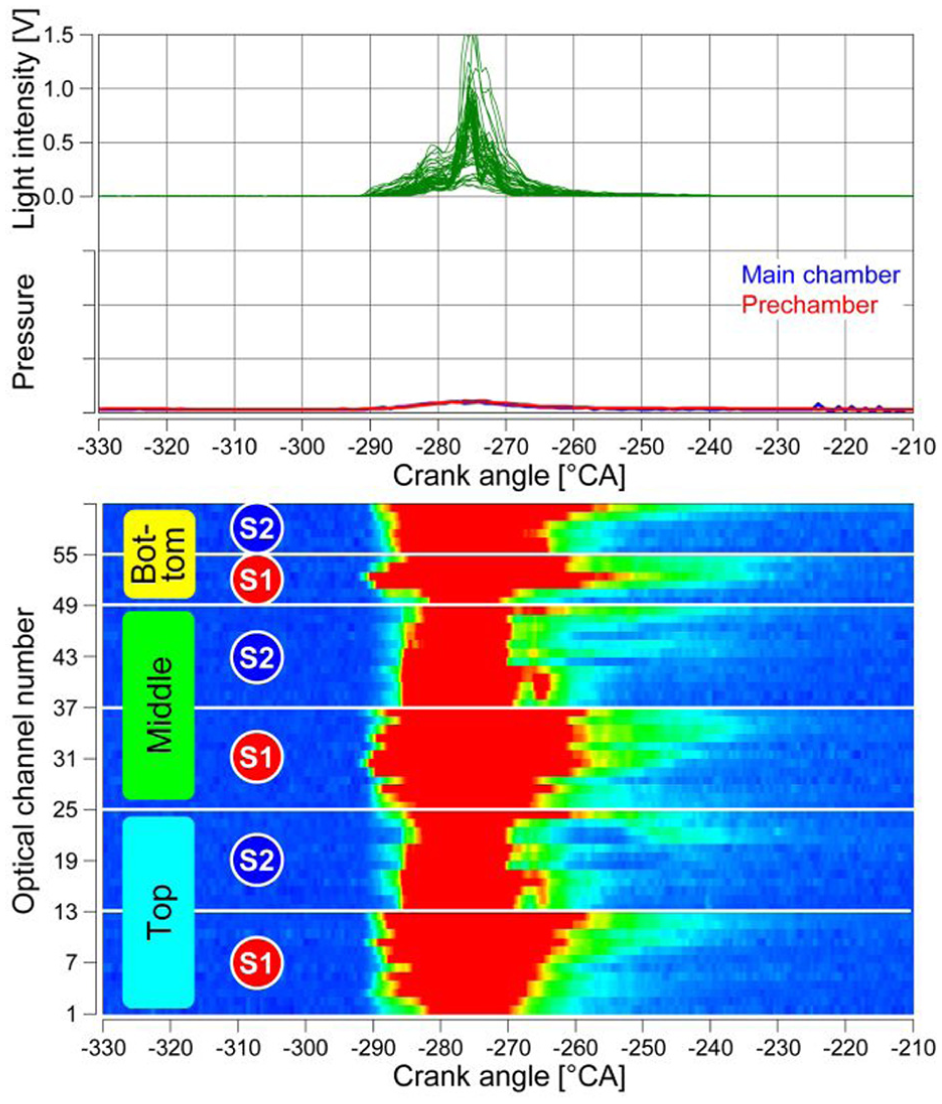
Light intensity, cylinder pressure and prechamber pressure traces of an example backfire type A cycle (with focus on the relevant crank angle range during the intake stroke).
As a starting point for analyzing the behavior of late pre-ignition, Figure 8 plots the optical SoC over MFB05% of all measured cycles within ranges relevant to regular and late pre-ignition combustion cycles. As an additional information, cycle density is indicated via hexagonal binning (i.e. the coloring of the hexagonal bins relates to the number of cycles per bin). The scatter plot illustrates that there are two distinct groups of cycles: In group (a), the optical SoC exhibits a quasi-linear correlation with MFB05%. In group (b), a wide range of optical SoC is observed in a comparatively narrow range of MFB05% around 3 °CA, which represents approximately the MFB05% scatter range of regular combustion cycles. Thus, there are two categories of late pre-ignition:
One in which late pre-ignition (detected by the optical instrumentation) triggers the onset of the main combustion of the hydrogen-air mixture, indicated by the corresponding advance in MFB05%.
One in which pre-ignition does not (or not immediately) trigger the onset of the main combustion so that the MFB05% remains in a range characteristic for regular combustion cycles.
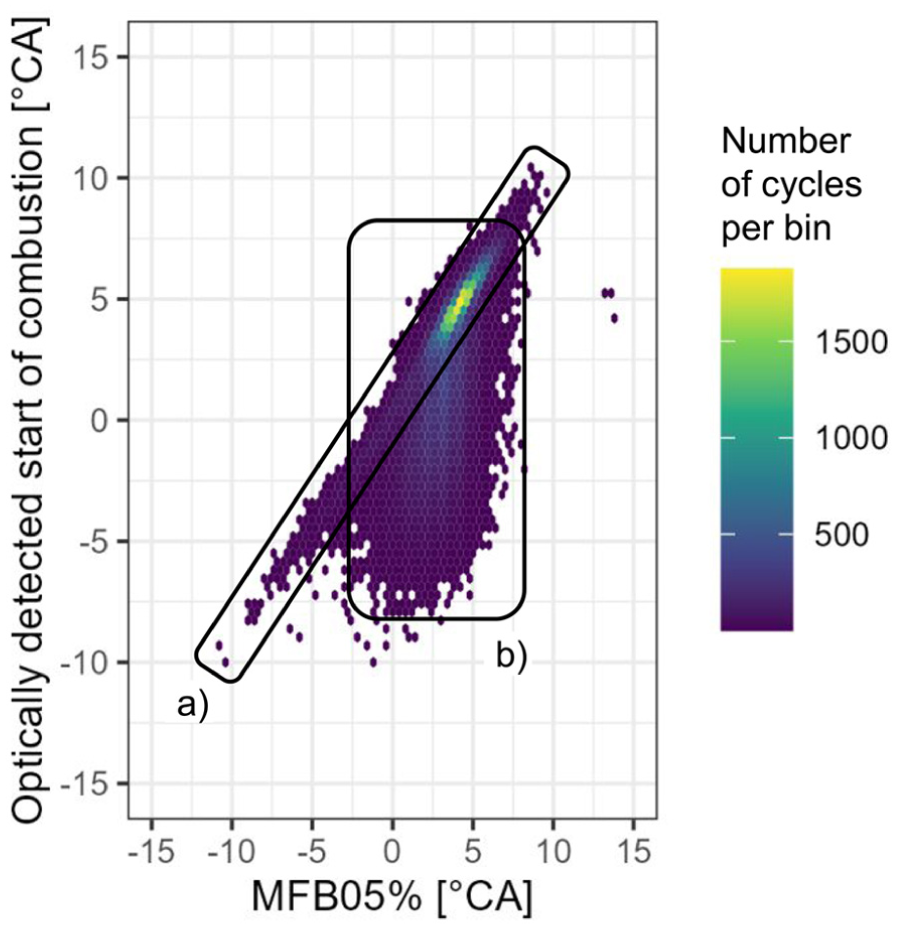
Correlation of optically detected start of combustion (optical SoC) and MFB05% of all measured cycles in a hexagonal bin plot to illustrate cycle density (number of cycles per bin) as additional information.
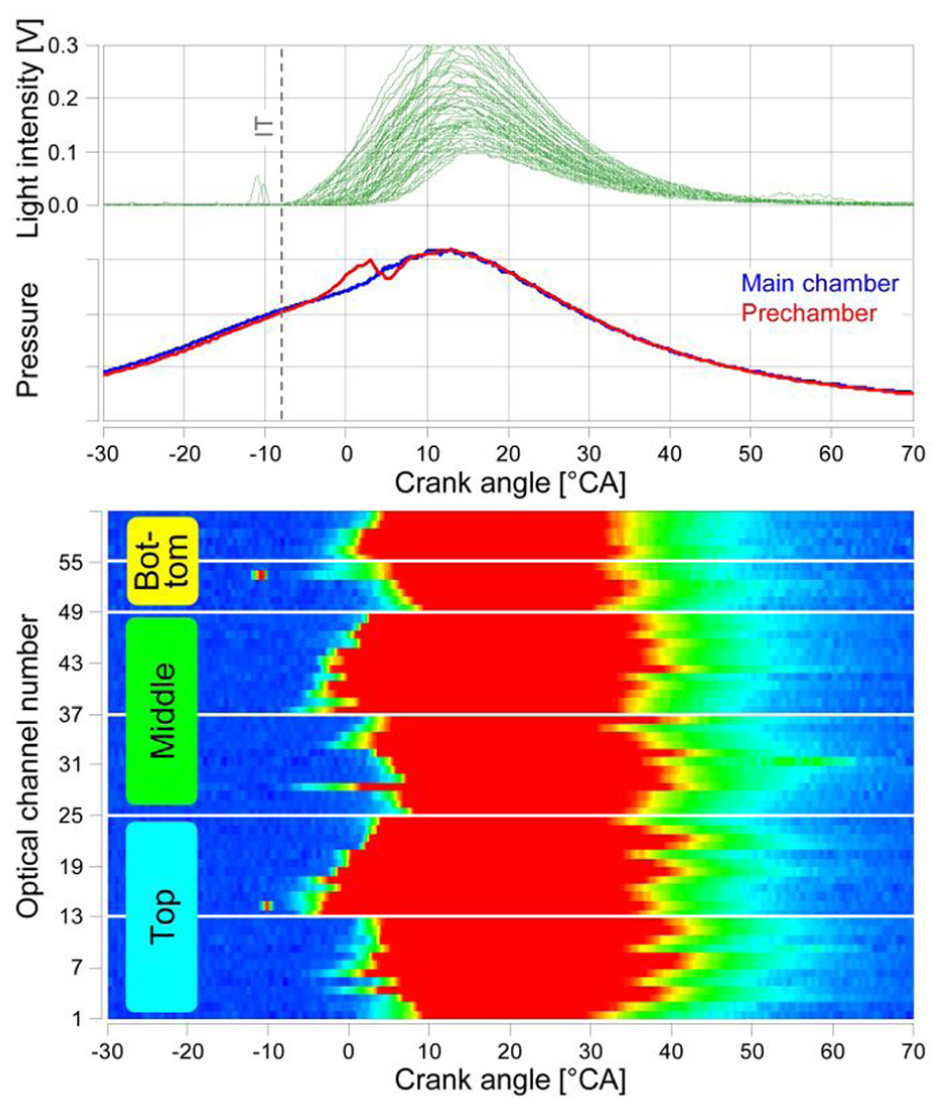
An example of the former category is illustrated in Figure 9, which presents the detailed results of a cycle that is subject to pre-ignition originating from the prechamber. It is characterized by an increase in prechamber pressure before both ignition timing and the optical SoC in the main chamber. While the main combustion onset is advanced (optical SoC −8.4 °CA, MFB05% −7.3 °CA), its optical signal pattern is very similar to that in Figure 5, which indicates that despite a different ignition source (pre-ignition vs spark), combustion inside the prechamber and subsequent ignition of the fresh mixture in the main chamber is very similar compared to regular combustion cycles. In most of the cycles with an early start of combustion in group a) in Figure 8 (i.e. cycles with a strong correlation between optical SoC and MFB05%), pre-ignition originates in the prechamber. However, the total number of these cycles is comparatively small.
Light intensity, cylinder pressure and prechamber pressure traces of an example late pre-ignition cycle with pre-ignition in the prechamber.
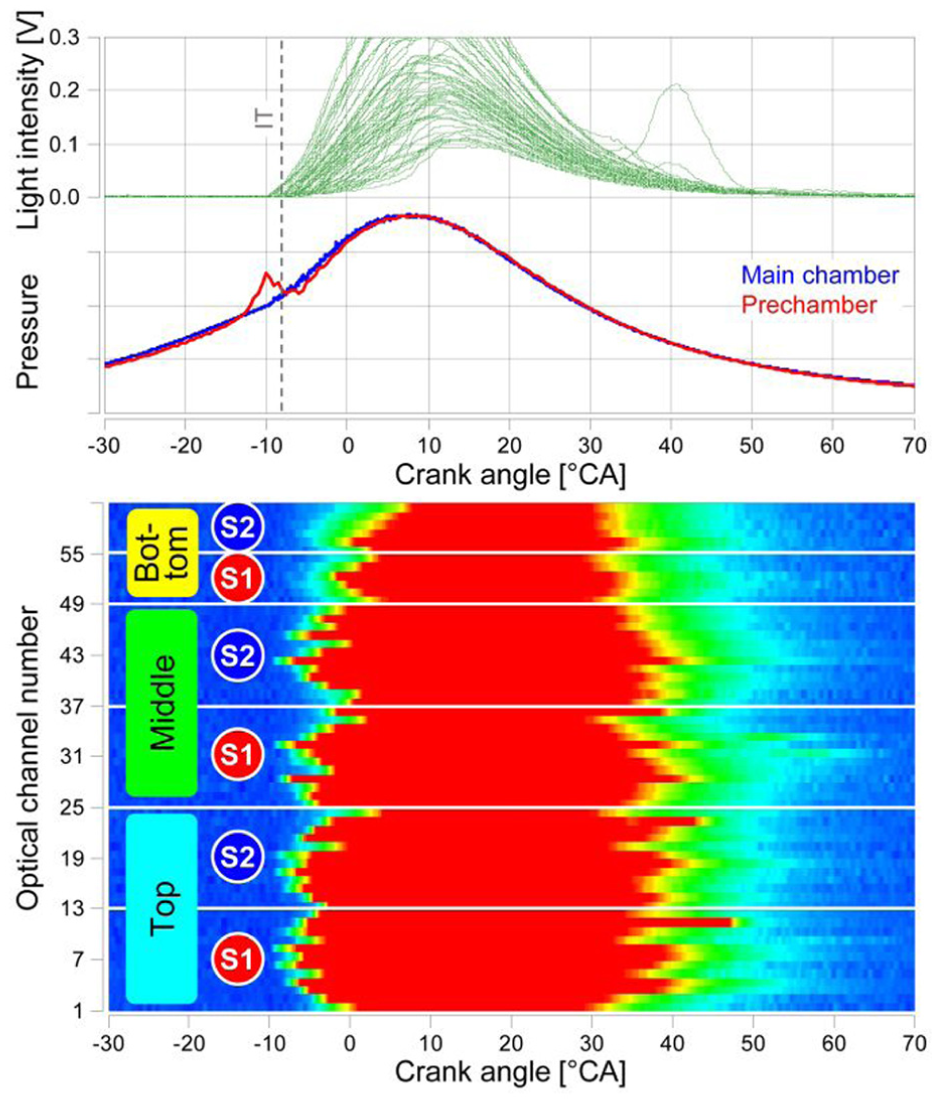
An example of the latter category is shown in Figure 10. In this case, the optical signals reveal an optical SoC at approximately −8.8 °CA, while the main chamber pressure trace does not indicate onset of the main hydrogen combustion until after TDC, with the related MFB05% observed at 3.3 °CA and without any sign of prechamber pre-ignition. As illustrated by the light intensity traces in Figure 10, the optical SoC is triggered specifically by the channels of sensor 1, indicating that a phenomenon restricted to a limited local area occurs near this sensor, which is not covered and thus undetected by the channels of sensor 2.
Light intensity, cylinder pressure and prechamber pressure traces of an example late pre-ignition cycle with pre-ignition in the main chamber but virtually unaffected MFB05%.
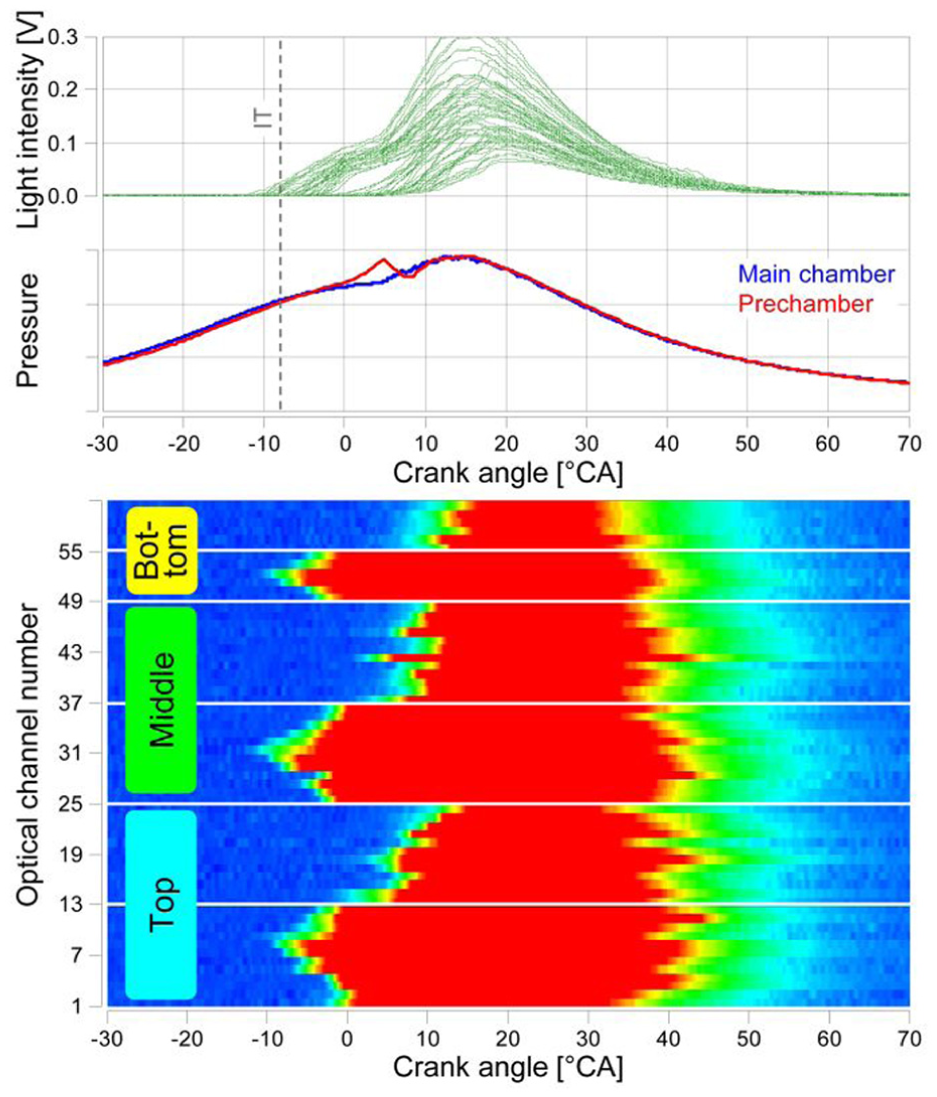
Figure 11 presents another example combustion cycle with an optical SoC of −4.8 °CA and a MFB05% of 0.5 °CA. Again, the observed event originally has a limited local extent, yet in this case, the pre-ignition appears to affect and thus advance the onset of the main hydrogen combustion process. In addition, short signal spikes on two individual optical channels before optical SoC are visible in Figure 11, indicating that short-lived combustion of small lubricant oil droplets takes place in specific small areas of the main combustion chamber. In general, if pre-ignition originates inside the main chamber, such “lubricant oil spikes” are often found in late pre-ignition cycles before or at the optical SoC. It therefore appears that despite its frequent occurrence, this type of lubricant oil combustion does not necessarily (immediately) trigger the onset of the main combustion. There are also “regular” combustion cycles in which minor lubricant oil combustion before TDC is visible, which does not fulfill the criterion to trigger and thus advance the optical SoC.
Light intensity, cylinder pressure and prechamber pressure traces of an example late pre-ignition cycle with pre-ignition in the main chamber, leading to a slightly advanced MFB05%.
Given the large total of late pre-ignition events, a representative sample of 25 cycles was analyzed in detail with regard to pre-ignition origin and combustion behavior; it will be the subject of further discussion below.
Discussion of the overall results and corresponding key findings
The results of the detailed analysis of the optical and standard measurement data from all considered pre-ignition cycles are condensed in Figure 12(a)), which illustrates the local occurrence and related number of different types of pre-ignition events. For backfire and early pre-ignition events in which there is a comparatively large distance between the piston and the cylinder head, the locations were all found to be at or in the vicinity of the piston surface, indicating that these events originate at the piston-liner edge and thus the “bottom” of the combustion chamber (for events occurring between −260 and −100 °CA, this conclusion is drawn based on all available information from the optical sensors and assumption of a spherical flame propagation during the crank angle range in which the piston is out of the optical sensors’ fields of view). Figure 12(a)) furthermore illustrates that backfire and early pre-ignition events tend to occur in an anti-clockwise direction. Expressed in clock times, the locations at the circumference of the piston surface range from approximately 3 o’clock (backfire type A) to 10 o’clock (early pre-ignition type B), following the crank angle chronology of these pre-ignition types.
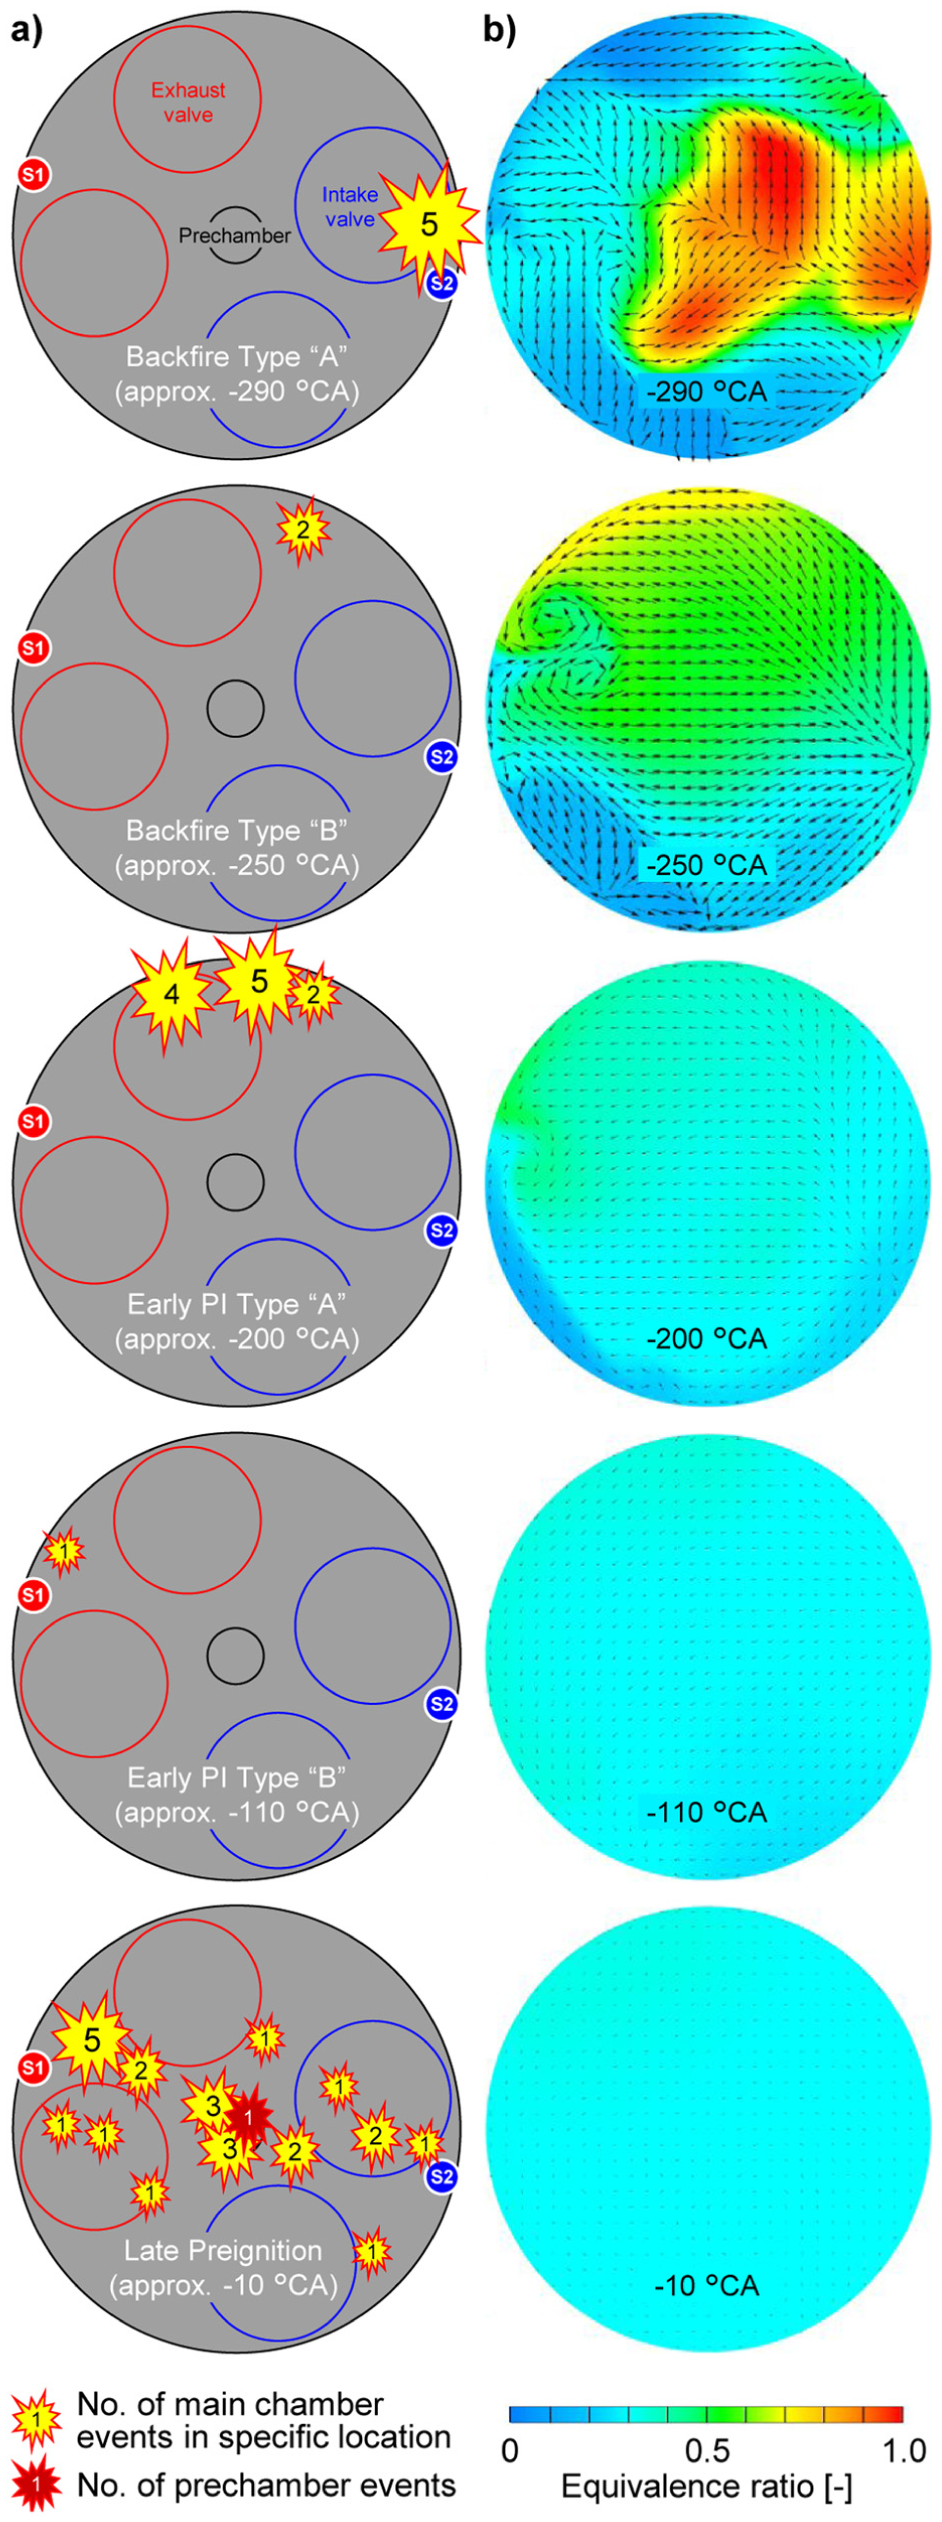
Temporal and local occurrence and number of experimentally observed pre-ignition events (a) and related equivalence ratio distributions from 3D-CFD simulation (b).
3D-CFD simulation of the mixture formation of the experimentally investigated SCE operating point was carried out to investigate whether there is a correlation between the location of origin of these pre-ignition events and local mixture quality; the results are presented in Figure 12(b)). The individual images plot the local equivalence ratio (reciprocal value of the EAR) on cutting planes perpendicular to the cylinder axis and at a distance of approximately 0.1 mm from the piston squish surface at the crank angles associated with the occurrence of pre-ignition. The simulation results show that the pre-ignition events tend to occur where the local equivalence ratio in the area near the liner is high, that is, where a comparatively rich hydrogen-air mixture is present. This behavior may be related to the fact that a decrease in EAR from lean to stoichiometric mixture leads to a decrease in the minimum energy required for ignition (minimum ignition energy, MIE). 26 Presuming that ignition sources (of whichever type) providing a comparatively small amount of ignition energy originate along the entire piston-liner edge, it is possible that pre-ignition events can only occur at angular positions where these ignition sources meet a relatively rich mixture with a low MIE. Correspondingly, further research is required to investigate if backfire and early pre-ignition can be eliminated by feeding the cylinder with a homogeneous hydrogen-air mixture, for example, relying on a central mixture formation system at a relatively large distance upstream of the cylinder head.
The actual root cause of backfire and early pre-ignition cannot be clearly determined based on the optical measurement data presented in this study. The fact that these pre-ignition events originate at the piston-liner edge, however, suggests that various ignition sources emerging from the piston top land crevice such as hot residual gases or reactive species are possible for example, due to reverse blowby; a phenomenon in which gas and potentially liquid lubricant oil are transported from the engine crankcase (or at least from the second piston land) via the piston/liner/ring sealing interface to the combustion chamber. Given the lubrication of the piston-liner interface, lubricant oil may also play a role, but in-cylinder conditions at crank angles associated with backfire and early pre-ignition appear unlikely to promote autoignition and subsequent diffusion combustion of lubricant oil droplets. As outlined in the introduction based on the existing literature, however, the presence of lubricants may also increase cylinder charge reactivity due to the introduction of intrinsically more reactive species as well as the simultaneous enrichment of the charge near oil droplets.
In contrast to the trends observed for backfire and early pre-ignition, the locations of origin of the 25 late pre-ignition cycles analyzed and illustrated in Figure 12(a)) are randomly distributed throughout the combustion chamber. One event (as discussed based on Figure 9) was found to occur in the prechamber; no optical measurement data for further detailed analysis of the origin of the pre-ignition is available. Events occurring in the main combustion chamber have their location of origin near or at the piston surface, but in general, the axial extent of the combustion chamber near TDC is comparatively small and the axial location of pre-ignition origin cannot be determined precisely with the employed optical measurement system. The corresponding 3D-CFD simulation result in Figure 12(b)) indicates that at −10 °CA, the hydrogen-air mixture is already well homogenized. This may support the prevention of grouping of the locations of origin of late pre-ignition in specific regions in the combustion chamber as a result of differences in local mixture quality. At the same time, the risk of damage to the engine intake system is drastically increased since backfires may ignite the entire premixed hydrogen-air mixture contained in the intake pipe.
As for the root cause of late pre-ignition, lubricant oil combustion appears to play a significant role, specifically in pre-ignition events that originate in the main combustion chamber. With a comparatively weak correlation between optical SoC and MFB05%, most of these late pre-ignition cycles are characterized by distinct lubricant oil combustion which may or may not (immediately) trigger the onset of the main hydrogen combustion process. Further discussion is required of the potential root causes in cycles without distinct “lubricant oil spikes” in the optical signals. Hot spots and local accumulation of hot residual gases appear unlikely given the random spatial distribution of the pre-ignition locations of origin, for example, the significantly different component temperatures of the intake and exhaust valves do not seem to have a significant impact on the location of pre-ignition. Glowing particles could be identified by the optical measurement system from a distinctive trace in the optical data. 22 Based on a procedure of exclusion, reactive lubricant oil and reactive deposits on component surfaces could play a key role in providing the ignition energy required for pre-ignition. Late pre-ignition originating in the prechamber might arise because of hot spots on the spark plug, which would explain the very similar ignition pattern compared to regular combustion cycles. In general, further research into late pre-ignition is required to understand if this phenomenon still occurs frequently if an earlier ignition timing is set than the comparatively late one used in this study.
Summary and outlook
One of the limitations to high power density in pure hydrogen-fueled large engines is the occurrence of pre-ignition. Mitigation measures such as exhaust gas recirculation and liquid water injection greatly increase engine system complexity and do not necessarily eliminate the root cause of these combustion anomalies. Thus, this study aimed to obtain detailed understanding of pre-ignition occurring in pure hydrogen-fueled lean burn operation by examining standard and optical measurement data and investigating the impact of engine operating parameters on the type, probability of occurrence, initial location and root cause of pre-ignition.
Engine tests on a large high-speed SCE of the 3 dm3 displacement per cylinder class with hydrogen PFI and a prechamber spark ignition system revealed that IMEP has the most significant impact of all the investigated operating parameters on pre-ignition occurrence. Consequently, pre-ignition events were provoked by adjusting an elevated IMEP level that had been found to be prone to sporadic pre-ignition. At this IMEP, the SCE was operated in a steady-state for approximately 2 h in order to record multiple pre-ignition events that should serve as the basis for further detailed analysis. In-depth information about the origin and potential root causes of pre-ignition was obtained from optical measurement data from the combustion chamber acquired with AVL List GmbH’s Visiolution system. 3D-CFD simulation work was carried out to support the analysis of the experimental results by providing information about local mixture quality at the time and the location where pre-ignition occurs.
Of the approximately 85,000 consecutive combustion cycles recorded, only 7 backfire and 12 early pre-ignition events occurred, while approximately 21,000 late pre-ignition events were observed. Backfire and early pre-ignition were found to originate near the piston-liner edge at the “bottom” of the combustion chamber and tended to occur in specific areas around the piston circumference where a comparatively rich local mixture prevails. This may be related to the fact that a decrease in EAR from a lean to a stoichiometric mixture results in a decrease in the minimum energy required for ignition. This behavior indicates that mixture homogeneity may be the key to reducing the risk of backfire and early pre-ignition. The actual root cause of these pre-ignition events could not be clearly determined. The locations of origin, however, suggest that various ignition sources emerging from the piston top land crevice such as hot residual gases or reactive species (e.g. due to reverse blowby) are possible. Given the lubrication of the piston-liner interface, lubricant oil may also play a role, but in-cylinder conditions at the crank angles associated with backfire and early pre-ignition appear unlikely to promote autoignition and subsequent diffusion combustion of lubricant oil droplets.
The locations of origin of a representative sample of 25 late pre-ignition events are randomly distributed throughout the combustion chamber, potentially supported by the relatively well homogenized hydrogen-air mixture as the piston approaches TDC. Distinct lubricant oil droplet combustion can be found before the onset of the main combustion process in many late pre-ignition cycles but is not clearly prevalent in others. Hot spots and local accumulation of hot residual gases appear unlikely given the random spatial distribution of the pre-ignition locations of origin. Glowing particles would have been identified by the optical measurement system. Based on a procedure of exclusion, reactive lubricant oil and reactive deposits on component surfaces could play a key role in providing the ignition energy required for pre-ignition. A small number of late pre-ignition events originating in the prechamber may be caused by hot spots on the spark plug.
Based on these key findings, additional effort is required to completely answer the question of how the limitations imposed by combustion anomalies can be overcome. On the one hand, future research must study the impact of mixture homogeneity on the occurrence of backfire and early pre-ignition. On the other hand, further investigations must strive to understand the root cause for the underlying processes that provide the required ignition energy. Oil quality variations are one possible measure to determine the role of the lubricant oil versus that of for example, hot residual gas or reactive reverse blowby. Hardware variations (e.g. piston ring pack) could serve to investigate the impact of change in the quantity of lubricant oil introduced into the combustion chamber. Additional optical measurement technology such as combustion chamber endoscopy could provide valuable information about the emergence of pre-ignition events. The roles of lubricant oil, reactive deposits on components and hot spots (the last specifically in the prechamber) in late pre-ignition must be investigated in more detail. In general, further research is required to understand if late pre-ignition still occurs frequently if an earlier ignition timing is set than the comparatively late one used in this study. To enable the transfer of key findings from SCE investigations to series engine applications, solutions to overcome combustion anomalies must be capable of tolerating the occurrence of cylinder-to-cylinder deviations on multi-cylinder engines, caused for example, by small differences in hardware components, gas dynamics in the intake and exhaust systems and potential additional ignition sources such as lubricant oil droplets induced from the turbocharger lubrication system.
Footnotes
Appendix
Acknowledgements
The authors would like to acknowledge the financial support of the “COMET - Competence Centers for Excellent Technologies” Program of the Austrian Federal Ministry for Climate Action, Environment, Energy, Mobility, Innovation and Technology (BMK) and the Austrian Federal Ministry of Labor and Economy (BMAW) and the Provinces of Salzburg, Styria and Tyrol for the COMET Centre (K1) LEC GETS. The COMET Program is managed by the Austrian Research Promotion Agency (FFG). In addition, this publication is supported by the TU Graz Open Access Publishing Fund.
The authors would further like to thank Dr. Harald Philipp from AVL List GmbH for his detailed analysis of the results.
Ethical considerations
Not applicable.
Consent to participate
Not applicable.
Consent for publication
Not applicable.
Funding
The authors disclosed receipt of the following financial support for the research, authorship, and/or publication of this article: This work was supported by the Austrian Research Promotion Agency (FFG) [grant number 892425].
Declaration of conflicting interests
The authors declared no potential conflicts of interest with respect to the research, authorship, and/or publication of this article.
Data availability statement
All data generated or analyzed during this study are included in this published article.