
Abstract
The automotive industry must mitigate climate change by reducing vehicle carbon emissions and promoting sustainable transportation through technical solutions and innovations. Biofuels are seen as a solution to reduce CO2 emissions, but they may affect fuel performance and emissions. Second-generation biogasoline mixed with ethanol has proven that it can be introduced as a drop-in fuel with the same performance and tailpipe emissions at the same level as fossil fuels. However, particulate matter (PM) emissions are significantly higher than fossil fuels. This study aims to experimentally investigate the effect of port and direct fuel injections on the PM emissions in a boosted spark ignition (SI) engine fuelled by Euro 6 standard biofuel with a 99 octane number blended with 20% ethanol compared to a fossil fuel baseline. The single-cylinder SI engine was equipped with two fuel injectors, a direct injector and a port fuel injector, and operated with externally boosted air. The split injection ratio was adjusted from 100% direct injection (DI) to 100% port fuel injection (PFI) to investigate the combustion characteristics and particulate emissions (PM) at different engine loads and speeds. The results indicate that by changing 100% DI to 80% PFI, PM emissions numbers between particle sizes of 23 and 1000 nm were dropped by 96.56% at a low load operation of 4.6 bar IMEP for the 99 RON E20 biogasoline and by 84% for the 95 RON E10 fossil fuel while maintaining the same indicated thermal efficiency and a similar level of other emissions. However, at a higher load above 10 bar IMEP, it was found that full DI operation reduced particulate numbers (PN) by 64% and 38% for 99 RON E20 biogasoline and 95 RON E10 fossil fuel at 20 bar IMEP, respectively, and enabled more stable operation at 3000 rpm with higher load operation regions.
Keywords
Introduction
To accomplish the global goal of a zero-carbon society and to transition to a net-zero-carbon community in 2050 and beyond, the powertrain technology used in all transportation sectors must be significantly modified. The automotive industry is making significant adjustments to reduce and eliminate carbon emissions from on-road vehicles. 1 Electric vehicles can reduce greenhouse gas (GHG) emissions. The potential for reducing greenhouse gas emissions depends on vehicle design, adoption, commuting and charging patterns, charging infrastructure, and electricity generation mix. However, the life cycle emission and electrified vehicle adoption are the primary challenges in this field, as well as the Battery Electric Vehicle (BEV)’s inapplicability to heavy-duty applications.2–4
Internal combustion engine (ICE) technology itself is not the source of CO2 emissions, while carbon-based fuels are the source of CO2 emissions when burning in ICEs. ICEs can also contribute to zero-carbon transport when replacing fossil fuels with zero-carbon fuels like hydrogen and ammonia. However, widespread adoption of these zero-carbon fuels requires significant investment, infrastructure development, and regulatory and governmental support.5–8
Biofuel is a fuel derived from or produced by living organisms. The energy of biofuel is stabilized through biological carbon fixation, which converts carbon dioxide into an exclusively plant-based sugar. In contrast to fossil fuel, biofuel is rapidly produced or obtained from living organisms, as opposed to organic matter decomposing over millions of years. First-generation biofuels are derived from food crops such as maise, wheat, and soy, and biofuel is manufactured from these plants’ starch, sugar, and oil. Second-generation biofuels have been devised to overcome this disadvantage of ‘first-generation’ biofuels. These are non-food crops like grass, wood, and organic refuse.9–13 They can be used in the current engines as drop-in fuel because of their almost identical physical and chemical properties. 14 Biogasoline has the potential to play a significant role in the transition to a more sustainable and environmentally benign transportation sector as research and development efforts continue and as supportive policies are implemented.15,16 However, the PM emissions from DI engines are a significant concern, and they are functions of properties of the fuel, the combustion process, and the engine design.17–19
Biofuels are characterized by a higher concentration of heavier aromatics than fossil fuels, indicating a significant potential for increased PM emissions. It is widely known that DI produces higher particulate matter (PM) emissions, while PFI exhibits lower PM emissions. Therefore, optimizing fuel injection strategies between PFI and DI may significantly reduce PM emissions; however, it can reduce engine performance and increase other pollutants.20,21 The utilization of various alcoholic fuels, for example, ethanol, has been found to result in a significant decrease in emissions and exhibit a greater influence on engine performance.22–25
The direct injection (DI) system provides higher thermal efficiency thanks to the benefits of higher injection pressure and cooled charge. However, it also generates significantly higher PM emissions levels than the port fuel injection (PFI) system. Studies have shown that utilizing dual fuel injection strategies could maximize the advantages of this, as it delivers enhanced engine stability and knock resistance at higher loads.26,27 Meanwhile, PFI’s homogeneous charge performs just as well as DI at low and mid-loads, with the bonus of emitting fewer PMs.28–31
Previous dual fuel studies have shown a potential to drop engine-out emissions and improve efficiency at low loads using gasoline fuel. In contrast, the main challenge behind this biogasoline is the higher PM emissions due to the fuel characteristics.32,33 This study investigates the effect of DI and PFI on the PM emissions from a single-cylinder SI engine with second-generation biogasoline of a higher octane number of 99 with 20% ethanol, which provides a higher knock resistance so that the potential benefit of DI and PFI strategy can be explored without experiencing load restrictions due to the higher kock and the lower combustion stability of the lower octane number and lower ethanol content fuels. In particular, a direct comparison was made between the 99 RON E20 biogasoline fuel and the 95 RON E10 fossil fuel to evaluate the potential of biogasoline.
Experimental setup
The single-cylinder engine consists of a single-cylinder engine block and the cylinder head from a 3-cylinder gasoline engine by MAHLE Powertrains. As shown in Figure 1, it has been connected to a fully instrumented AC dynamometer testbed. The adaptability and versatility of single-cylinder engine testing reduce engine development time, cost, and complexity in the engine control unit. Previous works on this single-cylinder research engine evaluated PFI, DI, and water injection strategies. 34
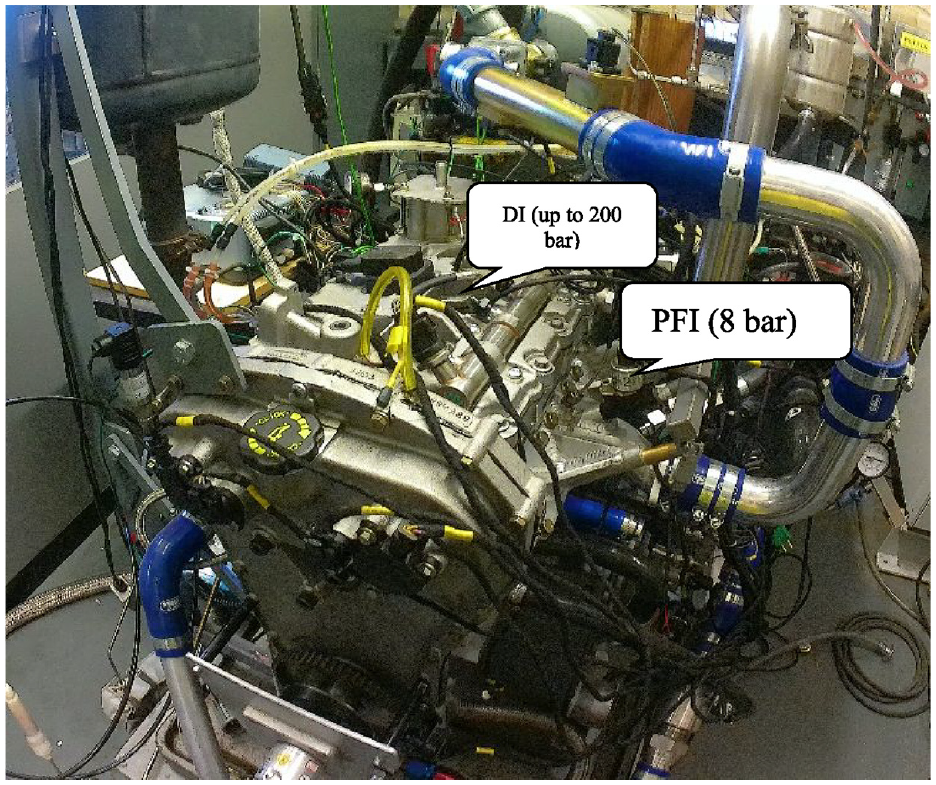
Single-cylinder engine testbed.
The test cell is equipped with a Data Acquisition (DAQ) system that consists of an NI-USB 6353 fast card with 32 analogue inputs at 1.25 MS/s and an NI-USB 6210 card as an additional time domain card. This system can capture all data in the crank and time domains for rapid analysis, and it can also take input from pressure and temperature sensors in the time domain. A proprietary combustion analysis programme was utilized to monitor the primary combustion parameters, record the in-cylinder pressure data for up to 300 cycles, and display live telemetry data for 37 input channels. Table 1 shows the engine’s hardware specifications. The cylinder head features two inlet valves, two exhaust valves, and double overhead camshafts with 40°CA cam phasers that are hydraulically adjustable. The centrally-mounted gasoline injector has 8 holes and is capable of a maximum injection pressure of 200 bar pressure. The PFI injector can be operated at an injection pressure of 4–10 bar and is mounted with an angle of 48° to the intake ports. The injection timing of the PFI injector can be adjusted to support open and close valve injection modes. Also, the test cell is equipped with a standalone boosting system with an air drier to maintain the humidity level near zero, capable of delivering a boosting pressure of up to 3.5 bar absolute. To maintain the quality of the measurements, the intake system has a heater that maintains the intake air temperature at 40°C and it operates with a proportional-integral-derivative (PID) controller. With a 100 mJ coil-on-plug configuration, the spark electrode is also positioned centrally on the engine cylinder head. Lastly, the engine is managed by a MAHLE Flexible ECU (MFE) that employs a control software framework adaptable to any new engine technology and instantly customizable. The MFE is capable of running in a closed loop control mode for a fixed lambda (λ) value based on the measurements of two wide lambda sensors in the exhaust line and adjustment of the boosting pressure. Moreover, MFE controls DI and PFI timing by specifying the start or the end of the injection and the injection quantity in each injection system by controlling the split ratios by mass. Finally, the MFE is used to control the spark timing and the intake and exhaust valve opening times to control the valve overlap angles.34–36 To ensure higher data quality, the test points in this study are the averages of 300 cycles captured during steady-state operations. This is crucial because all emission and combustion parameters must be measured at a steady-state operation point. Moreover, our DAQ system can verify each analogue reading signal’s coefficient of variation (COV). It automatically issues a warning message to repeat the testing points if a changed value occurs during a load or if a higher variation is detected in the lambda closed-loop control circuit. When using DMS 500, a self-synced programme with an additional warning for the boundary conditions of PM measurements, such as changes in flow or temperature variations exceeding 3° by the PID controller, the software terminates the testing point and repeats the test. Finally, the standard deviation factor for the averaged PN numbers at steady state was set to five to maintain the accepted variation of PN readings under 0.5%.
Specification of the single-cylinder engine.
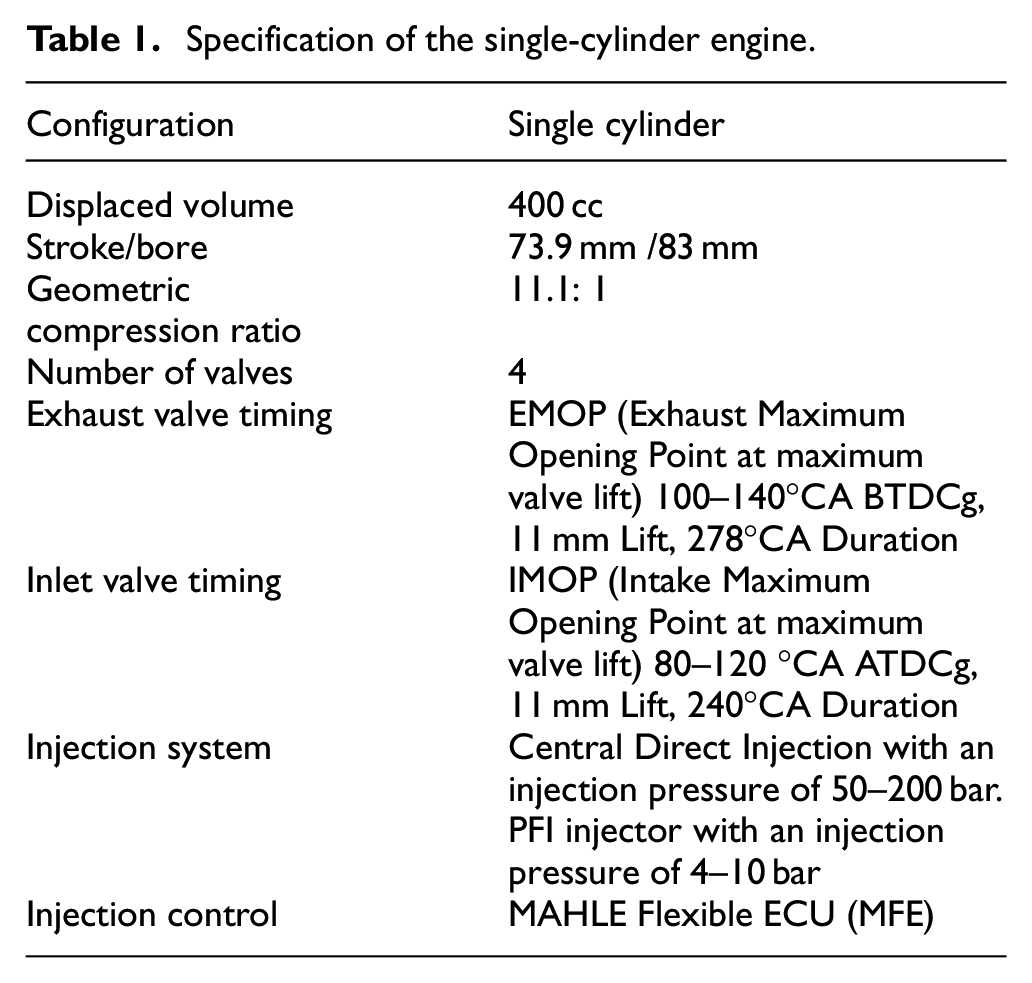
Figure 2 illustrates the configuration of the testbed, which incorporates a separately operated external boosting system. Two piezo-resistive pressure sensors were used to measure the instantaneous intake and exhaust pressures. In addition, the coolant and oil temperatures were regulated to ensure stable and consistent coolant temperatures during all steady-state testing conditions. Gaseous emissions were measured by a HORIBA (MEXA-584L for CO/CO2) and Signal (Ambitech model 443 Chemiluminescent NO/NOx and Rotork Analysis model 523 flame ionization detection (FID) hydrocarbon (HC) analysers. A fast response Cambustion DMS500 was used to measure particle number and size distribution. Real-time processing at 10 Hz of outputs from 22 electrometers provides spectral data and other parameters. The DMS 500 has patented features of giving a T10–90% response of just 200 ms.The system is designed with two-stage dilutions and a heated sample line operating at 150°C. The initial dilution stage, located at the sample point, employs a factor of 4, followed by a second dilution stage before sampling with a dilution factor of 14, calibrated for compatibility with various fuels. The DMS 500 is linked to the engine’s exhaust via a heated sampling line. A primary diluter in the heated sampling line utilizes pressurized air, regulated by the DMS500, to achieve a precise dilution factor.37–39
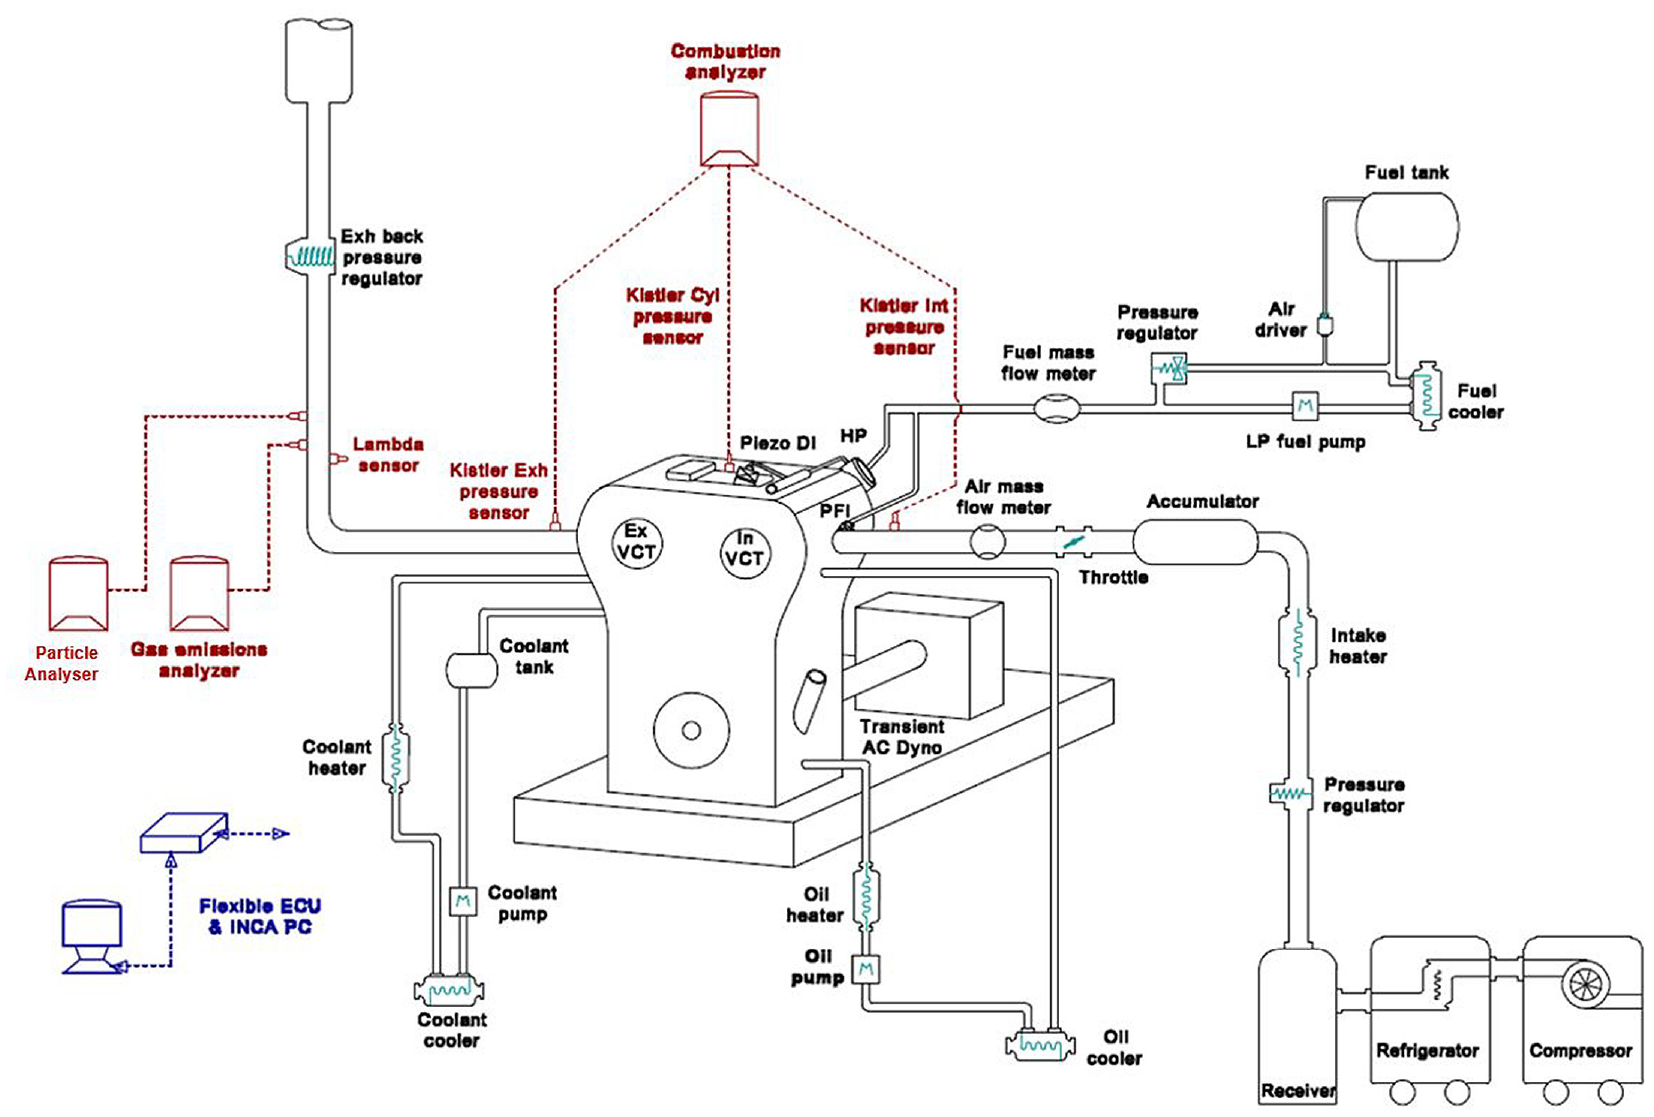
Test cell schematic structure. 36
Fuel properties
The experiments were conducted using a 99 RON E20 biogasoline fuel that had been provided by Coryton as a prototype fuel with the test certificates. Producing bioethanol from waste biomass or agricultural waste such as grass is the initial phase. This lignocellulosic biomass is initially pre-treated to make enzymes more accessible. Following pretreatment, the biomass is subjected to enzymatic hydrolysis to convert into sugars, which are then fermented to ethanol using a combination of microorganisms. As depicted in Figure 3, this bioethanol is dehydrated into ethylene and ‘grown’ at 300–400°C in the presence of a zeolite catalyst into longer-chain hydrocarbons. 40
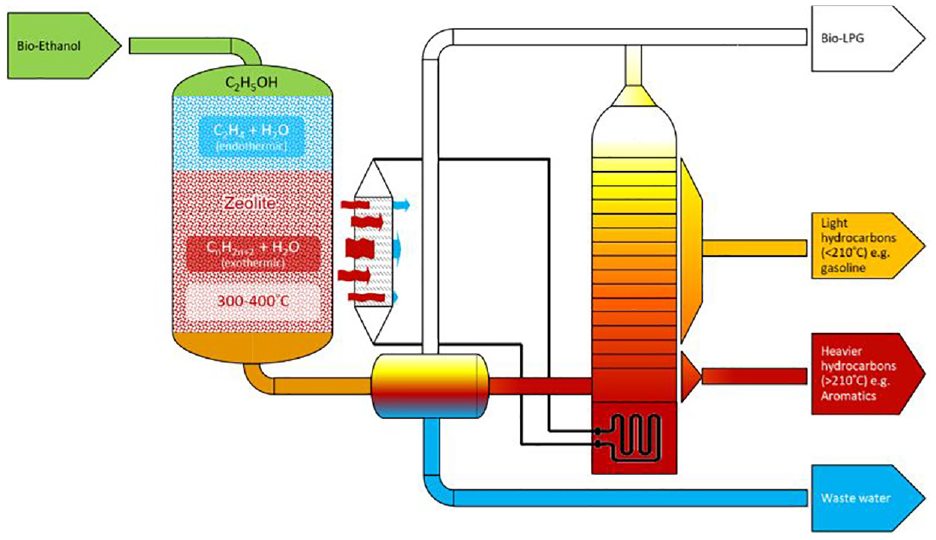
Schematic of the ethanol-to-gasoline conversion process. 41
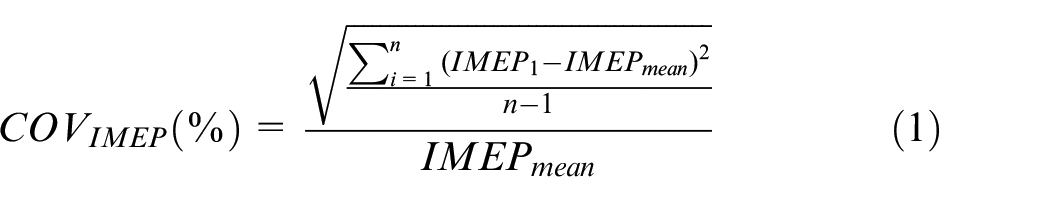
According to previous investigations, a greater indicated thermal efficiency was achieved by 95 RON E20 biofuel than 95 RON E5 and E10 second-generation biofuels. It provides greater stability at higher loads with minimal Knock intensity when all fuel is injected directly into the cylinder. This enabled the engine to achieve a higher load with stable operation before reaching the coefficient of variation (COV) limit at 3%, which is presented in the real-time DAQ system and calculated from equation (1). 42 In comparison, cycle-to-cycle stability worsened when PFI was used at a high load.
In this study, 99 RON E20 biogasoline was chosen for the experimental study as it contains a higher ethanol percentage and has a higher Octane number. This enables the engine to operate at a higher load with high knock resistance and provides greater engine stability at higher loads with full PFI mode in comparison to similar second-generation biogasoline with fewer octane numbers and lower ethanol concentration.
Figure 4 displays the chemical composition of the 99 RON E20 biogasoline. Fuels with a high molecular weight and a higher boiling point increase the likelihood of soot formation and volatility of heavy hydrocarbons. The resultant fuel-oil mixture has a greater possibility of escaping the combustion chamber in droplet form, contributing to the emission.
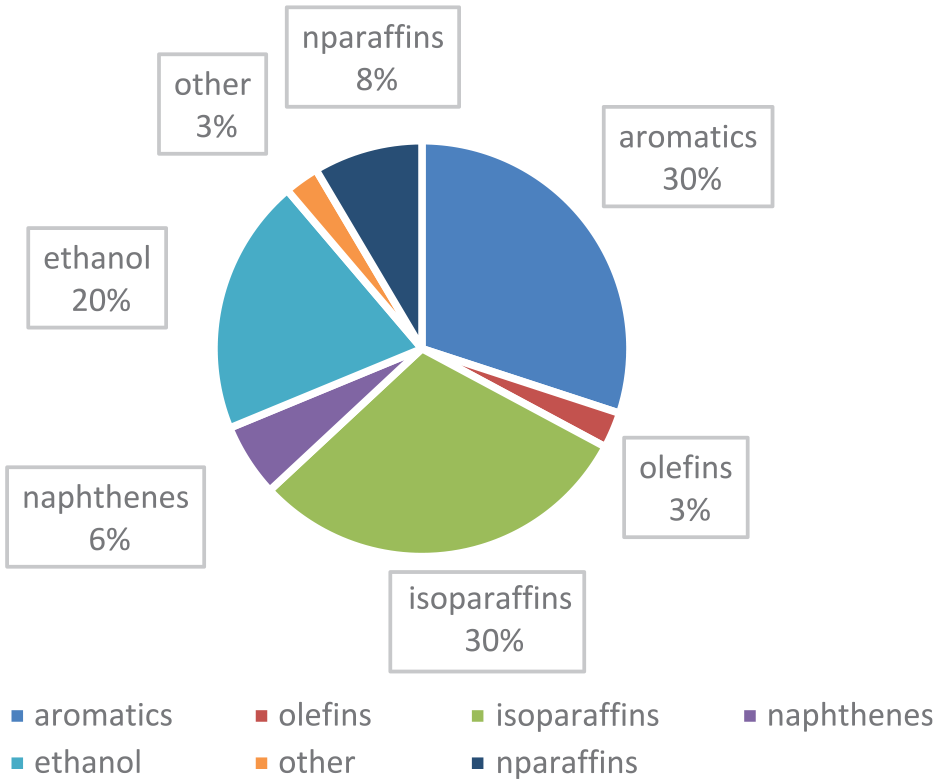
99 RON E20 biogasoline compositions.
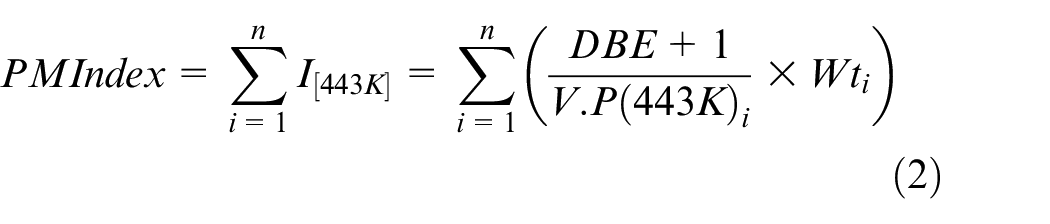
The characteristics of the test fuels are listed in Table 2. The baseline 95 RON E10 fossil fuel used is formulated according to the EN228. The same fuel standard was selected as a rigorous benchmark for the 99 RON E20 biogasoline fuel—the preparation and analysis of blended biofuels with the same octane number and ethanol concentrations. The PM index is a predictor of the particulate emission of each fuel. The PM index considers the vapour pressure of the fuel and the double bond equivalence of each fuel compound in the total fuel mixture and is given by equation (2). 43
Fuel properties. 14
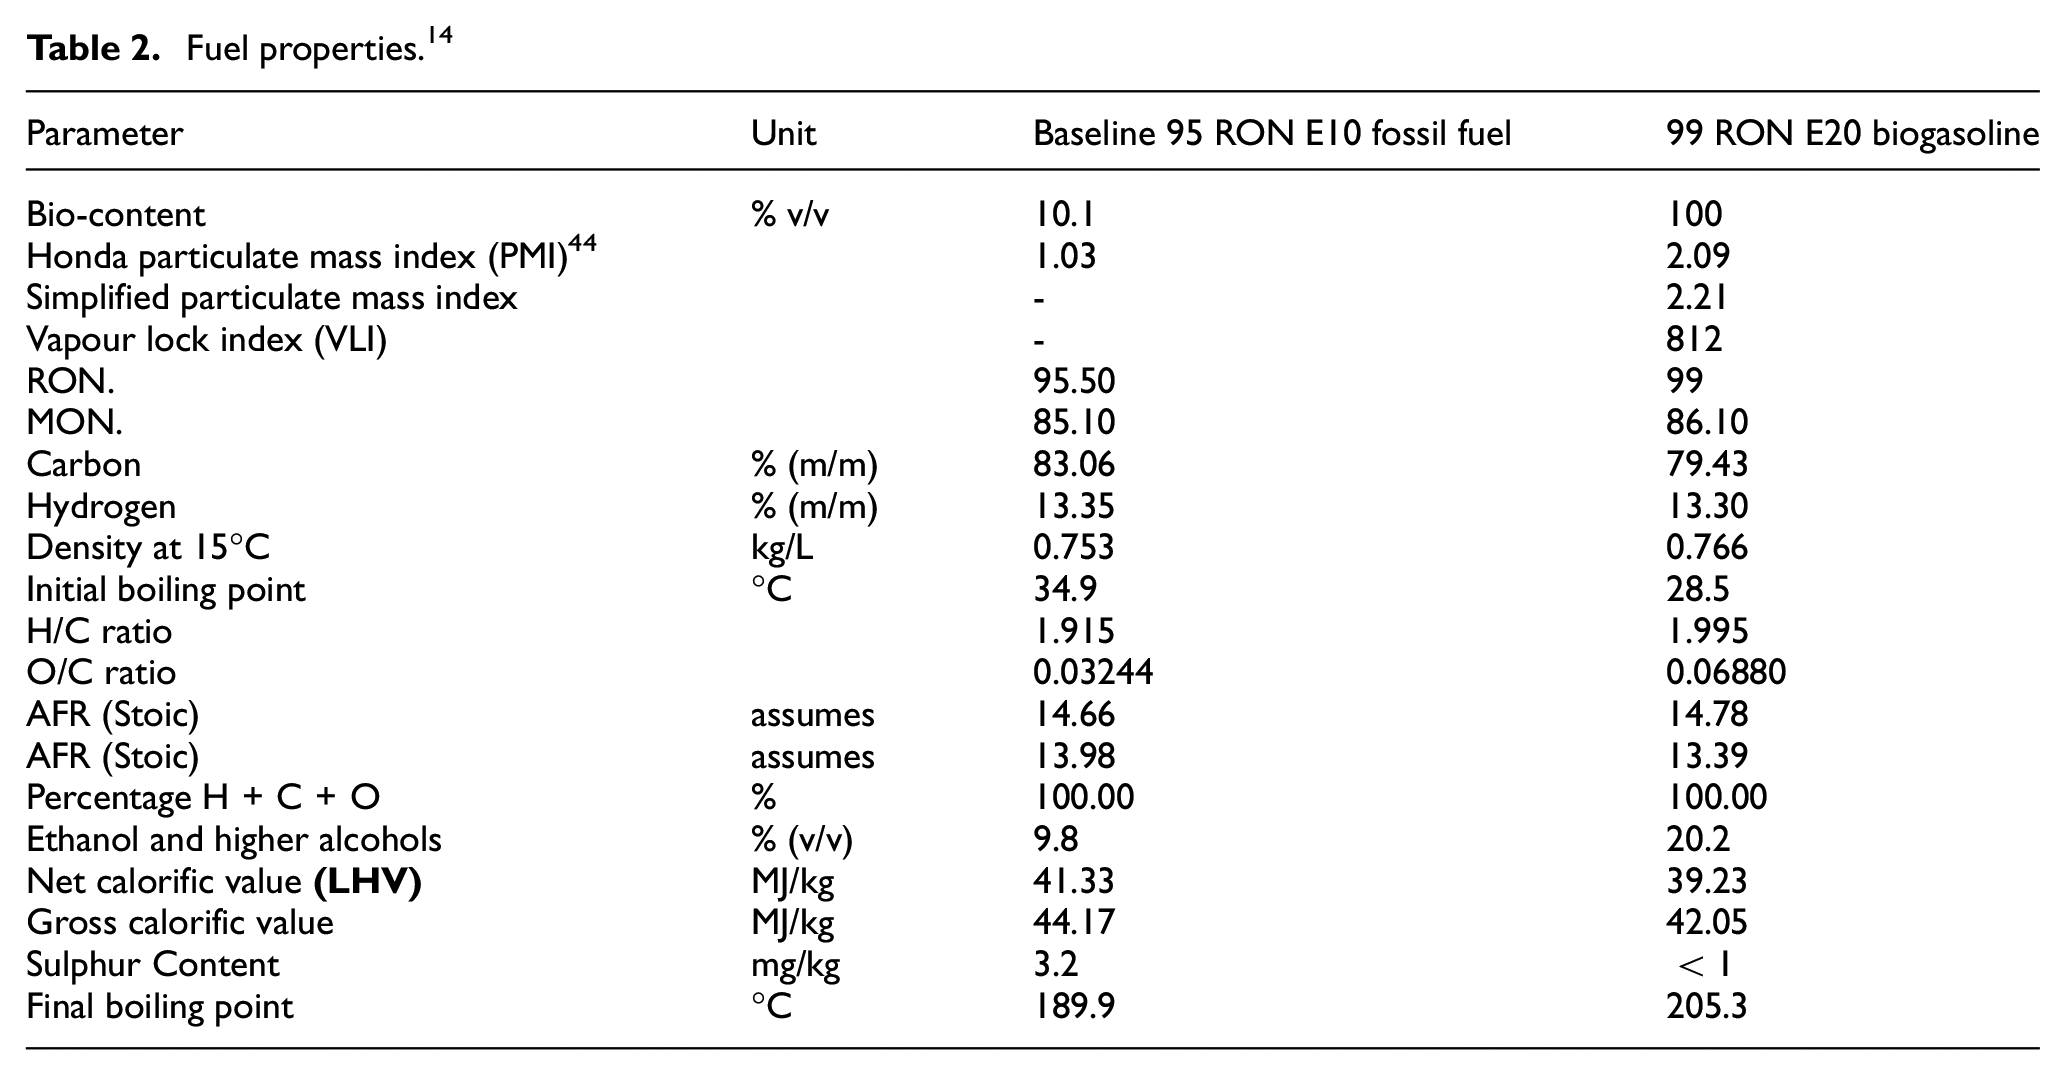
VLI indicates the tendency of petrol to produce a vapour lock. The vapour-liquid ratio is the temperature at which petrol’s vapour volume to liquid volume ratio is 20. The normal range for the vapour-liquid ratio is between 35 and 60°C. A greater vapour-liquid ratio is preferable. 45
Test methodology
The experiments on the single-cylinder engine were conducted at 2000 and 3000 RPM due to relatively high occupancy over the driving cycle. At the same engine speed with varying loads, 99 RON E20 biogasoline performance and emissions were compared to baseline gasoline. The water and oil temperatures were always maintained at 90°C. In comparison, the intake air temperature was kept at 40°C with no humidity.
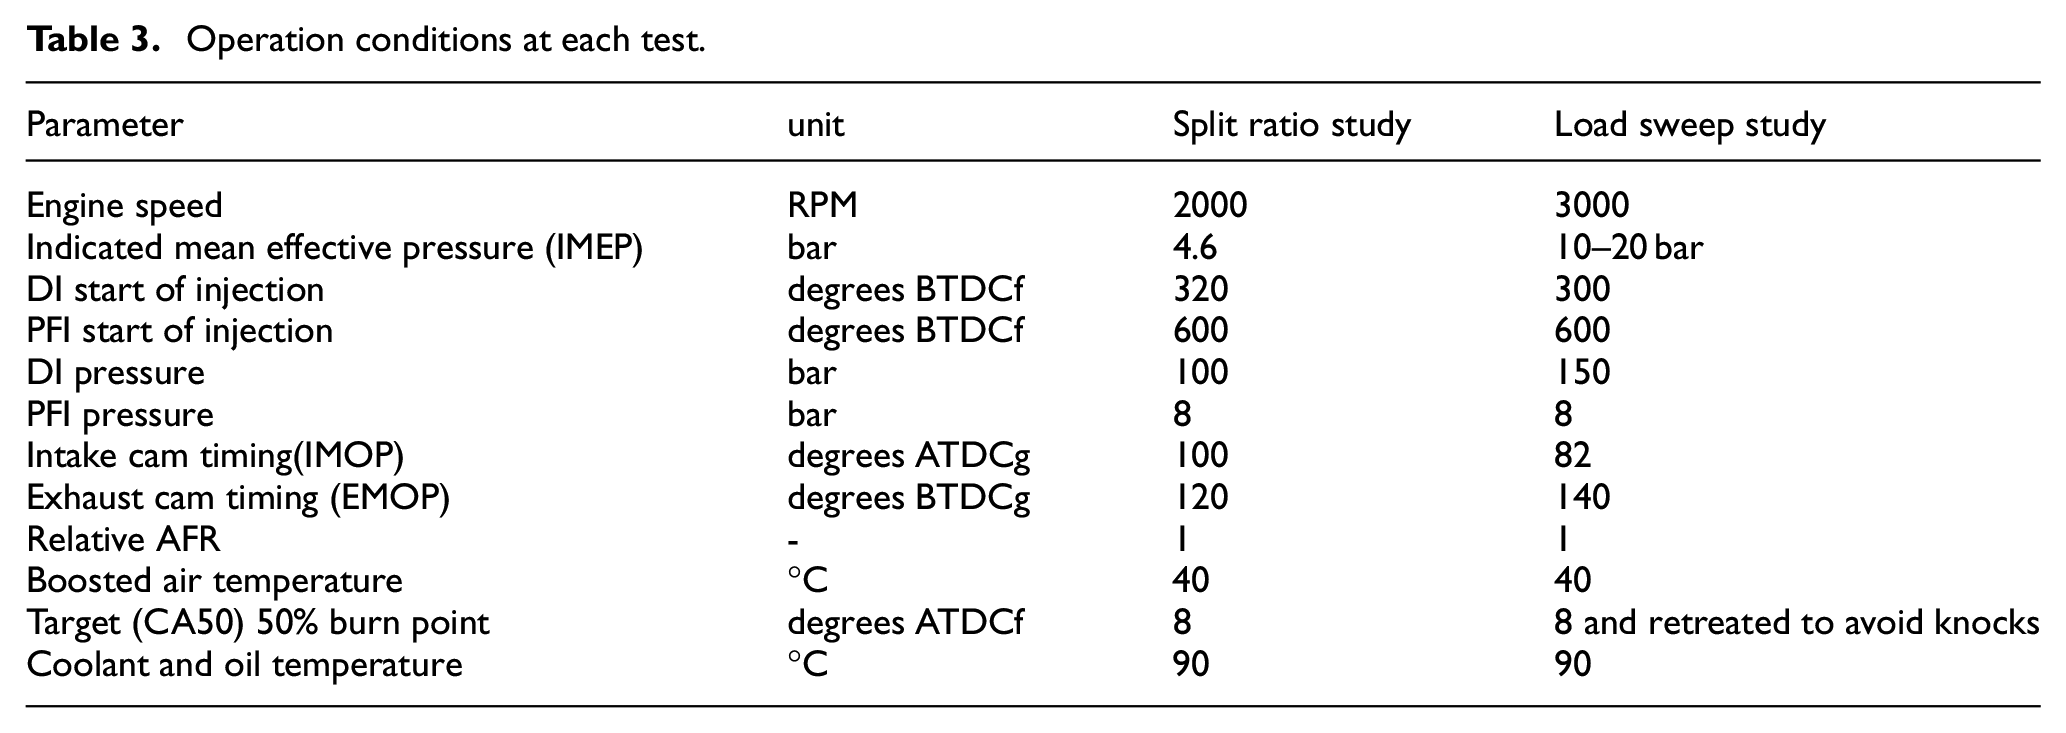
The aim of the experiments was to analyse the combustion characteristics with all emissions to identify the effect of the split injection ratio of DI and PFI on the engine performance, PM and other pollutant emissions. The experiments were initially carried out at a low load operation of 4.6 bar IMEP and 2000 rpm by sweeping the injection strategy from 100% DI to 100% PFI with a 20% interval, and running the engine at Minimum ignition advance for Best Torque (MBT) by targeting 50% burn at 8° After Top Dead Centre of firing (ATDCf). This was followed by the engine experiments at a higher speed of 3000 rpm and load sweep from 10 bar IMEP to 20 bar IMEP with split ratios from 100% DI to 100% PFI. Table 3 shows all boundary conditions and operation constraints for each test. The in-cylinder pressure was recorded over 300 engine cycles for the in-cylinder pressure and heat release analysis as well as the IMEP calculations.
Operation conditions at each test.
Results and discussions
The results section will analyse the impact of injection split ratios on engine performance and emissions when using 99 RON E20 biogasoline and baseline 95 RON E10 fossil fuel at different engine operating conditions.
The effect of split ratio on combustion characteristics and emissions at low load
The load and the speed were fixed at 4.6 bar IMEP and 2000 rpm, respectively to analyse and investigate the combustion characteristics and engine emissions by varying the injection split ratios from 100% DI to 100% PFI at 20% interval. The intake and exhaust cam positions of 120° Before Top Dead Centre of gas exchange (BTDCg) and 100° After Top Dead Centre of gas exchange (ATDCg) for the optimal overlap to provide maximum scavenging. The air/fuel mixture was kept at stochiometric condition. The PFI and DI timings and pressures were fixed. The same conditions were applied to both fuels to ensure the engine always operates at MBT.
Figure 5 shows that the output torque for both fuels was kept almost constant with a 0.6 Nm variation at each split ratio. The spark timing for the 99 RON E20 biogasoline was set at 14° Before Top Dead Centre of firing (BTDCf) at all conditions except 100% PFI to maintain the CA50 under 8.5°, as shown in Figure 6. Figure 5 shows that the brake-specific fuel consumption (BSFC) was higher with a 20% PFI. It remained constant at 346 g/kwh, corresponding to 35% Indicated Thermal Efficiency (ITE) (as shown in Figure 6) when the PFI ratio was increased above 60%. The same strategy was applied to 95 RON E10 fossil fuels, and the spark timing was kept at around 14.25 BTDCf to maintain MBT. The thermal efficiency of the 95 RON E10 fossil fuel was similar to the 99 RON E20 biogasoline at this load for all split ratios. Peak in-cylinder pressure (Pmax) remained almost unchanged over the split ratio sweep. However, biogasoline produced higher Pmax due to the difference in the LHV and ethanol concentrations, as shown in Figure 6.
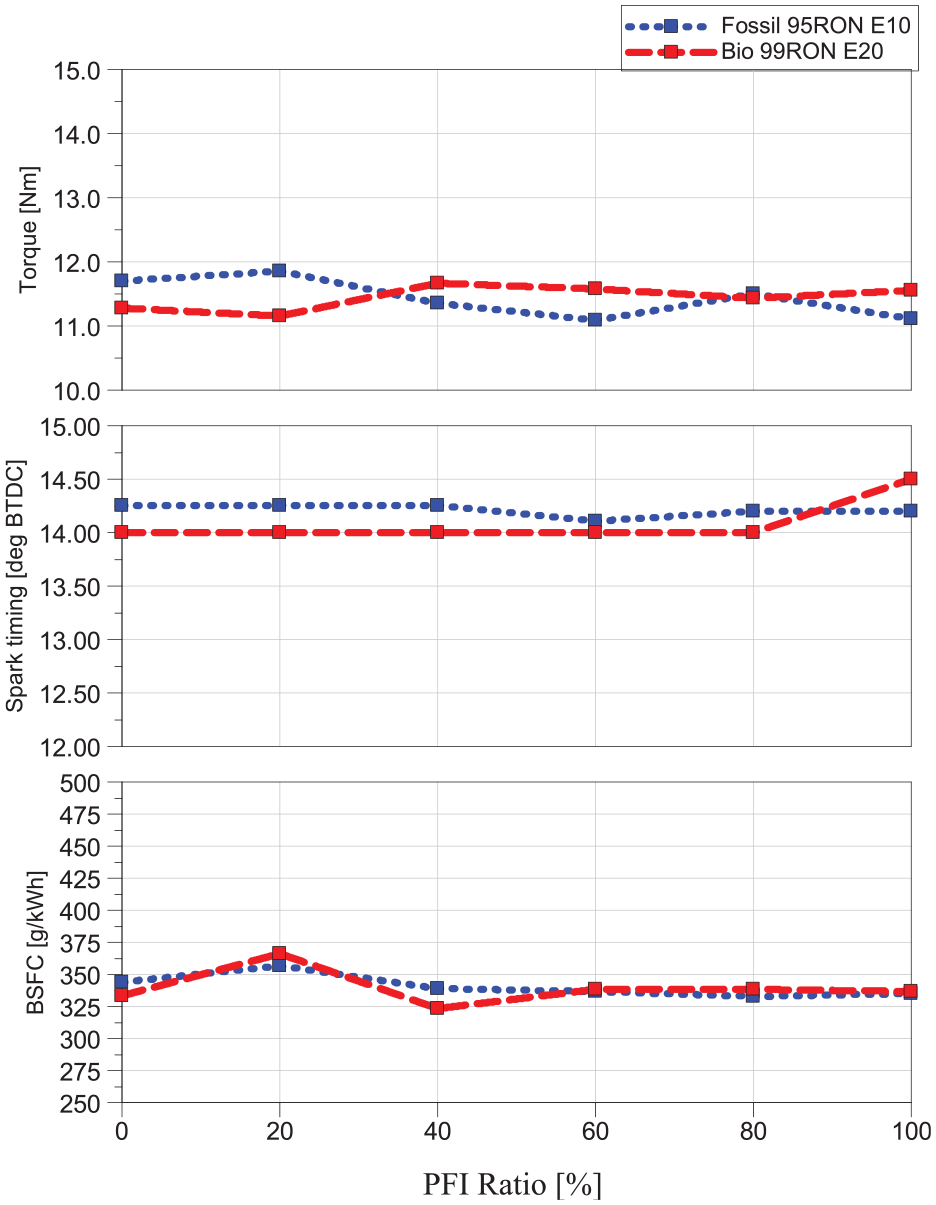
Effect of split ratios on engine torque, spark timing, and BSFC at 4.6 bar IMEP for baseline fossil fuel and biogasoline.
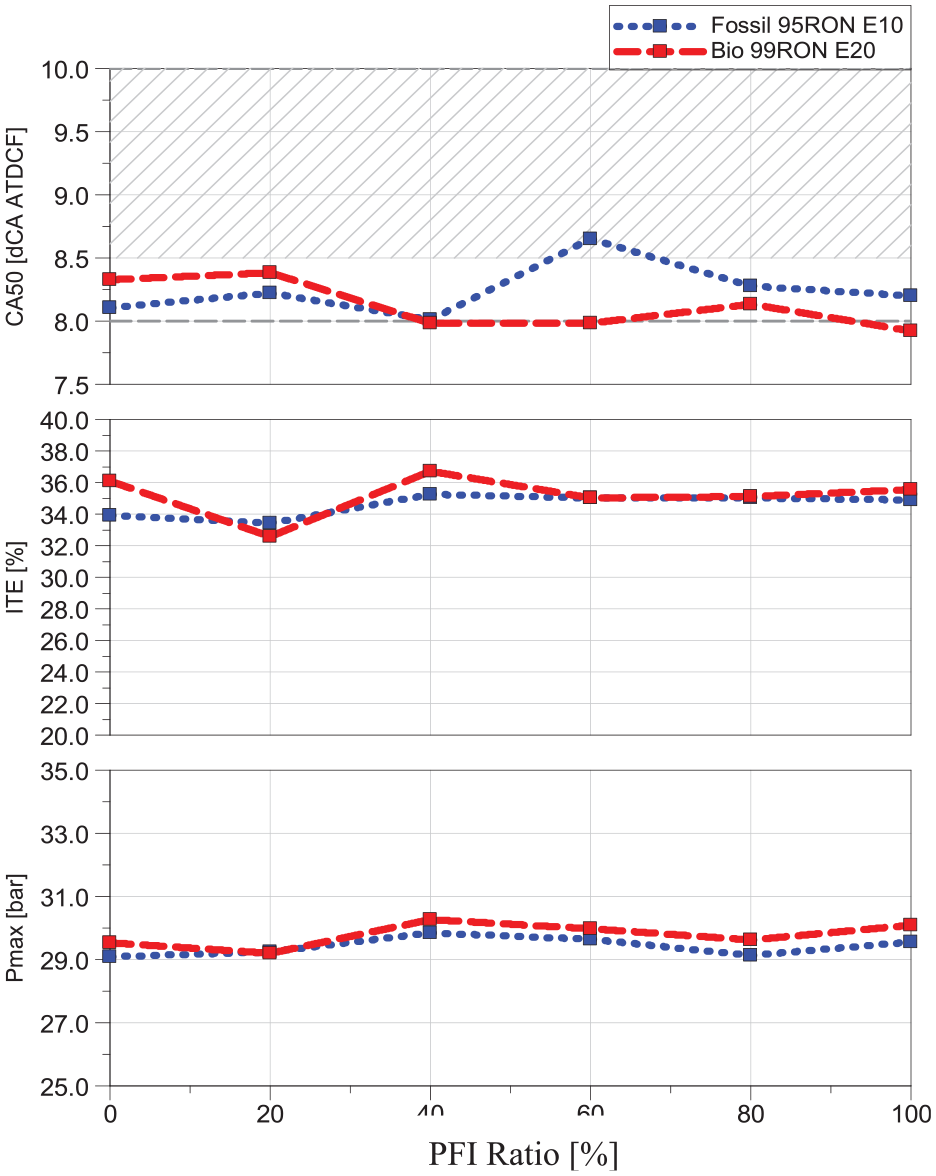
The effect of split ratio on CA50, ITE and Pmax for baseline fossil fuel and biogasoline.
As shown in Figure 7, engine burn points of 10% (CA10) and 90% (CA90) for baseline 95 RON E10 fossil fuel and 99 RON E20 biogasoline have very limited differences at each split ratio and show a decreasing trend towards 100% PFI. It was also observed that the engine operated stably with cycle-to-cycle variation under 0.9% at all split ratios for both fossil fuel and 99 RON E20 biogasoline. Finally, the knock intensity value remained unchanged up to 80% PFI, and it increased slightly at 100% PFI for 99 RON E20 biogasoline, as the spark timing was able to be advanced by 0.5° to maintain the CA50 at 8 CA ATDCf. It was also observed that the fossil fuel combusted slightly faster than the biofuel. Moreover, 95 RON E10 fossil fuel demonstrated less knock resistance than 99 RON E20 biogasoline. These results indicate that 99 RON E20 biogasoline could be a more suitable alternative at high-load conditions where knock resistance is more crucial.
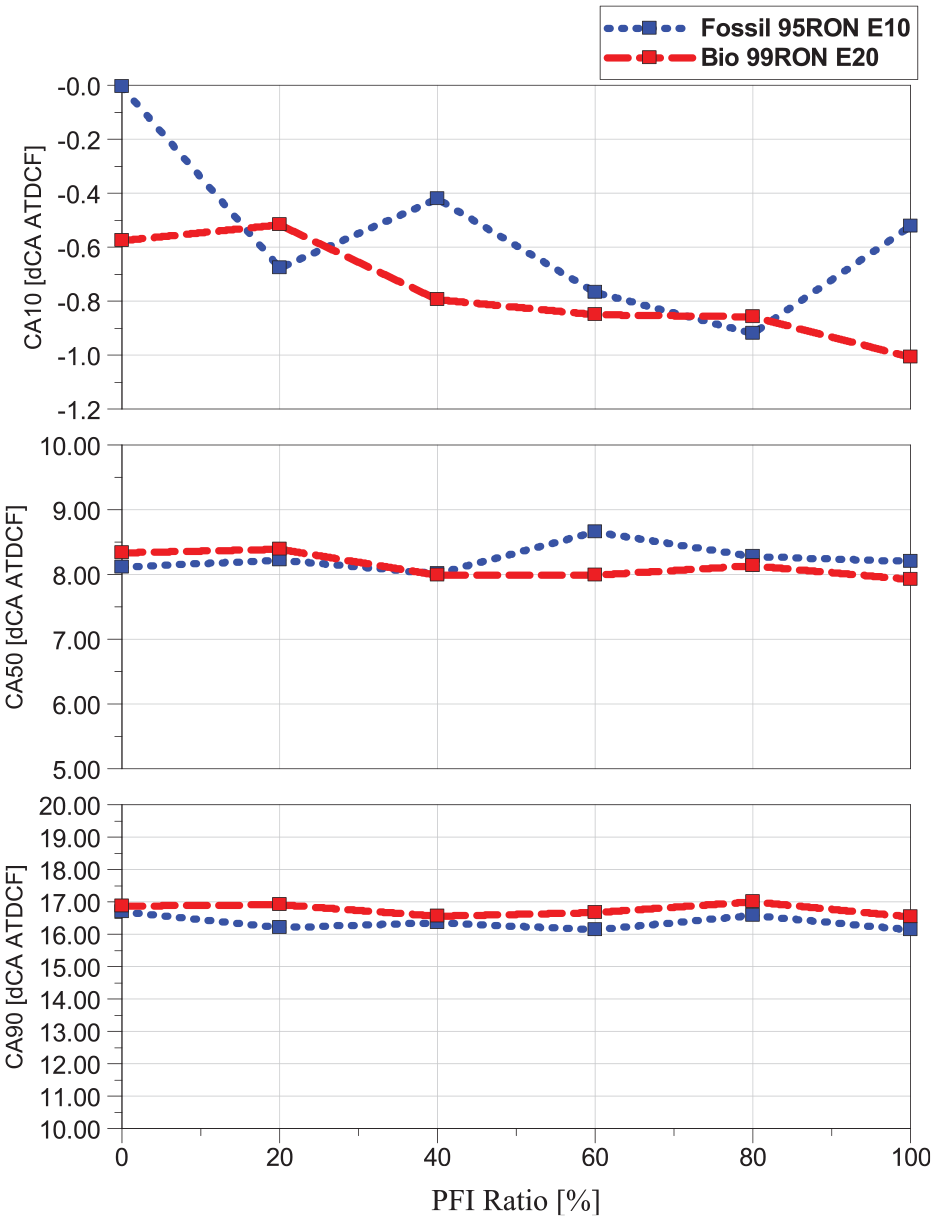
The effect of split ratio on CA10, CA50 and CA90 for baseline fossil fuel and biogasoline.
Figure 8 shows the effect of the split ratio on engine emissions. The CO2 emissions increased by 0.3% at 60% PFI compared to 0% PFI, while the CO emission decreased at a higher PFI split ratio can be due to a more homogenous mixture. NOx emissions were increased by 20% at 100% PFI compared to the same emission level at 0–80% PFI split ratio and raised to 1476 ppm at 100% PFI due to the absence of the charge cooling effect from the DI fuel injection. The unburnt hydrocarbon remained the same at up to 80% PFI but was increased by 53% at the 100% PFI strategy, probably due to more fuel vapour trapped in the crevice volumes.
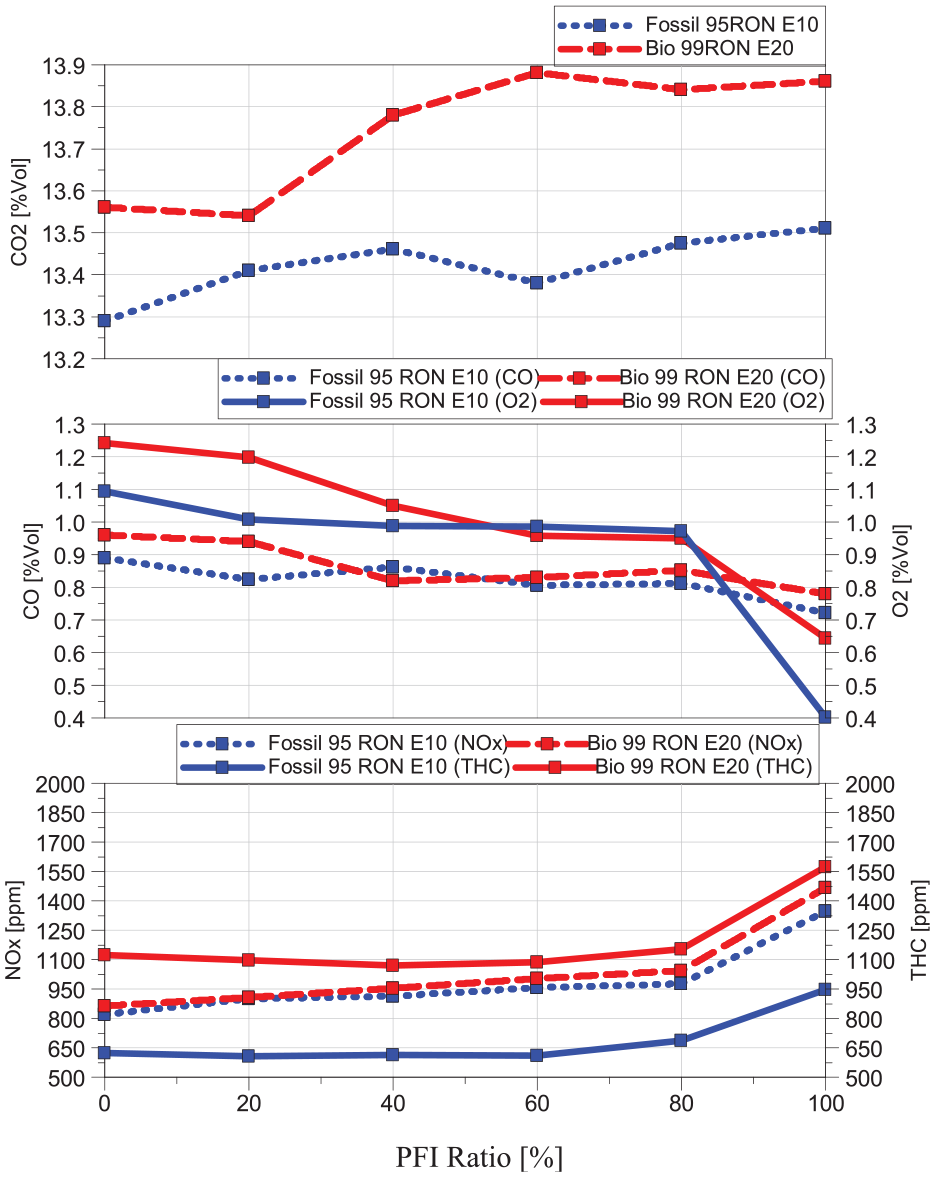
The effect of split ratio on engine emissions for baseline fossil fuel and biogasoline.
As shown in the figure, CO2 emission of 99 RON E20 biogasoline was 0.5% higher. The CO and O2 values were similar across all split ratios for both fuels. NOx emission has a very limited difference between baseline 95 RON E10 fossil fuel and 99 RON E20 biogasoline, while THC emission was much higher for 99 RON E20 biogasoline, aligning with the findings of previous studies 46
Figure 9 shows the overall particulate emission numbers (PN) with particle size between 23 and 1000 nm at different injection split ratios for both fuels. The results revealed that the PN was reduced by >96% when increasing PFI ratio for 99 RON E20 biogasoline. With the other emission data shown in Figure 8, 80% PFI seems to be the optimal split ratio to minimize the PN without increasing other emissions parameters. Though 99 RON E20 biogasoline has almost doubled PN compared to 95 RON E10 fossil fuel at 100% DI, it produced similar PN at 80% PFI.
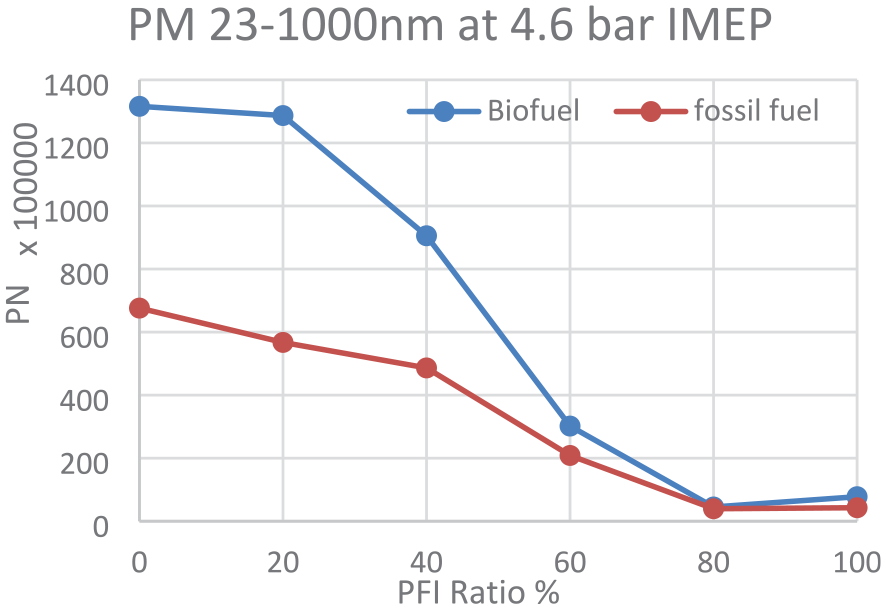
The effect of split ratio on PN for biogasoline and fossil fuel.
Figure 10 presents the spectral density of the PM emission over the particle size at different injection split ratios. It can be seen that DI produced a much greater number of particles in the range of 100 nm, whilst 100% and 80% PFI produced more particles of smaller sizes of 10–20 nm.
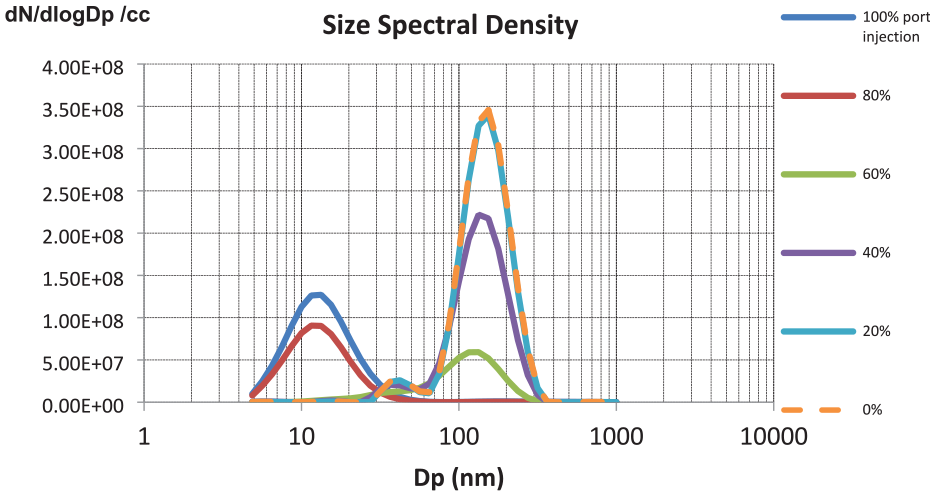
The effect of split ratio on the size spectral density of PM emissions for biogasoline.
The experiments conducted in this study lead to the main conclusion that engine efficiency and fuel consumption are independent of the injection strategy at the low load operation of 4.6 bar IMEP. The split ratio has an impact on emissions. The 100% PFI strategy produced the highest NOx emissions for both fuels. When the PFI ratio was increased from 0 to 80%, PN emission was decreased by 96% and 84% for 99 RON E20 biogasoline and baseline 95 RON E10 fossil fuel, respectively. In contrast, thermal efficiency remained constant compared to the 100% PFI strategy. The results indicated that 80% PFI and 20% DI for both fuels are the most effective operating points at low loads to maintain consistent NOx and THC levels while reducing PM emissions. Based on these findings, further examination of mid- and high-load conditions was further investigated.
Effect of split ratio at 3000 RPM at mid and high loads
In this experiment, the engine speed was fixed at 3000 RPM. The load varied from 10 to 20 bar IMEP. The split ratio was increased with a 20% step from 0% PFI (100% DI) to 100% PFI. The full PFI reaches the cycle-to-cycle stability limit at 19 bar IMEP. The exhaust temperature at the maximum load for all split ratios was under 750°C, while lambda was fixed at 1 for all testing points. At the low to medium loads, the spark timings were set to the MBT to maintain CA50 between 8 and 10° ATDCf. When the load increased above 14 bar IMEP, the spark timing was retarded to prevent knocking combustion.
Figures 11 and 12 show the main engine parameters at different split ratios and load sweep from 10 to 20 bar IMEP. The maximum indicated thermal efficiency was achieved with full DI and was 6% higher than the full PFI at 14 bar IMEP for both fuels. At 10 bar IMEP, the indicated thermal efficiency of 99 RON E20 biogasoline operation was hardly affected by the variation of port injections as it was at low load, as discussed in the previous section. The spark timing was retarded for the PFI operation to avoid knocking combustion at higher loads. Due to higher thermal efficiency, the baseline 95 RON E10 fossil fuel consumed less than 99 RON E20 biogasoline at 10 bar IMEP. As shown in Figure 12, the spark ignition timing of 99 RON E20 biogasoline at 100% DI operation could be advanced to maintain the CA50 between 8 and 10° ATDCf at loads up to 14 bar IMEP, while the full PFI operation had to retard CA50 to avoid the appearance of the knock. Therefore, the spark timing of 100% DI 99 RON E20 biogasoline at the high load region was much more advanced than baseline 95 RON E10 fossil fuel as it has a higher knock resistance.
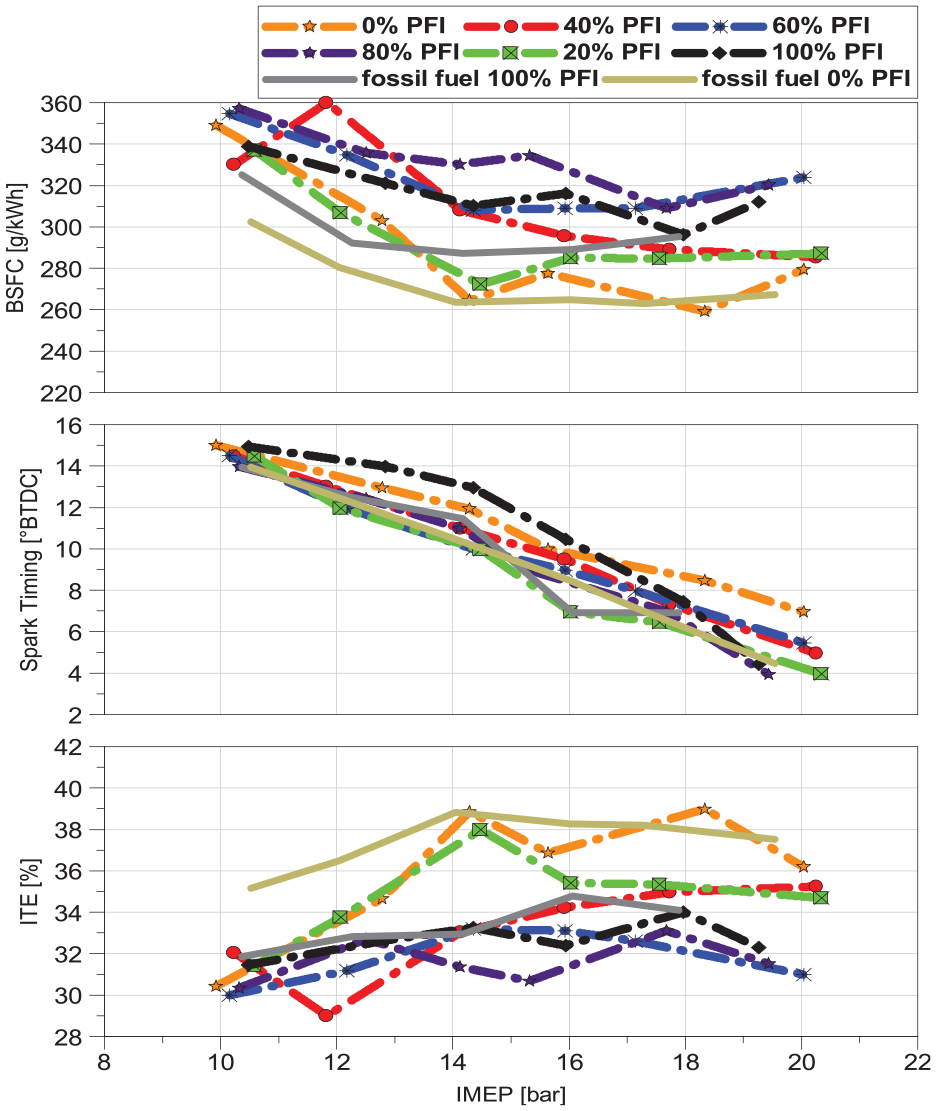
Engine BSFC, spark timing and ITE at 3000 rpm with different split ratios for biogasoline and baseline fossil fuel.
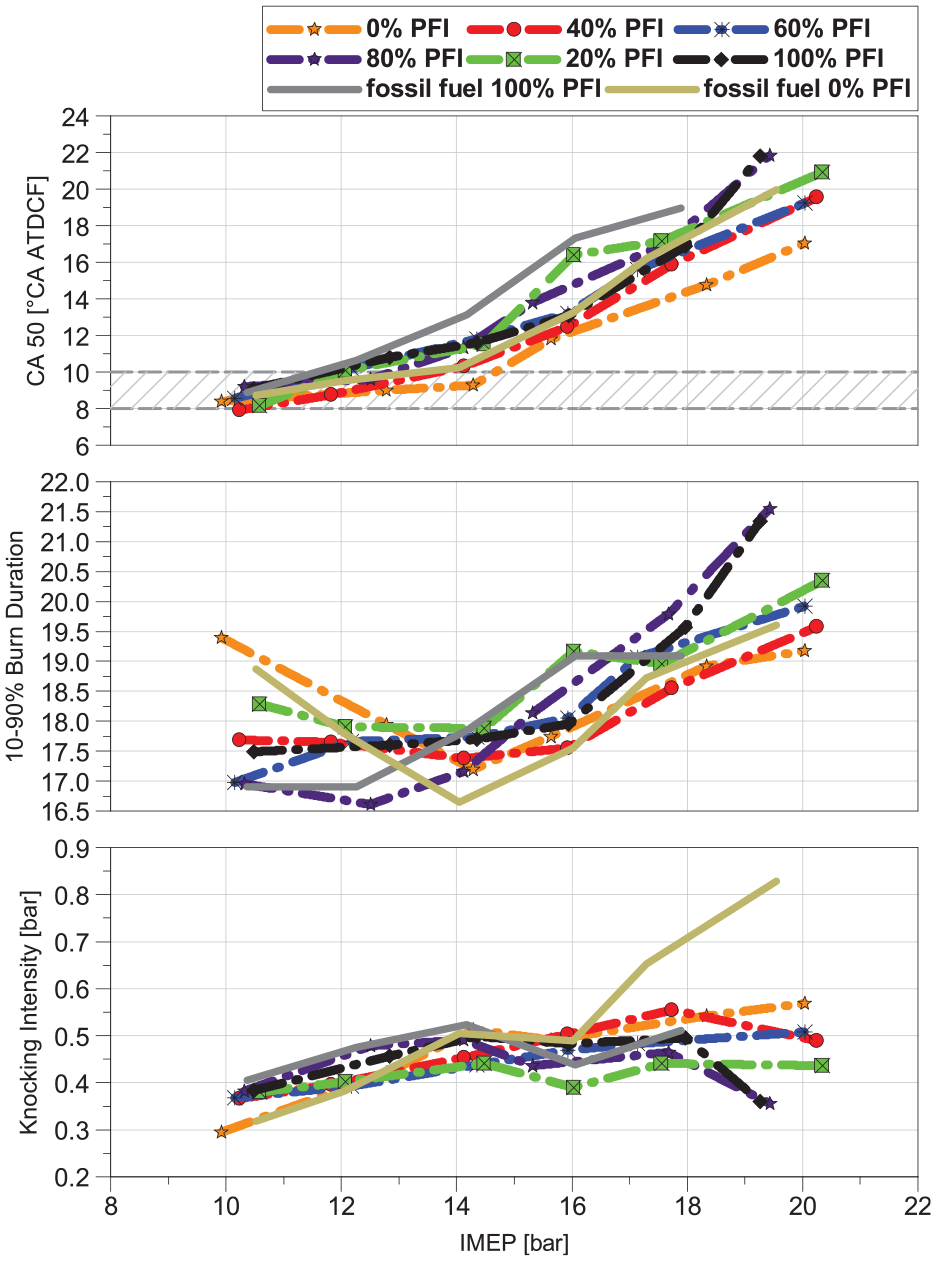
CA50, burn duration and knock intensity at 3000 rpm with different split ratios for biogasoline and baseline fossil fuel.
As shown in Figure 12, the burn duration (CA10-CA90) was similar for both fuels when 100% DI operation was used. The burn duration of the 80% and 100% PFI operations for 99 RON E20 biogasoline showed the same trend at high loads when the spark timings were retarded. Although the average knock intensity at 18 and 20 bar IMEP dropped below the threshold, the retarded spark timing had to be maintained as occasional knock events were observed at these conditions, as indicated by the higher COV in Figure 15.
As shown in Figure 13, similar trends were observed in the initial, middle and later burn durations in all cases except for the spark to 10% burn duration for the 100% PFI operation. The spark to 10% burn graph indicates that both fuels show a similar trend for 100% DI, while 100% PFI follows a different trend. This difference can be attributed to the absence of stratified injection from DI and a fully homogeneous mixture without any enhanced flow motion.
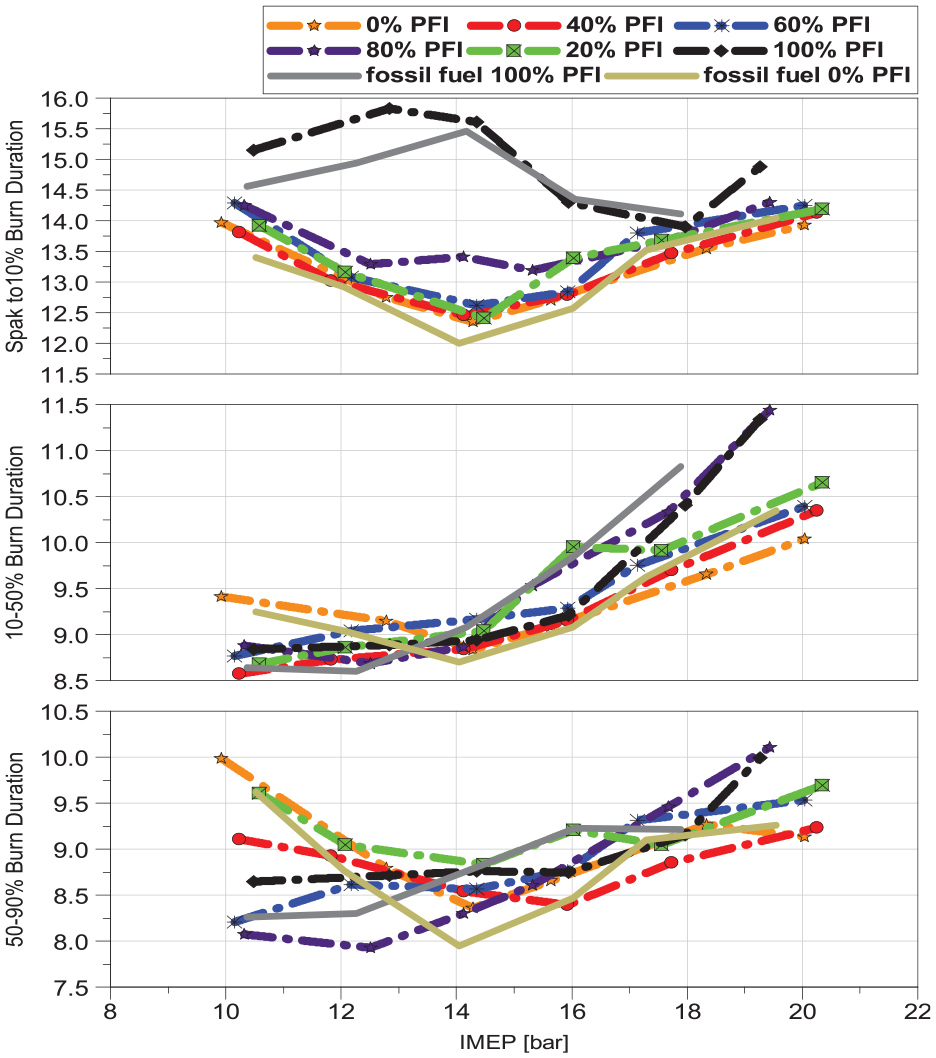
Early burn duration (spark to 10% burn), middle burn duration (CA10 to CA50), and late burn duration (CA50 to CA90) at 3000 rpm with different split ratios for biogasoline and baseline fossil fuel.
The results in Figure 14 show a consistent trend between the location of the maximum pressure (APmax) and the value of the peak in-cylinder pressure (Pmax) with increased load, regardless of the split ratios. The APmax location is primarily influenced by the spark timing. Therefore, the 100% DI 99 RON E20 biogasoline shows the earliest APmax at high load since it has the most advanced spark timing. The maximum pressure rise rate (Rmax) is higher for 100% DI operation due to advanced spark timing and lower for 100% PFI operation at high load due to higher COV.
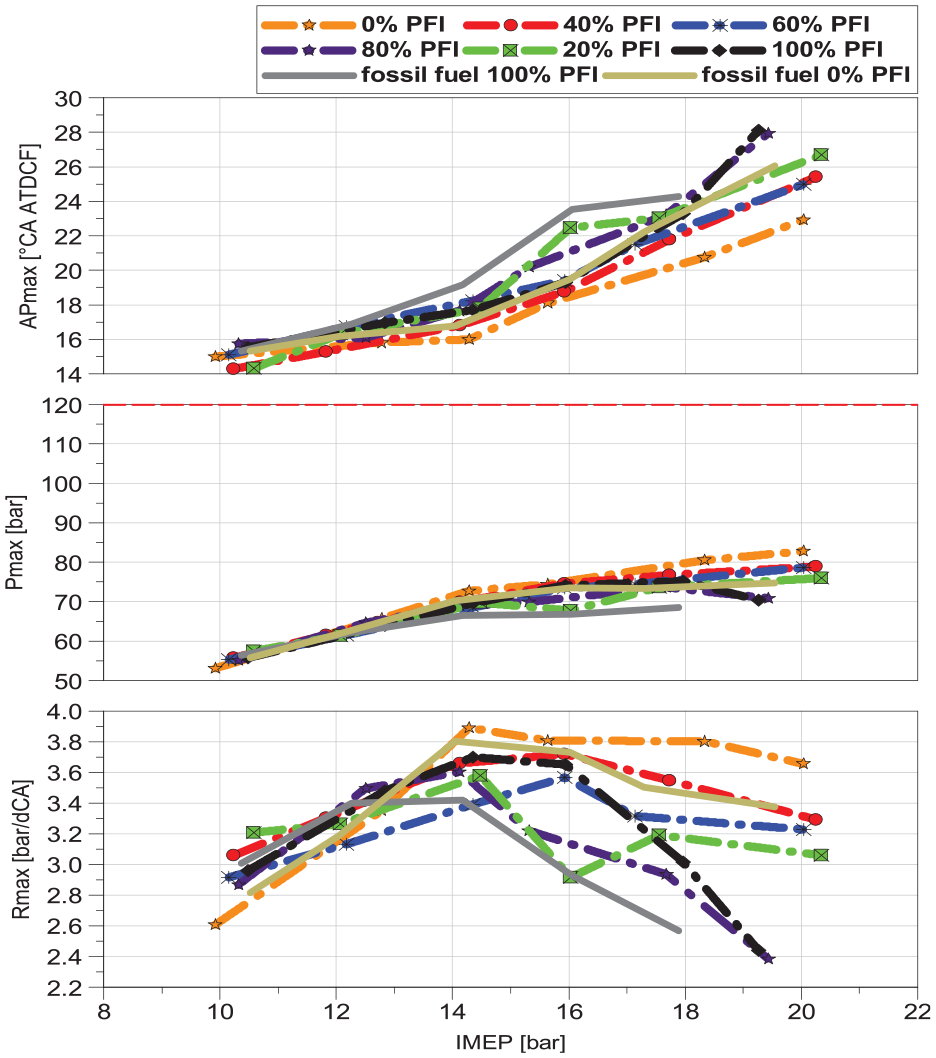
APmax, Pmax and Rmax at 3000 rpm with different split ratios for biogasoline and baseline fossil fuel.
When the exhaust gas temperature exceeds the threshold temperature of 750°C, additional fuel is injected to reduce the exhaust temperature by using the fuel cooling effect. As shown in Figure 15, the exhaust temperature stayed below the threshold when the engine was kept running at lambda 1. Therefore, over-fuelling is not required to cool down the exhaust system. The study also found that the engine became less stable as the PFI split ratio increased. The engine reached its stability limits at 18.64 bar IMEP with 99 RON E20 biogasoline at 100% PFI operation.
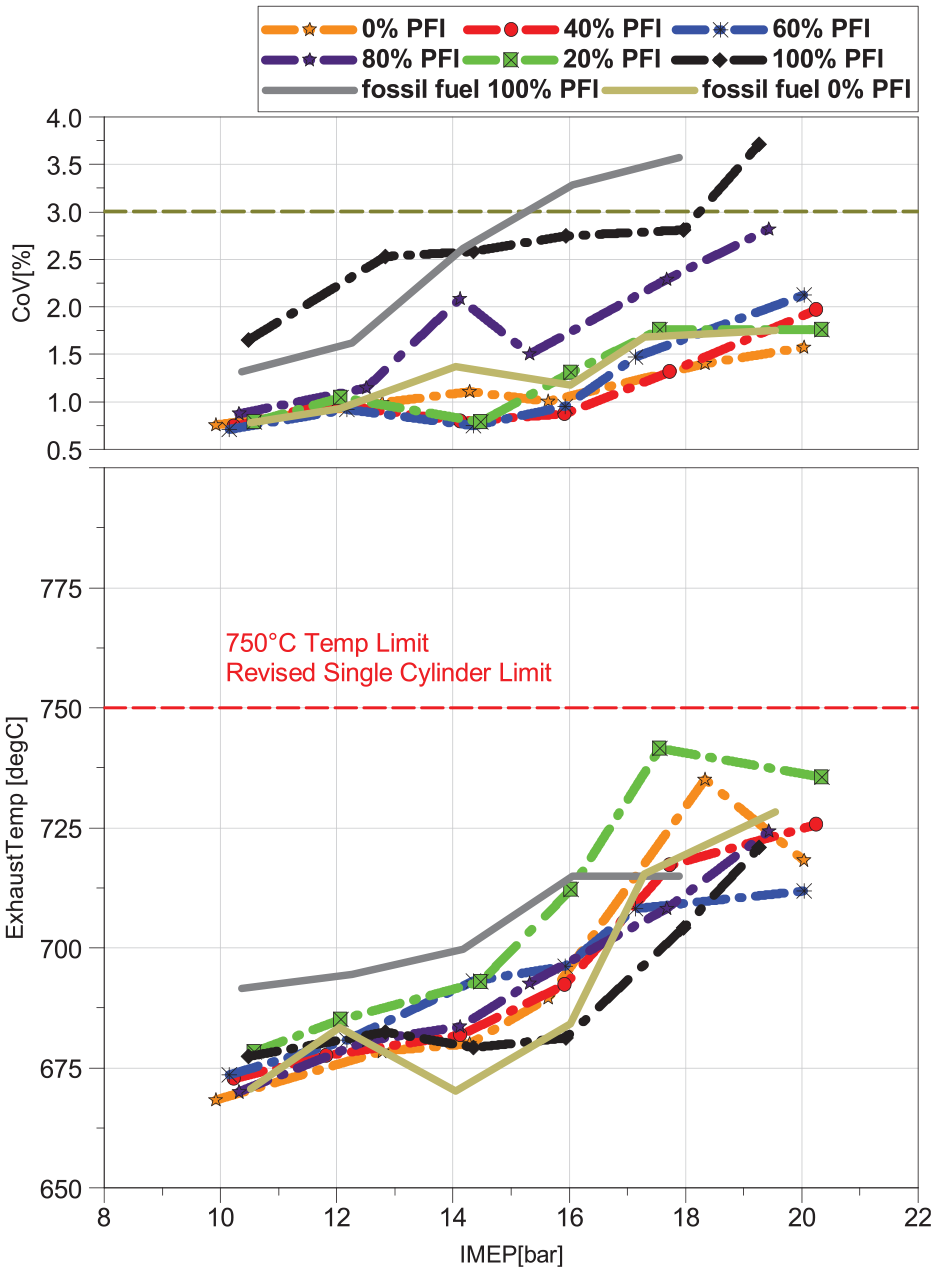
COV and exhaust temperature at 3000 rpm with different split ratios for biogasoline and baseline fossil fuel.
Moreover, the COV gradually increases with the increase in engine load. The baseline 95 RON E10 fossil fuel with 100% PFI operation reaches the stability threshold limits at 15 bar IMEP, while the bio-gasoline reaches the threshold at a higher load of 19 bar IMEP. Additionally, when comparing the combustion stability of both fuels at 100% DI, 99 RON E20 biogasoline shows higher stability owing to its slightly higher ethanol percentage
Emissions at different split ratios are shown in Figure 16. The CO2 emission followed the same trend over the load sweep, while the 95 RON E10 fossil fuel emitted 0.4% less CO2 than the 99 RON E20 biogasoline. The lowest CO2 results corresponded with the higher thermal efficiency. The CO2 emission increased as the PFI split ratio increased, and the main difference between 100% DI and 100% PFI in 99 RON E20 biogasoline was 0.2% on average. The CO emission showed an opposite trend to the CO2, as 100% DI in both fuels had a higher CO emission due to the fuel stratification with direct injection.
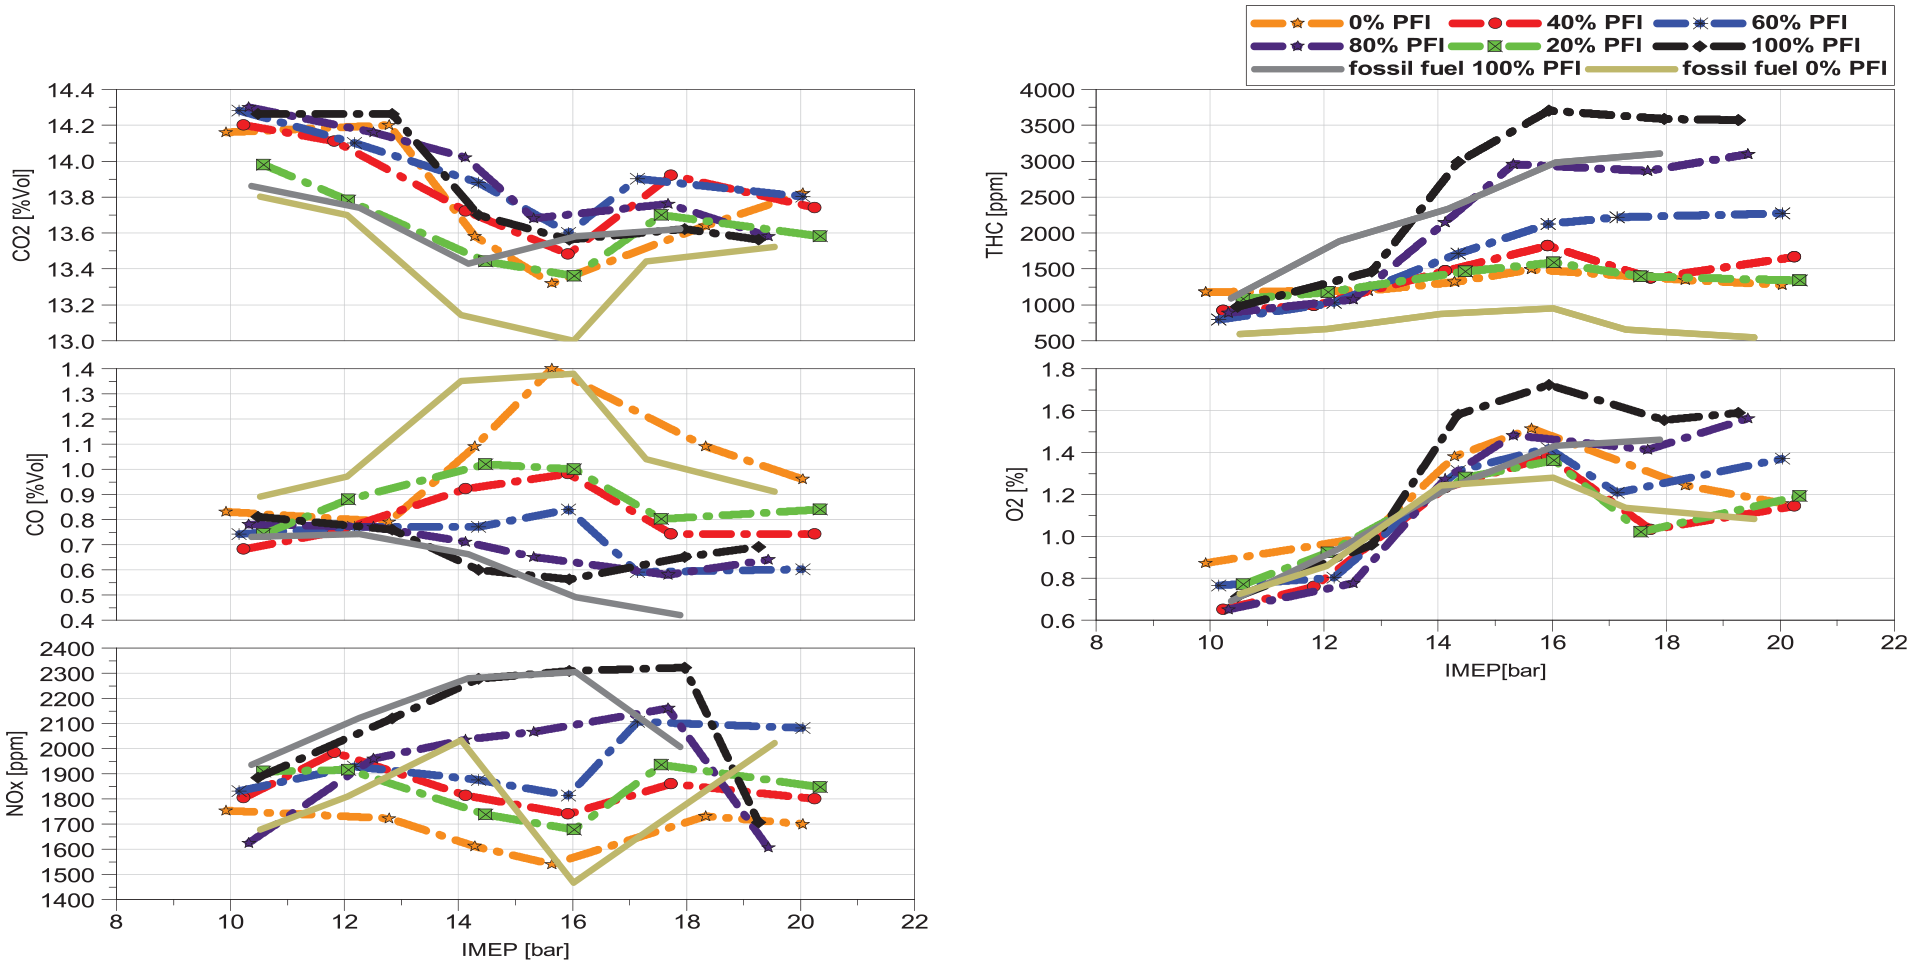
Emission parameters at 3000 rpm with different split ratios for biogasoline and baseline fossil fuel.
The highest NOx emissions were observed with 100% PFI. The reduction in the NOx emission with direct fuel injection could be explained by the reduced gas temperature due to the larger charge cooling effect of direct liquid fuel injection. The lower NOx emission after 18 bar IMEP was caused by the retarded spark timing to avoid the knocking combustion at such high load operations.
The THC emissions were reduced as more fuel was injected directly into the cylinder, probably due to the less trapped HC in the crevice region. The 95 RON E10 fossil fuel produced much less THC in full DI mode thanks to the less charge cooling effect that can lead to lower temperatures.
Figure 17 depicts the PN with a particle size of (23–1000 nm) across a load sweep ranging from 4 to 20 bar IMEP, with a variation in split ratios for 99 RON E20 biogasoline. The graph demonstrates that at a low load of up to 8 bar IMEP, the PN was reduced by >86% by injecting most fuel through PFI. However, as the engine load increased to 10 bar IMEP or higher, the PN increased at high PFI ratios of 100%, 80% and 60%. In contrast, in the high-load region, the PN was reduced by 64% at the maximum load of 20 bar IMEP with 100% DI compared to 100%, 80% and 60%PFI.
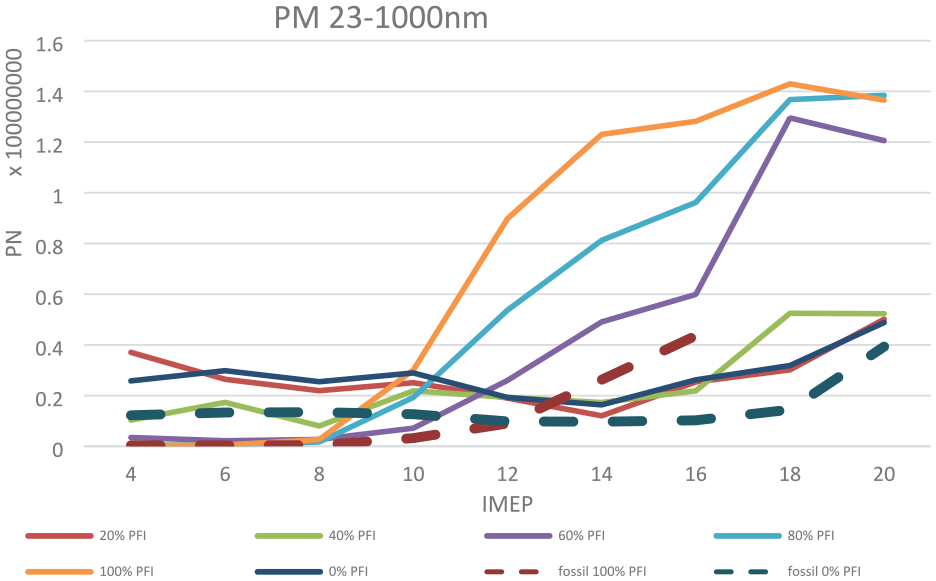
Particle number concentration at 3000 rpm with different split ratios for biogasoline and baseline fossil fuel.
These results highlight that the injection split ratio plays a crucial role in particle emissions. The results demonstrate that port fuel injection can significantly decrease the PN, although this is not true for Particulate mass emissions. Additionally, Figure 17 also indicates that at higher loads, direct injection may be more effective in reducing PM emissions.
Comparative analysis of PN emissions from 99 RON E20 biogasoline and 95 RON E10 fossil fuel reveals a noteworthy difference at low load with 100% DI operation. Notably, the PN of 100% DI and 100% PFI PN intersected at 12 bar IMEP for the 95 RON E10 fossil fuel. In contrast, this intersection occurred at 10 bar IMEP for 99 RON E20 biogasoline, indicating that 99 RON E20 biogasoline benefitted more from dual injection strategies.
Figure 18 shows the size spectral density over the load sweep for 100% DI and 100% PFI operations. The direct comparison proves that the 100% and 80% DI split ratios generated less PN emission by a 64% drop over PFI at high load conditions. Based on the limited information available on the detailed composition of the RON99 E20 biogasoline and even less knowledge of the combustion chemistry involved, it needs to be clarified what the reasons for the lower PN of the DI operations are. However, there seems to be a correlation between the high unburnt hydrocarbons in the exhaust and the greater PN number of 99 RON E20 biogasoline PFI operations. This could be attributed to the presence of heavy hydrocarbon compounds in the 99 RON E20 biogasoline, which are more likely to form condensates and solid particles.
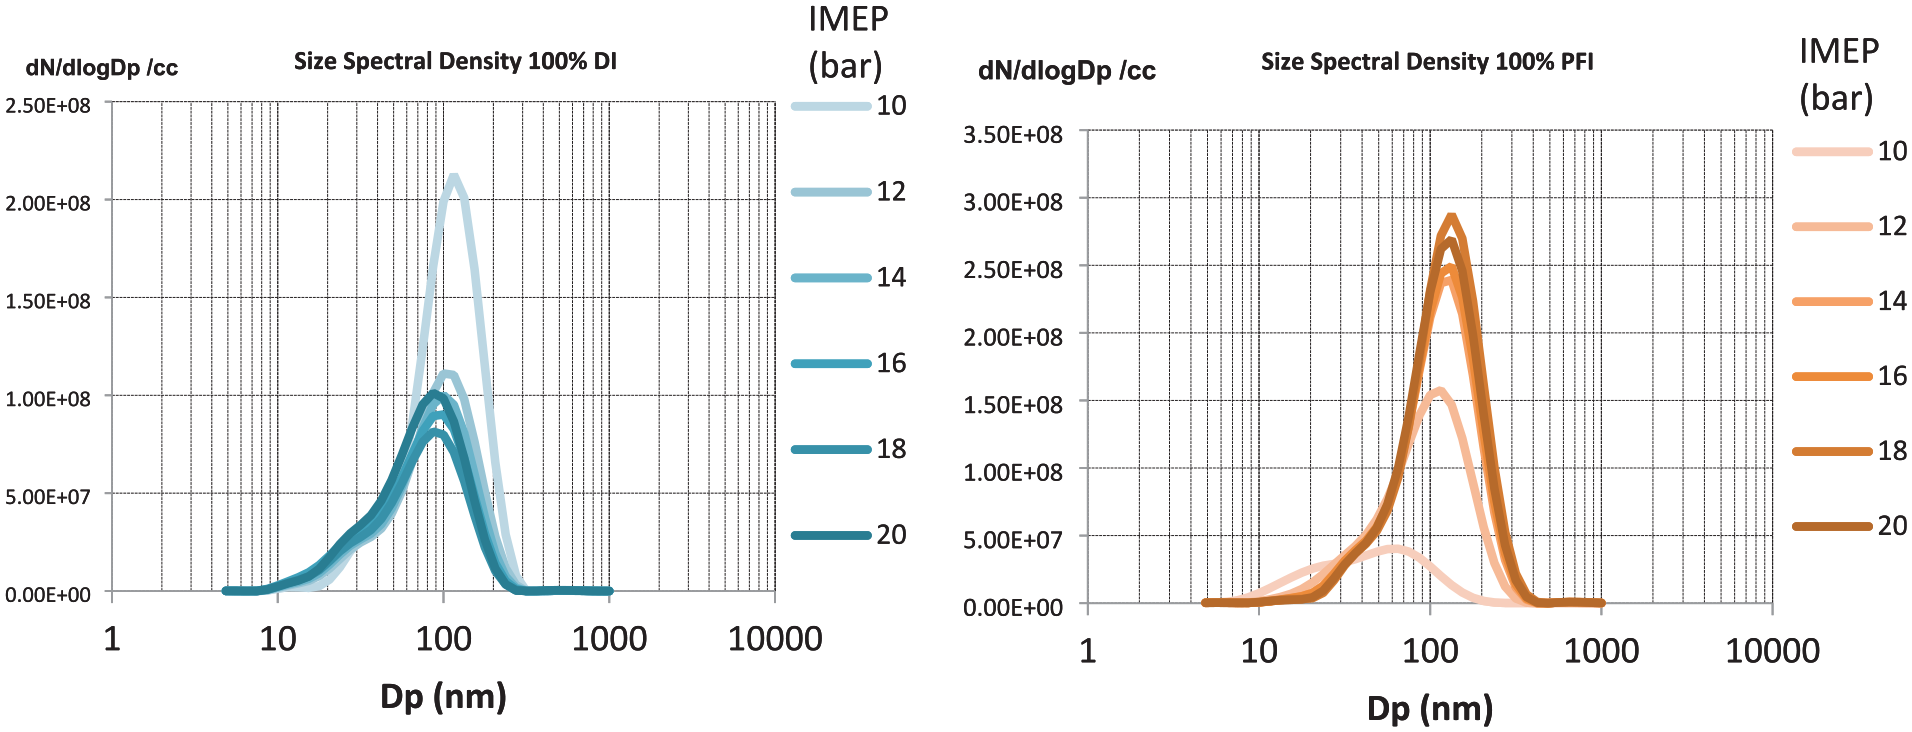
PM size spectral density[Dp] results at 3000 rpm for biogasoline at 100% DI (left) and 100% PFI (right) at different engine loads.
Conclusions
This study investigated the effects of dual injection strategy using both direct injection (DI) and port fuel injection (PFI) on the combustion performance and particulate matter (PM) emissions of 99 RON E20 biogasoline in a single-cylinder spark ignition engine. An instrumented single-cylinder research engine with a cylinder pressure transducer and emissions analysers were used to perform the thermodynamic engine experiments. It also evaluated the impact of fuel properties and fuel injection strategies on combustion characteristics, thermal efficiency, and emissions. Key findings from the study include:
(1) Compared to baseline gasoline, 99 RON E20 biogasoline produced higher PM emissions, which could be reduced by using optimal dual injection strategies by using 80% PFI and 20% DI at low load operation regions up to 8 bar IMEP then 50% ratio in the mid load while at higher load the DI is providing lower PM emissions and higher combustion stability.
(2) Under low-load conditions for both fuels, injection strategies did not significantly affect engine performance. However, 100% PFI led to a notable increase in NOx emissions for both fuels.
(3) PN emissions for 99 RON E20 biogasoline decreased by 86%. The study identified that the most effective operating point for minimizing PN while maintaining NOx emissions at the level of full DI was at 80% PFI during low load.
(4) At engine loads exceeding 10 bar IMEP at 3000 rpm, DI resulted in higher thermal efficiency, stability and lower PN values compared to PFI for biogasoline fuel, while for fossil fuel, the PFI is still producing lower PN values up to 12 bar IMEP.
(5) Optimization of split injection ratios successfully reduced PM emissions during low and mid-load operations for 99 RON E20 biogasoline compared to 95 RON E10 fossil fuel. This revealed significant advantages of 99 RON E20 biogasoline in reducing and eliminating higher PM emissions. Despite its heavier composition, 99 RON E20 biogasoline achieved nearly the same PN values as 95 RON E10 fossil fuel at the highest engine loads.
Footnotes
Appendix
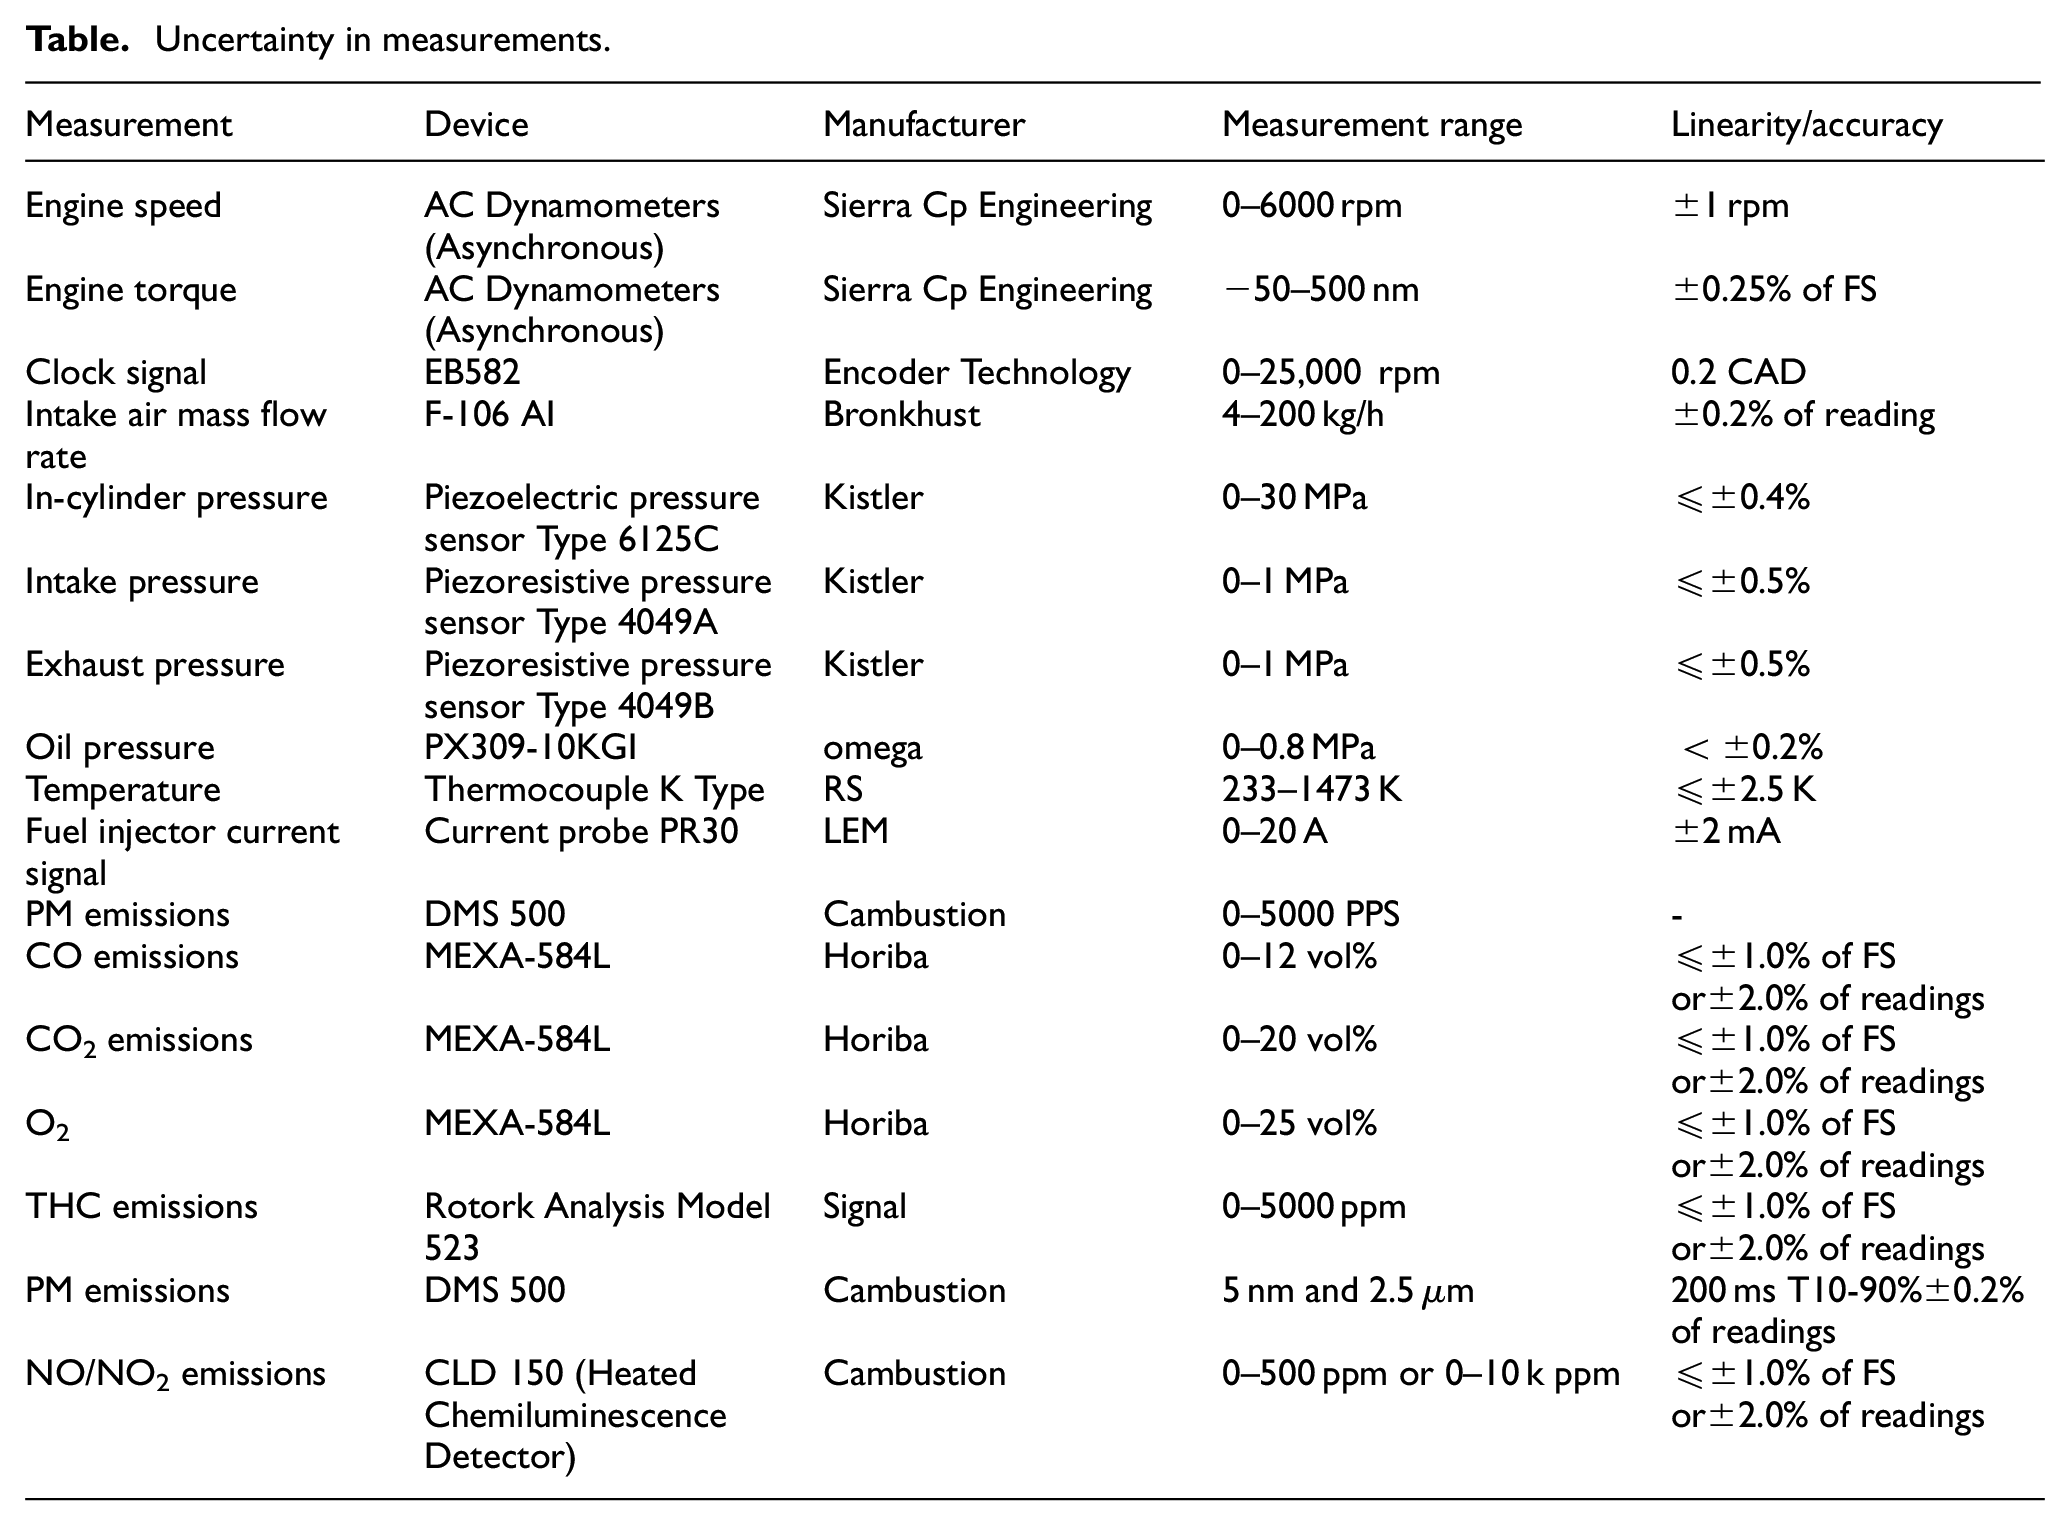
Uncertainty in measurements.
| Measurement | Device | Manufacturer | Measurement range | Linearity/accuracy |
|---|---|---|---|---|
| Engine speed | AC Dynamometers (Asynchronous) | Sierra Cp Engineering | 0–6000 rpm | ±1 rpm |
| Engine torque | AC Dynamometers (Asynchronous) | Sierra Cp Engineering | −50–500 nm | ±0.25% of FS |
| Clock signal | EB582 | Encoder Technology | 0–25,000 rpm | 0.2 CAD |
| Intake air mass flow rate | F-106 AI | Bronkhust | 4–200 kg/h | ±0.2% of reading |
| In-cylinder pressure | Piezoelectric pressure sensor Type 6125C | Kistler | 0–30 MPa | ≤±0.4% |
| Intake pressure | Piezoresistive pressure sensor Type 4049A | Kistler | 0–1 MPa | ≤±0.5% |
| Exhaust pressure | Piezoresistive pressure sensor Type 4049B | Kistler | 0–1 MPa | ≤±0.5% |
| Oil pressure | PX309-10KGI | omega | 0–0.8 MPa | <±0.2% |
| Temperature | Thermocouple K Type | RS | 233–1473 K | ≤±2.5 K |
| Fuel injector current signal | Current probe PR30 | LEM | 0–20 A | ±2 mA |
| PM emissions | DMS 500 | Cambustion | 0–5000 PPS | - |
| CO emissions | MEXA-584L | Horiba | 0–12 vol% | ≤±1.0% of FS or±2.0% of readings |
| CO2 emissions | MEXA-584L | Horiba | 0–20 vol% | ≤±1.0% of FS or±2.0% of readings |
| O2 | MEXA-584L | Horiba | 0–25 vol% | ≤±1.0% of FS or±2.0% of readings |
| THC emissions | Rotork Analysis Model 523 | Signal | 0–5000 ppm | ≤±1.0% of FS or±2.0% of readings |
| PM emissions | DMS 500 | Cambustion | 5 nm and 2.5 μm | 200 ms T10-90% ±0.2% of readings |
| NO/NO2 emissions | CLD 150 (Heated Chemiluminescence Detector) | Cambustion | 0–500 ppm or 0–10 k ppm | ≤±1.0% of FS or±2.0% of readings |
Declaration of conflicting interests
The author(s) declared no potential conflicts of interest with respect to the research, authorship, and/or publication of this article.
Funding
The author(s) received no financial support for the research, authorship, and/or publication of this article.