
Abstract
Plasma sprayed thermal barrier coatings (TBCs), applied in internal combustion engines, can have a profound impact on the apparent rate of heat release. Upon fuel jet contact with the piston wall, the heat loss seems to increase compared to an uncoated piston and combustion appears delayed. Permeable porosity of plasma sprayed TBCs is identified as one of the possible causes for this unwanted effect. In this article the impact of open porosity and sealing of the TBC surface are investigated with single cylinder engine experiments and with simulations. Based on the results, a mechanism is presented to explain the observations.
Keywords
Introduction
Global warming and climate change, caused by anthropogenic green house gas emissions, is recognized as one of the major concerns of our time.1,2 To limit the global average temperature increase to 1.5°C, compared to pre-industrial levels, green house gas emissions need to be reduced with about 50% by the year 2030 and a net zero emission should be achieved by mid-century. 3 The most significant green house gas emissions, responsible for 98% of the greenhouse effect, are carbon dioxide, methane and nitrous oxide. In 2019, about 24% of the world wide CO2 emissions originated from the use of fossil fuels in transportation, where the internal combustion engine (ICE) is the dominating prime mover. 4 There are three main pathways to reduce the use of fossil fuels in transportation: electrification, use of non-fossil fuels, and efficiency increase of the ICE. Especially for the near term, continued efficiency increase of the ICE is seen as an important measure. 5
One of the major energy losses in the internal combustion engine is heat loss through the combustion chamber walls. Typically 10%–30% of the heat from the combusted fuel, mainly depending on engine size, is lost to the engine coolant. In theory, an adiabatic engine could gain up to about 12% in gross indicated efficiency. Moreover, insulation of the combustion chamber will lead to:
Increased exhaust gas temperature, which improves turbocharging efficiency and conversion efficiency of the emission aftertreatment system.
Reduced heat load on engine components, improving engine durability, and a possibility for further engine downsizing.
Reduced heat load on the cooling system, the need for less coolant pump power, as well as enabling weight, size and cost reductions.
All of the above outcomes also contribute to fuel consumption reduction.
One method to insulate the combustion chamber walls is the use of thermal barrier coatings (TBC). The first investigations to insulate the combustion chamber in diesel engines started in the late 1970s. 6 Initially with engine cycle simulations to investigate the potential,7,8 followed by experiments with air gap insulation and wall materials with low thermal conductivity like Nimonic steel and ceramics.9–11 These early insulated engines had significantly lower heat losses to the coolant and increased exhaust enthalpy, but there were negative effects on combustion related to the considerably increased wall temperatures. Heating up of the intake air resulted in lower volumetric efficiency, reducing air fuel ratio and indicated efficiency, increasing soot emissions and limiting power.12–16 The heat loss during combustion might even increase due to “convection vive”, where combustion occurs closer to the surface and turbulence in the boundary layer is increased. 17 These insights led to a change in insulation approach toward thin thermal barrier coatings, aiming to accomplish a surface temperature swing, described by Wallace as early as 1979.18,19 With this type of insulation the wall surface temperature would follow the dynamic charge temperature through the whole engine cycle, avoiding heating up of the intake air. Still, only limited success has been achieved in realizing the expected efficiency gains with experiments.6,20,21
Application of thermal barrier coatings can also have negative side effects, depending on the type of coating. Increased wall surface temperatures during combustion can still lead to convection vive and reduce insulating soot deposits. 22 Increased translucence or absorptivity might increase thermal radiation absorption. 23 High surface roughness can increase heat transfer,24–26 and slow down air/fuel mixing. 27 Finally, permeable or open porosity in a coating might increase heat transfer and absorb unburned fuel from diffusion flame jets under dynamic pressure conditions.24,25,28
The purpose with this investigation is to model and quantify the negative consequences from open porosity, typically found in plasma sprayed coatings. The majority of the pores in plasma sprayed coatings is normally interconnected. 29 Surface sealing materials have been applied to prevent negative effects from open porosity,28,30,31 yet no assessment of the actual magnitude of increased heat loss nor fuel entrainment has been done for actual engine conditions.
Modeling and simulation of the flow and heat transfer related to permeable porosity in detail is a demanding task. The small size and intricate shape of the pores require a small and complex mesh in fluid and solid domain and simulation would be timely and costly. A simpler approach, used in this investigation, is to simulate the permeable porosity as a zero-dimensional crevice volume. This model is combined with a CFD model, including a conjugate thin wall model for the coating, to predict the convective heat loss. The CFD model also provides boundary conditions for the crevice model, the near surface charge temperature and charge composition. The simulation results are then compared to experimental results from coated pistons, including coatings with surface sealing, for fired operation and for motored operation.
Better understanding of the mechanisms and governing parameters for charge entrainment and heat transfer can help to minimize the negative impact of open porosity. It might even be possible to design a TBC where open porosity contributes to thermal insulation: for example, soot deposits with high open porosity are known to be effective insulators.22,26,32
Method
The method section describes the definition of the tested coatings, the setup of the engine experiments and the description of the CFD and 0-D simulation models.
Coating material properties
The insulating material used in this investigation of porosity effects is Yttria Stabilized Zirconia (YSZ) of the HOSP type. This material has good spraying properties as well as a low thermal conductivity due to the many interfaces in the sprayed coating. The selected bond coat material suits this YSZ material and ensures proper adhesion to the aluminum substrate. The two sealing coatings have low permeability and were chosen from a number of candidate sealing materials based on porosity measurements and an ethanol absorption test. The ductile nickel-aluminum alloy can be polished to create a surface with low roughness and high reflectivity. The brittle ceramic alumina on the other hand is capable of withstanding higher temperatures and has lower thermal conductivity. Both sealing coatings have comparable low porosity, and performed equally well in the ethanol absorption test.
To determine the thermal conductivity and porosity of the bondcoat and topcoat, 1 in diameter coupons were sprayed with the same process as used for the pistons. The thermal conductivity was measured using the laser flash method with a Netzch LFA 427. To measure the porosity, the samples were cut and images were taken from the cross-section with a SEM TM 3000 Hitachi microscope. ImageJ software was employed to calculate the porosity from the microscope images. The sealing layers were too thin for this type of analysis, therefore material properties from the suppliers were used. Table 1 summarizes the coating and material properties with references to sources and suppliers. Figure 1 shows a cross section with details of the coating structure for the two coupons with sealing layers.
Coating and substrate material properties at 20°C.
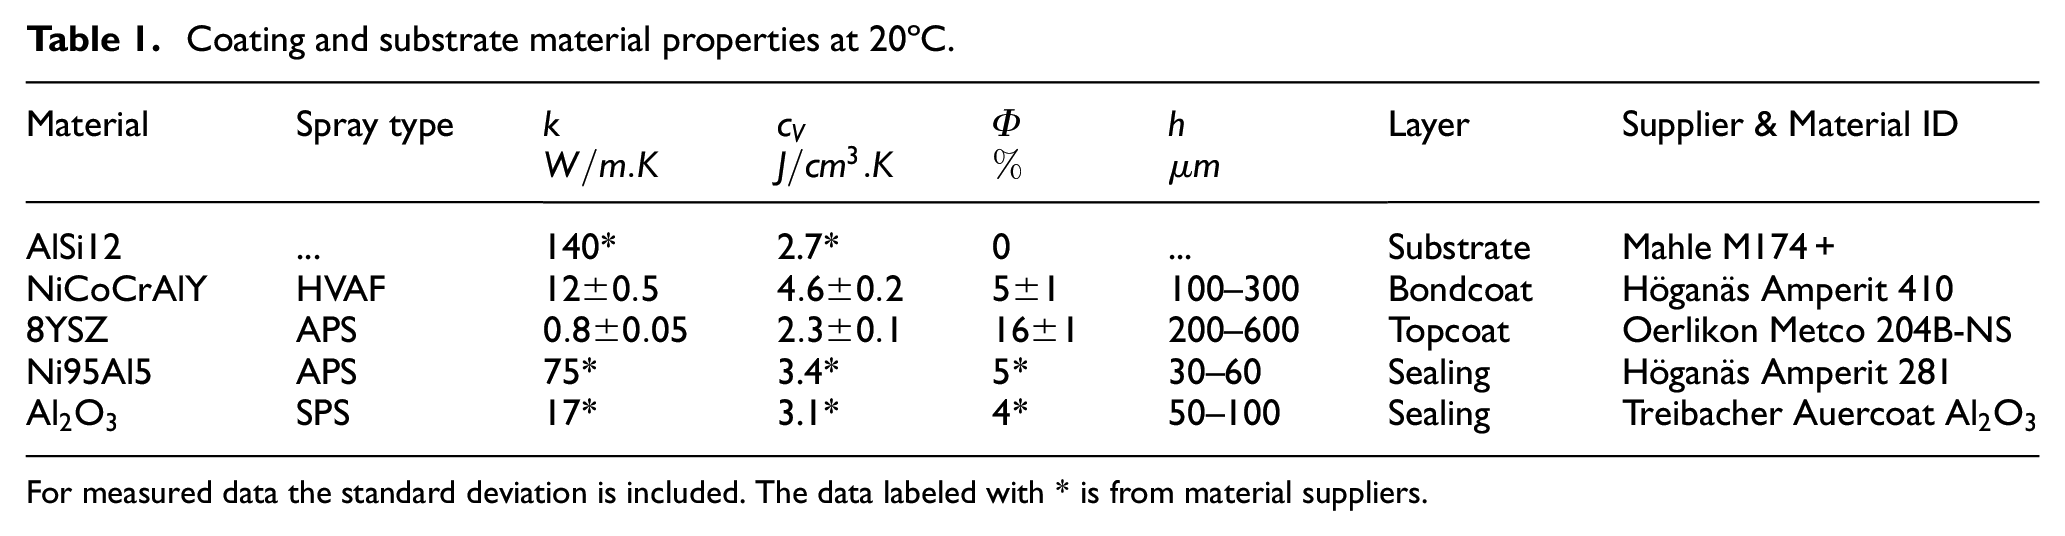
For measured data the standard deviation is included. The data labeled with * is from material suppliers.
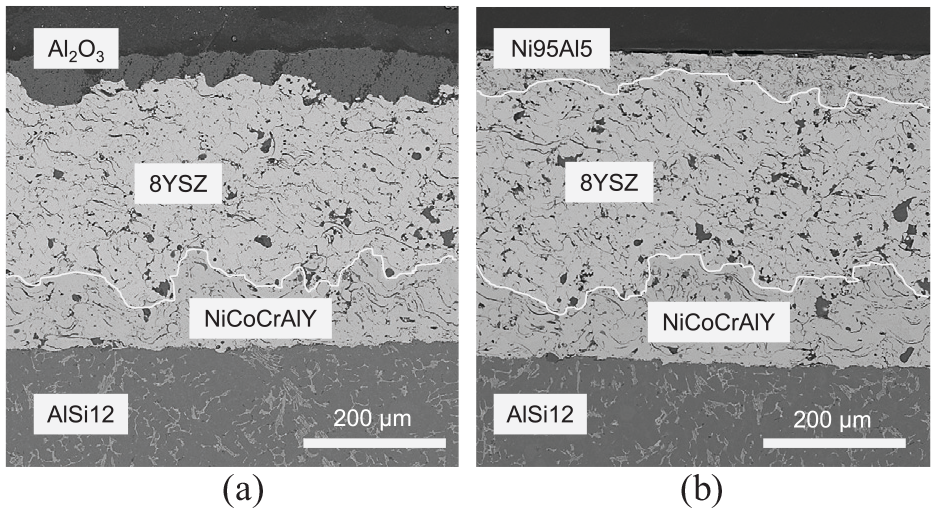
Electron microscope images of the TBC with: (a) alumina and (b) nickel alloy sealing layers. The white lines at the interfaces are added for clarity.
Application of the coating on the pistons
To facilitate a uniform application of the thermal barrier coatings, the stock piston was redesigned: the re-entrant lip normally present was removed to create an open bowl. Still some variation occurred in coating thickness: on the squish surface the thickness was on the low end of the span listed in Table 1, the coating thickness at the bowl rim and vertical bowl wall were roughly in the middle of the span and the thickest coating was created in the radius toward the bottom of the piston bowl.
Before application of the bondcoat with high velocity air-fuel spraying (HVAF), the piston surface was grit-blasted with aluminum oxide for proper adhesion. The topcoat – or thermal barrier coating – and the metal sealing of Ni95Al5 were applied with air plasma spraying (APS). The ceramic sealing of Al2O3 was applied with suspension plasma spraying (SPS), the suspension liquid being water. The latter method allows for the use of very small ceramic particles creating a dense layer. To reduce the surface roughness, the coated surfaces were polished with fine grade P600 sand-paper. The resulting surface roughness Ra was measured on the vertical wall of the piston bowl and on the piston top, according to ISO 4287. Although the piston top surface was machined to target the same compression ratio after TBC application as for the uncoated piston, small variations occurred. To account for these variations in the experiments, the compression ratio for each piston was determined from the motored pressure curves with a method especially developed for coated pistons. 33 Table 2 lists the compression ratio and surface roughness for the tested pistons. Due to limitations in the spraying setup, the center of the piston bowl was not covered with a top coat nor sealing layer. There is however a thin layer of bondcoat present at the dome, due to the different coating process (HVAF) for the bondcoat. Figure 2 shows images of the uncoated and coated pistons.
Compression ratio and average surface roughness before and after engine test.
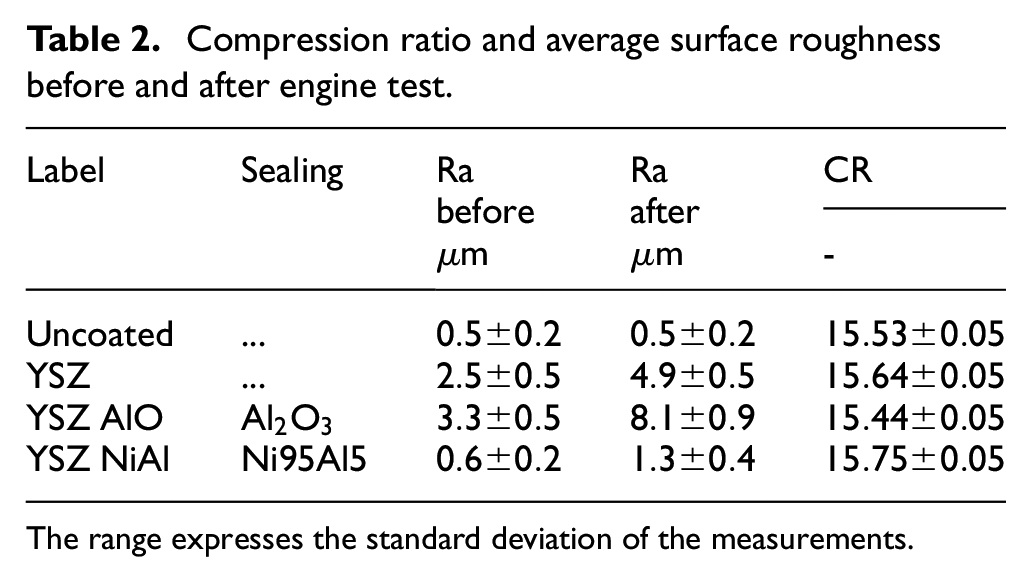
The range expresses the standard deviation of the measurements.
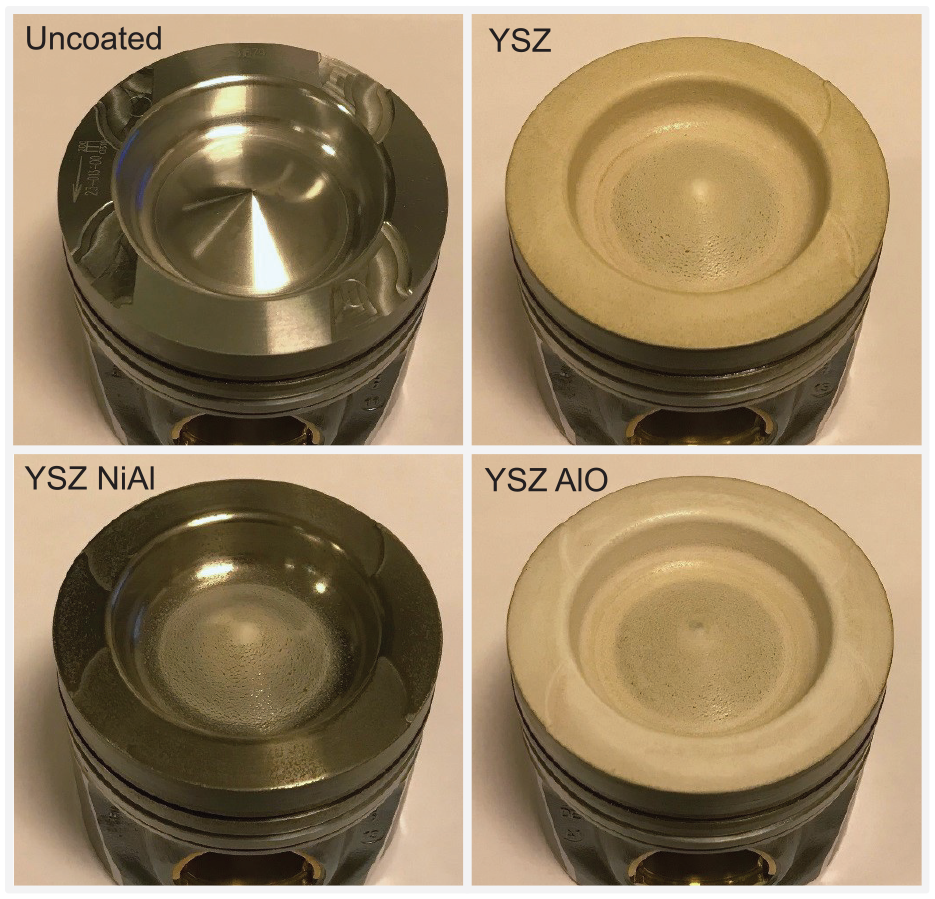
Images of the uncoated and the coated pistons.
Experimental test facility
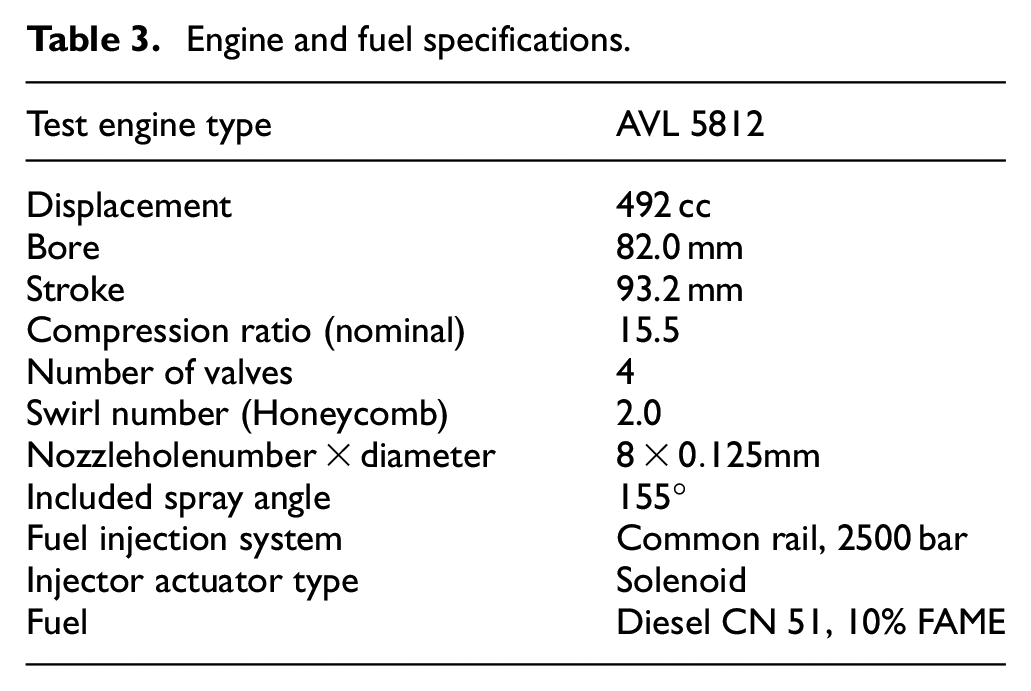
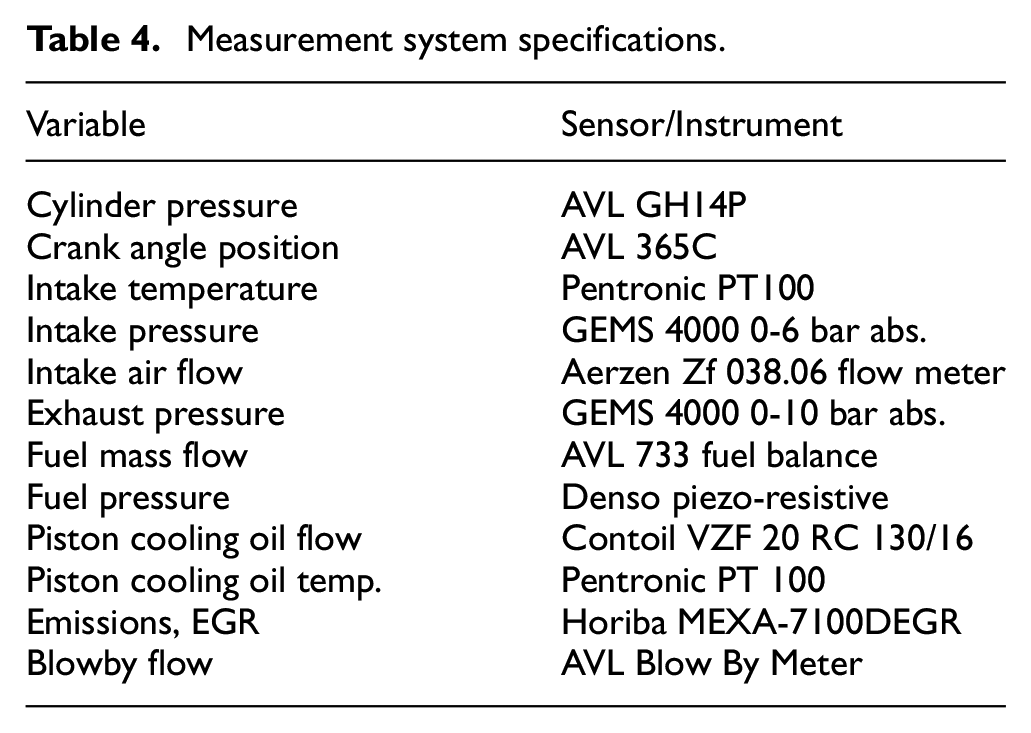
The measurement setup consisted of a single cylinder light duty diesel engine and dynamometer with conditioning equipment and measurement equipment. The engine and fuel specifications are listed in Table 3, the most important test cell instrumentation is described in Table 4. The uncooled and temperature compensated cylinder pressure sensor was mounted in a glow plug adapter. TDC position of the piston was determined by setting the thermodynamic loss angle at a standard value in a motored engine operating point chosen for this purpose. The phasing between crank angle and pressure signal remained thereafter unchanged during the whole experimental campaign. The cylinder pressure data was sampled with a resolution of 1.0 CA, except for the region between 60 CA before and 90 CA after TDC which was sampled with 0.1 CA resolution. For each operation point 100 cycles were measured and thereafter averaged. To further reduce noise, low pass digital filtering of the averaged cylinder pressure and cylinder pressure derivative was applied. This filter had a cut off frequency of 4 kHz. As a piezo-electric cylinder pressure sensor does not give an absolute pressure level, the pressure level was determined by thermodynamic pegging. 34
Engine and fuel specifications.
Measurement system specifications.
Measurement accuracy
Comparing the aRoHR between different pistons requires measurements with high accuracy and repeatable boundary conditions. The following measures were taken to make the measurements as accurate as possible: The temperature levels for coolant, engine oil, fuel supply and intake air were controlled within 0.1°C. Intake pressure and exhaust back-pressure were controlled within ±1 kPa. The fuel quantity was kept constant for each engine operating point, by applying identical current profiles and ensuring the same fuel temperatures in the high pressure fuel system. Having the same energy input is essential when comparing the apparent Rate of Heat Release between tests. Furthermore the following measures were applied:
A single pilot injection with 2 mg fuel was applied to stabilize the ignition timing of the main combustion.
The intake air mass flow was kept constant by adjusting the intake air temperature in order to maintain identical charge density and air/fuel ratio with different piston surface temperatures.
An automated test sequence was applied to target identical time and temperature histories for the different pistons.
Each test run was started with clean combustion chamber surfaces; cleaned or first-run engine parts.
The uncoated piston was tested three times (three separate engine builds) to evaluate consistency for the assembly process and repeatability for the measurement system.
Calculation of the energy balance
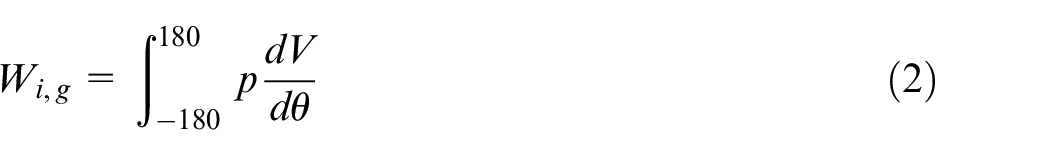
The energy balance for the high pressure cycle can be derived from the cylinder pressure trace and the engine out emissions of carbon monoxide and unburned hydrocarbons. Equation (1) shows the energy balance with the latent fuel energy as an input and the gross indicated work, wall heat loss, exhaust enthalpy and energy in the unburned emissions as output. Gross indicated work is calculated for the high pressure cycle as shown in equation (2). The wall heat losses are calculated as the difference between heat released from burned fuel and the apparent released heat at exhaust valve opening (EVO), equation (3). The exhaust enthalpy can now be derived with equation (4) as all other terms in the energy balance are known. The basis of this energy balance is an accurate and repeatable cylinder pressure measurement as discussed in the previous section. The calculation of the apparent rate of heat release will be presented in the next section.


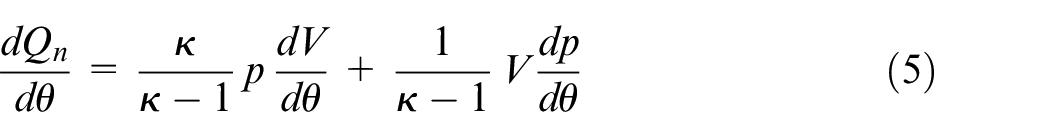
Calculation of apparent heat release
A derivation of the expression for the apparent rate of heat release can be found in the book by Heywood.
35
The following assumptions apply: the cylinder charge is homogeneous with respect to temperature and composition and behaves like an ideal gas with a fixed gas constant
The model from Hohenberg and Killmann
36
was used to evaluate the ratio of specific heats,
Heat loss to the piston cooling oil was evaluated from the oil flow and the temperature increase over the piston cooling gallery. To improve the accuracy of the piston exit oil temperature measurement, a short pipe was added to the cooling oil gallery exit of the piston, directing the oil flow to the temperature sensor. The sensor itself was mounted in a funnel that collected the oil below the piston cooling oil exit (adopted from Dahlström et al. 37 ).
Three engine operating points at 1500 rpm were selected from the part load area of the engine map, important for fuel consumption. The settings for these operating points are listed in Table 5. The engine was run without EGR to minimize interference from soot deposits on the combustion chamber surfaces with the insulating coatings. Each operating point was measured six times, with a duration of 3 min for each measurement. The data from piston cooling heat loss and exhaust emissions measurements were combined into a multiple linear regression model for each load case. The use of these models increases the accuracy and provides 95% confidence levels for the measured data.
Definition of engine operating points.
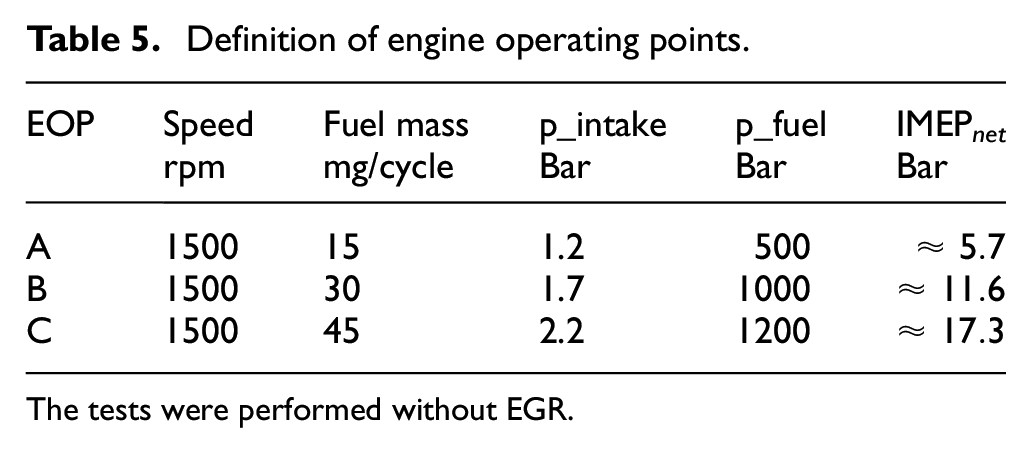
The tests were performed without EGR.
Crevice model
The heat loss and fuel entrainment in the pore volume of the thermal barrier coating is modeled with a crevice model. This type of model has been developed already in the early 80-ies to describe heat losses and fuel trapping in crevice volumes in the combustion chamber of SI engines. 38 Examples of such volumes are the piston top land and volumes in and around the spark plug and fuel injector. Due to the large surface to volume ratio of a crevice volume, the charge in these volumes quickly cools down to the temperature of the walls and can contain a relatively large portion of the cylinder charge around TDC, including fuel in case of a premixed charge. The surface to volume ratio for pores in plasma sprayed TBCs is at least one order of magnitude higher than for example the piston top land. Thus, it is assumed that the crevice model is valid for this type of coatings as well.
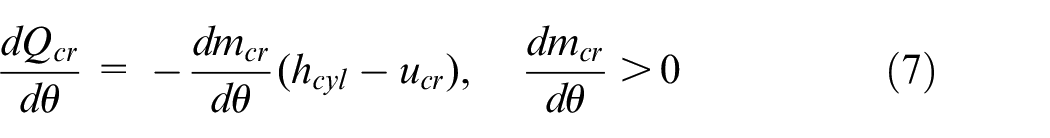
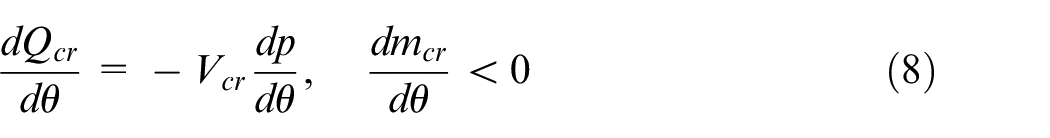
The main assumptions for the crevice model are: incoming gas will immediately assume the crevice wall temperatures, and the pressure in the crevice is equal to the average combustion chamber pressure, that is, no flow losses. With these assumptions, using the ideal gas law, a simple set of equations can be derived, as shown by Heinle et al. 39 Equation (6) describes the mass flow into the crevice which is directly proportional with the pressure change in the combustion chamber. Equations (7) and (8) describe the heat flux to the crevice walls, which is different for inflow and outflow conditions. During inflow, heat flux to the crevice wall originates from energy entering the crevice as well as energy from compressing and heating the charge in the crevice. During outflow, the expanding charge will absorb some heat from the walls, as the temperature of the charge in the crevice is assumed to be constant. The line with equation (9) shows the relations for specific enthalpy and internal energy, related to the specific heats for constant volume and constant pressure. The gas properties are calculated using the NASA tables for the appropriate local gas composition and temperature.
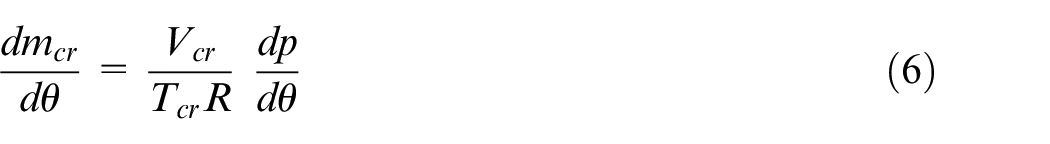

The crevice volume in the equations above is determined by the surface area, the average thickness and the average porosity of the coating:

The extra heat loss simulated with the crevice model can be directly related to the apparent rate of heat release, but the effect of fuel entrainment is not so straight forward. In Figure 3, an attempt is made to illustrate this process. The assumption is that partly burned fuel enters the crevice volume when the flame comes into contact with the thermal barrier coating while the cylinder pressure is rising. Typically the core of the flame is rich and consists of hydrocarbons, carbon monoxide, water, carbon dioxide and nitrogen.
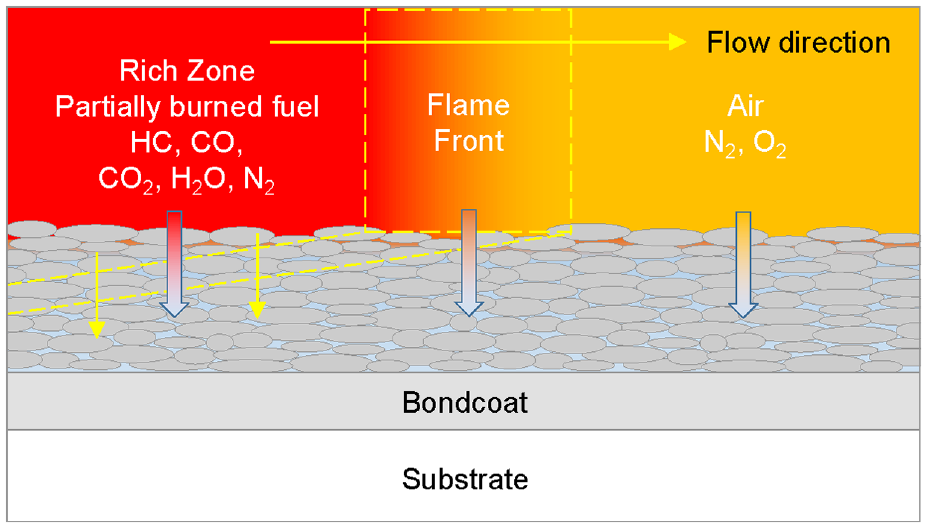
Entrainment of partially burned fuel from the core of the spray and flame front into the porous TBC.
The oxidation of the rich core occurs at the envelope of the jet, where rich mixture meets fresh air and oxygen. During pressure rise and flame wall contact, part of this reaction zone is assumed to be pushed into the porous coating or crevice, causing a deficit in rate of heat release compared to combustion without the presence of a porous coating. With equation (11) a simple relation is proposed to calculate the energy deficit due to partial entrainment of the reaction zone. The ratio between the contact surface
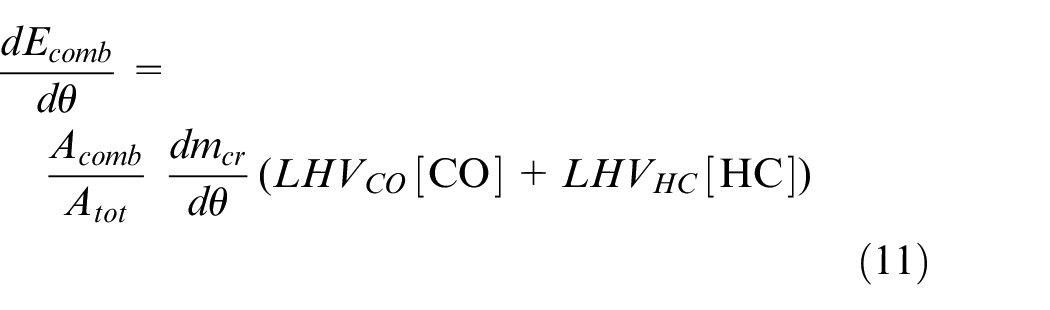
Later in the cycle, when the cylinder pressure drops, fuel is released from the coating (Figure 4). The burning rate of this released fuel depends on the local availability of oxygen and temperature level, but in the crevice model the fuel is assumed to oxidize immediately when leaving the porous coating.
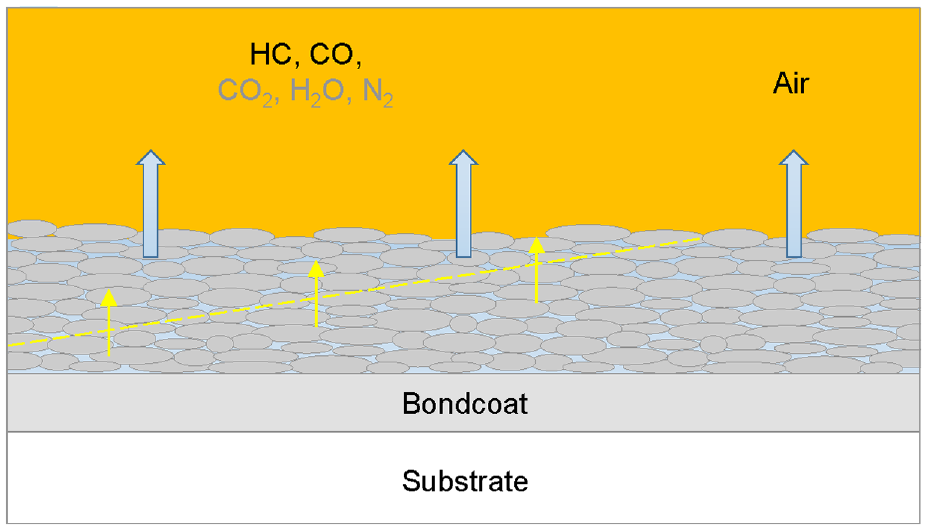
Release of HC and CO from the porous TBC during pressure drop in the expansion stroke.
The objective of this simplified model with rather rough assumptions is to get an educated estimation of the heat losses and fuel entrainment effects of the porous volume on the apparent rate of heat release.
CFD simulations
The purpose of the CFD simulations is threefold: (i) to identify when and where the burning spray interacts with the piston wall, (ii) to calculate temperature and chemical composition of the charge near the piston wall to provide boundary conditions to the crevice model, (iii) to calculate the heat losses and rate of heat release without and with a thermal barrier coating having the thermal properties of YSZ. Simulations were performed for fired and motored cases and compared with experimental results. Only one cycle was simulated in CFD.
The software used for the CFD calculations was AVL Fire v2018. A sector for a single spray was modeled (see Figure 5), using RANS. Traditionally, combustion CFD is performed with fixed wall temperatures. The average surface temperature in a combustion engine with metal walls does not fluctuate >10°–20° during a cycle. However, the surface temperature fluctuations become quite significant in the presence of an insulating material such as zirconia, especially at the locations were the burning sprays interact with the piston wall.35,40,41
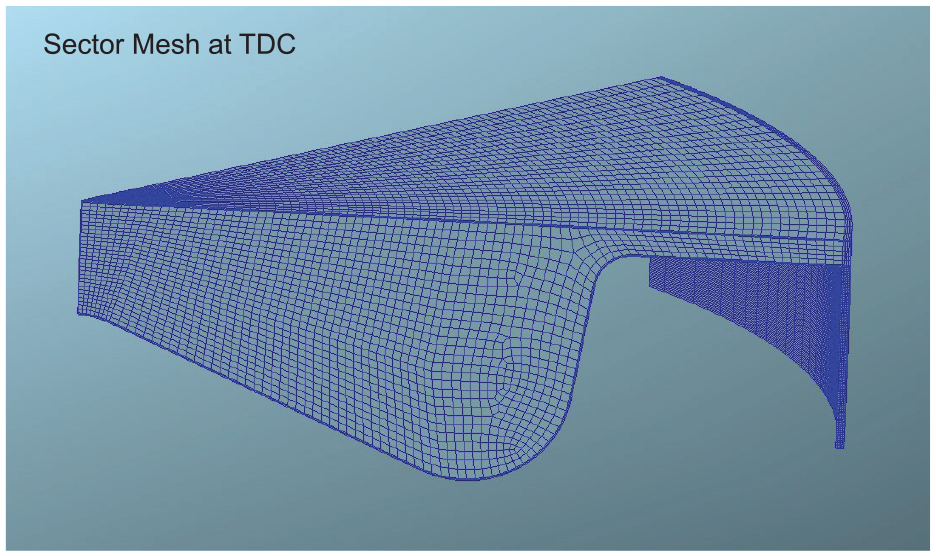
Sector mesh of the combustion chamber for CFD simulations.
The AVL CFD software includes an integrated module to simulate conjugate heat transfer for a thin layer of the combustion chamber surfaces. This module solves the heat flux and temperature equations for a thin layer at the wall surface, lateral and normal to the surface, with the same time step as for the fluid domain. Typically, the active part of the surface extends just a few millimeters below the surface, and the solid below the thin wall model domain can be assumed to be constant in temperature during a combustion cycle.
The solid domain for the thin wall is created by extrusion of the fluid elements at the solid surface into the solid. The thin wall can consist of different materials and for each material the number of layers can be defined. A compression factor is available to increase the resolution close to the interface between fluid and solid. The boundary conditions on the fluid side are set by the fluid temperature and heat transfer coefficient from the adjacent fluid element. On the solid side of the thin wall, the substrate temperature is fixed. These boundary conditions are of the same type when no thin wall module is used. The thin wall model is accurate when its thickness is small compared to the curvature of the surface. The main uncertainty with respect to prediction of the heat flux and surface temperature is the heat transfer coefficient, which is calculated in the gas domain with a wall model. Current state of the art wall models tend to over-predict the heat transfer coefficient in the jet impingement region.
In this investigation, the surface temperature of the liner and cylinderhead were kept constant. Only the piston surface, were the coating was applied, was modeled with the thin wall module. Aluminum properties were applied for the uncoated piston, while the properties of zirconia were applied for the coated piston. Table 6 describes the dimensions and thermal properties of the thin wall domain on the piston.
Thin wall properties for the CHT calculations.
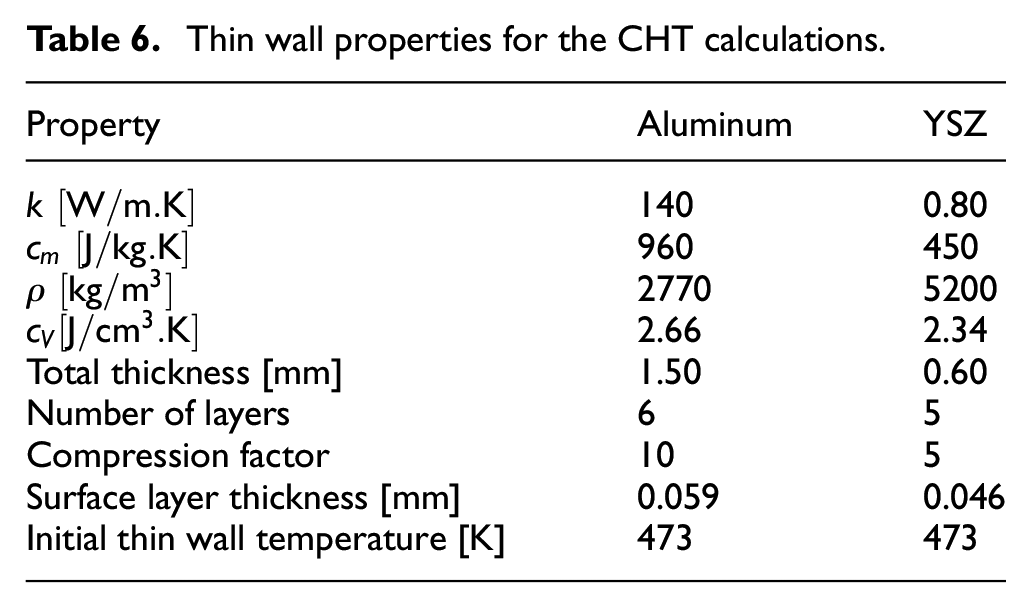
Initialization temperatures for the uncoated and coated piston simulations are the same. This approach gives an indication of the theoretical effect of the coating temperature swing. In the actual engine, surface temperatures at start of compression will be different for a coated piston. Most likely the coated surface will assume a higher temperature after reaching thermal equilibrium, therefore the predicted reduction of heat losses is probably at the lower end.
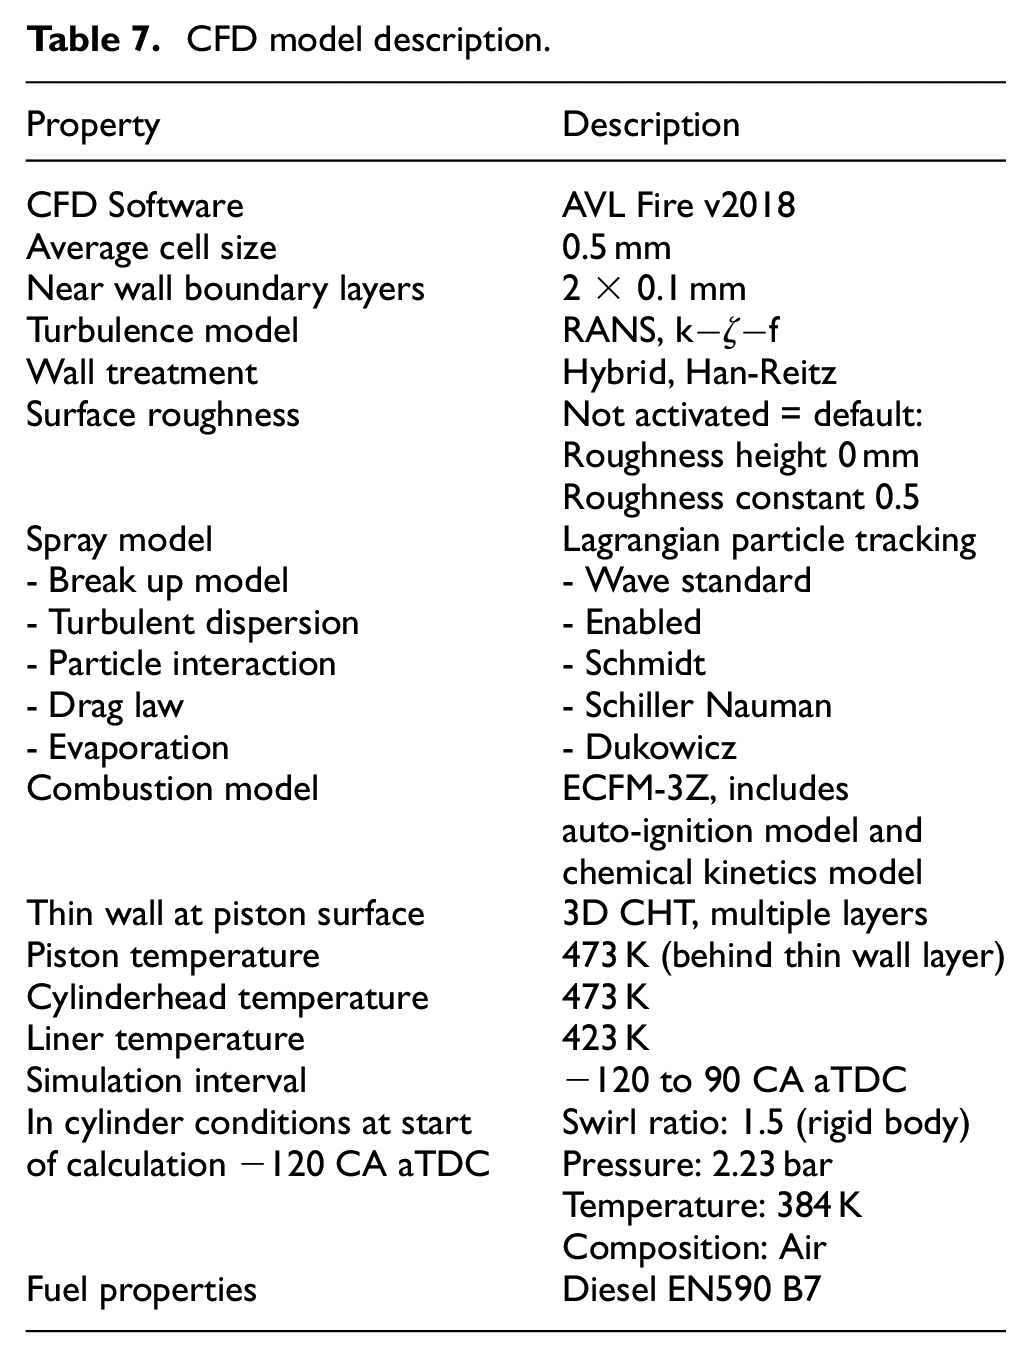
The selection of the sub-models and mesh refinement was partly based on the work by Šarić et al. 42 Standard parameter values were used for all models apart from the auto-ignition model parameters where adjustments were made to make the pilot fuel combustion prediction similar to the experimental data. Details of the submodels used are described in Table 7.
CFD model description.
Results
Engine test results
This section describes the results from experiments with three APS YSZ coated pistons and an uncoated reference piston in a single cylinder light duty diesel engine. Two of the coated pistons had additional plasma sprayed sealing layers on top of the coating, consisting of a Nickel metal alloy and an alumina ceramic respectively. Three load points at an engine speed of 1500 rpm with injected fuel quantities of 15, 30 and 45 mg were investigated. Cylinder pressure traces for the three load points are shown in Figure 6. Small differences in pressure level for the compression stroke can be seen, which are mainly caused by the differences in the compression ratio between the pistons.
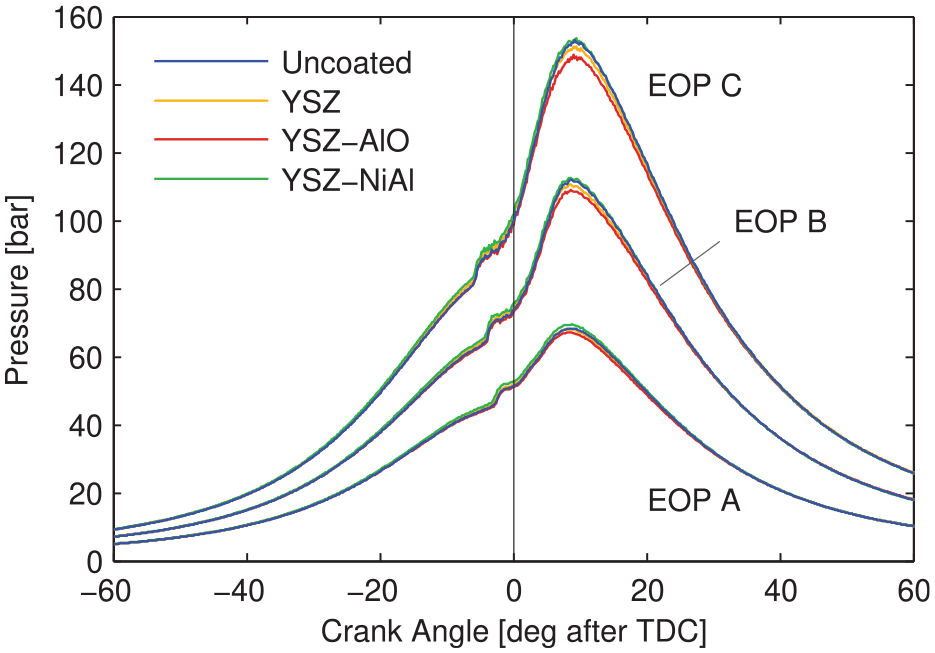
Cylinder pressure traces for the three engine operating points.
For understanding the global effect of the coatings on engine performance, an energy balance was made for all pistons in each engine load point, summarized in Table 8. In general, all coated pistons show lower efficiency compared to the uncoated piston. Wall heat losses are lower for the YSZ and YSZ-AlO coated pistons or similar for the YSZ-NiAl coated piston. Energy contained in unburned fuel leaving with the exhaust gases is somewhat increased for the coated pistons, most for the metal sealed coating. Finally the exhaust enthalpy is higher for all coated pistons. Unfortunately it is not uncommon that YSZ coated pistons do not give an efficiency improvement as expected. Finding a possible explanation is the main motivation of this investigation.
Energy balance for the high pressure cycle, shown in percentage of energy content of the injected fuel.
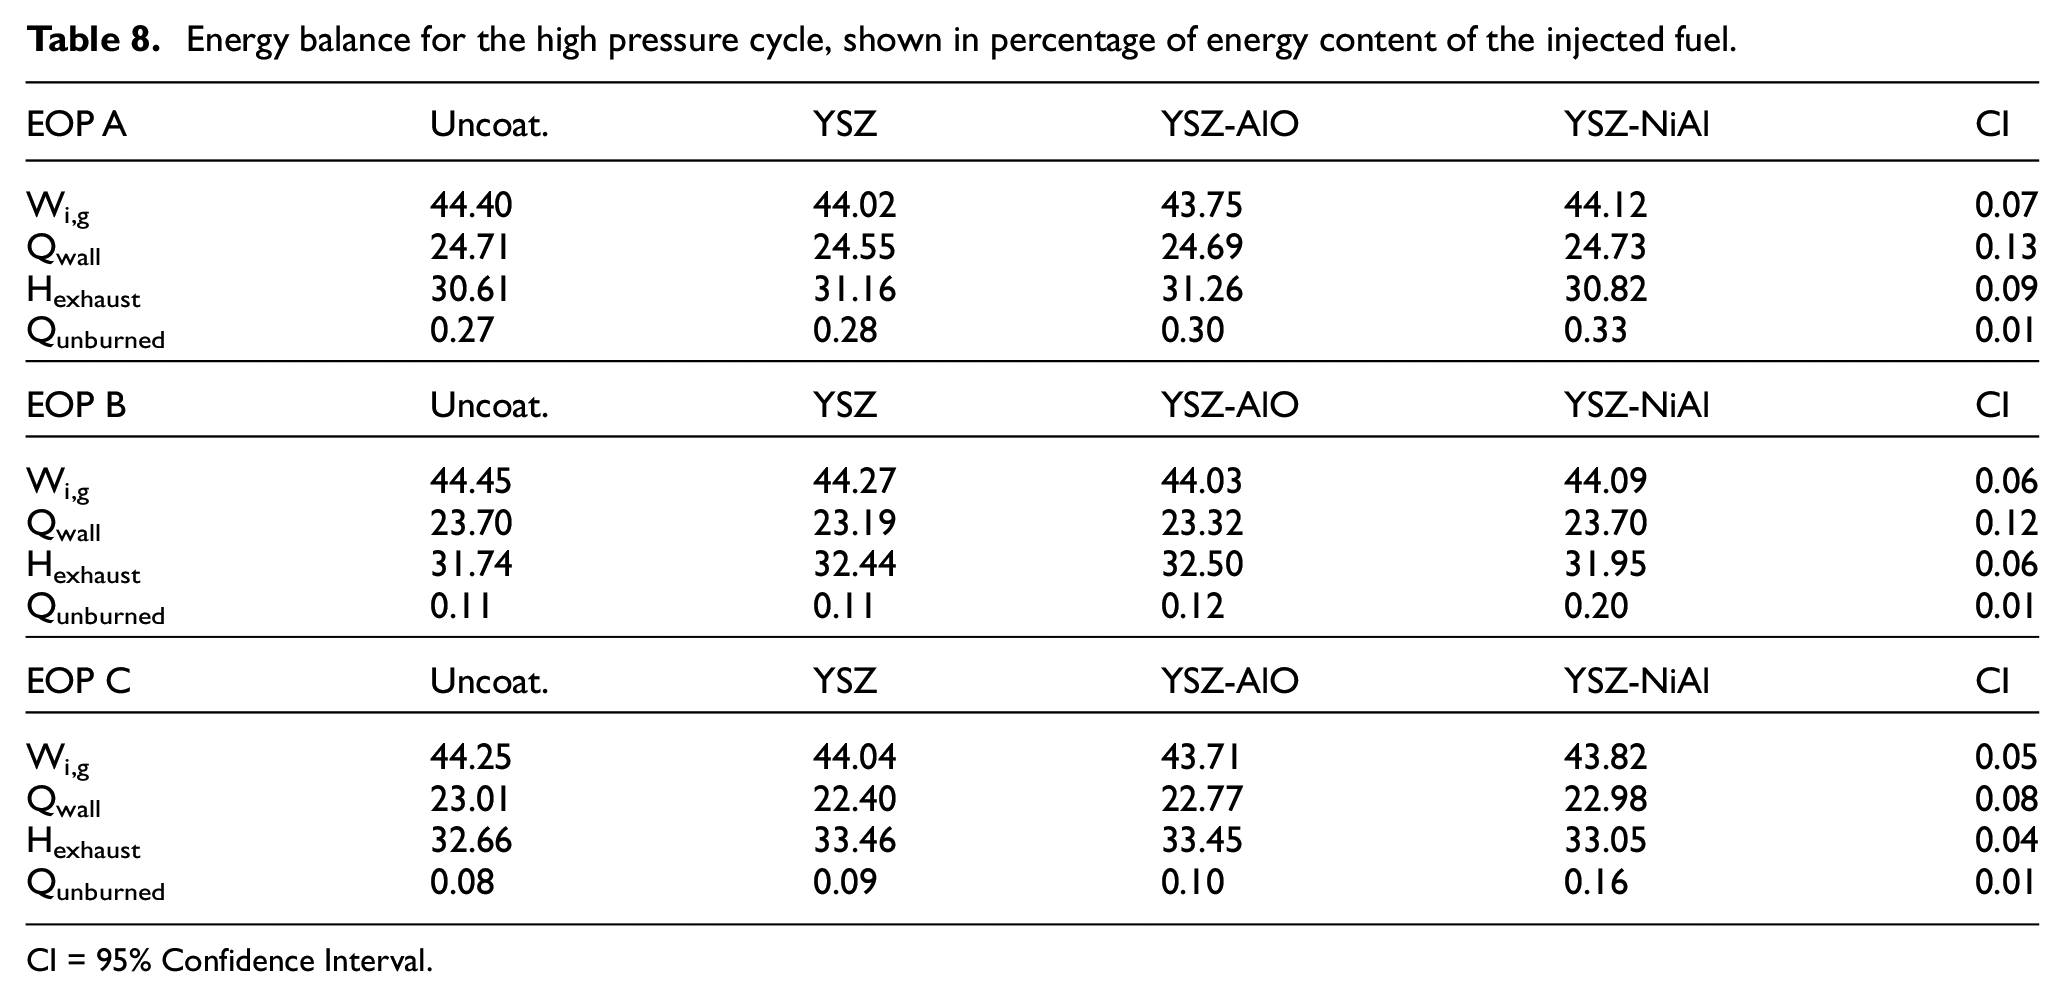
CI = 95% Confidence Interval.
To study combustion and heat losses, we will look at the apparent rate of heat release (aRoHR) which is the sum of the rate of heat production and rate of heat loss, hence the term ’apparent’. Figure 7 shows the aRoHR for the three load cases. The pilot combustion and first part of the main combustion are nearly identical for the different pistons. Small shifts in phasing of the pilot combustion, observed at the lowest load are caused by differences in ignition delay due to charge temperature and pressure differences at the time of fuel injection. The curves start to diverge from about 3°–5° after TDC. Typically, the coated pistons show a reduction of the rate of combustion and/or increase in heat losses up to about 10°–13° after top dead center. Thereafter, the curves for the coated pistons show similar or higher rates of combustion and/or lower heat losses.
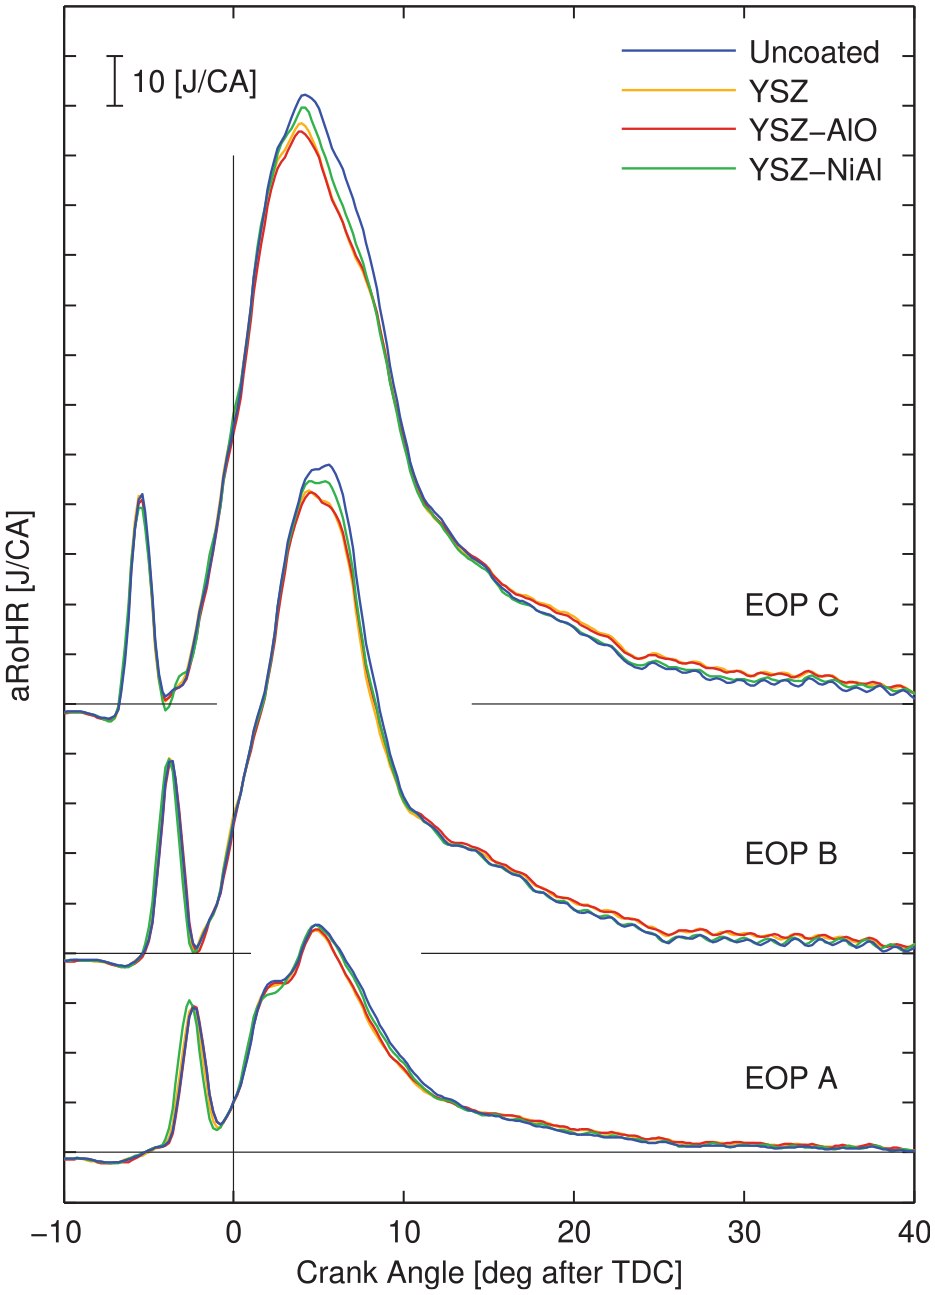
Apparent rate of heat release.
Integration of the apparent rate of heat release gives the apparent heat release (aHR), presented in Figure 8. The coated pistons show, after the initial deviation of the aHR from the uncoated piston, a recovery behavior. Fuel conversion efficiency is above 99.7% for these operating points, therefore, at the end of combustion, the difference between the fuel heat from combustion and the apparent heat released can be interpreted as the heat loss to the combustion chamber walls. With the fueling being constant between the different pistons, a difference in aHR at the end of combustion correlates with differences in heat losses between the pistons.
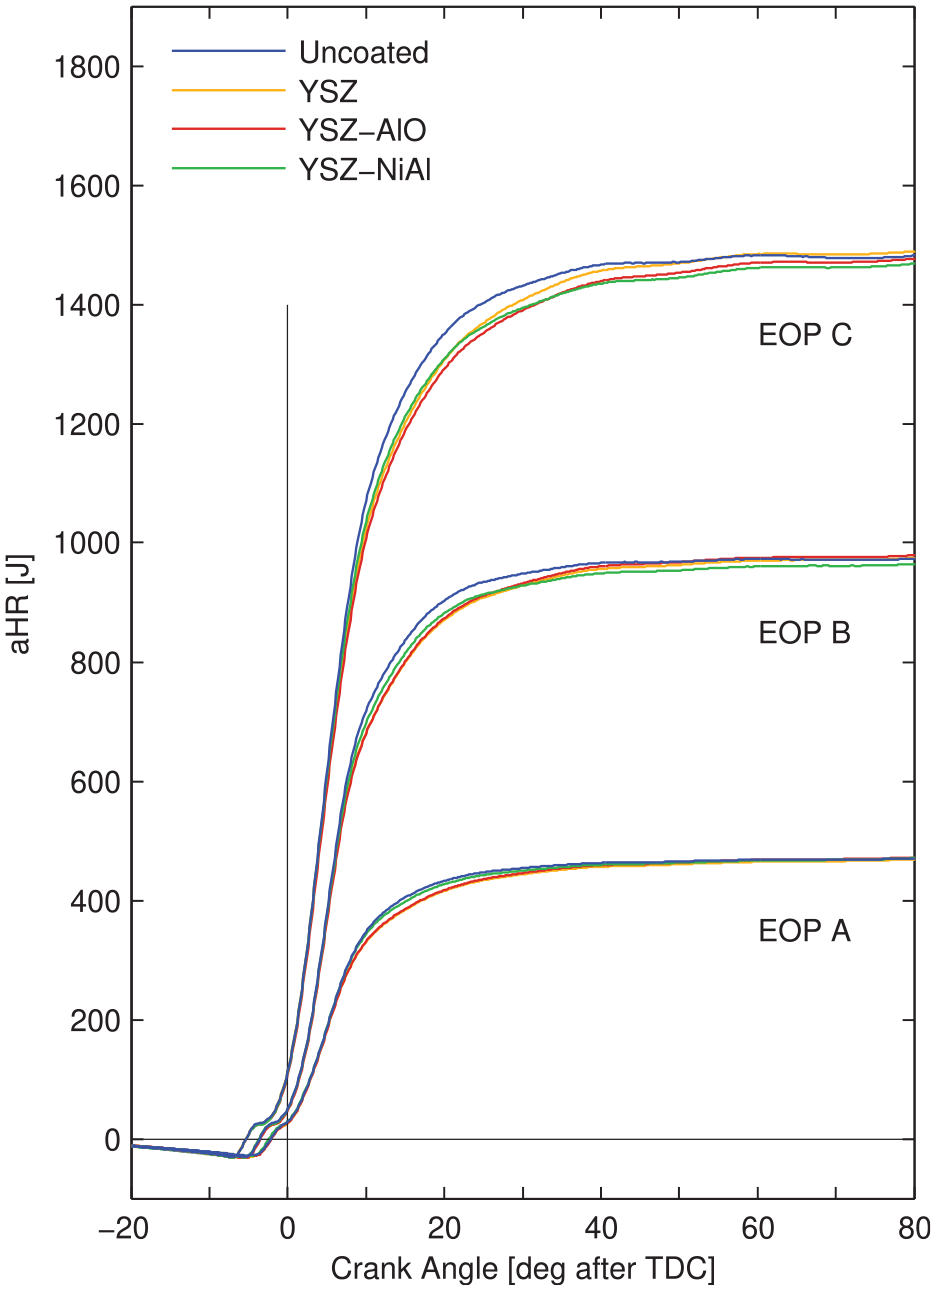
Apparent heat release.
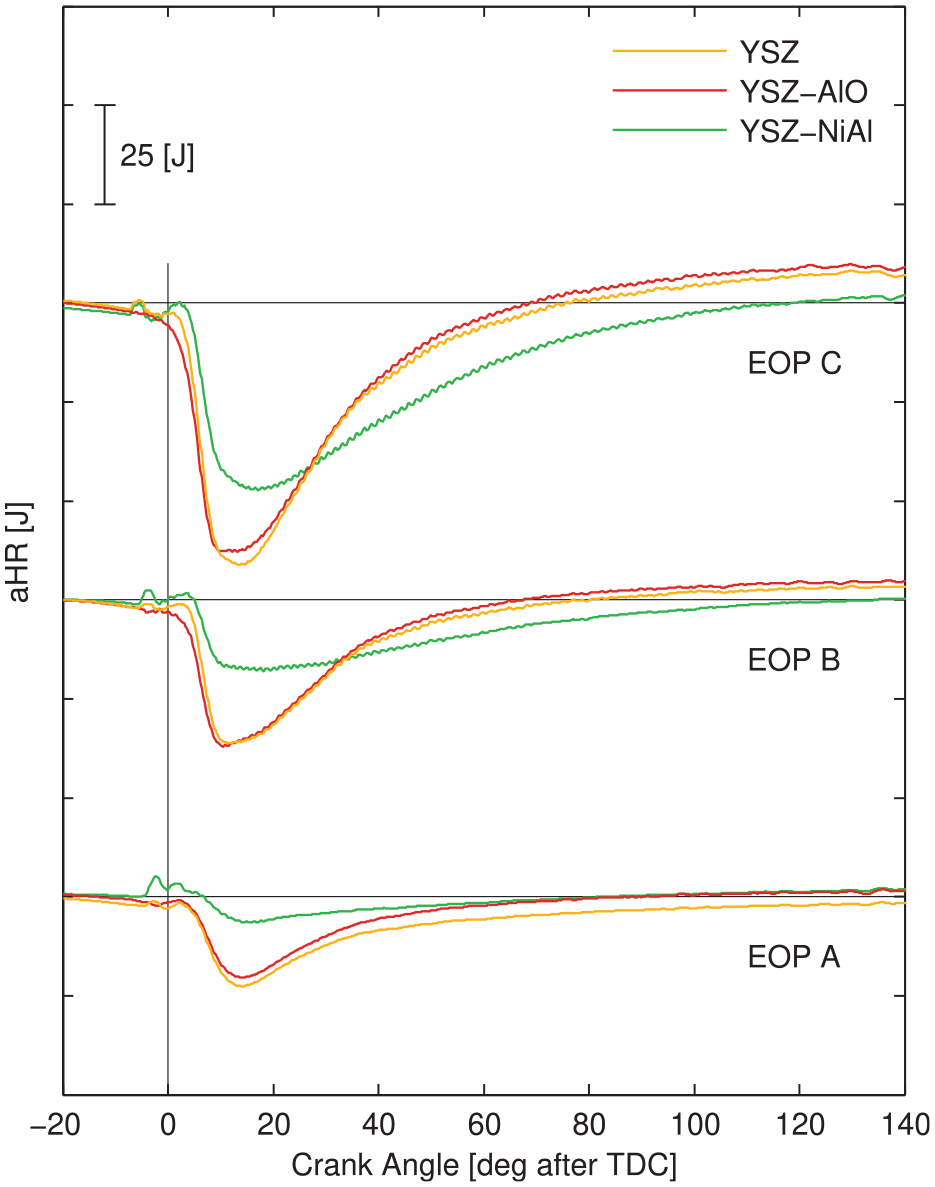
To further study the details and differences in apparent heat release between the load points and the different pistons, the curve for the uncoated piston was subtracted from the curves of the coated pistons. The resulting traces for the coated pistons, aRoHR and aHR, are shown in Figures 9 and 10 respectively.
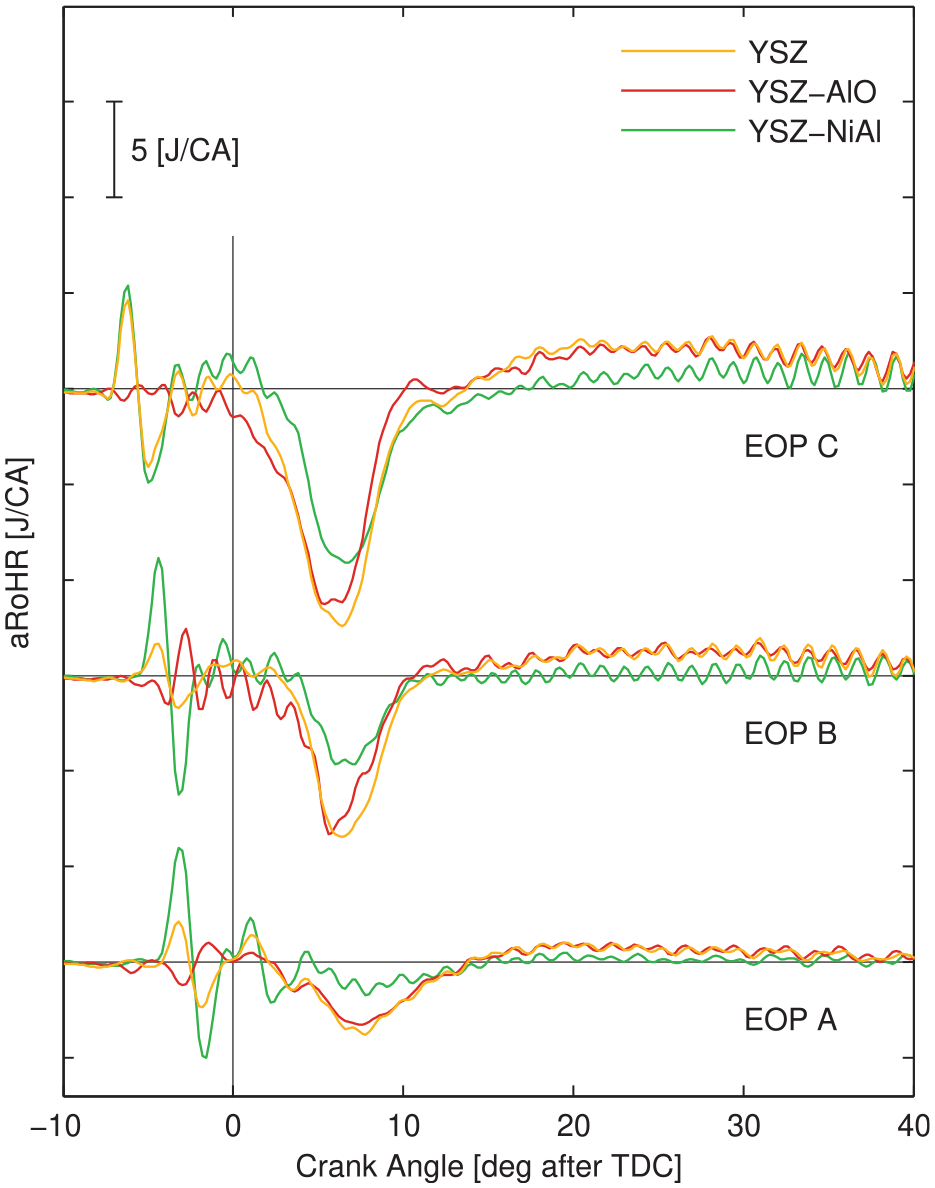
Apparent rate of heat release, relative to the uncoated piston.
Apparent heat release, relative to the uncoated piston.
The oscillations before TDC in Figure 9 are due to small shifts in pilot combustion compared to the uncoated piston. Two distinct phases in the relative aRoHR can be identified: from shortly after TDC to about 10–15 CA after TDC, there is a clear lagging of combustion and/or increased heat transfer. After the first phase, recovery of the aRoHR can be observed, combustion is faster and/or heat losses are lower compared to the uncoated piston. The unsealed piston (YSZ) and the piston sealed with alumina (YSZ-AlO) show very similar behavior, while the piston with the Nickel sealing layer (NiAl) has less of a dip and less recovery of the aRoHR.
In Figure 10 the relative apparent heat release is plotted. The x-axis is now extended to 140 CA after TDC, just before exhaust valve opening. After the initial fast decline in apparent heat release, a long period of recovery follows, far into the exhaust stroke. Again the metal sealed piston shows the smallest decline and recovery and remains closest to the uncoated piston. Assuming that combustion is completed at 140 CA after TDC, differences in the aHR must be caused by differences in total heat loss at the end of the high pressure cycle. For the medium and high load case, the unsealed piston and piston with ceramic sealing show a reduction in heat loss. The piston sealed with metal is about neutral with respect to heat loss. For the lowest load case, differences between the heat losses at the end of the cycle are small, however, the sealed pistons seem to have a slightly lower heat loss compared to the unsealed piston. Note that the heat losses discussed here are for the high pressure cycle only.
Another way to assess the impact of the piston coatings on the heat losses is to measure the heat flux into the piston cooling oil. This will be an indication for the heat losses over the whole engine cycle. The values shown in Figure 11 were acquired from a model fitted on the measured data, hence the 95% confidence intervals. The model compensates for the small differences in compression ratio between the pistons.
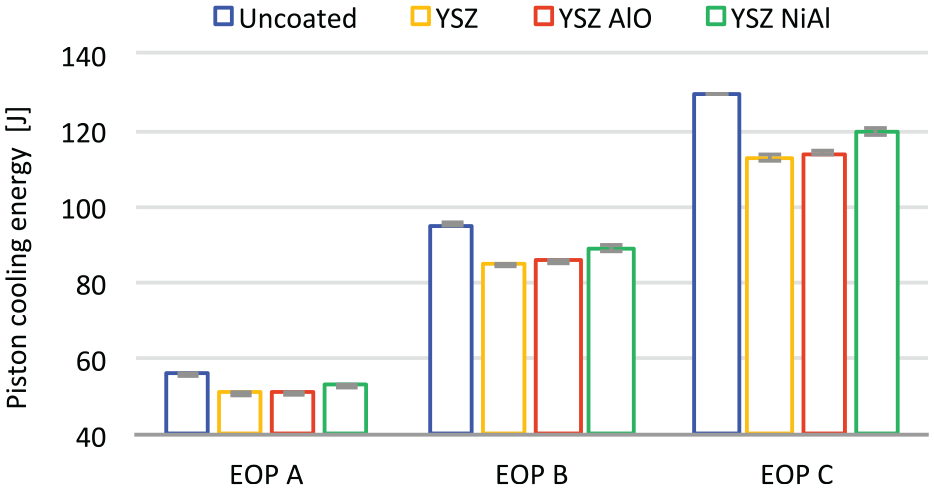
Heat losses to the piston cooling oil for one engine cycle. Error bars show the 95% confidence interval.
The first observation is that all three coatings reduce the heat flux to the piston cooling oil by about 10%–15%. Secondly, the metal sealed coating is slightly less insulating, which aligns with the findings from the heat release analysis, at least for the medium and high load operation. Interestingly, the reduction of the heat flux to the piston cooling oil is larger than the reduction of heat loss calculated from the apparent heat release.
An explanation could be that part of the heat flux into the piston surface is not going to the piston cooling oil, but is transferred to the charge during the gas exchange cycle. Heat transfer in the gas exchange cycle is not included in the heat release analysis. The temperature of the piston surface will be increased by the insulating coatings and that would make it likely that more heat is transferred to the charge during exhaust and intake stroke. The surface of the metal sealed coating might not get as hot as the ceramic coatings due to the higher thermal conductivity of the metal and thereby exchange less heat with the charge, more going into the piston.
The hypothesis was that the pistons with the sealed coatings would perform better compared to the unsealed coating by preventing hot charge and fuel to enter the porous coating. Looking at the results presented here, the sealed pistons perform equal (YSZ-AlO) or worse (YSZ-NiAl). Analysis of the piston surface after engine testing might give a part of the explanation for this. In Figure 12, images of the bowl rim are shown for both of the pistons with a sealing layer. The Nickel alloy sealing is mostly intact. Some cracks show, with marks of powder traces, indicating outflow of charge containing small particles of YSZ. The sealing function is probably affected, but could still be partly effective. The surface of the alumina sealed piston reveals many small cracks, about 0.4 mm apart.
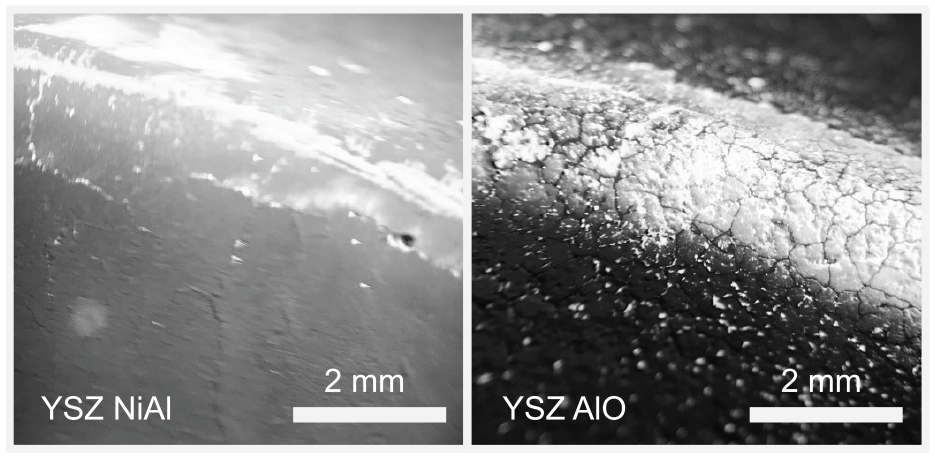
Images of the piston bowl edge after engine testing. On the left, the nickel alloy sealed piston surface, on the right the alumina sealed piston surface.
Surface roughness measurements after engine testing show an increased surface roughness level for the alumina coated piston (Table 2), while the surface roughness for the Nickel alloy sealing remains at a low level, close to that of the uncoated piston.
Analysis of the engine exhaust gas emissions show a slight increase of nitrogenous oxides (NOx) and soot for the coated pistons, with only small differences. More interesting are the results for carbon monoxide (CO) and hydrocarbons (HC), shown in Figures 13 and 14 respectively. The coated pistons with sealing layers give a significant increase of CO compared to the uncoated piston and coated piston without sealing. CO emissions from the metal sealed piston are up to three times the levels of the baseline piston.
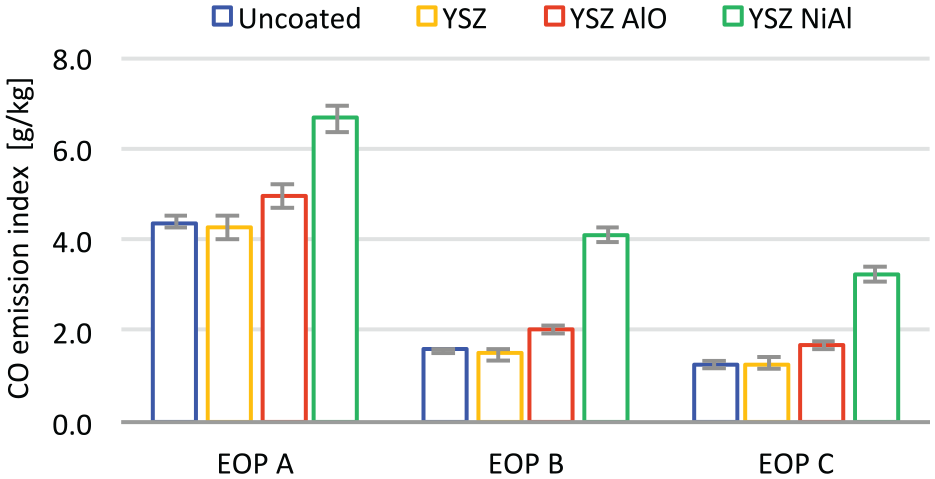
Fuel specific CO emissions. Error bars show the 95% confidence interval.
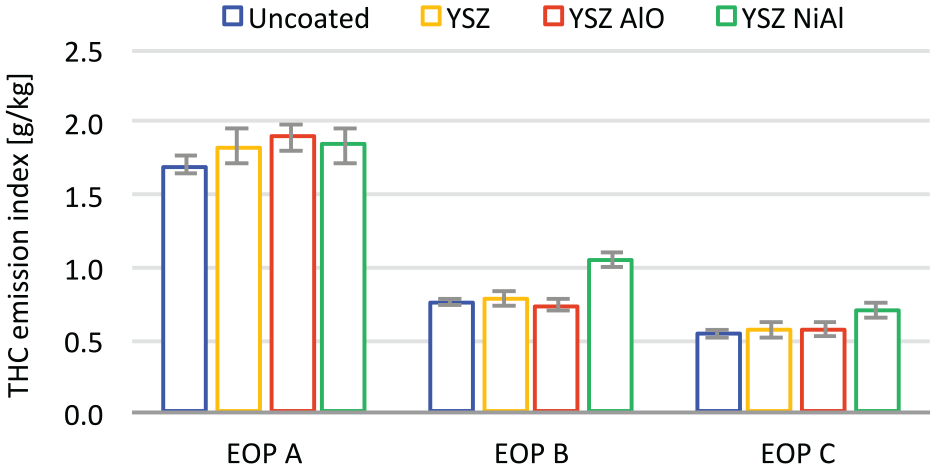
Fuel specific HC emissions. Error bars show the 95% confidence interval.
The hydrocarbon emissions were elevated as well for the metal sealed piston in the medium and low load engine operation point. For the highest engine load, there is a tendency for an increased HC emission level for all coated pistons. With respect to the energy balance, the increased levels of CO and HC contain about 1 J of chemical energy (for EOP B), which only has a minor impact on combustion efficiency (<0.1%).
CFD simulation results
The purpose of the CFD combustion simulations is threefold. The first aim is to investigate the effect of a coating with the thermal properties of YSZ without open porosity and a smooth surface and compare this with simulation results for an uncoated piston. The second purpose is to confirm the timing of the start of the spray wall interaction in CFD with the start of the deviation for the apparent rate of heat release between the uncoated and coated pistons. Finally, the third reason for doing CFD is to provide input data for the crevice model, namely the temperature field and unburned fuel distribution close to the piston wall. For the simulations in CFD and the crevice model, the medium engine load, operating point B is selected.
In Figure 15, experimental and simulation results for the aRoHR are shown side by side. The coated piston in the experiment has the YSZ coating without sealing. In the simulation, the thermal properties for the coating layer are those from the experimental YSZ. The aRoHR is calculated from the cylinder pressure curves, using the same resolution, filtering and algorithm for experiments and simulations. The simulation captures the main features of the experiment well. But where the coated piston in the experiment shows a reduction in the apparent heat release, a higher apparent heat release is predicted by the simulation, which is what is expected from a thermal barrier coating. While the experiment shows a reduction in indicated work with about 0.4% for the coated piston (see Table 8), an increase in indicated work with about 1% is simulated for the coated piston. The coating does not perform in the engine as predicted by simulation, almost the opposite behavior is found. The positive effect from the insulating coating must be counteracted by other phenomena, not included in the CFD simulation model.
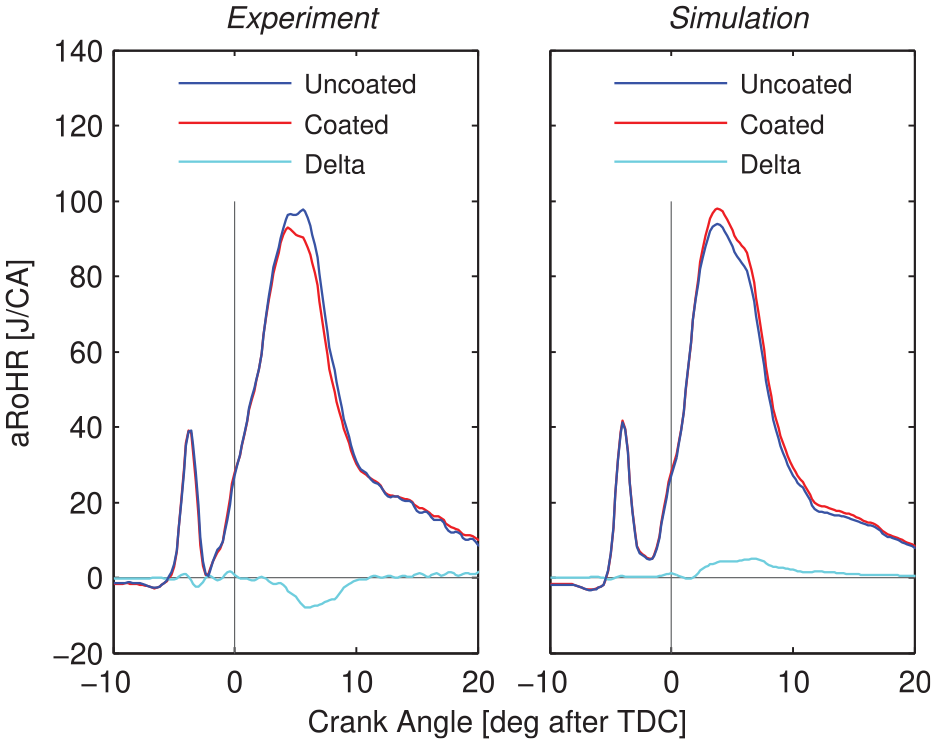
Measured and simulated aRoHR for the piston with YSZ coating and uncoated piston in EOP B.
In Figure 16 the simulated piston surface temperature is visualized for the uncoated aluminum piston and for the YSZ coated piston. At 7 CA after TDC the surface temperature reaches a peak which is significantly higher for the coated piston, explaining the reduced heat transfer to the piston.
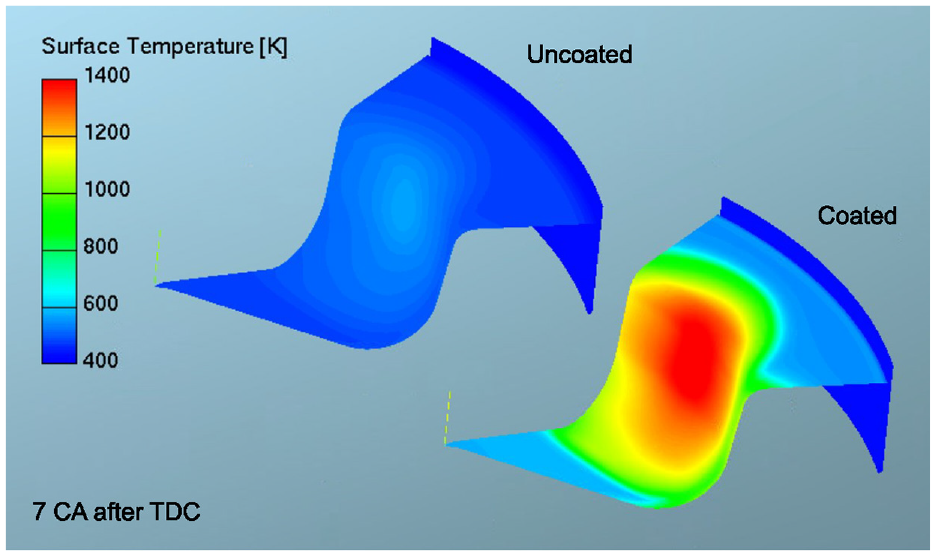
Simulated wall surface temperature for uncoated and YSZ coated piston at 7 CA after TDC for EOP B.
Figure 17 shows the temperature field in a vertical cross-section through the centerline of the jet. At 2 CA after TDC the jet has just reached the piston surface, the near surface charge temperature is in the range of 2000–2200 Kelvin. The mass fraction distribution of CO and HC is shown in Figure 18 for the same crank angle. Close to the piston surface the mass fraction of CO reaches levels up to 12% and for HC levels of 16% are noted for this crank angle. Table 9 summarizes the average mass fraction levels for the flame contact surface from flame impact on the piston to peak cylinder pressure. The average numbers for CO and HC are used as input for the crevice model to simulate the effect of fuel penetration in a porous coating.
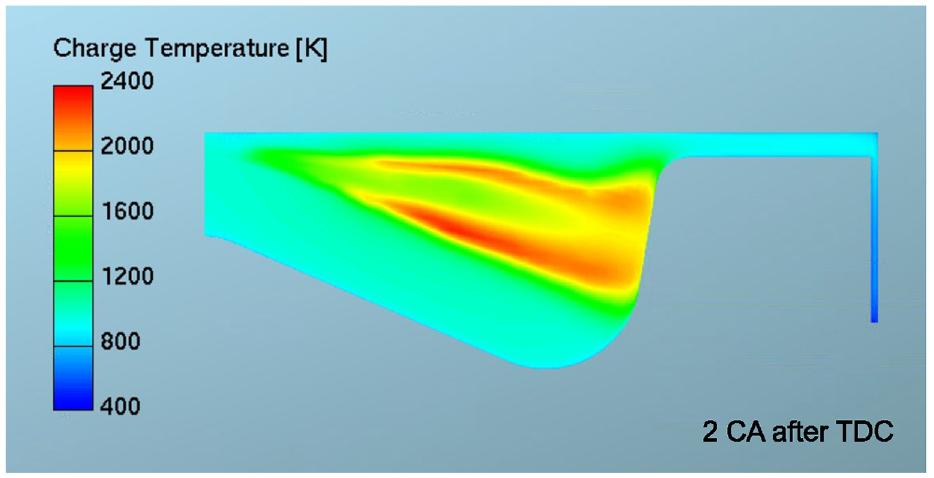
Simulated temperature field at 2 CA after TDC for EOP B. Cross section at jet axis.
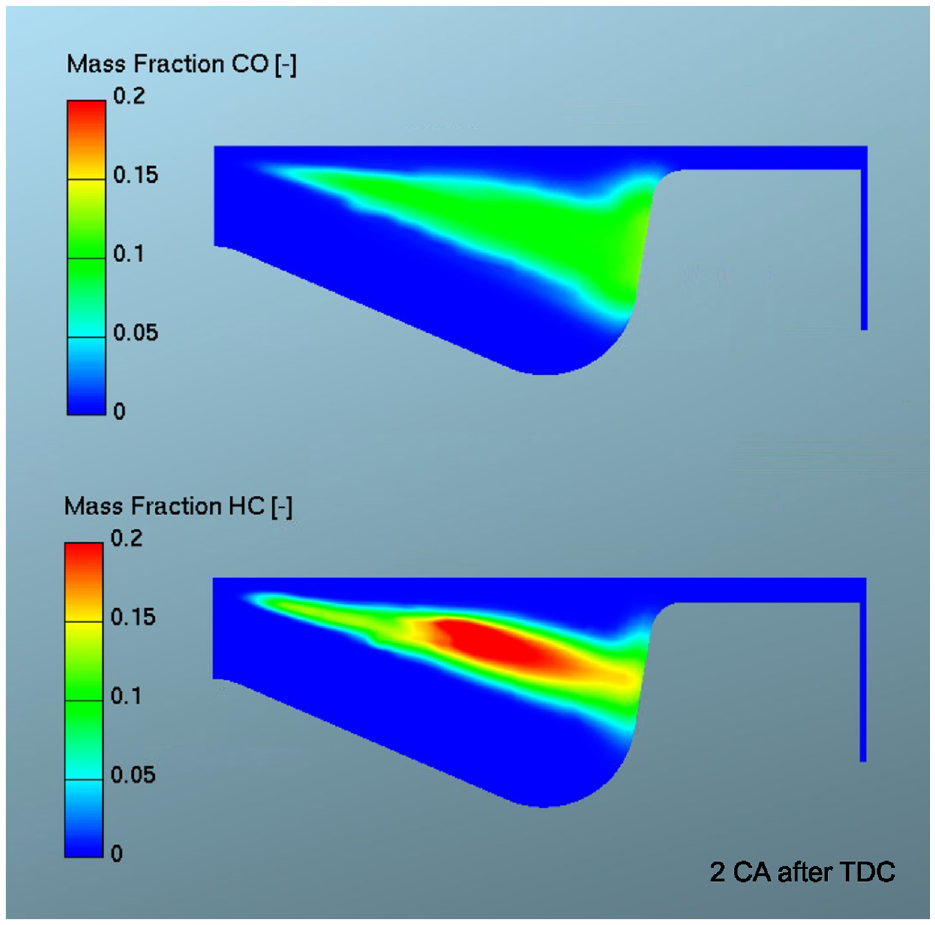
Simulated CO and gaseous HC distribution at 2 CA after TDC for EOP B. Cross section at jet axis.
Species mass fraction in the rich zone near the piston wall.
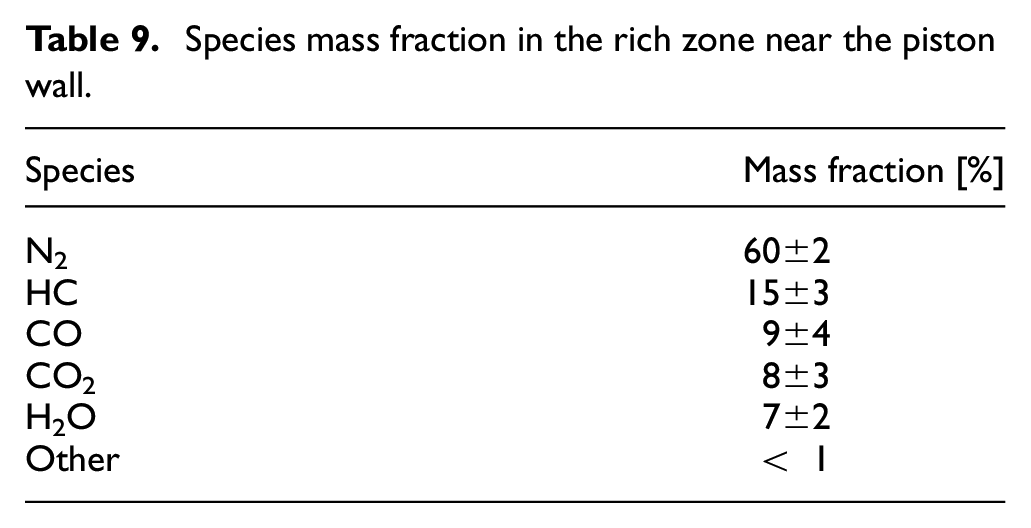
Figure 19 shows the reaction rate, that is, where the combustion takes place. When the jet reaches the piston surface, some of the reacting mixture will enter the porous coating according to the crevice model. The flame front will continue to travel perpendicular to the piston wall, until the flame covers a large part of the piston and cylinderhead surface. As long as the cylinder pressure is increasing, part of the combusting mixture in the flame front and rich mixture from the core of the flame will be pushed into the porous coating. After peak cylinder pressure is reached, the crevice flow reverses and partially burned fuel, CO and HC will flow back into the combustion chamber. In the crevice model oxidation happens instantly, but in reality the oxidation rate of this fuel depends on local temperature and availability of oxygen.
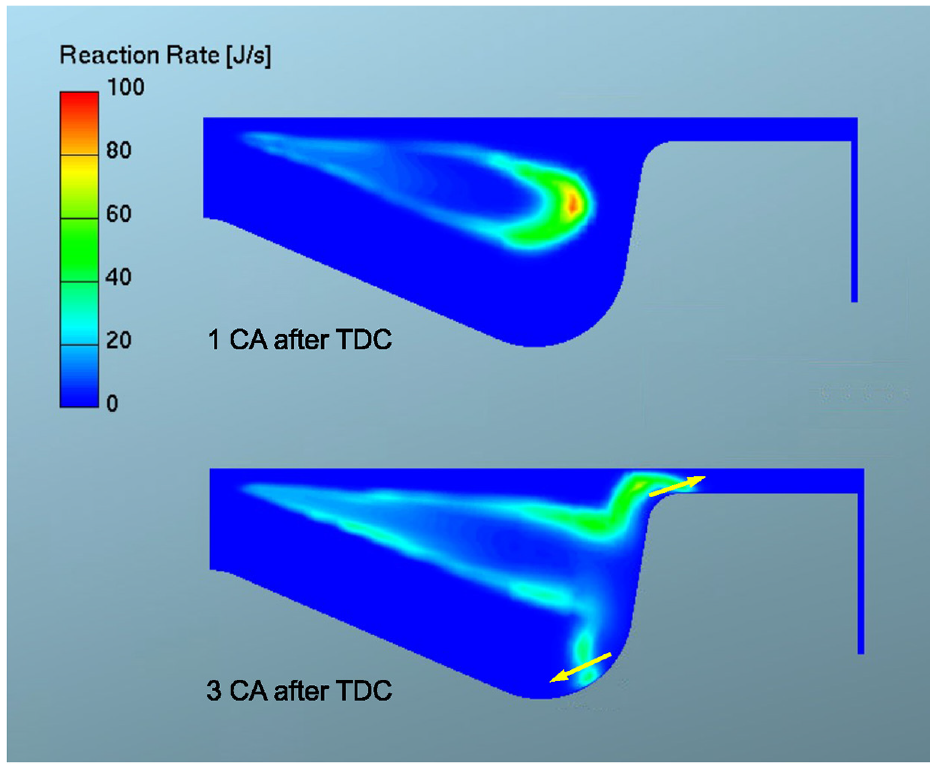
Simulated chemical reaction rate at 1 CA (top figure) and 3 CA (bottom figure) after TDC for EOP B. Yellow arrows indicate the flow direction along the piston wall.
Crevice model results
The crevice model is a representation of the porous volume in the piston coating including the in- and outflow of cylinder charge. The boundary conditions for this model with respect to the cylinder charge properties are provided by the CFD simulations. In Figure 20 the average temperature and pressure of the cylinder charge are presented, as well as an estimated average near wall charge temperature. When the burning diesel jet reaches the piston, it spreads out in a few crank angle degrees and the near wall charge temperature will rise to about 2200 Kelvin for the whole surface. Once the maximum cylinder pressure is reached, the flow reverses and near wall temperature nor CO and HC concentrations are needed as input for the crevice model anymore.
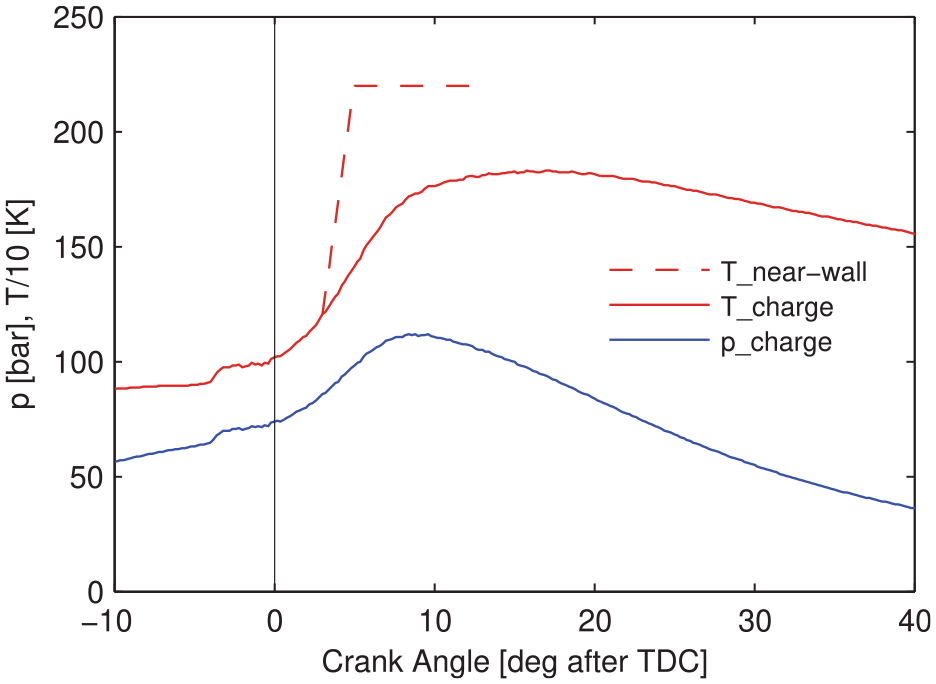
Charge pressure and temperature for EOP B. The dashed line represents the near wall (piston) temperature upon flame impact.
Figure 21 shows the simulation results from the crevice model for the mass flow and heat transfer to and from the crevice volume. During compression and cylinder pressure increase, charge is pushed into crevice volume, after peak cylinder pressure the flow is reversed. The gray curves in Figure 21 shows the mass flow (Figure 21(a)) and accumulated mass (Figure 21(b)). Close to 4% of the total cylinder charge resides in the crevice volume at peak cylinder pressure. The red curves show the heat flux (Figure 21(a)) and accumulated heat transfer (Figure 21(b)) to the crevice walls. The curves for the heat flux and crevice mass flow in Figure 21(a) show a remarkable similarity with the delta aRoHR in Figure 9.
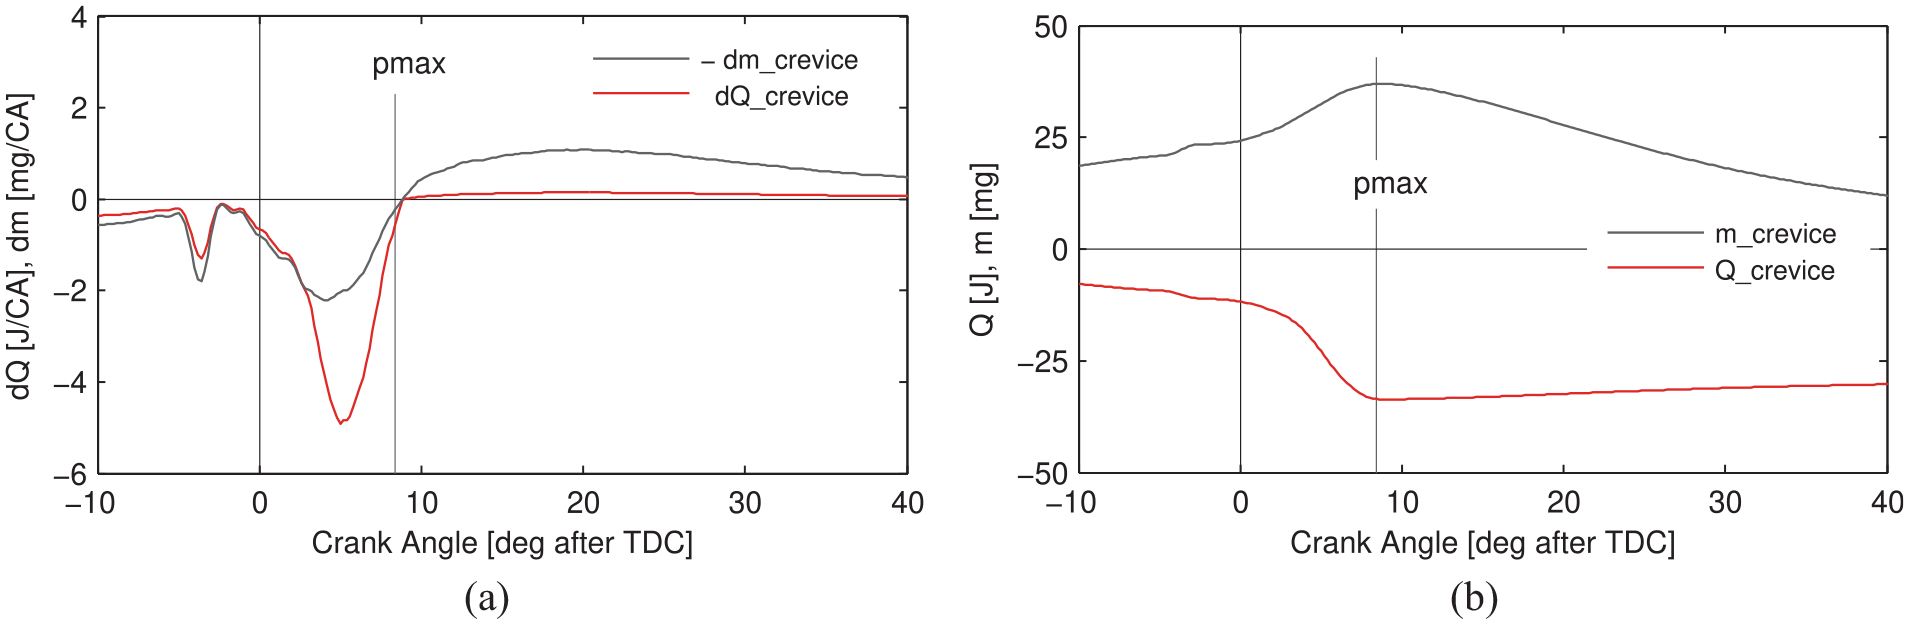
Rate of change per crank angle in (a), integrated over crank angle in (b).
The heat loss calculated from the crevice model can be directly compared with the experimental apparent rate of heat release for the coated piston without sealing. But for the comparison of the effect of fuel entrainment and combustion the combustion deficit has to be derived. How this is done is described in the method section.
The modeled rate of combustion deficit due to partial entrainment of the reaction zone, dEcomb, is plotted in Figure 22(a), together with the heat flux in the crevice dQcrev and the theoretical reduction of heat flux with the insulating coating dQwall (calculated with CFD).
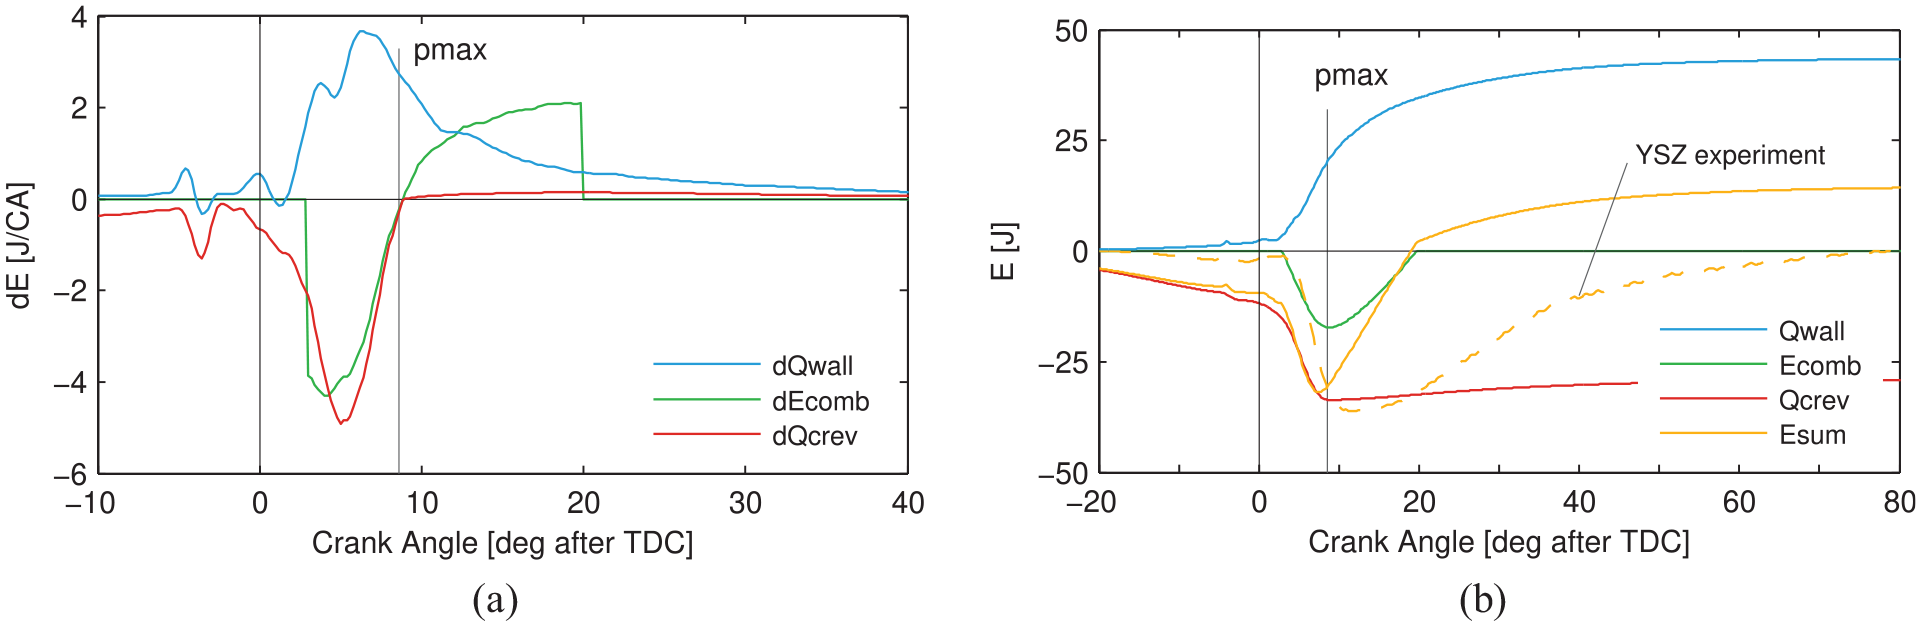
Rate of change per crank angle in (a), integrated over crank angle in (b).
Figure 22(b) shows the same quantities integrated over crank angle and summarized as Esum, the total change in energy with an insulating coating and porosity effects compared to an uncoated piston. The experimental relative curve for the YSZ coated piston is added in Figure 22(b) with a dashed yellow line for comparison with the simulation. The green curve representing the combustion deficit in 22b starts with an abrupt drop, when the flame first reaches the piston surface. Unburned fuel continues entering the surface until cylinder pressure reaches its peek. Thereafter, CO and HC will flow back into the combustion chamber, until all fuel has left the coating shortly after 20 CA after TDC. In the model, instant combustion upon fuel release is calculated, but it is likely that the combustion of this fuel will take longer time, depending on local availability of oxygen and temperature level.
Comparison of the measured energy loss and the simulated energy loss in Figure 22 shows a somewhat lower minimum and slower recovery in the experiment. This means that the models predict better insulation (CFD) and/or lower heat loss (crevice model) in the porous coating relative to the experiment. The difference can also be due to phenomena that are not included in the simulations such as effects from surface roughness, convection vive or radiation absorption.
Motored engine operation
The motoring case (with boundary conditions from EOP B) has some features that makes it particularly interesting to study in relation to insulating coatings and heat losses. Without combustion, the heat transfer phenomena become less complex: there is no significant effect from radiation, no convection vive, no soot layer (the motoring points were measured before measurements with combustion), no chemical heat release, no fuel penetration in the coating. The rate of heat release analysis now only shows effects of heat losses. The effect of blowby on the aRoHR is comparably small and can be neglected. Factors that will affect the heat loss while motoring are: (i) insulation, i.e. the temperature difference between piston surface and the charge in the cylinder, (ii) charge turbulence, which should be very similar between the pistons, (iii) surface roughness, and (iv) crevice losses.
The apparent heat release aHR for the motored and simulated cylinder pressure data for the of EOP B (without fuel injection), is plotted in Figure 23(a). The blue curves, solid for experiment, dashed for simulation, show the aHR for the uncoated pistons. The total heat loss calculated in CFD (dashed curve) is close to the experimental heat loss, the final value at 80 CA after TDC only differs 7%.
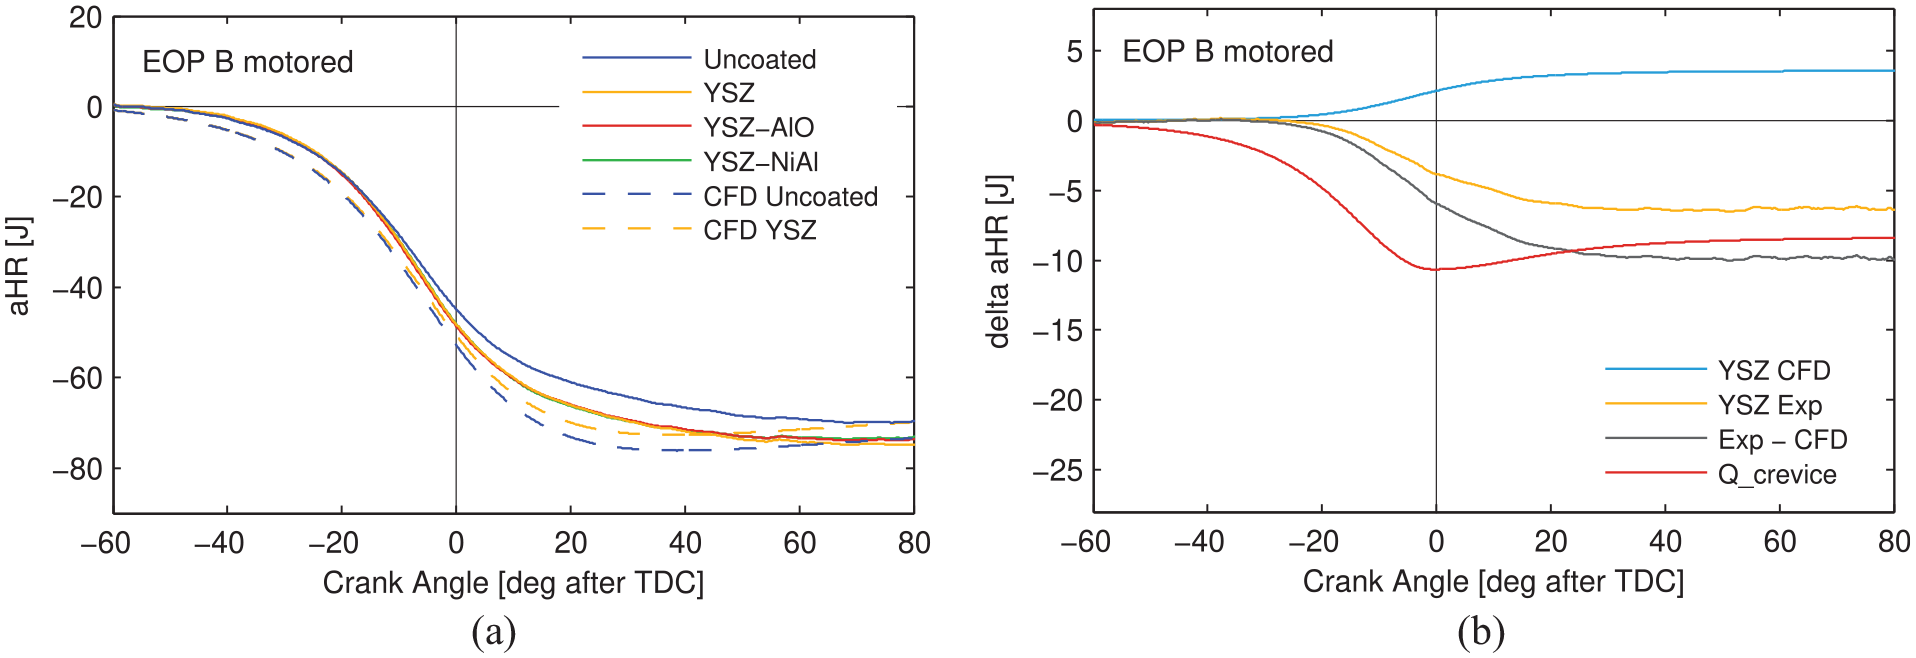
Measured and simulated aHR for motoring conditions. Absolute levels in (a), levels relative to uncoated piston in (b).
The yellow dashed line shows the simulated aHR for the piston with surface properties of the unsealed YSZ coating showing a heat loss reduction compared to simulation for the uncoated piston. Unexpectedly, in the experiments, the heat loss for all coated pistons (their curves are on top on each other in the figure) has increased with about 5–7 Joule. And this result aligns with the heat loss to the piston cooling oil, as shown in Figure 24. The increase of heat loss to the piston cooling oil is about 2 J for the total cycle. This is about one-third of the heat loss calculated from the cylinder pressure, which can be explained by the fact that not all of the heat flux into the piston goes to the piston cooling oil, part of the heat is transferred directly to the liner and to the in-cylinder charge during gas-exchange.
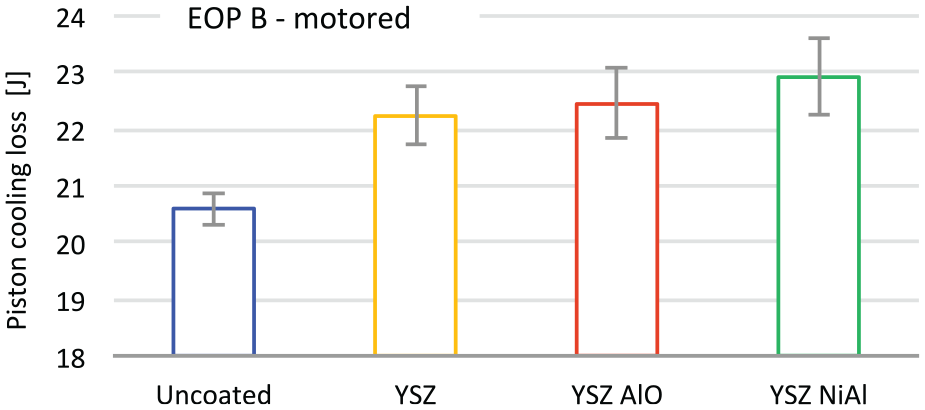
Measured heat losses for one engine cycle to the piston cooling oil for motoring conditions of EOP B. Error bars show the 95% confidence interval.
In Figure 23(b) the effect of a theoretical crevice loss is compared to the magnitude of the heat loss for the unsealed coated piston, in a similar manner as for the case with combustion. The light blue line shows the theoretical effect of the insulation without porosity (CFD). The yellow line is the measured increase in heat loss relative to the uncoated piston. The gray line represents the extra heat loss to explain the measured heat loss in the presence of an insulating layer. The final value of the predicted heat loss from the crevice model is very close to the total heat loss in the presence of an insulating coating. However, there is a difference in early development, the theoretical crevice loss occurs much earlier and shows a small recovery after peak cylinder pressure which is not seen in the experiment. The fact that all coated pistons show the same increase in heat loss indicates that surface roughness does not play a major role for the motoring case. The same can be said for the presence of the sealing layers.
Discussion
Fired operation
The experimental results show a reduction of peak cylinder pressure in the presence of the evaluated coatings. More detailed analysis reveals a significant reduction of the apparent rate of heat release just after TDC and recovery of the aRoHR after the maximum cylinder pressure has occurred. This observation has been reported from multiple investigations on APS YSZ based thermal barrier coatings.25,43,44 Comparison with CFD simulations shows that the relative drop of aRoHR coincides with the start of jet-wall interaction. CFD simulations for a coated piston (without sealing) show less heat loss and an increase in IMEP of about 1%, while the experiment shows a reduction in IMEP of about 0.4%. Combining the results from a 0-D crevice model with results from CFD predicts the magnitude of the observed deviation of aRoHR in the experiments with the non-sealed coating relatively well. The 0-D crevice model predicts increased losses from heat transfer and entrainment of partly burned fuel upon jet-wall contact during rising cylinder pressure. When the cylinder pressure drops, trapped fuel is released back to the combustion chamber. In this phase, heat losses to the piston are reduced compared to the uncoated piston due to the insulating coating. The late burning of released fuel and reduced heat loss with insulation coating during expansion could explain the observed recovery of the apparent rate of heat release. Similar conclusions were made by Andruskiewicz et al. 45 applying a crevice model to an SI engine with plasma sprayed TBC.
In the comparison between experimental and simulation results for fired operation, the CFD model over-predicted insulation of the coating or under-predicted the heat loss caused by the secondary effects introduced by thermal barrier coatings. Predicting heat transfer of an impinging jet with combustion CFD and RANS is challenging, and the simulation does not include effects of radiation, convection vive nor surface roughness. However, it is unlikely that surface roughness is a major contribution to the increased heat loss: the metal sealed coating with similar surface roughness as the uncoated piston still shows the typical dip and recovery of the aRoHR compared to the uncoated piston.
Measurement of heat flux to the piston cooling oil reveals that the net heat loss for the complete engine cycle to the coated piston is reduced by about 10%. However, the porosity in the coating absorbs heat and fuel when conversion efficiency from heat to work is at its highest, shortly after TDC, resulting in a significant reduction of indicated efficiency. The crevice effect from permeable porosity might be one of the reasons why plasma sprayed YSZ, developed for gas turbine applications working at constant pressure, does not perform as well in internal combustion engines with intermittent combustion.
Motored operation
The motored case provides an opportunity to study the performance of the coatings in an environment without combustion and associated effects on heat transfer. Radiation or temperature stratification can be neglected and there is no fuel entrainment, no convection vive nor soot deposits. Turbulence levels are low, reducing the effect of surface roughness on heat transfer. The results were counter-intuitive: the coated pistons experienced a higher heat loss under motoring conditions than the uncoated reference piston. This result was obtained with two independent measurement methods. As for fired operation, CFD simulation predicted a heat loss reduction for the coated piston without sealing, due to its low thermal conductivity. The discrepancy between experiment and simulation with CFD could be explained by the 0-D crevice model.
The predicted and measured heat loss are very close for the motored case, the difference is only 7%. The CFD simulation method is more accurate for motoring flow conditions and there are no other effects than convective heat transfer and proposed crevice effects. The curves for the accumulated heat loss in Figure 23(a) differ somewhat in shape, the predicted heat loss drops a bit faster. This difference originates in the CFD model where the equation of state for ideal gases is used. As no other effects are present and CFD can give accurate predictions for the motoring conditions, the results from the motoring case present strong evidence for the crevice effect in the tested thermal barrier coatings.
The magnitude of heat loss was predicted well, but the phasing of the predicted heat loss is earlier than measured in the experiment. The phasing difference of the heat loss might be explained by the simplicity of the crevice model, not accounting for flow losses and thermal dynamics in the coating. The heat loss from the metal sealed coating with low surface roughness was as high as for the unsealed coating, indicating that surface roughness was not a significant factor. The motoring case provides strong evidence for the crevice effect from the permeable porosity in the thermal barrier coating.
Surface sealing
Sealing of the plasma sprayed porous coating with the purpose of preventing hot charge from entering the coating was unsuccessful. Both the nickel based and ceramic sealing layer probably lost most of their sealing function during the experimental investigation. However, some interesting observations related to the crevice effect were made:
Engine out emissions of CO were elevated in the presence of the ceramic and metal sealing layer, most for the metal sealing layer. Also HC emissions were raised with the metal sealed coating for EOP B and C. An explanation for this behavior could be increased flow resistance for charge flowing in and out of the “partly” sealed coatings. A late release of HC and CO from the coating, caused by a restricted outflow, would provide less favorable conditions for oxidation of these species as charge temperatures drop late in the expansion stroke. The increased levels of CO and HC would in that case be evidence for entrainment of partly burned fuel in the coating. The emission levels were highest for the piston coating with the metal sealing layer, which would correlate with the more intact sealing surface and therefore higher flow resistance.
With respect to impact on the aRoHR and overall heat loss, the coating with the ceramic sealing layer behaves quite similar as the coating without sealing layer. The many cracks in the surface make the surface nearly open, the surface roughness and material properties are close to the base coating material.
The metal sealed coating behaves differently. The dip and recovery of the aRoHR are smaller compared to the other two coatings. The crevice effect might be reduced as the metal sealing seems more intact. However the heat loss for the whole cycle is higher with this sealing material. One reason for this could be that the metal sealing layer has higher thermal conductivity and lower temperature swing compared to the ceramic sealing and YSZ coating. One more difference is the low surface roughness of the metal sealing. High surface roughness can increase heat transfer and delay combustion with a similar effect on the aRoHR as the crevice volume in the coating.24,25 This could also be an explanation for the different behavior of the aRoHR, however, it does not explain the higher total heat loss. And the fact that with a low surface roughness, similar to the uncoated piston, the deviation in the aRoHR remains, although reduced in magnitude, shows that the crevice effect is likely to be the main cause for the deviation of the aRoHR.
Limitations
The model used for the simulation of the crevice effect in the porous coating, including the input boundary conditions, is rather simplified. Heat transfer occurs instantaneously, there is no flow resistance nor transport of heat or mass within the coating. The coating temperature is assumed to be homogeneous and constant. Fuel burns immediately upon release from the crevice. The input boundary conditions from the model are averaged over the coating surface, data coming from CFD simulations. But despite its simplicity, the crevice model seems to predict the magnitude of the crevice heat loss and fuel entrainment rather well. However, the phasing of the simulated heat loss and fuel penetration does not match the experiments as well. A more detailed model would be needed to capture the dynamics of mass flow and spacial heat transfer in the coating to give better predictions.
Future work
From the results presented in this paper one might conclude that permeable porosity should be avoided, as it increases heat losses and delays combustion. On the other hand, porosity reduces thermal conductivity and heat capacity of a coating, which improves temperature swing capability. One way to solve this dilemma is to seal the coating surface.28,30 A problem with this solution, apart from durability issues, is that sealing layer materials tend to have less favorable temperature swing properties than the underlying coating material itself, thereby reducing the coating effectiveness. Another solution is to create a thermal barrier coating with closed porosity, where the pores are not interconnected. 46 Some promising work using small hollow spheres has been performed in this direction.47,48
However, there is a material with open porosity that has shown good insulating properties in internal combustion engines: soot.22,26,32 Thermal conductivity of carbon itself is rather high, but the high porosity of soot makes it a thermal insulator. Could there be a way to create a coating material with similar properties? What would the required properties of such a material be? One way to increase porosity in plasma sprayed thermal barrier coatings is to add porosity formers, which has been evaluated with engine testing showing promising results. 49 Further experiments with increasing porosity levels, combined with variations of coating thickness could show if there is a potential way forward in this direction.
Accurate modeling and simulation of high porosity coatings would require a more detailed approach compared to the simple crevice model presented in the current investigation. However, a high resolution model of the whole porous coating surface that captures flow losses as well as heat and mass transport inside the coating would be complex and require considerable calculation power and time. It is therefore proposed to detail only a small part of the coated surface and include it in a standard CFD model. The high resolution model would interact with the surrounding coarser model and exchange mass, species and energy at the common boundaries. Different surface locations in the combustion chamber can be studied: the jet impingement region, the squish surface, the bowl center, in between jets, etc. This model could be used to study and optimize coating properties such as thickness, porosity level, thermal conductivity and heat capacity for different regions in the combustion chamber.
Summary and conclusions
A state of the art thermal barrier coating of plasma sprayed yttria stabilized zirconia and two types of surface sealing were evaluated in a single cylinder light duty diesel engine. The purpose was to investigate the effect of permeable porosity on combustion and heat losses by analyzing the apparent rate of heat release and heat loss to the piston cooling oil. In addition to the engine experiments, simulations were performed to assess the theoretical effect of an insulating coating with CFD and to predict the effect of porosity using a 0-D crevice model. The main conclusions are listed here:
Permeable porosity of plasma sprayed thermal barrier coatings is a likely cause for increased heat loss and delayed combustion because the volume created by the pores behaves like a crevice volume. The large surface area of the pores in the coating allows for a fast and effective heat transfer between the entrained charge and ceramic insulation material. This might affect the insulation effectiveness of the thermal barrier coating significantly. Secondly, partly oxidized fuel that enters the coating from the near wall flame can become temporarily unavailable for further combustion, delaying the heat release.
A simple crevice model for permeable coating porosity can explain the observed reduction of the cylinder pressure and delay of the apparent rate of heat release for the tested plasma sprayed coating in this investigation. This crevice effect might be one cause for the poor performance of plasma sprayed YSZ coatings – widely used in gas turbine applications – in internal combustion engines.
The following observations support these conclusions:
Heat loss to the pistons with plasma sprayed coatings increased under motoring conditions. This was shown by two independent methods: analysis of cylinder pressure and measured heat flux to the piston cooling oil. The magnitude of the increased heat loss agreed well with the prediction from the 0-D crevice model for the porous coating.
Increased levels of CO and HC emissions were observed in the exhaust gas for the experiments with the sealed coatings, especially for the metal sealing layer. Sealing of the coating was not successful, cracks were visible in both the metallic and ceramic sealing layer. It is likely that the cracks would allow for a limited entrainment of partially burned fuel. A restriction in outflow could than lead to a late release of CO and HC from the coating, when circumstances for complete oxidation are less favorable.
Footnotes
Appendix
Acknowledgements
The authors wish to thank Mirko Bovo and Carolin Wang-Hansen from Volvo Cars Corporation for their support during the experimental work for this campaign, as well Prof. Nicolaie Markocsan, Dr. Mohit Gupta, Stefan Björklund and Wellington Uczak de Goes from University West in Trollhättan for application and material analysis of the thermal barrier coatings.
Declaration of conflicting interests
The author(s) declared no potential conflicts of interest with respect to the research, authorship, and/or publication of this article.
Funding
The author(s) disclosed receipt of the following financial support for the research, authorship, and/or publication of this article: This work was funded by the Swedish Energy Agency and the Combustion Engine Research Center (CERC) at Chalmers University of Technology in Gothenburg, Sweden.