
Abstract
Gasoline compression ignition (GCI) is a promising strategy to achieve high thermal efficiency and low emissions with limited modifications to the conventional diesel engine hardware. It is a partially premixed concept, which derives its superiority from higher volatility and longer ignition delay of gasoline-like fuels combined with higher compression ratio typical of diesel engines. The present study investigates the combustion process in a GCI engine operating with different injection strategies using computational fluid dynamics (CFD). Simulations are carried out on a single cylinder of a multi cylinder heavy-duty compression ignition engine, which operates at a compression ratio of 17:1 and an engine speed of 1038 rev/min. Two different injection strategies viz., late injection (LI), and early pilot injection (EP) are investigated to understand their impact on combustion and performance of the engine. Renormalized group (RNG) k-ε model is used to describe in-cylinder turbulence and KH RT model is used to simulate the fuel spray breakup. The developed CFD methodology is validated against relevant experimental data under a wide range of operating conditions for each injection strategy. The developed CFD methodology was found to capture the engine combustion behavior quite well. Based on the validated CFD model, the differences in the progress of combustion event for the two injection strategies is highlighted. It was found that a larger pilot fuel mass fraction results in a steeper rise in the initial heat release rate which in turn influences the transition to mixing controlled combustion. In line with the experimental data, the study showed that the late pilot injection strategy with three injection pulses, results in higher performance compared to the other conditions.
Introduction
Improving thermal efficiency and reducing harmful emissions has been the goal of the worldwide engine research community for several decades. Depleting fossil fuels, stricter emission norms imposed by various regulatory agencies to reduce environmental pollution, health concerns, etc. are some of the most important factors that are driving modern engine research. Several advanced combustion concepts are being evaluated in the internal combustion (IC) engines with an aim to achieve high efficiency and low emissions simultaneously. However, the conventional spark ignition (SI) and compression ignition (CI) engine concepts form the basis of most of the modern IC engine combustion concepts. Even after a century’s progress in the field of IC engines, these concepts remain relevant because of their attractive features.
SI engines traditionally operated on homogeneous fuel air mixtures, which eliminated the problem of soot emissions, but their thermal efficiency is limited by end-gas auto ignition and knocking. 1 Conventional CI engines operating on diesel fuel have high thermal efficiency, but they suffer from high soot emissions and NOx due to heterogeneous fuel air mixtures and high combustion temperatures. 2 In order to achieve the best of both combustion modes, several advanced concepts like homogeneous charge compression ignition (HCCI)3,4 reactivity controlled compression ignition (RCCI)5–7,gasoline compression ignition (GCI),8,9 partially premixed combustion (PPC),10,11 etc. have been proposed in the literature. All these combustion strategies fall under the broad umbrella of low temperature combustion (LTC) concept. HCCI concept, which has been investigated since 1970s12,13 achieves homogeneous mixtures by injecting the fuel directly into the combustion chamber much before the start of combustion, typically during the intake stroke. Fuel’s chemical kinetic behavior controls the combustion phasing. This concept of combustion with a lean homogeneous fuel-air mixture is attractive from a thermodynamic viewpoint because of the near constant volume combustion, which results in high thermal efficiency and ultra-low NOx and soot emissions. HCCI combustion concept with multiple fuels has been researched for several decades with little success because of the difficulty in controlling its combustion timing, which is entirely driven by the chemical kinetics, thus limiting its operation to low loads.13–18 PPC combustion concept allows for more control over the start of combustion compared to HCCI through a fuel injection event. This concept overcomes the traditional NOx-soot trade-off, however, using diesel fuel, it is required to use exhaust gas recirculation (EGR) rates in excess of 70%, which places high demand on the air handling system. 19 Kalghatgi et al. 20 suggested that the gasoline-like fuels are more suitable with PPC combustion due to its longer ignition delay, however, this also required around 50% of EGR, which increases pumping losses. In RCCI combustion concept a low reactivity fuel is injected through the port to create a homogeneous mixture. Sequential auto ignition is achieved by injecting a high reactivity fuel, such as diesel, directly into the combustion chamber in multiple pulses, which reduces the peak pressure rise rates compared to HCCI.21,22 Hanson et al., 23 under the Super Truck-I program, applied adaptive injection strategies to the dual fuel mode by combining the kinetically controlled and mixing controlled combustion to achieve high loads while keeping the noise within acceptable limits. Peak BTE of 47.6% was demonstrated at 2.0 MPa brake mean effective pressure (BMEP) and 1200 rev/min using natural gas and diesel without waste heat recovery (WHR) or engine architecture upgrades. The main drawback of RCCI combustion is the dual fuel concept requiring two individual fuel storage and supply systems increasing the overall maintenance cost and complexity. GCI combustion concept is similar to that of conventional CI engines, except that the diesel fuel is replaced with gasoline. The injection timing controls combustion phasing; however, the fuel could be injected earlier than in the diesel CI engines, owing to the low reactivity and longer ignition delay of gasoline fuel. These properties of gasoline allow desired stratification levels in the combustion chamber. Most of the LTC concepts presented above, show a heavy dependency on the air handling systems, that is, the EGR loop and charge boosting devices, to improve efficiency and reduce emissions.9,24 In order to bypass the reliance on air handling system, Wang et al. 9 studied different injection strategies with relatively high temperature combustion (without EGR or with only small amount of EGR) in a multi cylinder GCI engine under the Super Truck-II program. EEE gasoline with a research octane number (RON) of 97 was used for this study. The injection strategies were based on mixing-controlled compression ignition ranging from moderately premixed to diesel-like mixing limited combustion processes. 24 Peak brake thermal efficiency (BTE) of 46.1% was achieved for the late injection strategy which is comparable with diesel engine efficiency (45.9%).
Computational fluid dynamics (CFD) plays an important role in the modern engine design. A reliable CFD model (i.e. a model that is thoroughly validated against the experimental results at critical design points) can predict the engine performance over a wide range of operating conditions without the need to conduct costly experiments in the process of designing efficient engines. Many studies in the recent past have performed engine optimization campaigns based on a predictive computational models.25–28 The present study focuses on developing a computational methodology that can predict the combustion and performance behavior of a high efficiency GCI engine over a range of injection strategies which can be used further to perform engine optimization studies. As a part of Super Truck-II program, experiments were conducted on MY2010 Navistar MaxxForce 13 six-cylinder heavy-duty diesel engine23,29,30 at several injection strategies at Argonne National Laboratory. 9 This paper aims at presenting the development of a computational methodology to mimic the engine behavior at different injection strategies. In addition to this, the effect of pilot mass fraction and the injection timing on the engine behavior is also explored. It was observed that the timing and quantity of pilot fuel dictates the rate of pressure rise and the initial magnitude of the heat release rate (HRR). Further, the initiation and the progress of the combustion event for different injection strategies are compared. Earlier injection of pilot fuel mass fraction was found to enhance mixing, but the combustion occurs closer to the liner which requires larger fuel quantity in the pilot injection pulse to avoid possible quenching. On the other hand, the absence of the pilot injection pulse resulted in a very high pressure rise rates due to longer ignition delay times of gasoline fuel. Finally, this paper provides a detailed discussion on the engine combustion behavior at early and late pilot injection strategies.
This paper is organized in the following way: First, a brief description of the engine specifications and the experimental setup is presented. Then, the details of the CFD methodology, meshing strategy, boundary conditions, properties of fuel surrogate and the CFD sub models used in this study are highlighted. The combustion and performance characteristics of the engine at different injection strategies as predicted by the CFD simulations are compared with the experimental results. Then, the effect of pilot mass fraction on the combustion behavior for different injection strategies is presented. This study also validates the CFD methodology at different injection timings at a few chosen conditions. Finally, some of the important conclusions from this work along with the scope for future research is presented.
Engine geometry and specifications
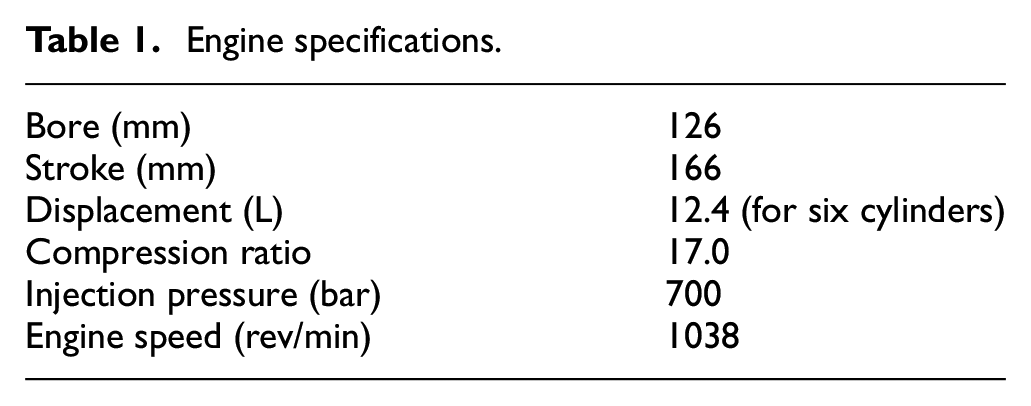
The test engine used in the present study is a MY2010 Navistar MaxxForce 13 six-cylinder heavy-duty diesel engine. 9 CFD simulations were carried out on a single cylinder of the engine. Figure 1(a) shows the engine geometry. Figure 1(b) and (c) show the schematic of the location of fuel injector with respect to the cylinder head, used in this study, as well as the schematic of the spray pattern. Table 1 shows the specifications of the engine. 9 Fuel was injected into the combustion chamber using a Bosch 9-hole fuel injector that was placed centrally on the cylinder head. Tier II EEE gasoline with RON 97 and MON 89 was used as test fuel in the present study. The density of the test fuel is 743 kg/m3 and lower heating value (LHV) is ∼43 MJ/kg. A comparison between the properties of test fuel and the surrogate used in this study is shown in the next section.
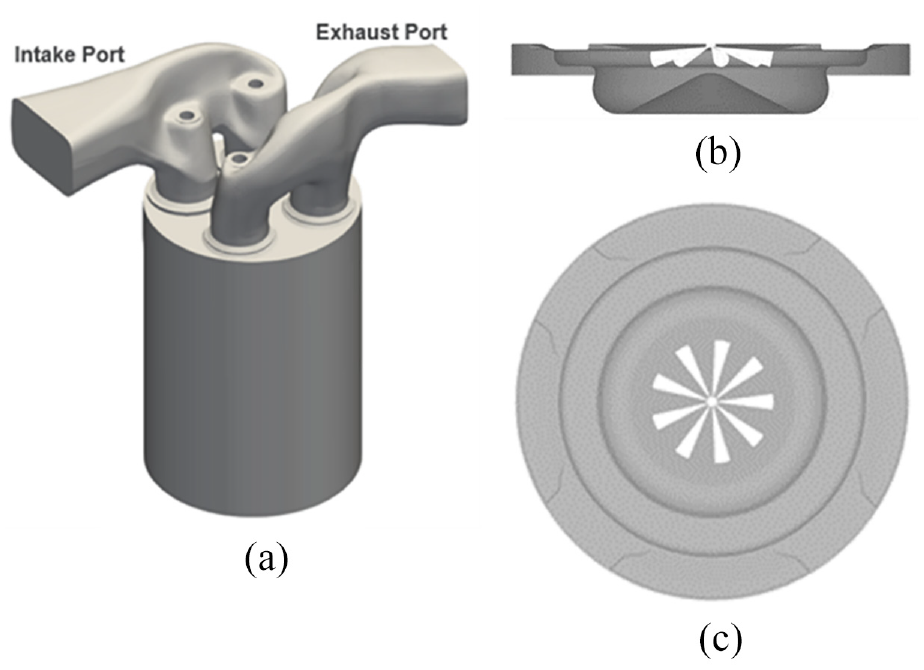
Engine and piston geometry: (a) engine geometry, (b) piston cut section, and (c) piston and injector schematic.
Engine specifications.
Experimental set up
The SuperTruck engine features an air system configured for high thermal efficiency, utilizing a single stage turbocharger and a dual-pass EGR cooler with high- and low-temperature stages. A prototype variable geometry turbine (VGT) turbocharger was implemented to decrease pumping losses compared to the original equipment manufacturer (OEM) two-stage system. The stock low-pressure EGR system was utilized maintaining the stock EGR cooler. With the EGR valve fully closed, the EGR ratio was below 1% (production valve leakage). A building process water system was used for cooling the heat exchangers in the high- and low temperature engine coolant loops and to directly cool the high-pressure charge air cooler. Cooling systems were tuned using Navistar internal metrics to mimic heat rejection available in a production vehicle. Intake and exhaust restrictions were likewise adjusted to simulate vehicle air filtration systems along with exhaust aftertreatment and muffler restrictions. Constant restrictions were used across all tested conditions. In addition, the engine employed a production-intent prototype variable valve actuation (VVA) system developed by Jacobs Vehicle Systems (JVS) 31 to control the closing timing of the intake valves. The VVA system had been used in previous gasoline–diesel dual-fuel tests to study the effect of effective compression ratio. 30 The prototype pistons feature a higher than stock compression ratio, and a 250 MPa capable common-rail fuel injection system was used with prototype injectors. Reported start of injection (SOI) timing was determined from the engine control unit (ECU) command and not directly measured from injector current. Low-speed measurements of engine operating parameters, including temperatures, pressures, emissions, and fuel flow, were logged at 10 Hz. Fuel flow rate was measured with Micro Motion CMFS010 Coriolis-type flowmeters. The airflow rate was measured using a laminar flow element. Gaseous emissions were measured using a standard five-gas analyzer (Horiba MEXA-7100DEGR), which includes CO2 measurements in the intake for EGR calculation. An AVL 415 Smoke Meter was used for soot emissions measurements.
Injection strategies
In this study two injection strategies, viz., late injection (LI) and early pilot (EP) were analyzed using CFD. As the names indicate, all the injection pulses are close to TDC for the LI strategy whereas the pilot injection takes place relatively earlier for the EP strategy. Under LI strategy, three sub strategies viz., pilot-main-post (Pi-M-Po), pilot-main (Pi-M) and main-post (M-Po) were studied, which differ from each other based on the timing and mass split of injection pulses. 32 Furthermore, a set of simulations were also performed under the Pi-M-Po strategy, by sweeping the injection timing. Similarly, under EP strategy, a set of simulations with varying pilot fuel mass fractions and varying injection timings were performed. A comparison between the two strategies is presented in the results section. Figure 2 shows the sample injector current signals for the two injection strategies presented in this study.
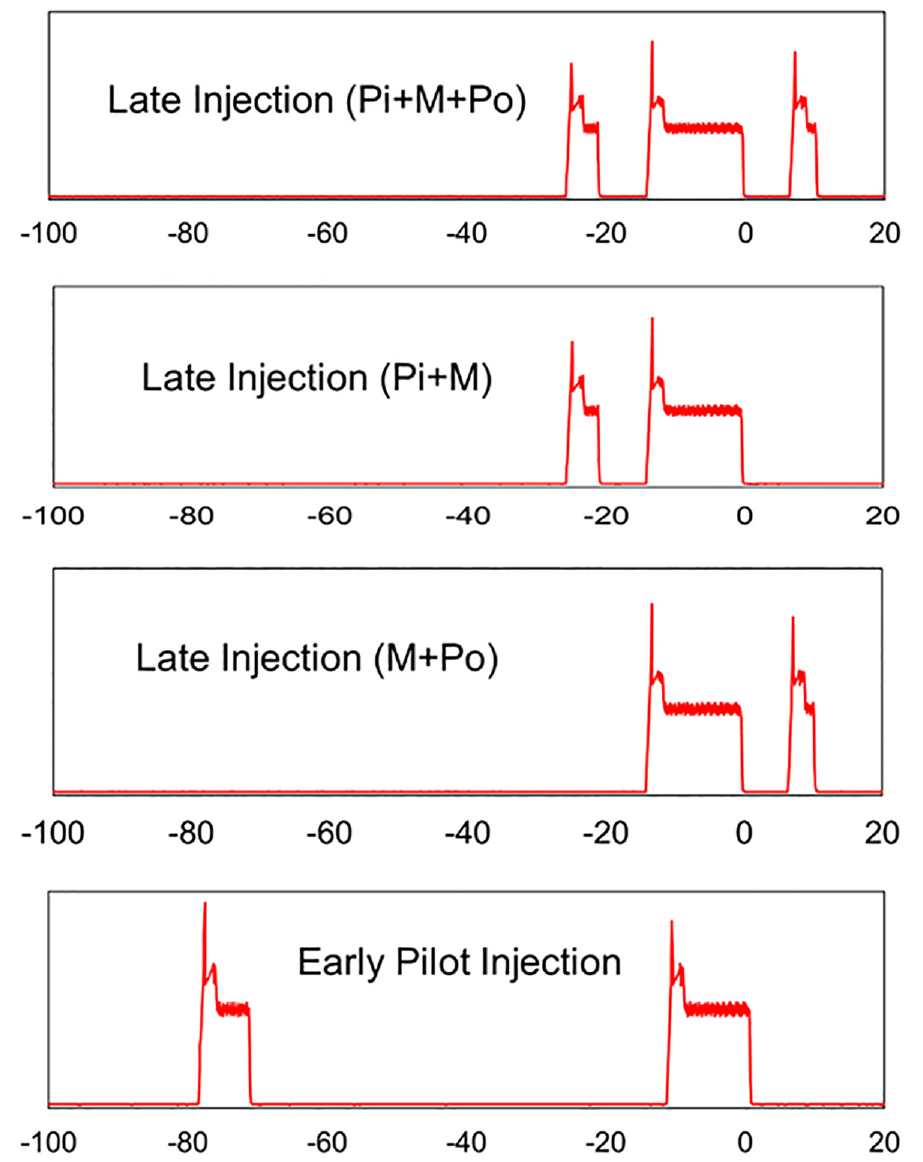
Injector current signals for different injection strategies.
CFD methodology
The commercial CFD software CONVERGE (Version 2.4.19) was used to carry out the CFD simulations in this study. 33 Structured Cartesian grid is generated at every time step automatically during run time. A base mesh size of 4 mm was used. In the cylinder region, the grid was embedded permanently to a level of 2 which changes the grid size in these regions to 1 mm. Further, the grid was refined in the regions of fuel spray during the fuel injection event to a size of 0.25 mm. The adaptive mesh refinement was also used to capture the gradients of velocity and temperature. The maximum cell count in the domain was ∼2.5 million. Figure 3 shows the mesh refinement due to fixed embedding around the spray plumes as well as the adaptive mesh refinement (AMR) in the computational domain. An adaptive time-stepping strategy was used, which varies the time step between 10−7 and 10−9 s primarily based on Courant Friedrichs and Lewy No. (CFL) number. Initially, a simulation was carried out for three consecutive cycles, and it was found that the cycle-to-cycle variation was negligible. Consequently, all CFD simulation results presented in this paper are shown for one cycle only.
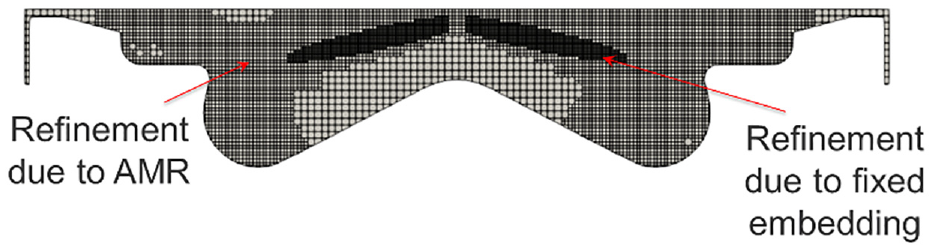
Computational mesh on the central plane at TDC.
CFD models
CONVERGE includes sub-models for turbulence, spray, drop dynamics and combustion. Fuel injection was modeled using the “Blob” injection model of Reitz and Diwakar, 34 which assumes that the characteristic size of the injected liquid “parcel” is equal to the effective nozzle size. Primary and secondary atomization was represented as a competition between the Kelvin Helmholtz (KH) and Rayleigh Taylor (RT) instability mechanisms. 34 Drop-drop interactions were represented using the No Time Counter (NTC) collision method of Schmidt and Rutland. 35 Dynamic droplet drag was modeled using Liu et al.’s model 36 while turbulence dispersion of the droplets was represented using O’Rourke’s model. 37 Combustion was modeled using the well-stirred reactor 38 multi-zone model.39,40 Flow turbulence was modeled using RNG k-ε model. 41
The fluid flow was solved using the Navier Stokes equations for mass, momentum, and energy based on finite volume approach. The Rhie-Chow scheme was employed to store all the computed values at the cell center. 42 A second order accurate spatial discretization scheme was used for the governing conservation equations. The transport equations were solved using the Pressure Implicit with Splitting of Operators (PISO) method. 43 An adaptive time-stepping strategy was used limiting the size of time steps between 10−6 and 10−9 s based on the convective CFL number of 1.
In order to capture both RON and motor octane number (MON) of the test fuel, it was decided to use toluene primary reference fuel (TPRF) as a surrogate for the test fuel. The composition of TPRF surrogate was arrived at by running an optimization loop in Microsoft Excel® to match the test fuel’s RON and MON. RON and MON of the fuel surrogate was calculated according to the method given in Morgan et al. 44 A second order linear by volume method described by Morgan et al. 44 has been used to calculate RON and MON of the surrogate fuel.
According to the method,
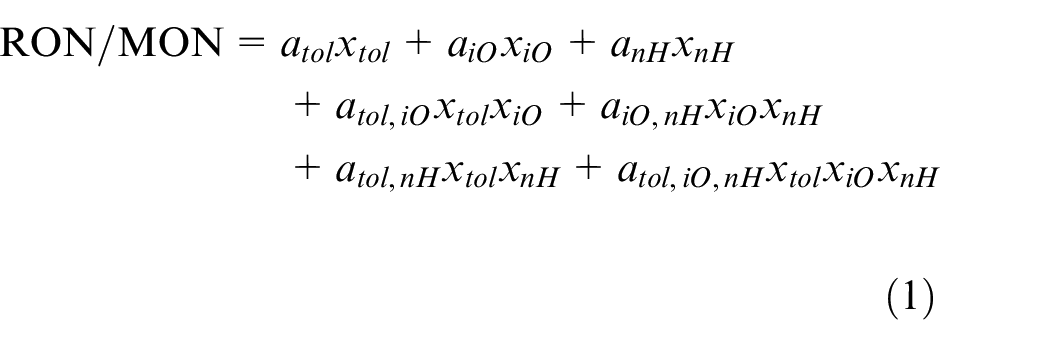
Where xtol, xiO, and xnH are the volume fractions of toluene, iso-octane, and n-heptane in the fuel surrogate. atol, aiO, and anH are coefficients for toluene, iso-octane, and n-heptane. atol,iO, aiO,nH, and atol,nH are the coefficients for the binary-interaction terms and atol,iO,nH is the coefficient for the ternary interaction term.
The coefficients used for the second order response surface models for RON, MON are (Table 2):
Coefficients of the terms in equation (1).
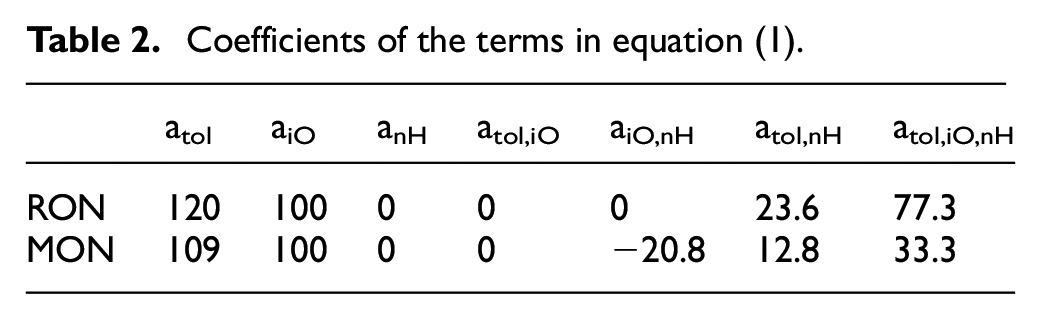
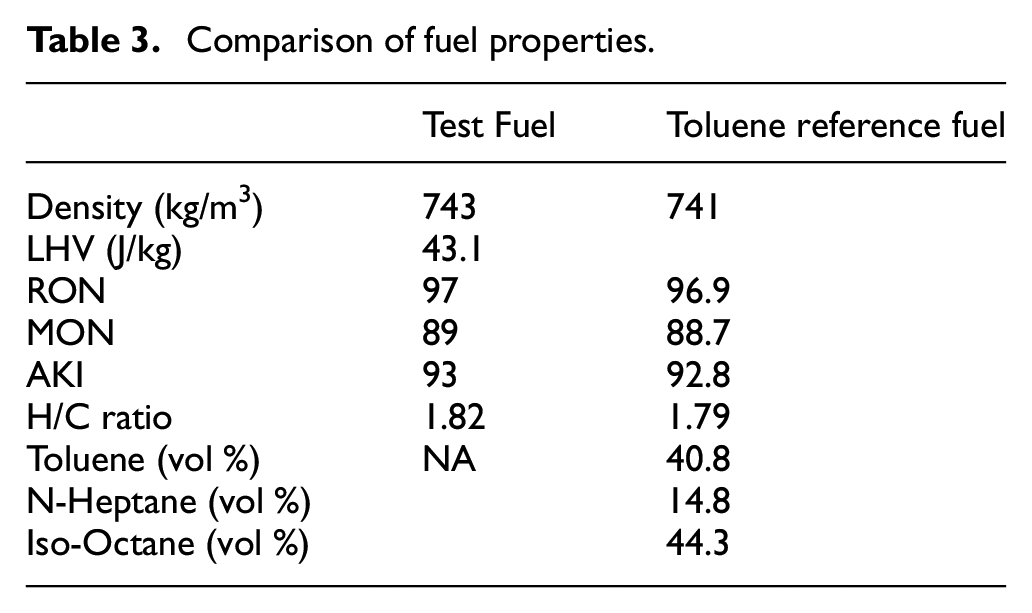
Table 3 shows the comparison between the test fuel properties and the properties of surrogates (TPRF) considered for this study. Yielding better agreement with fuel properties, all the CFD results shown in this paper were obtained with the TPRF fuel surrogate.
Comparison of fuel properties.
In this work, the performance of two chemical reaction mechanisms proposed by Liu et al. 45 (which has 56 species and 168 reactions) and Andrae et al. 46 (which has 138 species and 633 reactions) were compared for EP strategy. Based on this comparison, the mechanism that is better at capturing the chemical reactions at the start of combustion (Andrae’s mechanism as it will be shown later) was used to carry out CFD simulations with LI strategy.
Boundary conditions
Time resolved temperature and pressure conditions were obtained from 1D simulations for different injection strategies and used as boundary conditions at the inlet and outlet of the computational domain. Figure 4 shows the temporal variation of pressure and temperature at the inlet and outlet of the domain. In this study, piston, liner, and cylinder head were maintained at 560K, 500K, and 540K, respectively. The rate of injection of the fuel was obtained from the BOSCH constant volume chamber test set-up. The wall temperatures were reasonably chosen to minimize the error in the mass trapped between the simulations and the 1D data.
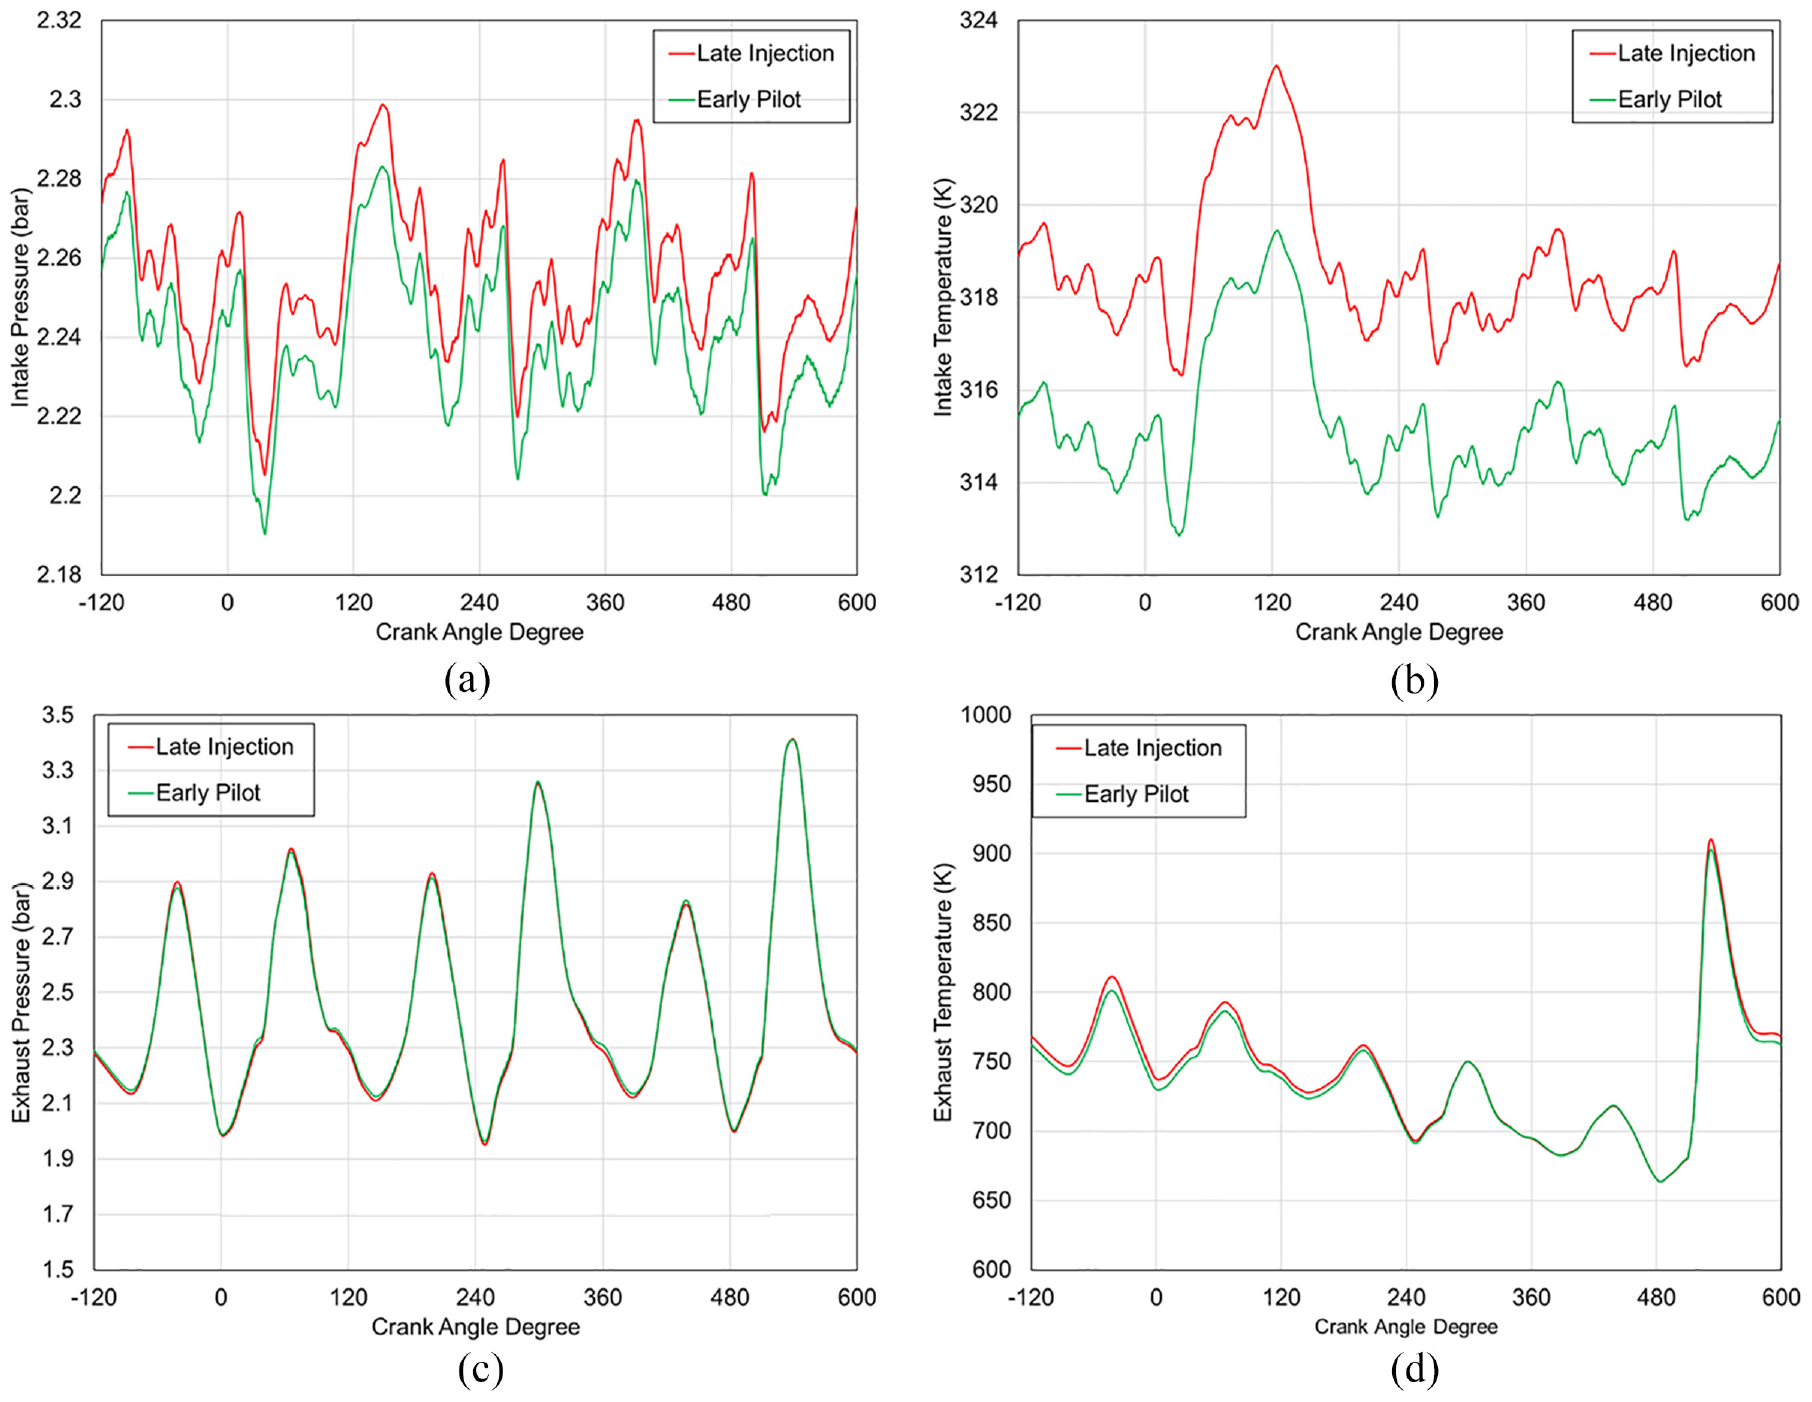
Pressure and temperature boundary conditions: (a) intake pressure, (b) intake temperature, (c) exhaust pressure, and (d) exhaust temperature.
Results and discussion
This section presents the comparison of combustion and performance characteristics between the experiments and simulations for different injection strategies. The comparisons were also made by sweeping the injection timings at selected conditions. As mentioned earlier, two chemical mechanisms were compared for the EP strategy in terms of their capability to predict combustion behavior. The present study also shows the progress of combustion for different injection strategies and highlights their differences.
EP strategy – Pilot injection mass fractions
In the present study, early pilot injection refers to the set of simulations with nominal pilot injection timing at −80 CAD. Earlier injection of the pilot fuel mass along with the longer ignition delays of gasoline is expected to enhance fuel air mixing before the start of combustion and increase thermal efficiency. In order to keep the pressure rise rate under control, the main injection timing is also varied for the current set of simulations. Table 4 shows the mass of fuel injected along with the nominal injection timings of different pulses for the cases considered. The pressure charts shown in the later sections highlight the actual injection timing. The difference between the actual and nominal injection timing corresponds to the hydraulic delay of the injector. It is to be noted that the nominal fuel mass injected for different cases mentioned in Table 4 is similar; however, it was observed that the indicated mean effective pressure (IMEP) (measured from the experiments) varied across different cylinders by as much as 4 bar for this strategy. Therefore, the actual fuel injected in the simulations is calculated by scaling the total fuel mass (for all the cylinders) with respect to the cylinder’s IMEP. This resulted in a variation of ±20 mg in the fuel injected across the cylinders. The uncertainty in the mass of fuel injected was found to result in some uncertainties in the combustion and performance characteristics. This section also compares the combustion characteristics for two chemical mechanisms for the EP strategy at different pilot injection mass fractions.
Injection timings of different cases in EP strategy.
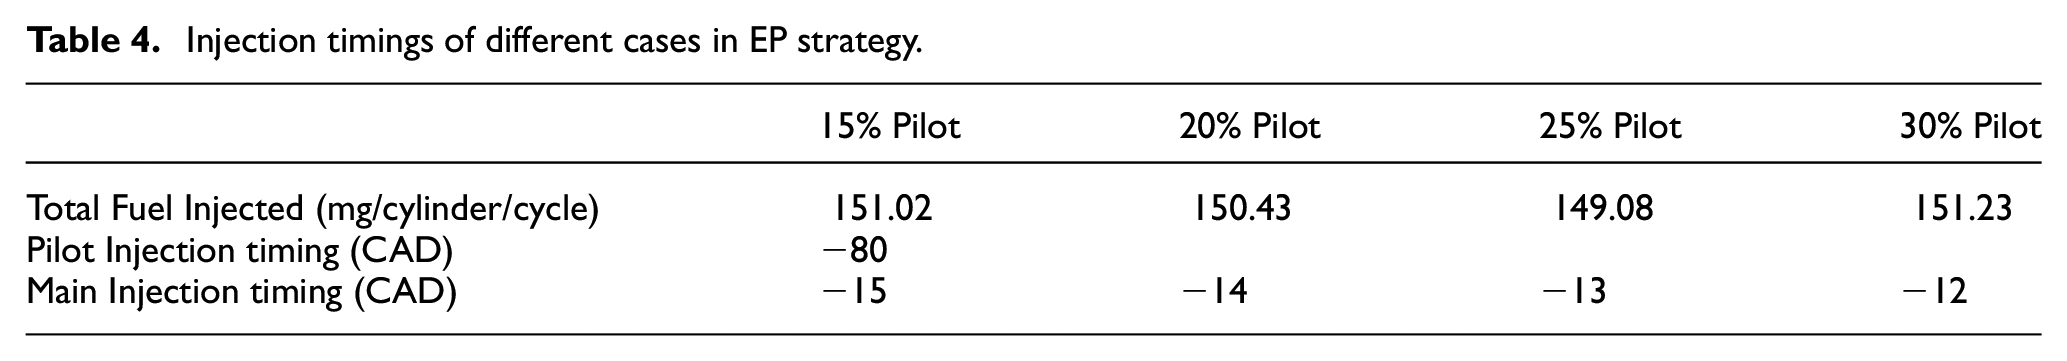
The cases considered under EP strategy are (i) four simulations with varying pilot fuel mass fraction (15% pilot, 20% pilot, 25% pilot (baseline case), and 30% pilot), (ii) four simulations with varying SOI of the main injection pulse. Two chemical mechanisms mentioned earlier were compared for the first set of simulations. The effect of uncertainties in the pilot mass fraction is also studied for 30% pilot case. For the EP strategy, the 25% pilot case was considered as the baseline case because of the availability of boundary condition data from 1D simulation data. The same baseline boundary conditions were used for the other pilot mass fraction cases. Therefore, it is expected that there are uncertainties in the mass trapped for the other conditions, which might result in slight discrepancies in the cylinder pressure during compression stroke.
Comparison of combustion and performance characteristics of different cases under EP strategy
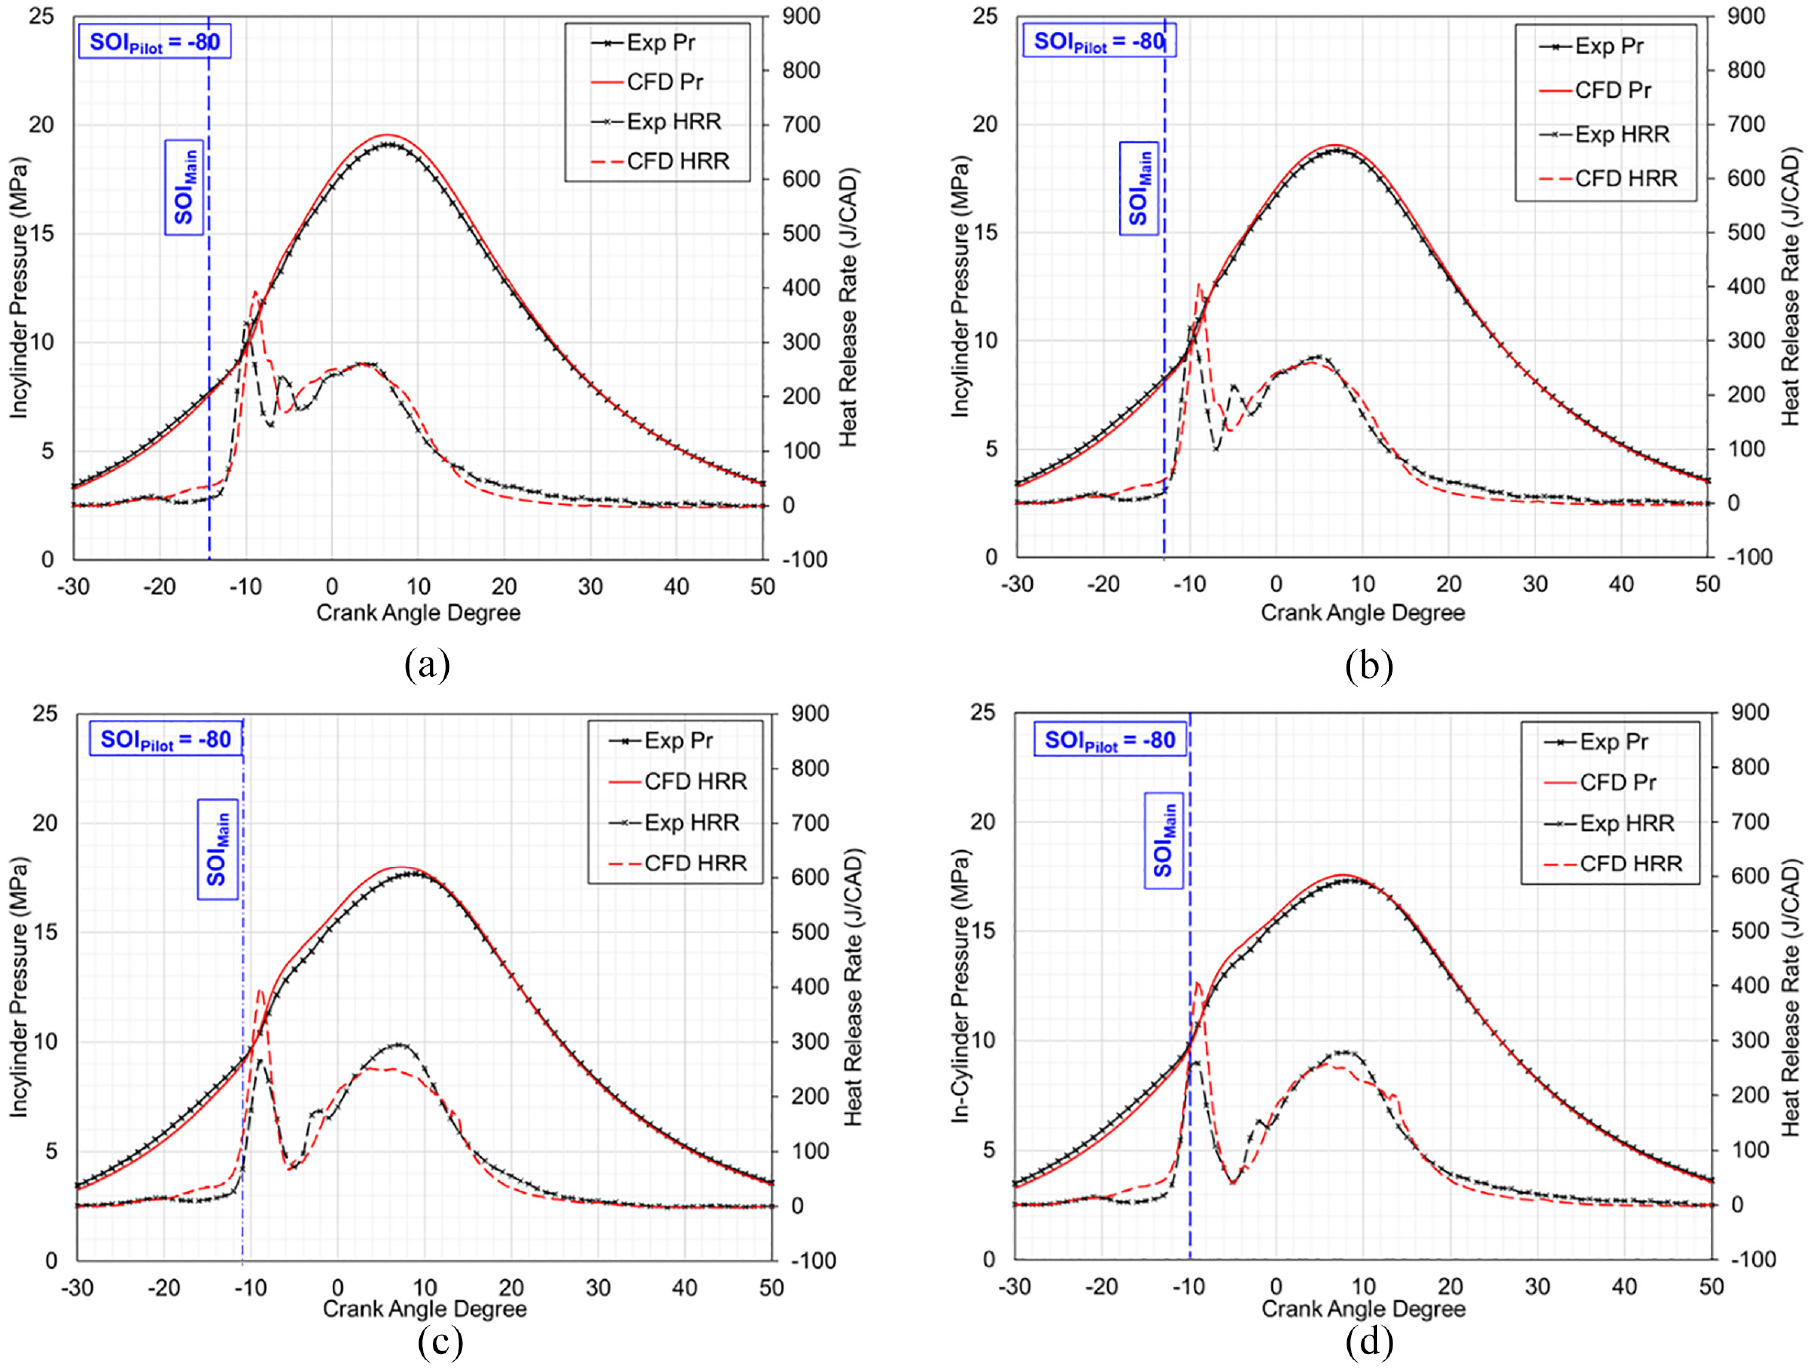
Figure 5 shows the comparison of the in-cylinder pressure and HRR for the EP strategy at different pilot injection mass fractions. In Figure 5 the black line represents the experimental results. In all the EP cases, the experimental HRR curve shows that there is a low temperature heat release at ∼−25 CAD. As the piston moves closer to TDC, combustion starts at around −10 CAD for different pilot mass fractions. The HRR curves for 15%, 20%, and 25% pilot mass fraction cases exhibit a dual peak behavior before the mixing-controlled combustion. The magnitude of the first peak is observed to increase with the increase of pilot mass fraction whereas the magnitude of the second peak decreases. At 15% pilot, the first peak of HRR is much shorter than the second peak, which is because of the combustion of leaner mixture formed due to early pilot injection (only 15% of the total injected mass). At 20% pilot, the first and second peaks of HRR curve are comparable to each other, whereas the magnitude of the first peak is larger than the second peak for the 25% pilot case. The first peak in the HRR curve is expected to be because of the pre-mixed combustion of fuel injected during the pilot injection, whereas the second peak is because of the pre-mixed combustion of a portion of the fuel injected during the main injection pulse. For 30% pilot case, the experimental results show a large (first) peak in the HRR curve, which is followed by the mixing-controlled combustion. The dual peak behavior before the mixing-controlled combustion is not observed in this case unlike the other pilot mass fractions. This is because of delayed main injection timing compared to the other cases.
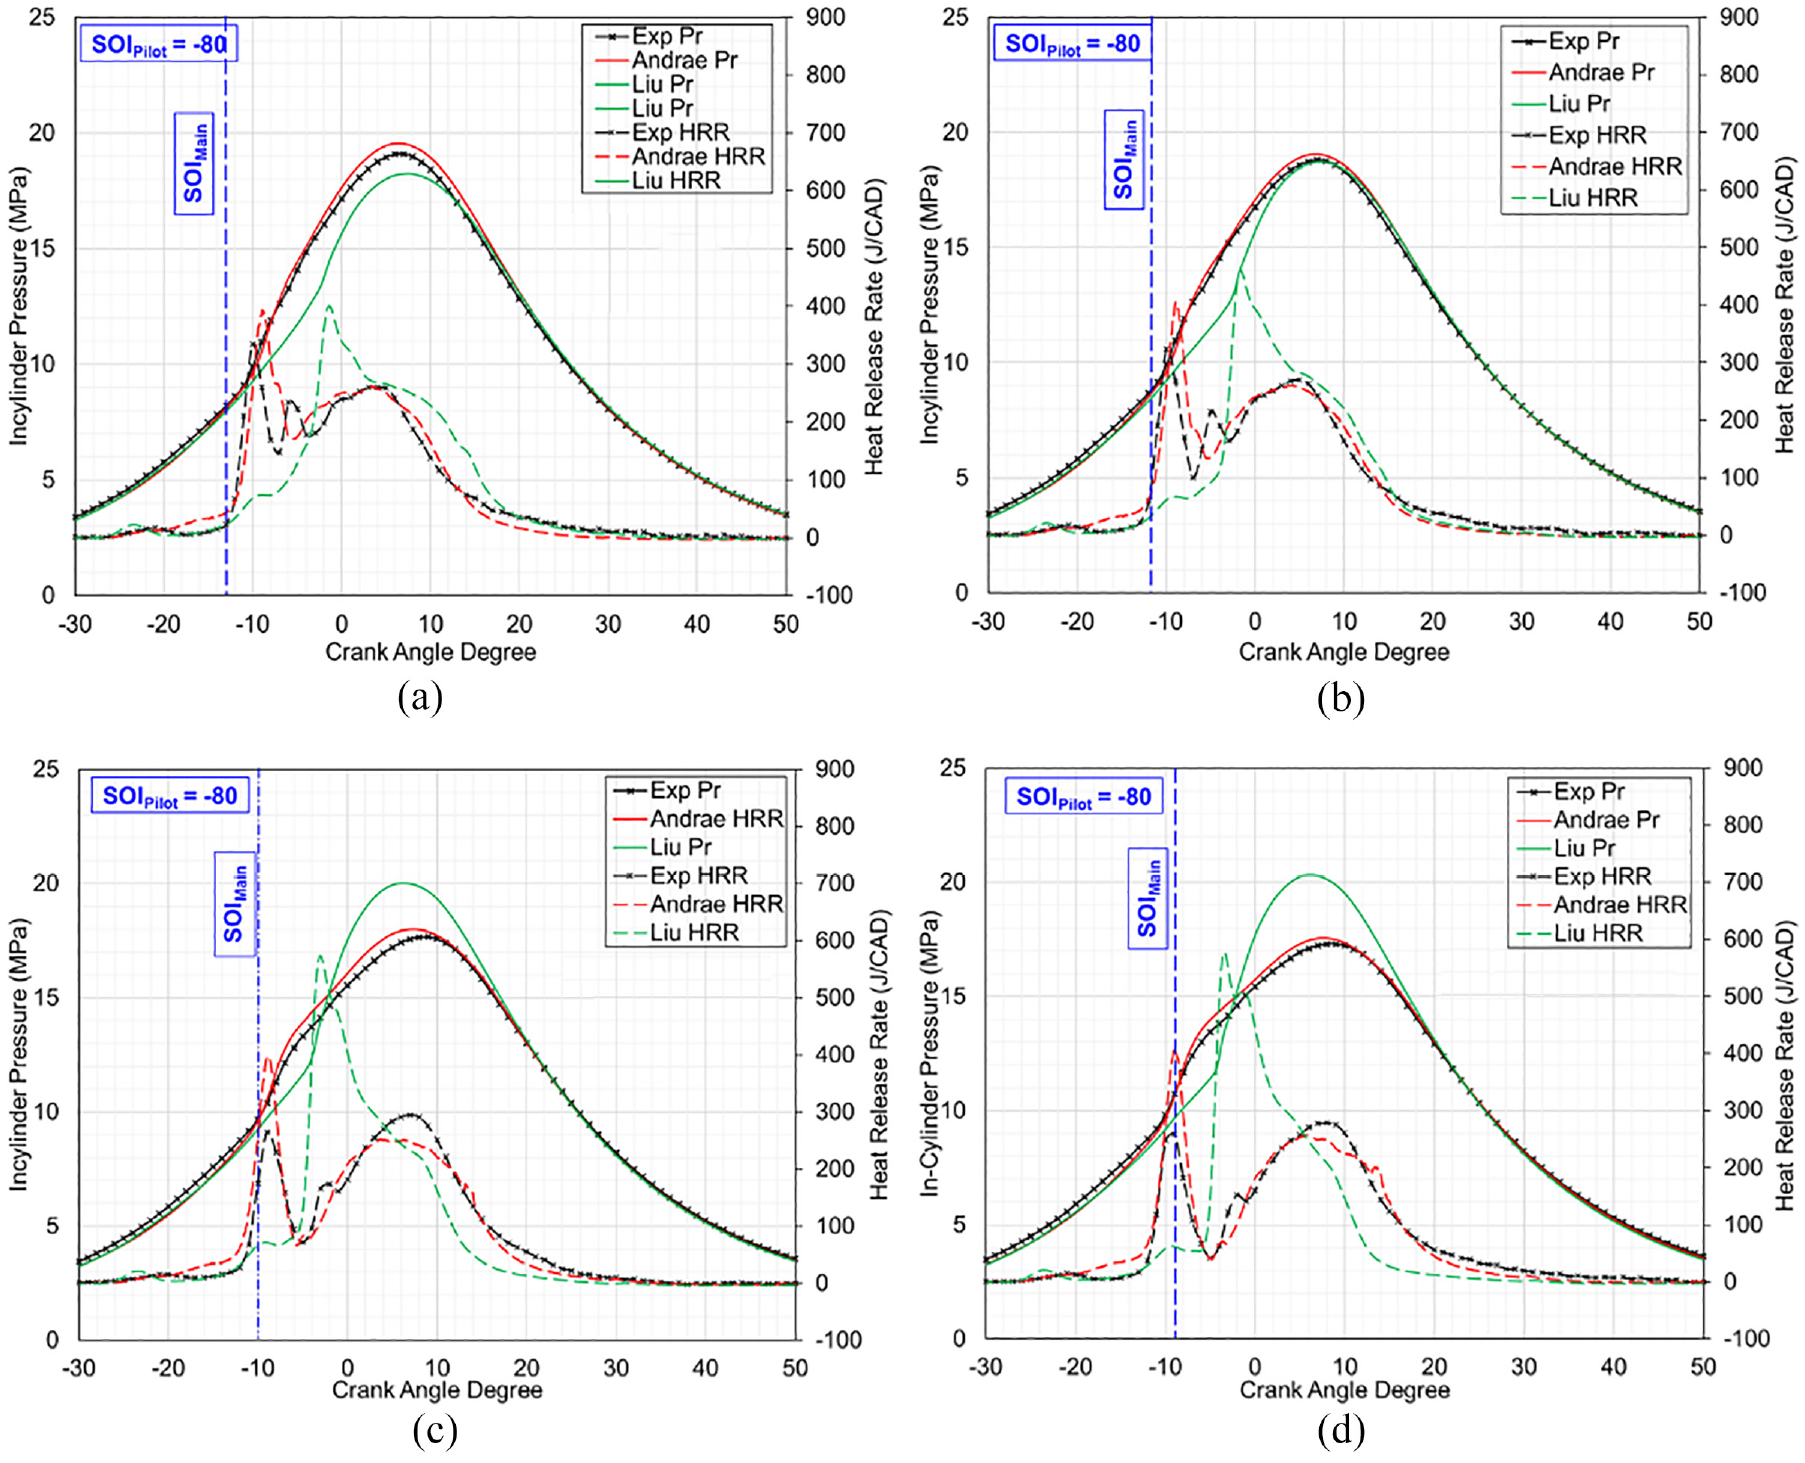
Comparison of In-cylinder pressure and HRR with experimental results for different pilot mass fractions of EP Strategy: (a) SOI-1, (b) SOI-2, (c) SOI-3, and (d) SOI-4.
In Figure 5, the red and green curves represent the results obtained from CFD simulations with Andrae and Liu mechanisms respectively. Both Liu and Andrae mechanisms show the low temperature heat release in all the cases. From Figure 5, it can be observed that the Liu mechanism consistently results in longer ignition delay, which allows accumulation of larger quantity of fuel in the combustion chamber, which evaporates and mixes better, before the start of combustion. This relatively larger quantity of fuel vapor participates in the pre-mixed combustion at a crank angle position that is relatively closer to TDC where the chamber pressure and temperature are also higher resulting in a higher heat release. It is interesting to note that Liu mechanism consistently shows single first peak as opposed to the dual peak behavior observed in the experimental results. It is also observed that the Liu mechanism predicts an earlier transition to the mixing-controlled combustion compared to the experimental results. It is also observed that the Liu mechanism predicts an earlier transition to the mixing-controlled combustion compared to the experimental results likely because of higher HRR at the end of premixed combustion. On the other hand, the Andrae mechanism captures the ignition delay and the start of combustion relatively well for all the cases compared to Liu mechanism. Consequently, the combustion parameters with Andrae mechanism have a better match with the experimental results compared to Liu mechanism.
At 15% pilot, the first peak is not distinctively observed with Andrea and Liu mechanisms; however, the larger second peak is captured well by Andrae mechanism. Similar to Liu mechanism, the transition to mixing controlled combustion starts at a higher HRR value for Andrae mechanism, however it happens at least a couple of crank angle degrees (CAD) earlier than Liu mechanism resulting in a lower magnitude of peak HRR during the mixing-controlled combustion.
At 20% pilot, the ignition delay is not captured by the Andrae mechanism accurately, although the dual peak behavior is visible before the start of mixing-controlled combustion. This is most likely because of the uncertainties in the fuel mass split across the pulses, which is evidenced by the fact that the mixing-controlled combustion duration is longer with both mechanisms at this particular pilot mass fraction. Most probably, the pilot mass fraction used in the experiments must have been slightly more than 20% of the total mass while the main injection mass must have been less than 80% of the total mass. This uncertainty might have caused longer ignition delay and slower combustion in the beginning (HRR curve in the beginning is not as steep as it is in the experiments) and longer mixing controlled combustion.
At 25% pilot, the combustion behavior is captured accurately by the Andrae mechanism. Both the dual peak behavior before the mixing-controlled combustion along with the magnitude of the peaks as well as the mixing-controlled part of the HRR curve are accurately reproduced. Consequently, the pressure curve is also reproduced accurately. However, the Liu mechanism shows a delayed first peak of HRR.
At 30% pilot, although the Andrae mechanism performs much better than the Liu mechanism, there is still a large gap in the slope of the first peak of the HRR curve. The premixed combustion is not reproduced accurately, although the mixing-controlled part is very similar to that of the experiments. However, the trend of the HRR curve is similar to that of the experimental curve. At this pilot fuel mass fraction, the simulations were found to deviate from the experimental trend, specifically in the premixed combustion phase. Apart from the uncertainties in the boundary conditions and mass split across the injection pulses, this deviation could also be because of the model’s limitations in estimating the wall heat transfer. As it is shown in the later section, the mixture is richer near the liner for higher pilot mass fractions and the auto ignition of relatively more quantity of fuel (because of higher pilot mass fraction) tends to happen close to the liner. This may lead to higher liner wall temperatures near the cylinder head, which in turn affect the heat transfer characteristics. As the present model uses a constant wall temperature boundary condition due to the lack of any relevant data from the experiments, it is expected to result in some discrepancy in the combustion characteristics. A variable wall temperature along the length of the liner or tuning of the heat transfer model itself may be required to fill in this gap which will be taken up in future studies.
Figure 6(a) to (c) shows the comparison of combustion phasing for different EP cases. For all the cases, Liu mechanism results in a delayed CA10 whereas Andrae mechanism predicts it more accurately compared to the experiments. The HRR curves shown in Figure 5 consistently support this trend at all the pilot mass fractions. CA50 is earlier for both the mechanisms (except for 20% pilot) compared to the experiments; however, it is much earlier for Liu mechanism. For 20% pilot case, Andrae mechanism shows a slightly delayed CA50 compared to the experiments. This might be because of delayed start of combustion for 20% pilot case as shown in Figure 5. Overall, Andrae mechanism predicts CA50 within an error of 0.5 CAD. Simulations predicted an earlier CA90 compared to the experiments, however, Liu mechanism shows a much faster combustion compared to Andrae mechanism. Figure 6(d) shows that the Andrae mechanism follows the experimental trends of IMEP and indicated thermal efficiency (ITE) more accurately compared to Liu mechanism. The Liu mechanism over predicts the IMEP by around 0.7–1 bar which results in approximately 2% difference in the ITE. Andrae mechanism predicts the IMEP within an error of 0.25 bar and ITE within an absolute error of ∼0.5%.
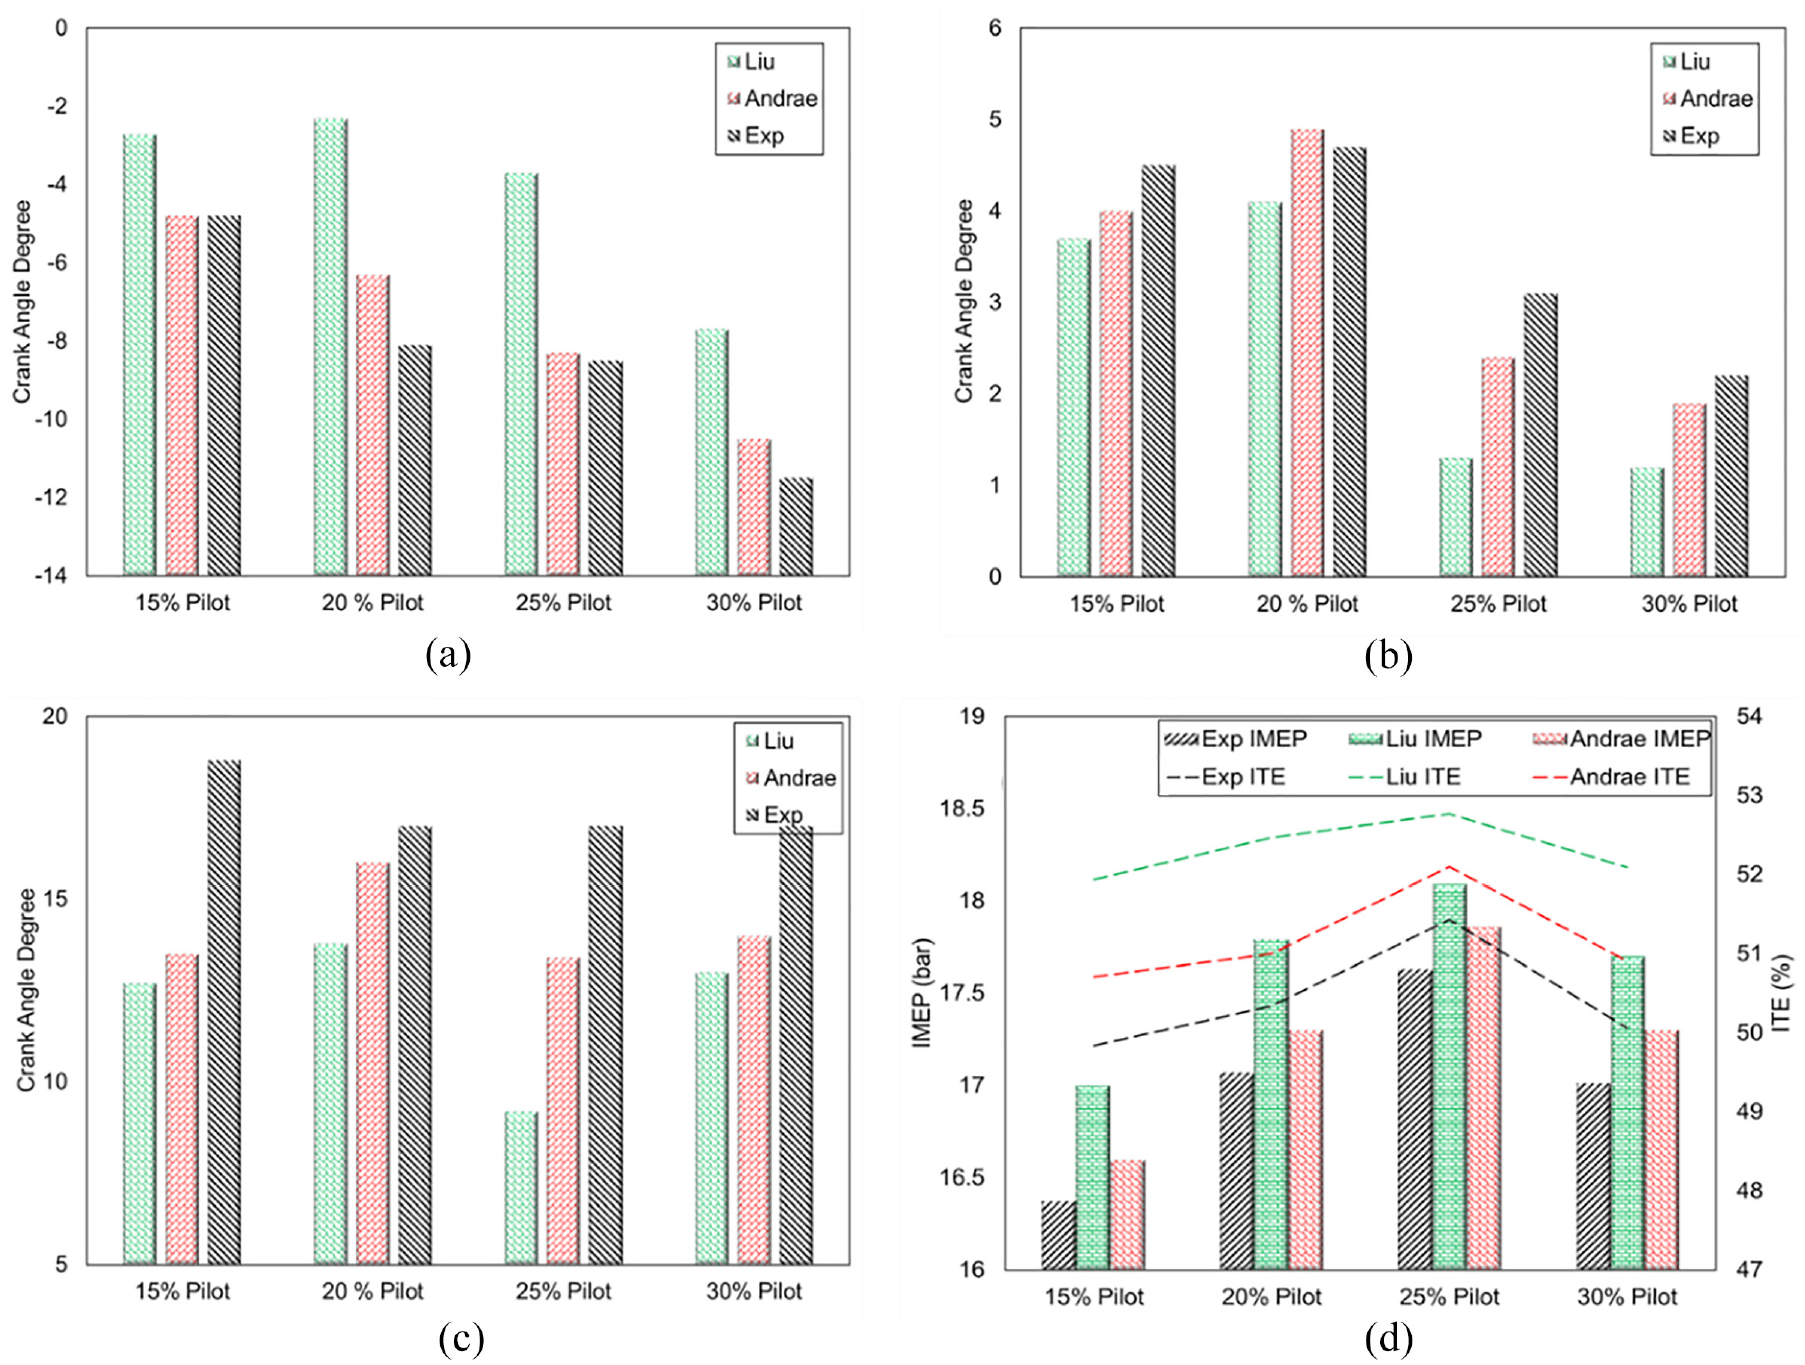
Comparison of CA50, IMEP and ITE between experiments and simulations for EP strategy: (a) CA10, (b) CA50, (c) CA90, and (d) IMEP & ITE.
In general, the Liu mechanism is found to delay the start of combustion at all pilot mass fractions with respect to the experiments, whereas the Andrae mechanism is more accurate. Because of the delayed start of combustion, the premixed combustion with the Liu mechanism tends to happen at a higher chamber pressure and temperature (as the piston would have moved closer to TDC during the relatively longer ignition delay). Moreover, premixed combustion takes place while the fuel is still being injected, and a delayed start of combustion would result in a relatively larger quantity of fuel in the chamber at the time of combustion. These two factors result in a higher initial rate of heat release after the start of combustion with the Liu mechanism. Further trend of HRR curve is dictated by the chamber thermodynamic conditions at the end of the premixed combustion. Liu mechanism uses a simpler reaction pathway owing to its smaller size whereas Andrae mechanism is more elaborate. Specifically, the Andrae mechanism has a more detailed version of reaction pathways for the three fuels which is believed to initiate the combustion process. Further investigation is required to compare the performance of both the mechanisms under a range of thermodynamic conditions relevant to the present study which will be carried out in future studies.
Further analysis of the CFD results is carried out to understand the progress of combustion at different pilot mass fractions. The results presented in this section are with the Andrae mechanism as it was found to predict the combustion behavior more accurately than the Liu mechanism. Figure 7 shows the distribution of equivalence ratio (ER) on a cross sectional plane perpendicular to the cylinder axis at −10 CAD. From Figure 7, the pilot fuel mass seems to have accumulated near the periphery of the chamber due to high injection pressure (700 bar) and longer time available between the injection and auto ignition events. In addition, the effect of a bulk swirl motion can also be observed based on the mixture distribution profiles. Clearly, the mixture in the chamber is richer for higher pilot mass fraction at the periphery of the chamber as mentioned earlier. A richer mixture tends to advance the auto-ignition, which is discussed in the next section.
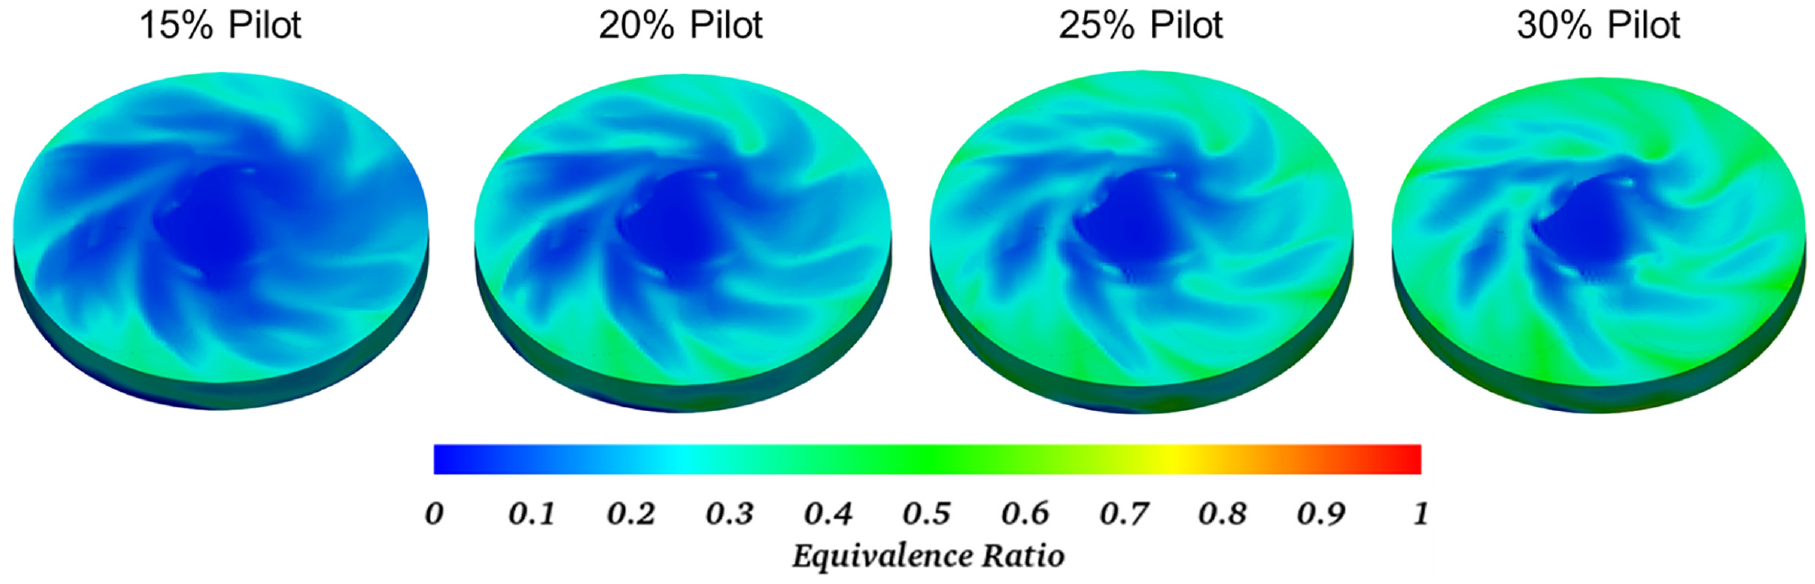
ER distribution on the plane perpendicular to the cylinder axis.
Figure 8 shows the ER and temperature contours in the combustion chamber for different EP mass fractions. Pink colored contours in Figure 8 show iso-surfaces of T = 1100K, which represents the start of pre-mixed combustion. Black color contours show iso-surface of T = 2200K which represents the mixing-controlled combustion. The plume-like structures are iso-surfaces of ER = 1 colored by temperature. In all the cases shown in Figure 8, the auto ignition starts before the main injection. At −12 CAD, the auto ignition is not observed for the 15% and 20% pilot cases, however, it started near the periphery of the combustion chamber for 25% and 30% pilot cases, because of relatively richer mixture as observed in Figure 7. As the piston moves closer to TDC, the auto ignition sites are visible in the other cases too; however, the cases with lesser pilot mass fraction have lower number of auto ignition sites whereas the other cases have more such sites. As time progresses, (at −8 CAD), the auto ignition happens at several locations in all the cases. As mentioned earlier, the SOI of the main injection pulse is different for each case. Main injection started before −8 CAD for 15% and 20% pilot cases whereas it has started between −8 CAD and −6 CAD for 25% and 30% cases. It is seen that the auto ignition process starts at the periphery of the chamber in all the cases and the high temperature combustion zone seems to move toward the center. The only difference among the different cases shown in Figure 8 is in the timing of the events and the number of auto ignition sites at the start of combustion, which depends on the ER of the mixture. Correlating the development of combustion shown for different pilot mass fractions in Figure 8 with the combustion characteristics shown in Figure 5 gives a clear understanding of the behavior of HRR curve. For 15% pilot case, the amount of fuel injected through the pilot is comparatively less which forms a leaner mixture in the combustion chamber before the main injection compared to the other pilot mass fraction cases. This result in lower number of ignition sites and lower heat release rate before the main combustion. As the main injection event is earlier in this case, it allows the fuel from main injection to evaporate near the cylinder center before the auto ignition progresses toward the center. By that time, the evaporated fuel from the main injection also participates in the premixed combustion, resulting in a sharp rise in heat release. This can be observed at −6 CAD for 15% pilot case in Figure 8 where the contours representing auto-ignition (pink iso surfaces) reach the fuel plumes at the center of the chamber and the auto-ignition sites are observed around the fuel plumes.
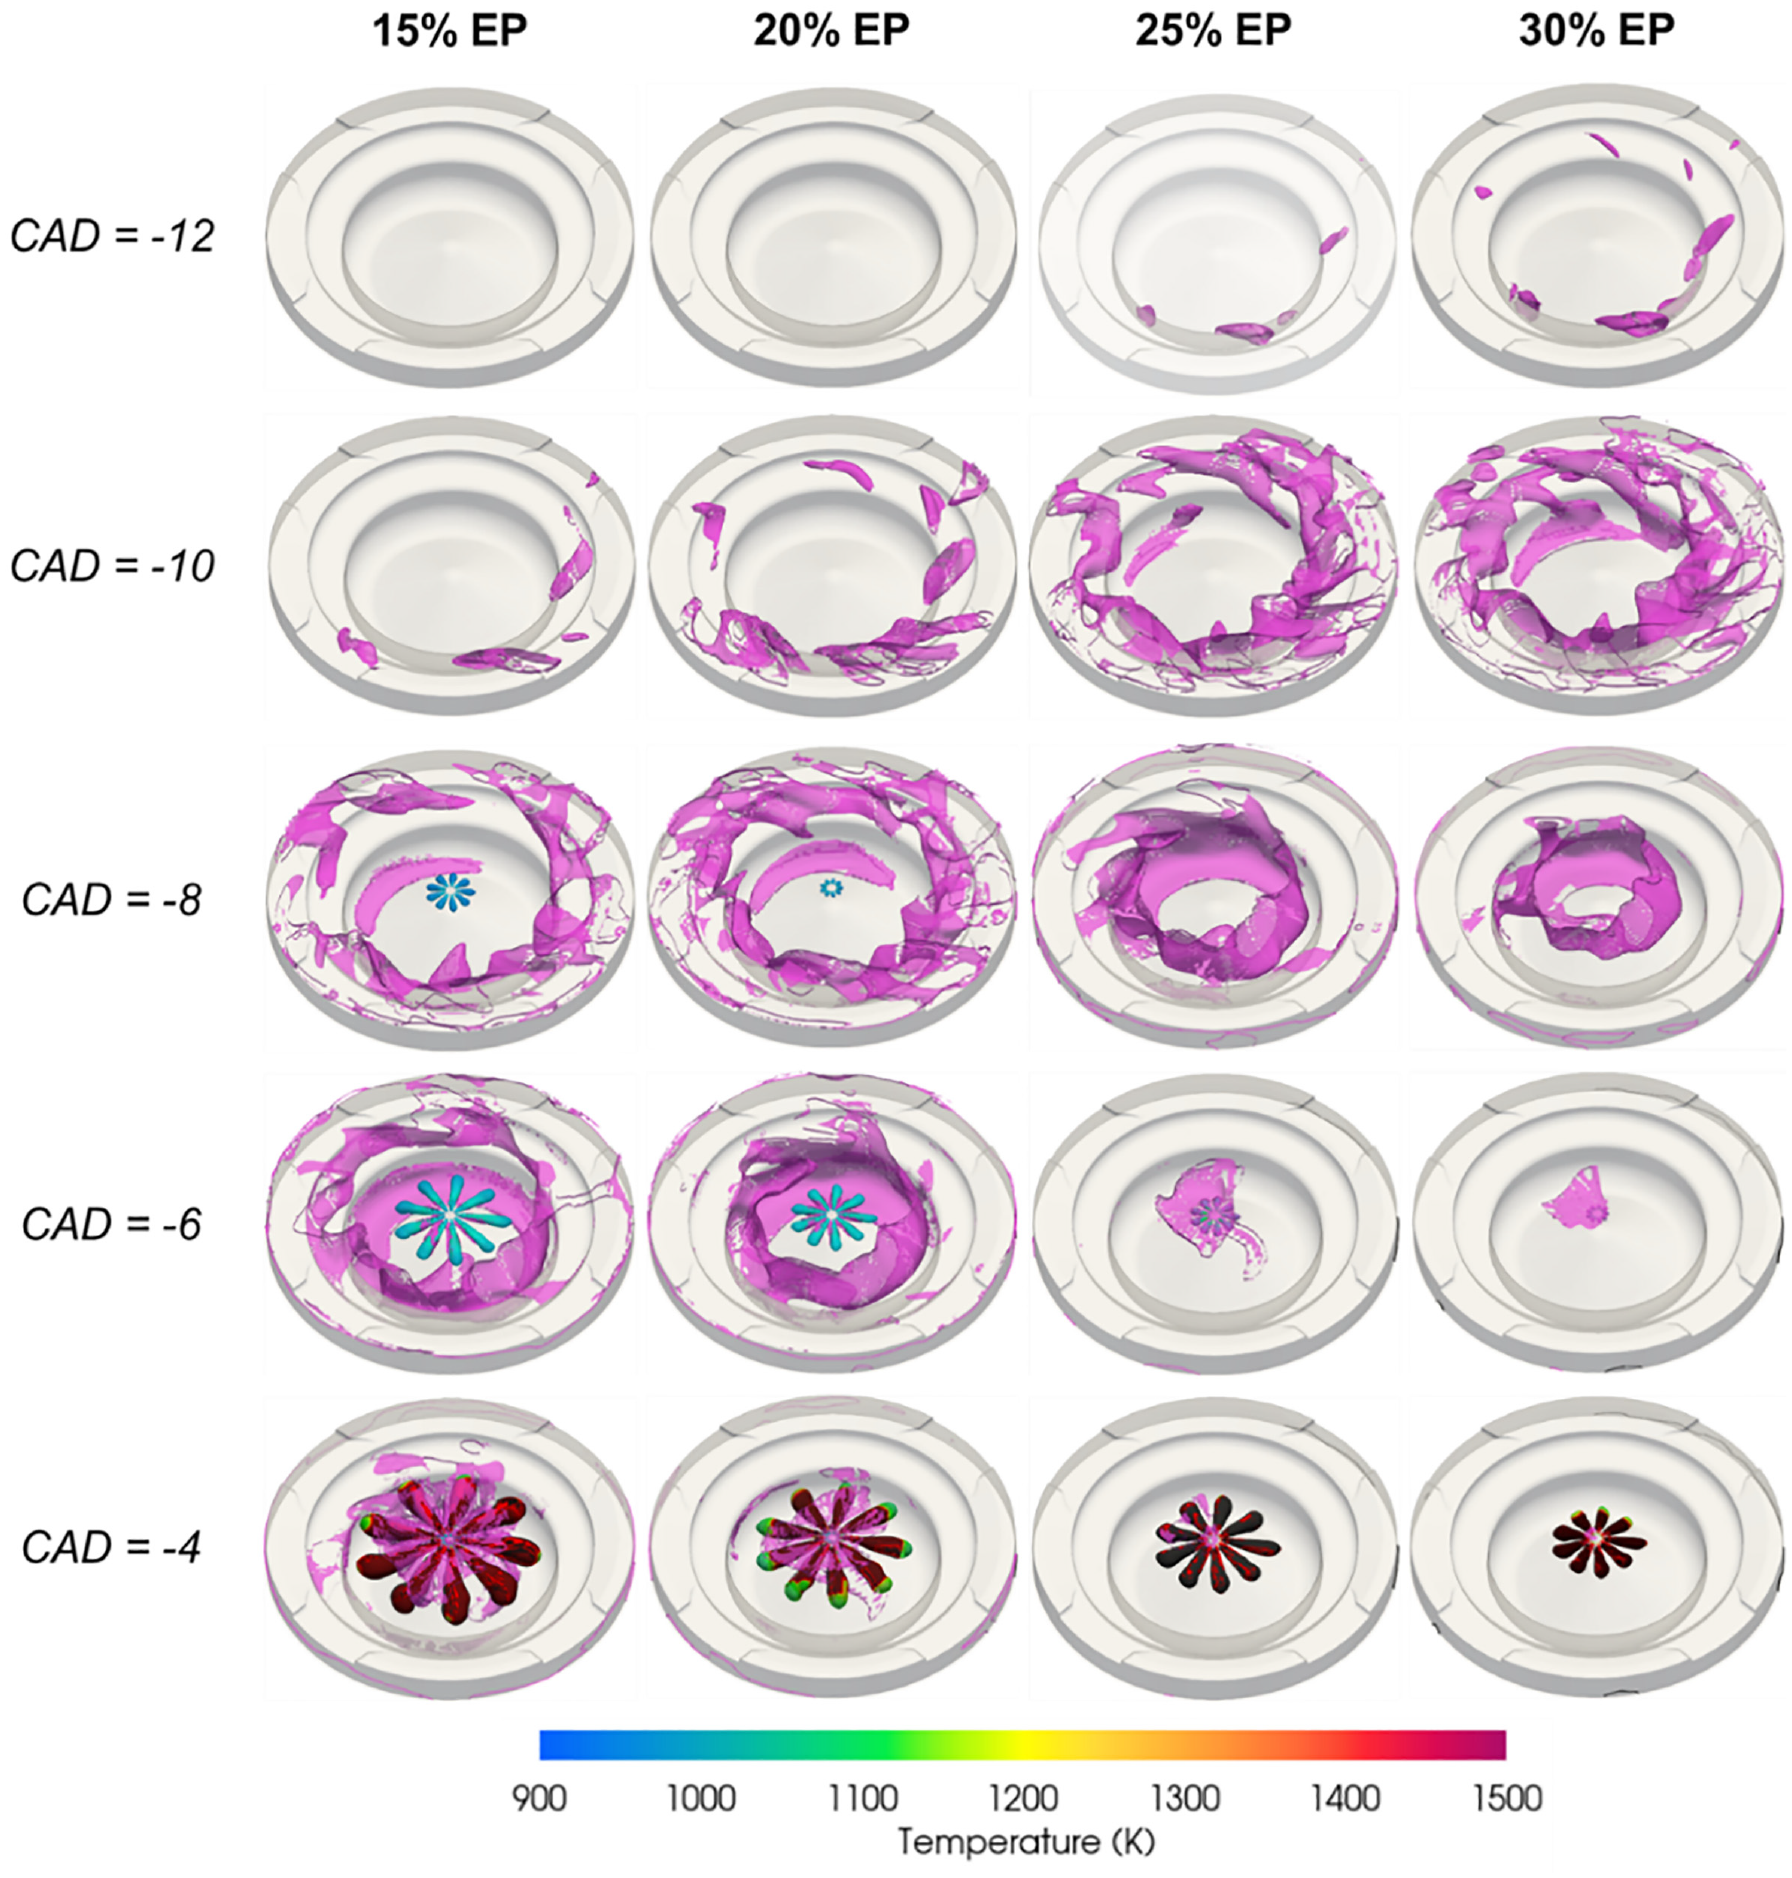
Combustion development for different pilot mass fractions (EP strategy). Pink colored contours show iso-surfaces of T = 1100K, representing the start of pre-mixed combustion. Black color contours show iso-surface of T = 2200K representing the mixing-controlled combustion. The plume-like structures are iso-surfaces of ER = 1 colored by temperature.
As the piston further approaches TDC, the fuel from the main injection prominently participates in the mixing-controlled combustion as represented by the black contour. A similar development is also observed for the 20% pilot case; however, the start of main injection is a little later than the 15% pilot case (note the shorter fuel plumes at −8 CAD for 20% pilot case). The amount of heat released from the combustion of pilot fuel is more than that of 15% case, which results in a higher first peak of HRR curve. As the main injection is delayed, less fuel from it would have evaporated before the premixed combustion zone moves toward the center. This results in comparatively less mass of fuel from the main injection participating in premixed combustion, reducing the height of second peak in HRR curve. At 25% pilot, the first peak of HRR is higher as the amount of fuel injected through pilot injection is more than that of 15% and 20% cases. As the start of main injection is further delayed, very little fuel from it participates in premixed combustion event resulting in a negligible second peak in HRR. Most of the fuel from the main injection participates in mixing-controlled combustion. At 30% pilot, the combustion starts in the pilot fuel and progresses as in the other cases, however, the main injection has not yet started by the time the auto ignition sites propagate toward the center. Thus, all the fuel from main injection pulse participates in mixing-controlled combustion as shown in Figure 5.
Comparison of combustion behavior with different chemical mechanisms
Figure 9 shows the comparison of the combustion progress with Liu and Andrae mechanism for 25% pilot mass fraction. Pink and black colored contours represent iso surfaces of T = 1100K and T = 2200K respectively. The multi-colored contour represents ER = 0.3 colored by temperature. In both the cases, the auto ignition initiates at −12 CAD and progresses up to −10 CAD very similarly. This is also confirmed from the HRR curves shown in Figure 5(c).
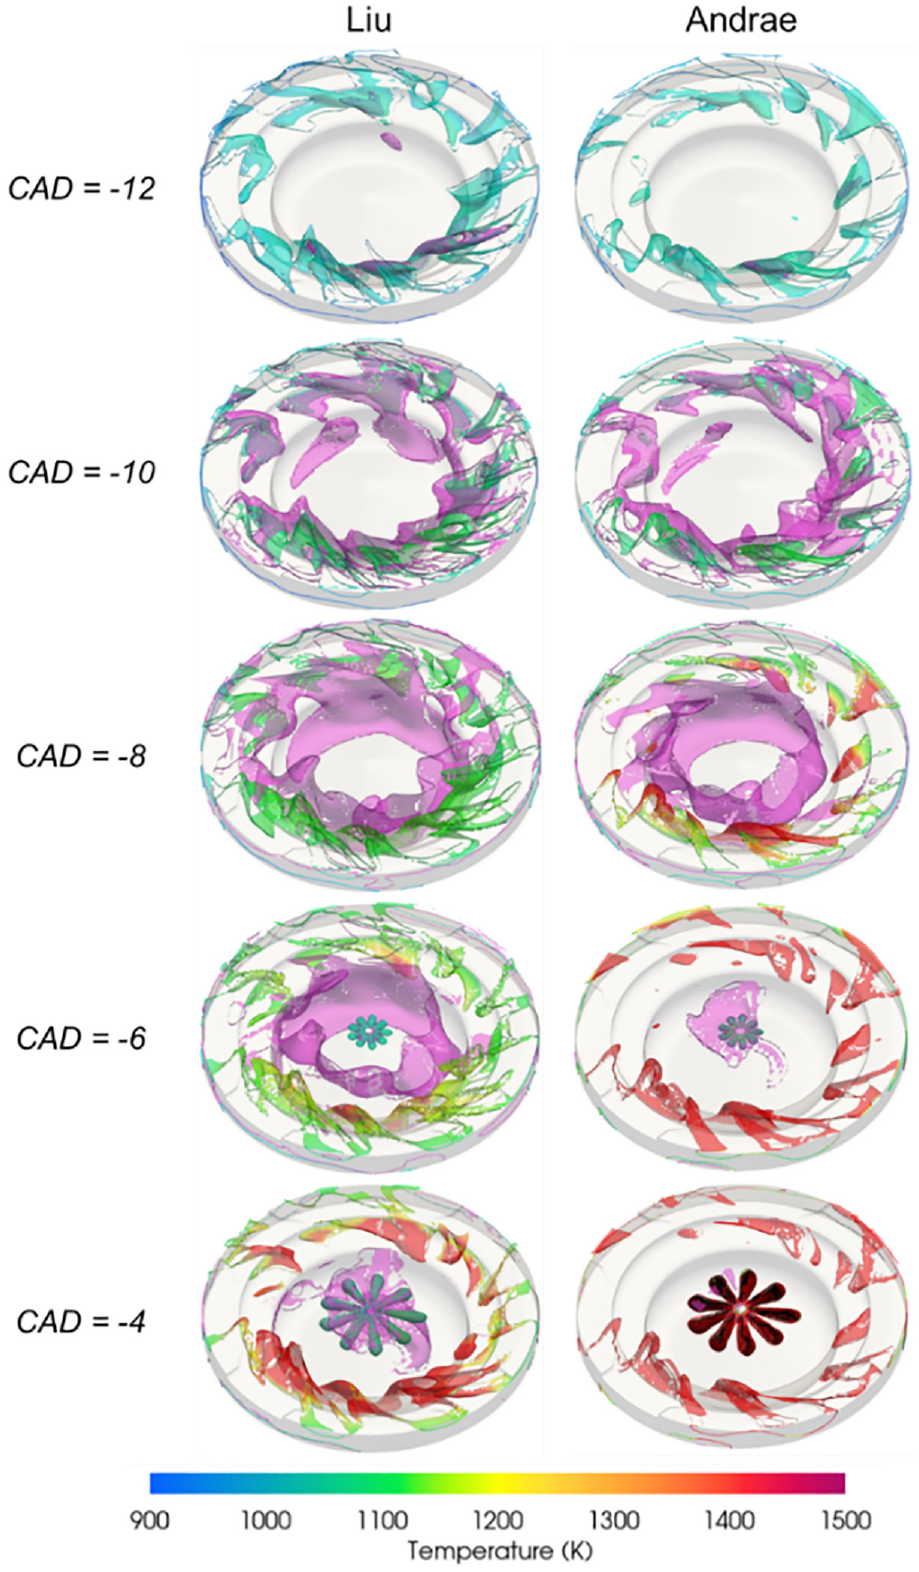
Comparison of Combustion Development between Liu and Andrae mechanism. Pink and black colored contours represent iso surfaces of T = 1100K and T = 2200K respectively. The multi-colored contour represents ER = 0.3 colored by temperature.
At −8 CAD the T = 1100K contour is still similar between the two mechanisms. However, it is seen that the ER = 0.3 iso surface around the pink colored temperature contour for Andrae mechanism is at higher temperature indicating combustion in this region. This is however, not observed for Liu mechanism, which explains the behavior of the HRR curve at this crank angle. As the cycle progresses to −6 CAD, the mixture at the periphery of the combustion chamber participates in combustion (indicated by higher temperature) for the Andrae mechanism while it is still at lower temperature for Liu mechanism. At −4 CAD, the mixture near the center of the combustion chamber from the main injection is at higher temperature (black colored contour indicating T = 2200K representing the mixing-controlled combustion) with the Andrae mechanism which is not observed in the Liu mechanism. Overall, it can be observed that the Liu mechanism results in slower combustion compared to Andrae mechanism. From this study, it is understood that the Liu mechanism may need to consider additional reaction pathways that are responsible for low mixture ERs and chamber temperatures.
Effect of pilot mass fraction on combustion characteristics
From Figure 5, it was understood that the CFD methodology predicts the combustion behavior decently for 15% and 25% EP cases, however, it shows some discrepancies at 20% and 30% pilot cases. Such differences could be because of the uncertainties in the pilot mass fraction as discussed earlier. Therefore, simulations were carried out with varying pilot mass fractions for the 30% pilot case in order to understand its effect on the combustion behavior. Figure 10 shows the comparison of in-cylinder pressure and HRR for 30% pilot (nominal pilot mass fraction – red line), 35% pilot (green line), and 40% pilot (Blue line) cases with the experimental results (black line).
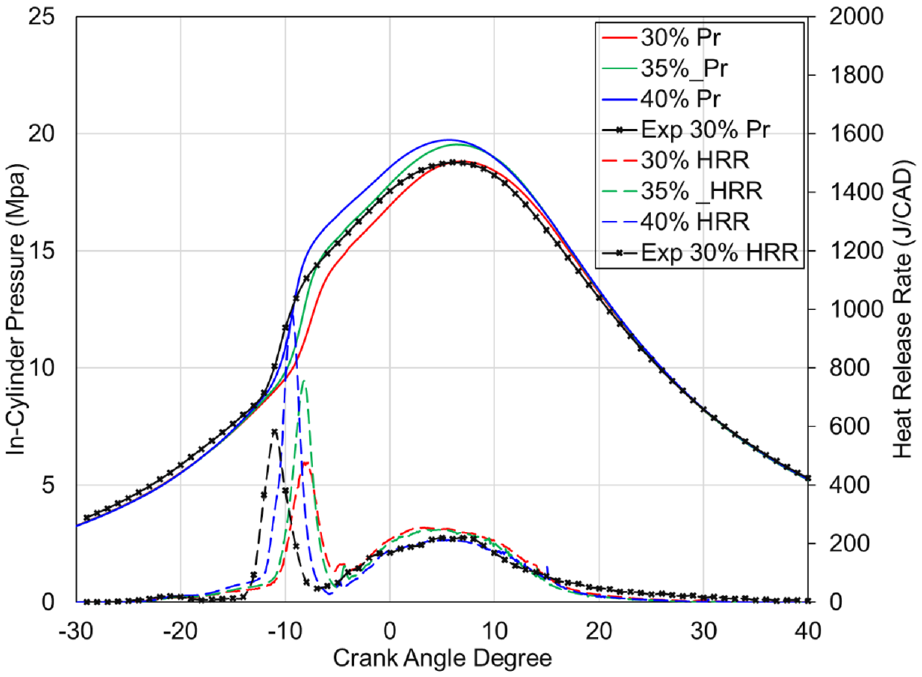
Comparison of cylinder pressure and HRR for different pilot injection mass fractions (EP Strategy).
As discussed earlier, the nominal pilot mass fraction (30%) resulted in longer ignition delay compared to experiments and its effect can be seen on the pressure curve between −10 and −5 CAD, however, the peak pressure for 30% pilot case is similar to that of the experimental value. When the pilot mass fraction is increased to 35%, there is a slight improvement in the ignition delay, but the peak pressure is higher than the experimental value by around 8 bar. Further, the first peak of HRR curve was higher than the experimental value. With 40% pilot mass fraction, there is a good improvement in the ignition delay; however, the pressure rise rate is higher immediately after the combustion of the pilot fuel mass, which resulted in approximately 10 bar higher peak pressure compared to the experiments. Figure 10, therefore implies that the larger pilot mass fraction only improves the ignition delay marginally, while the peak pressure values are compromised. This suggests that the uncertainty in the pilot mass fraction might not be the reason for the differences observed between experiments and simulations. The compression curve in Figure 10 between −30 CAD and −10 CAD suggests that the experiments have higher cylinder pressure than the simulations before the start of combustion. Earlier, in Section 6.1.1, it was noted that the boundary conditions for the 25% pilot case was used for all the other pilot mass fractions. Now that the effect of the uncertainty in the pilot mass fraction is ruled out, it is likely that the discrepancy between the experiments and simulations is arising due to the error in the in-cylinder conditions at the start of combustion resulting from the approximation in the boundary conditions. Further, all the simulations were performed with constant wall temperature boundary conditions (which is a common practice for engine simulations). It is difficult to measure the wall temperatures from the experiments and hence they act as a major source of uncertainty in the engine simulations. These uncertainties are likely to be higher for EP case, because of the pilot fuel mass burning close to the chamber walls as shown in Figures 8 and 9, which changes the heat transfer characteristics as discussed earlier. This discussion warrants further study on the effect of chamber wall temperatures and heat transfer model on the combustion behavior of the engine.
EP strategy – sweeping the injection timing
The EP simulations are extended to study the effect of the injection timing on the combustion and performance behavior of the engine. The main injection timing of the baseline case (25% pilot) has been varied across by 2 CAD in both directions in steps of 1, which resulted in four additional cases. The pilot injection timing is fixed at −80 CAD. Figure 11 shows the comparison of in-cylinder pressure and HRR between the simulations using the Andrae mechanism and the experimental results at different injection timings. The CFD methodology is found to predict the in-cylinder pressure and HRR at all injection timings very well. It is to be noted that the experimental results shown in Figure 5 were obtained in a different season compared to those in Figure 10. This likely results in slightly different coolant temperature and intake conditions between the two cases as the outside temperature changes the heat exchanger efficiency which does not have an active temperature control. However, the same set of boundary conditions were used for both the simulations. Although the difference between the two sets of boundary conditions is minimal, this could be the reason for minor differences in the compression curve and first peak of HRR curve between the experimental and the simulation results.
Comparison of in-cylinder pressure and HRR for 25% EP case at different injection timings: (a) SOI-1, (b) SOI-2, (c) SOI-3, and (d) SOI-4.
Figure 12 shows the comparison of IMEP and ITE for different injection timings between simulations and experiments. From Figure 12, it can be observed that the simulations predict the experimental IMEP and ITE reasonably well, in line with the previous results.
Comparison of IMEP and ITE for 25% EP case at different injection timings.
Overall, from this section it can be concluded that the CFD methodology predicts the experimental combustion and performance characteristics reasonably accurately. Although there are some differences in the magnitude of IMEP and ITE between the experiments and simulations, such differences are well within ∼5% error, which is reasonable for CFD simulations. Further, the difference between the experiments and simulations are attributed to the causes like the uncertainties in the boundary conditions, wall temperatures, heat transfer characteristics etc. which warrants further investigation.
Unburned hydrocarbon (UHC) and carbon monoxide (CO) emissions for EP cases with different pilot mass fractions
The main aim of this study was to understand the effect of different injection strategies on combustion and performance characteristics of the GCI engine. It involved carrying out simulations at several data points for each injection strategy. Many simulations (that were not reported in this work) were performed to achieve the current level of accuracy at all the data points which involved progressively increasing levels of complexity in the simulations. On average each simulation took approximately 80 h on a 32 CPU machine. A full-scale emission study would consume significantly more computational time. Therefore, the emission sub-models were not employed in the simulations. HC and CO emissions are only presented as it was found that the NOx emissions are negligible. The soot models were also not employed in the original simulations to save computational time.
Figure 13 shows the unburned hydrocarbon (UHC) and carbon monoxide (CO) emissions for early pilot cases with different pilot mass fractions. The lowest UHC emissions are observed for the 25% pilot case while the lowest CO emissions are observed for the 15% pilot case. In the later section, these emissions can be compared with those of the LP cases.
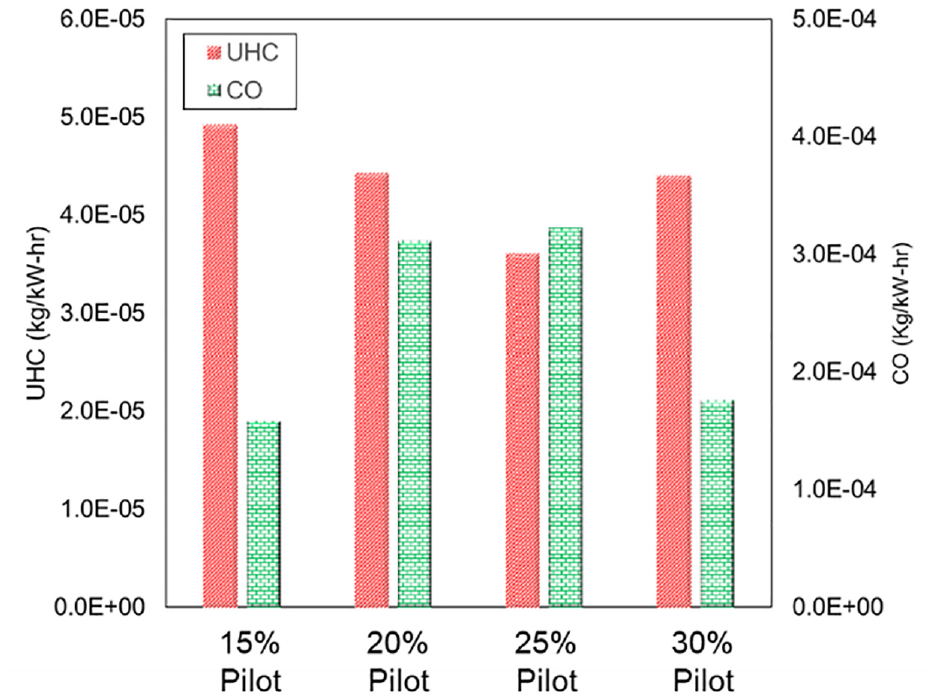
Comparison of UHC and CO emissions for different EP cases.
Late injection strategy
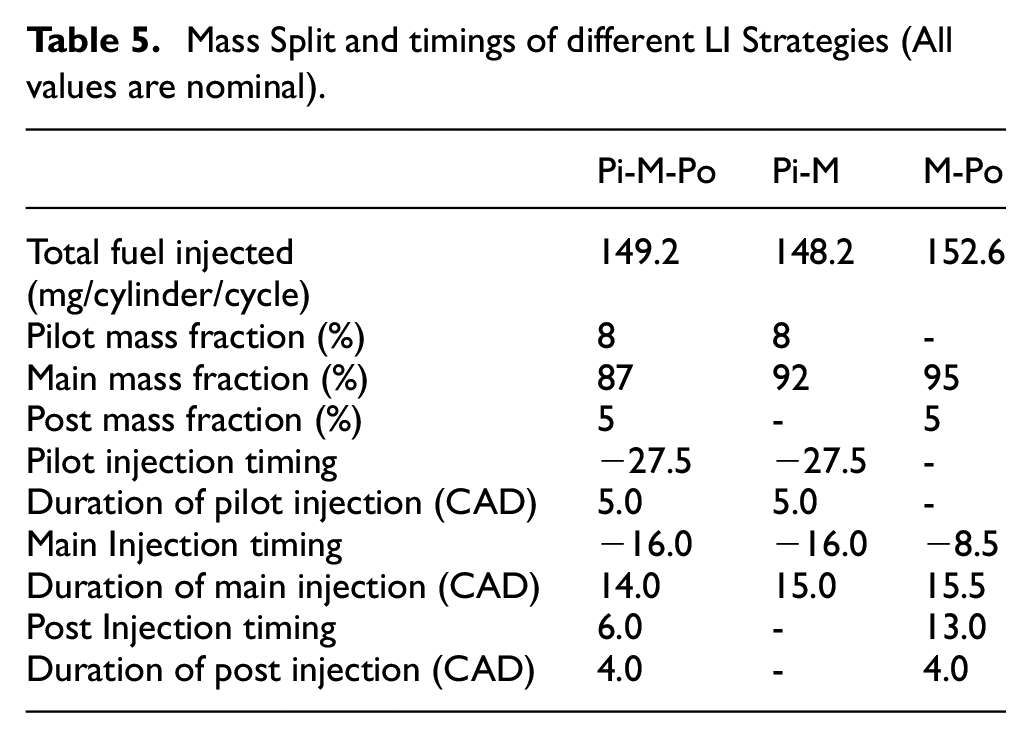
Typically, LI strategy is employed in conventional diesel engines where the fuel is injected close to TDC. Combustion takes place predominantly in mixing-controlled mode, where the rate of heat release and the rate of pressure rise are controlled by the rate of mixing of fuel ensuing from the injector and the fresh air in the combustion chamber. Often a small quantity of fuel is injected (pilot injection pulse) before the main injection event to obtain smoother HRR profiles and lower peak pressure rise rates. Post injection (i.e. a small quantity of fuel is injected after the main injection) is commonly used to reduce the hydrocarbon emissions and speed up the combustion. In the case of GCI, the combustion behavior is expected to be different from the conventional diesel engine because of the longer ignition delay times and lower reactivity of gasoline compared to diesel fuel. As mentioned earlier, the three cases presented under the LI strategy differ from each other in terms of the number of injection pulses and their timings. Table 5 shows the nominal fuel mass and its split across the pulses along with their timings and nominal injection durations for the three LI cases. Andrae mechanism has been used for all the simulations under LI strategy owing to its superior performance as concluded in the previous section.
Mass Split and timings of different LI Strategies (All values are nominal).
Effect of pilot mass fraction on combustion characteristics
Although the commanded pilot mass fraction was 8% of the total fuel mass, there were some uncertainties in the experimental measurements in terms of the fuel mass split across the pulses. Therefore, it was decided to study the effect of pilot mass fraction on combustion characteristics. Figure 14 shows the comparison of the in-cylinder pressure and HRR for 8% (nominal) and 6% pilot cases with the experimental results. Different peaks in the HRR curve are denoted in Figure 14 for 8% pilot case for easy referencing. The same denotation is also used to reference the other curves (experimental and 6% pilot case) in Figure 14. Note that the injection timings shown in Figure 14 are slightly different from those mentioned in Table 5. It is interesting to note that the pilot mass fraction in LI strategy was smaller than in the EP strategy, but the mixture is leaner in the latter strategy because of longer time available between the injection and start of combustion. Note that the low temperature heat release is not observed in the LI strategy because of the late injection timing of the pilot pulse.
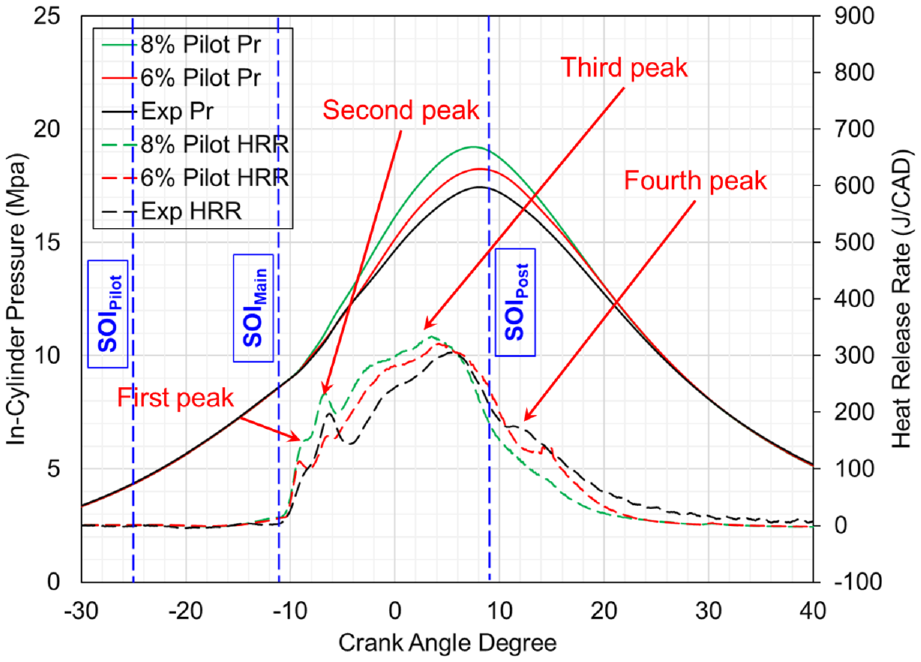
Comparison of cylinder pressure and HRR for different pilot injection mass fractions (LI Strategy).
The HRR curve was calculated from the cylinder pressure data, which peaks at around 7.6 CAD and then falls due to the downward movement of the piston. The first peak in the experimental HRR curve is not distinctively observable; however, it occurs at −8 CAD. Up to −8 CAD, the fuel from the pilot injection participates in combustion. Between the start of the main injection and −8 CAD, a portion of the fuel from the main injection pulse starts evaporating and mixing with the fresh air. It starts to combust at around −8 CAD (after the chemical ignition delay) thus ramping up the HRR further and resulting in the second peak at −6 CAD. After the second peak at −6 CAD, combustion slows down shortly and picks up again at around −4 CAD. The momentary slowdown in combustion is due to the competition between the rate of fuel injection and rate of mixing of fuel with the surrounding air. At some point during the fuel injection, the rate of injection dominates the rate of mixing where the combustion switches from the pre-mixed mode to the mixing-controlled mode. In the present case, it appears to happen between −6 CAD and −4 CAD. Pre-mixed combustion dominates before −6 CAD whereas mixing controlled combustion dominates after −4 CAD. The mixing-controlled combustion continues up to around 8 CAD (third peak) after which, the HRR curve starts to ramp down due to the end of the main injection event. The fourth peak in the HRR curve can be observed at around 12 CAD, which is because of the post injection event.
For both the pilot injection mass fraction values evaluated here, the start of combustion (where the HRR curve starts to grow positively) coincides with the experimental data indicating that the simulations closely represent the experimental pilot injection timing and the thermodynamic conditions in the cylinder at the time of injection. Further, it indicates the accuracy of the chemical mechanism for the present case. The simulations have steeper HRR curve compared to the experiments up to the first peak, which is likely because of faster mixing rate. Further, the 8% pilot case has a higher first peak compared to the 6% pilot case, which is because of larger pilot mass fraction in the former case. This leads to higher second peak for the 8% pilot case whereas the 6% pilot case has lower second peak compared to the experimental curve. It can also be observed that the simulations transition to mixing-controlled combustion earlier than experiments, which indicates faster mixing rate in the simulations compared to the experiments. Thus, it can be concluded that the simulations are slightly over predicting the mixing rate compared to the experiments, which increased the slope of the HRR curve during the pre-mixed combustion and promoted early transition to mixing controlled combustion. The rate of fuel air mixing depends on several factors like the fuel physical and chemical properties, injection pressure, in-cylinder flow field, accuracy of evaporation model etc. Inaccurate representation of any of the above physics could lead to small discrepancies in the HRR curve. It is also observed that the 8% pilot case has higher rate of pressure rise at the beginning of combustion, leading to higher peak pressure compared to the experiments. On the other hand, the 6% pilot case follows the experimental pressure curve more closely around the start of combustion. However, because of quicker transition to mixing controlled combustion, it also results in higher peak pressure compared to experiments. Higher pilot mass fraction was found to result in earlier third peak in the HRR curve, which affects CA50 as discussed in the next section. The earlier occurrence of third peak in HRR curve could also be because of the assumption of constant temperature boundary conditions on the walls of the combustion chamber, which affects the wall heat transfer.
It is to be noted that the total fuel mass injected in both the simulations was the same. However, the lower pilot fuel mass fraction in 6% case is compensated with 2% higher mass in the post injection pulse with an expectation that it would improve the match between the experimental and CFD HRR curves during the combustion of the fuel injected during post pulse (after 10 CAD After Top Dead Center (aTDC)). To reproduce the fourth peak, it was understood that the post fuel mass fraction must be higher than the nominal value. This strategy helped in manifesting a distinctive fourth peak in HRR curve for the 6% pilot case, however, it appears around 2 CAD later compared to experiments. This is most likely because of some uncertainty in the post injection timing.
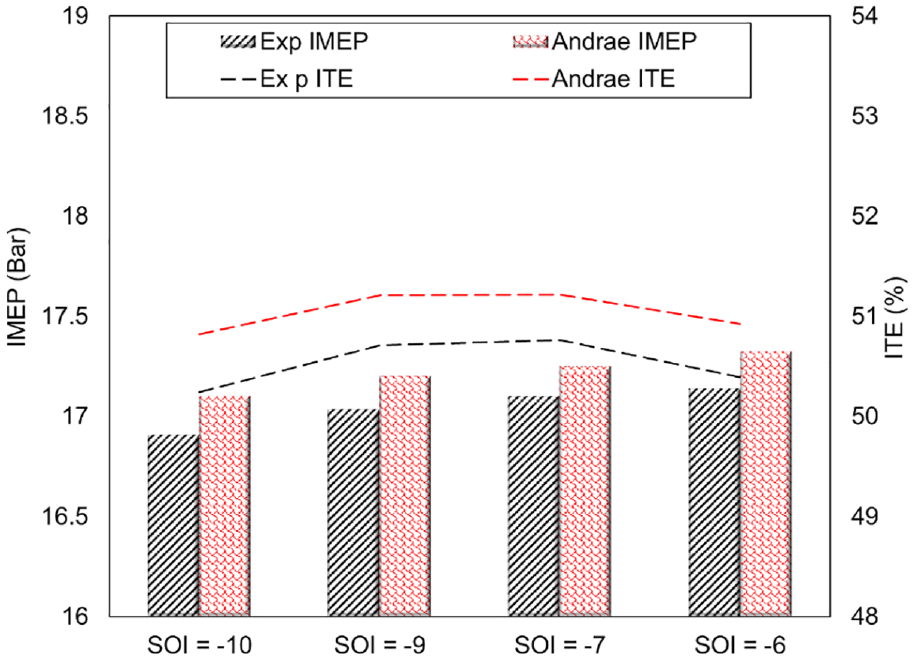
Figure 15(a) shows the comparison of combustion phasing for 8% and 6% pilot cases with the experimental values. It can be observed that the CA10 for both the pilot mass fractions is around 0.5 CAD earlier than the experimental value. This is because of the faster combustion of pilot fuel in the simulations as explained earlier. Combustion of larger quantity of pilot fuel, which triggers earlier transition to mixing controlled combustion for 8% pilot case results in earlier CA50 and CA90 compared to experiments. The combustion phasing for 6% pilot case is closer to the experimental values. Figure 15(b) shows the comparison of IMEP and ITE for different pilot mass fractions with experiments. Both the simulations predict the experimental IMEP and ITE within 1% error. On closer examination, 8% pilot case results in slightly higher IMEP and ITE compared to 6% pilot case because of higher peak pressure in the former case.
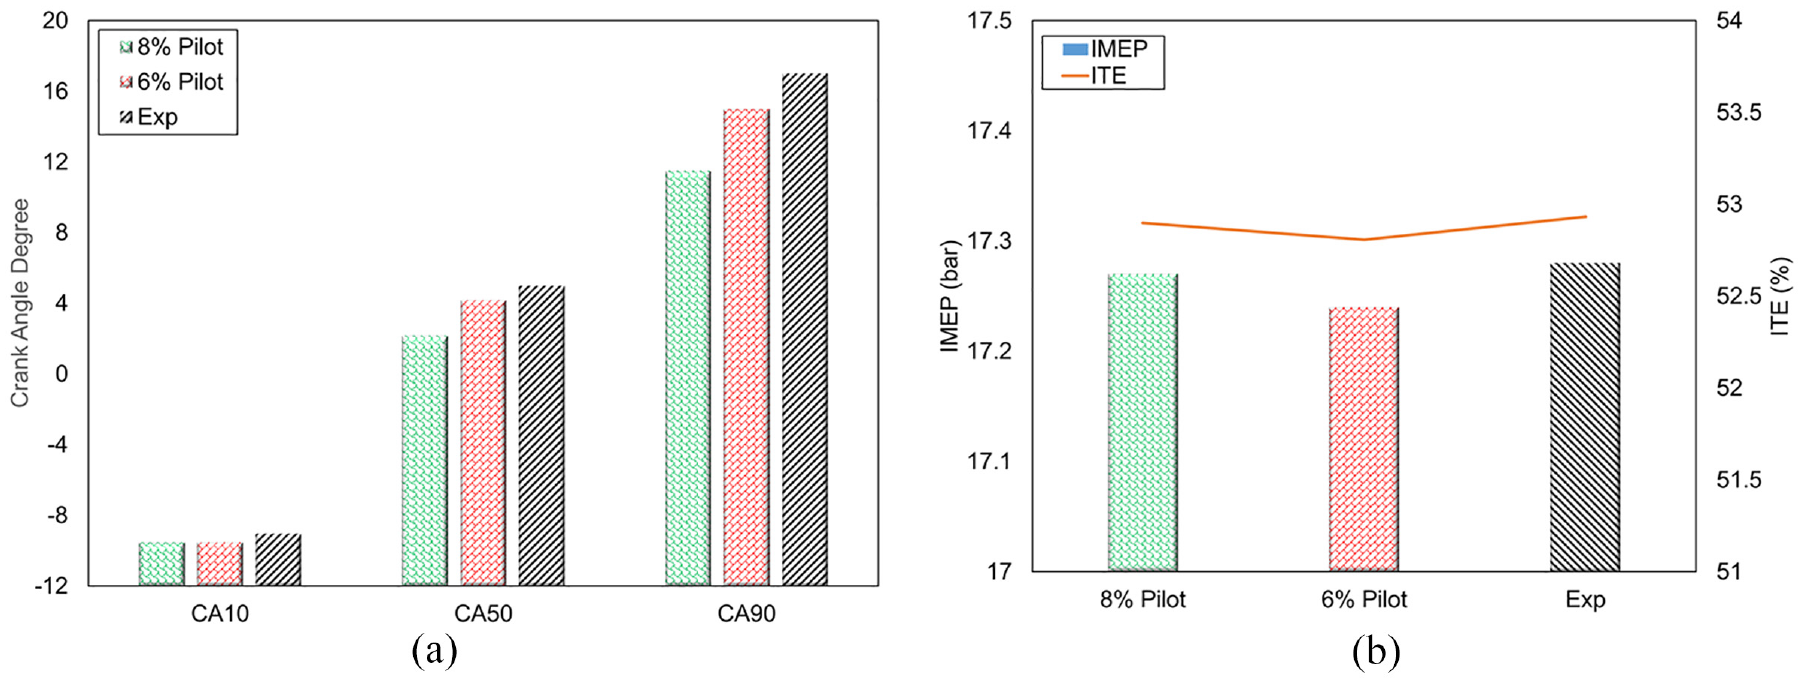
Combustion phasing and performance characteristics for different pilot mass fractions: (a) combustion phasing and (b) IMEP & ITE.
Figure 16 shows the comparison of auto-ignition inside the combustion chamber for 8% and 6% pilot mass fraction cases. The multi-colored contours shown in Figure 16 represent ER = 1 colored with temperature. The pink colored contours correspond to T = 1100K representing the initiation of combustion and the black colored contours correspond to T = 2200K representing the mixing-controlled combustion. At −10 CAD, it can be observed that the fuel injected through the pilot injection pulse is approaching the piston lip region while the fuel from the main injection pulse is starting at the center of the chamber. It can also be observed that the auto-ignition sites are present in both the cases; however, they are more prominent for 8% pilot case compared to 6% pilot case, indicating a higher heat release (because of injecting more fuel) in the former case. At further crank angles shown in Figure 16 it can be observed that the 8% pilot case consistently shows a slightly larger mixture volume participating in combustion, leading to higher heat release compared to 6% pilot case. This supports the argument presented earlier in relation to the HRR curves shown in Figure 14. From this section, it can be understood that the combustion phasing, maximum pressure rise rate, peak pressure, and performance for LI strategy are sensitive to the pilot fuel mass fraction. It also effects the duration and magnitude of the premixed combustion and the transition to the mixing-controlled combustion. Although the 8% pilot case shows a better agreement with the experimental performance parameters, it is to be noted that the initial rise in HRR curve and its behavior after the peak for this case are different from the experimental result (Figure 5). Further, the CA50 and CA90 occur earlier for the higher pilot mass fraction. Therefore, it can be concluded that the analysis presented in this section highlights that the 6% pilot case matches the experimental results more closely compared to the 8% pilot case. Based on that, all the further simulations in LI strategy used 6% pilot mass fraction.
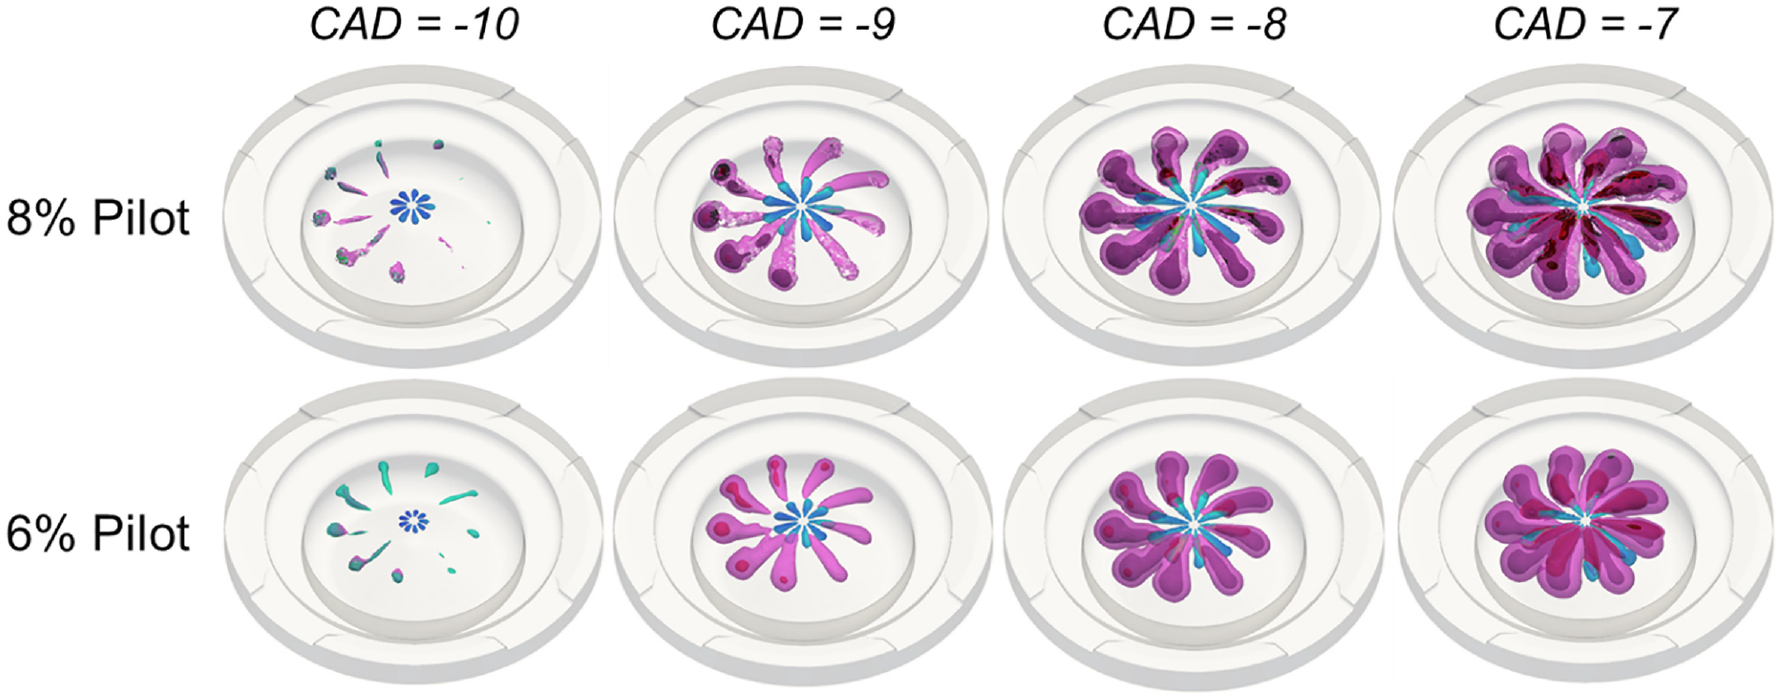
Comparison of auto-ignition for different pilot mass fractions (Color notation is same as that of Figure 8).
Comparison of combustion and performance characteristics of different cases under LI strategy
Figure 17 shows the comparison of the in-cylinder pressure, HRR and ignitable mixture fraction between experiments and simulations for the three LI cases. Figure 17(a) shows the comparison of in-cylinder pressure and HRR for Pi-M-Po case with the experiments. Note that it is the same plot shown in Figure 14 with 6% pilot mass fraction. It is shown here again from the sake of comparison with the other cases. From Figure 17(a) it is observed that the simulations capture the experimental HRR and in-cylinder pressure very well. From Figure 17(b) for Pi-M case the in-cylinder pressure and HRR trends are quite similar to that of Pi-M-Po case. The only difference is that the fourth peak in the HRR curve at 15 CAD is missing in the case of Pi-M due to the absence of post injection pulse.
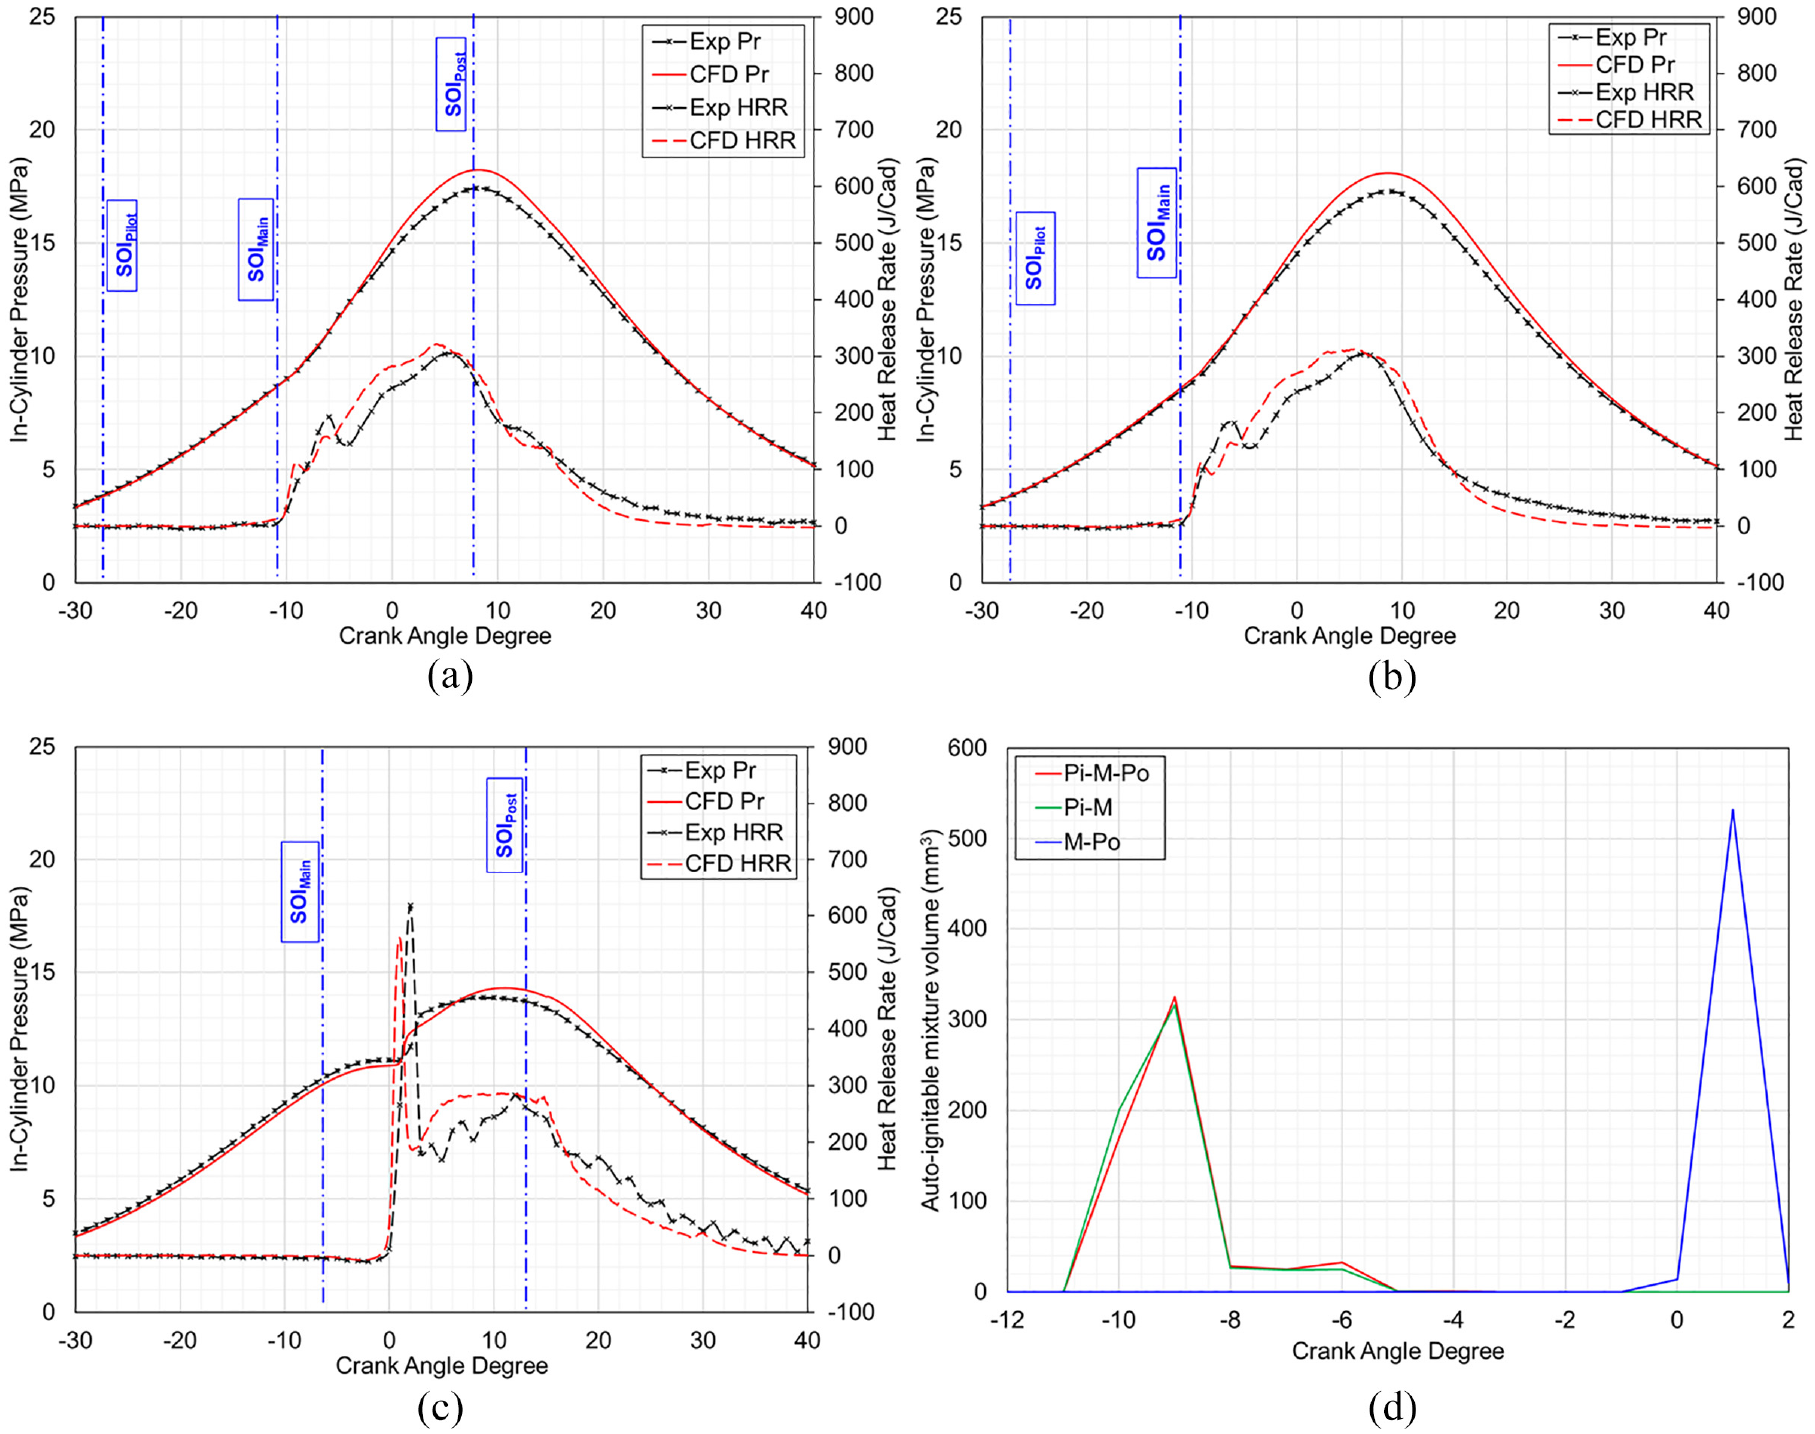
Comparison of in-cylinder pressure, HRR and ignitable mixture fraction for LI strategy: (a) Pi-M-Po, (b) Pi-M, (c) M-Po, and (d) ignitable mixture volume.
The M-Po strategy shown in Figure 17(c), in which the pilot injection pulse is absent helps us gaining better insight into the initial part of combustion. It is to be noted that the combustion progresses differently in this case compared to the previous strategies, just because of lack of pilot fuel injection. The fuel injection timing was retarded in order to keep the rate of pressure rise below a certain threshold. The sharp rise in HRR and pressure observed in Figure 17(c) shows that the fuel accumulated in the chamber between the start of injection and start of combustion (i.e. during the ignition delay period) combusts in a pre-mixed fashion close to TDC. In the absence of pilot injection and its combustion, the chamber temperature would be lower at the time of the main injection, which results in a longer ignition delay, thus delaying the start of combustion. By the time the auto ignition occurs, there is a relatively larger quantity of fuel (compared to other strategies) which is already well mixed with the air in the combustion chamber, thus resulting in a sharper pre-mixed heat release. The initial pre-mixed heat release results in a sharper rise in in-cylinder pressure at TDC, which is evident from Figure 17(c). The CFD model predicts a slightly retarded peak pressure location. One of the reasons for this might be due to a mismatch in the mass trapped as it can be seen from the compression part of the pressure curve.
Figure 17(d) shows the auto-ignitable mixture volume in the combustion chamber for different late injection cases, similar to the work of Zhao et al. 47 The ignitable mixture volume was calculated based on the cylinder charge that covered a temperature range of 1000–1500 K and an equivalence ratio range of 0.8–1.2. The auto-ignitable mixture volume plot helps understanding the reason for sharper pressure rise in the case of M-Po strategy compared to the other strategies. The crank angle at which auto-ignitable mixture volume peaks corresponds to the time of ignition. It is to be noted that Figure 17(d) is plotted at 1 CAD resolution. From Figure 17(d) it is observed that the auto-ignitable mixture volume for Pi-M-Po and Pi-M is similar and occurs at the same crank angle. However, for M-Po the auto-ignitable mixture volume peaks at around 1 CAD and it is approximately 1.6 times higher than the other two cases. This explains the sharp rise in HRR and higher rate of pressure rise in the case of M-Po.
Figure 18(a) to (c) show the comparison of combustion phasing for different LI cases. From Figure 18(a) it is observed that the CFD model captures the CA10 within 0.5 CAD for all the cases. Pi-M-Po and Pi-M cases have similar CA10 whereas the M-Po case shows a much-delayed CA10 because of the absence of the pilot injection and delayed main injection timing. Consequently, CA50 and CA90 for M-Po simulation also occur later. For all the cases, CA50 and CA90 occurs slightly earlier (within ∼1 CAD) than experiments. This is likely because of the faster mixing rates in the simulations as discussed earlier.
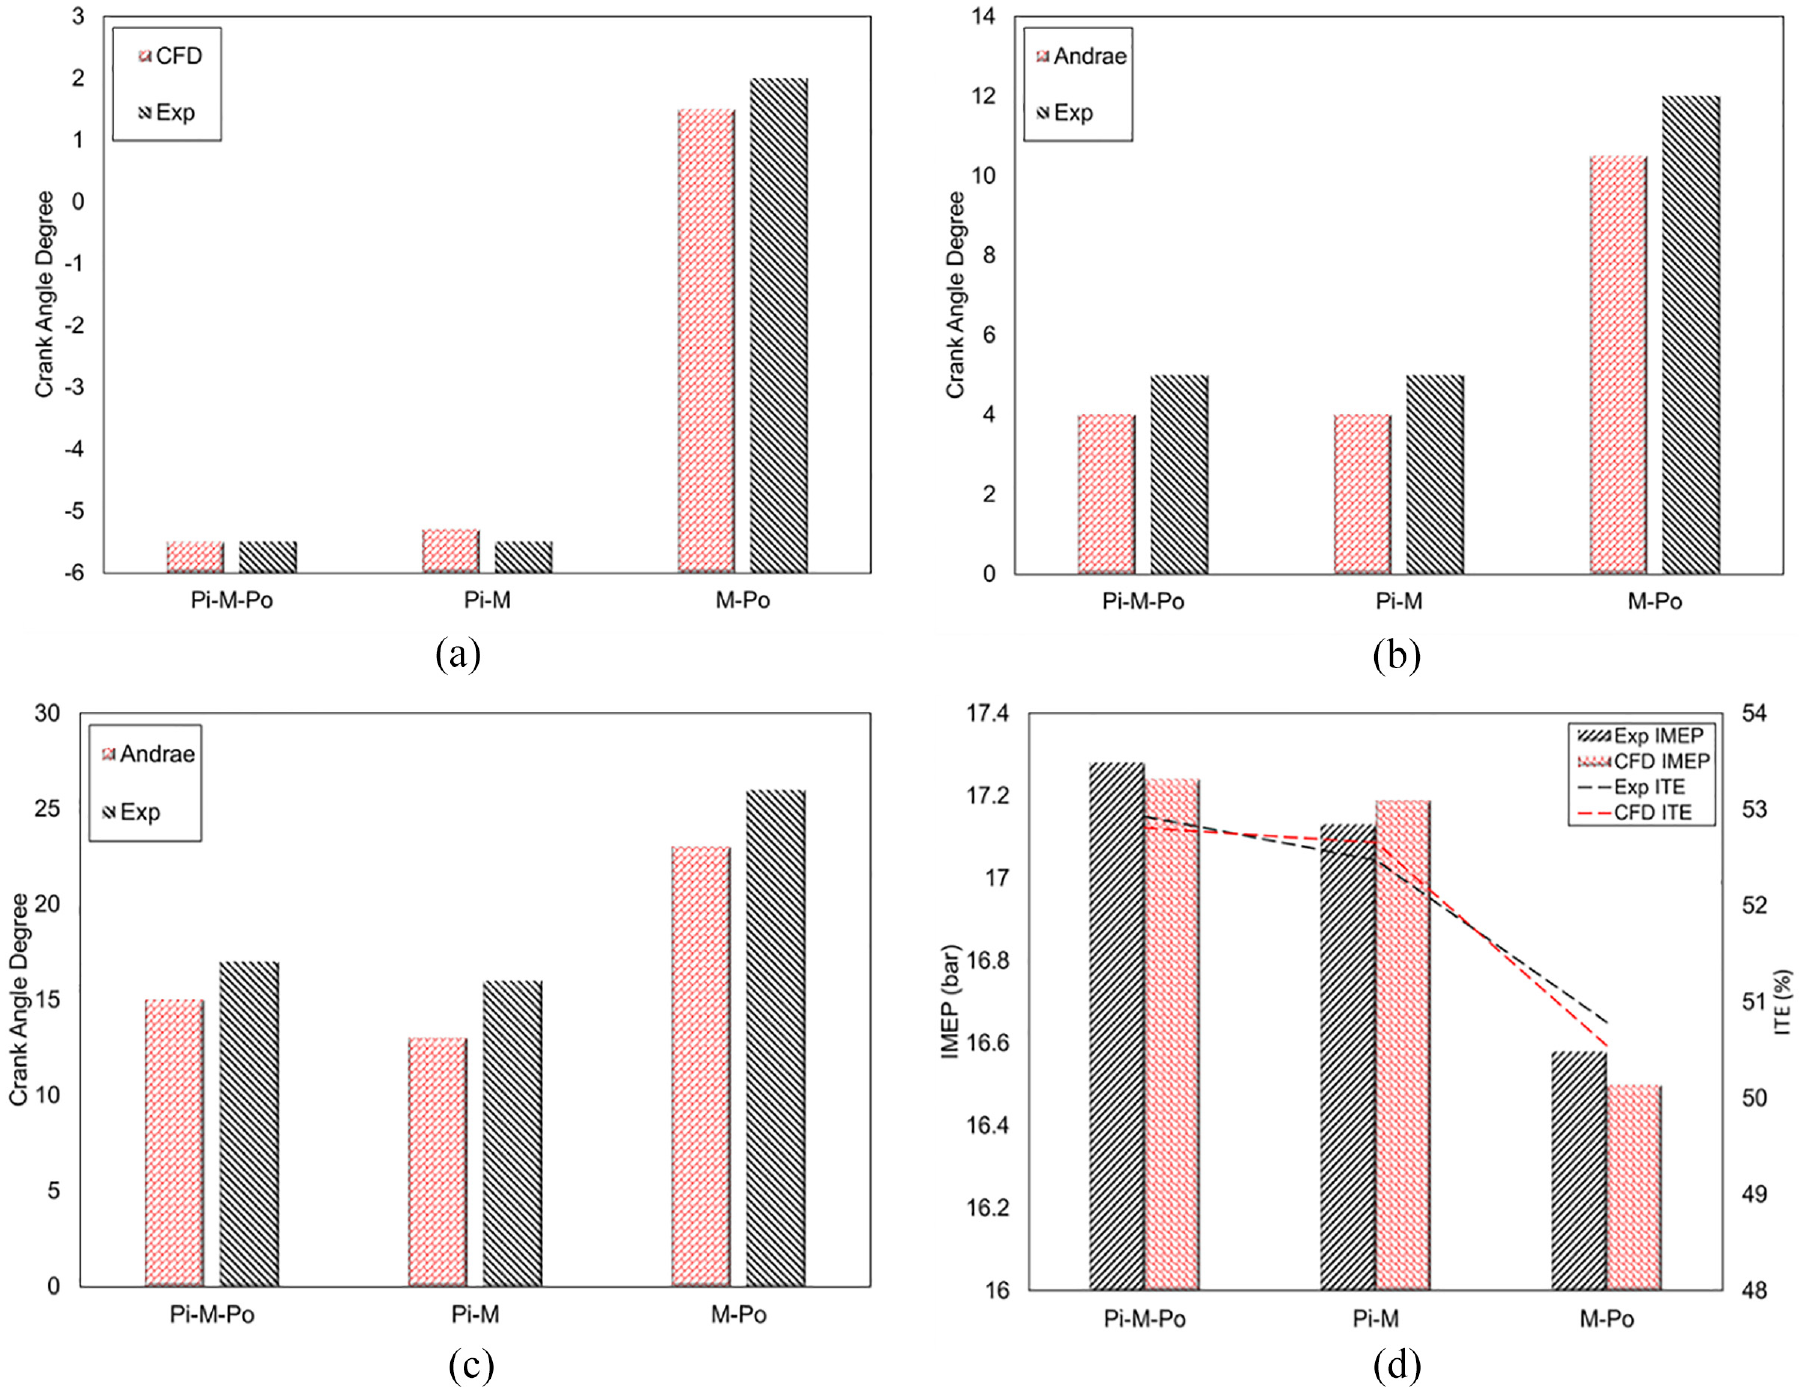
Comparison of combustion phasing, IMEP and ITE between experiments and simulations for LI strategy: (a) CA10, (b) CA50, (c) CA90, and (d) IMEP & ITE.
Figure 18(d) shows the comparison of IMEP and ITE between simulations and experiments. From Figure 18(d) it is observed that the difference in IMEP and ITE from the simulations compared to experiments is almost negligible (less than 0.2% difference). It can also be observed that the Pi-M-Po results in higher IMEP and ITE compared to other strategies and in general, the experimental trend of the performance characteristics is perfectly captured by CFD simulations. Higher thermal efficiency with Pi-M-Po is primarily because of the injection of fuel in pulses before combustion TDC. While the pilot injection results in premixed and more homogeneous charge formation resulting in a smoother initial HRR, the main injection results in better combustion phasing control. With combined pilot and main injections, it is possible to achieve lower pressure rise rate unlike M-Po with main injection alone. Stretched apparent HRR profiles and better combustion phasing control of Pi-M-Po and Pi-M strategies result in higher thermal efficiency compared to M-Po. Further, post injection in Pi-M-Po increases the in-cylinder turbulence and thus speeds up the combustion post TDC compared to Pi-M, which is indicated by the simulation results. Thus, Pi-M-Po results in higher performance compared to the other LI strategies.
Figure 19 shows the comparison of ER and temperature contours in the combustion chamber for Pi-M-Po and M-Po cases. Pi-M case is not shown because it is similar to Pi-M-Po case in the relevant crank angle range. The crank angle range shown in Figure 19 corresponds to one degree before and after the respective maximum auto-ignitable mixture volume for Pi-M-Po and M-Po cases (shown in Figure 17(d)). The color representation in Figure 19 is same as that used in Figure 16. In Pi-M-Po case, it can be seen at −10 CAD that the fuel injected during pilot injection is closer to the piston lip while the fuel plumes from main injection are developing at the center of the chamber. The auto ignition initiates in the pilot fuel mass. As the piston moves toward TDC, at −9 CAD and −8 CAD, the auto ignition kernel develops along the distributed pilot fuel and starts engulfing the spray plumes from the main injection. In the case of M-Po, auto-ignition does not take place until TDC (please note the two auto-ignition sites on the underside of the two plumes). However, within a duration of 1 CAD, the auto ignition occurs in the vicinity of all the spray plumes resulting in a high level of heat release and pressure rise explaining the reason for higher initial HRR in the case of M-Po compared to the other cases. Comparing the location of auto ignition sites of EP strategy (Figure 8) with that of LI strategy (Figure 19), it can be seen that the combustion initiates in the bowl for the LI strategy whereas the EP strategy has it closer to the liner. Potentially, this could minimize the effect of liner temperature and wall heat transfer characteristics on the premixed combustion behavior in the LI strategy. This is likely the reason for more accurate prediction of combustion behavior (like the ignition delay, initial slope of the HRR curve, CA50 etc.) for LI strategy compared to the EP strategy.
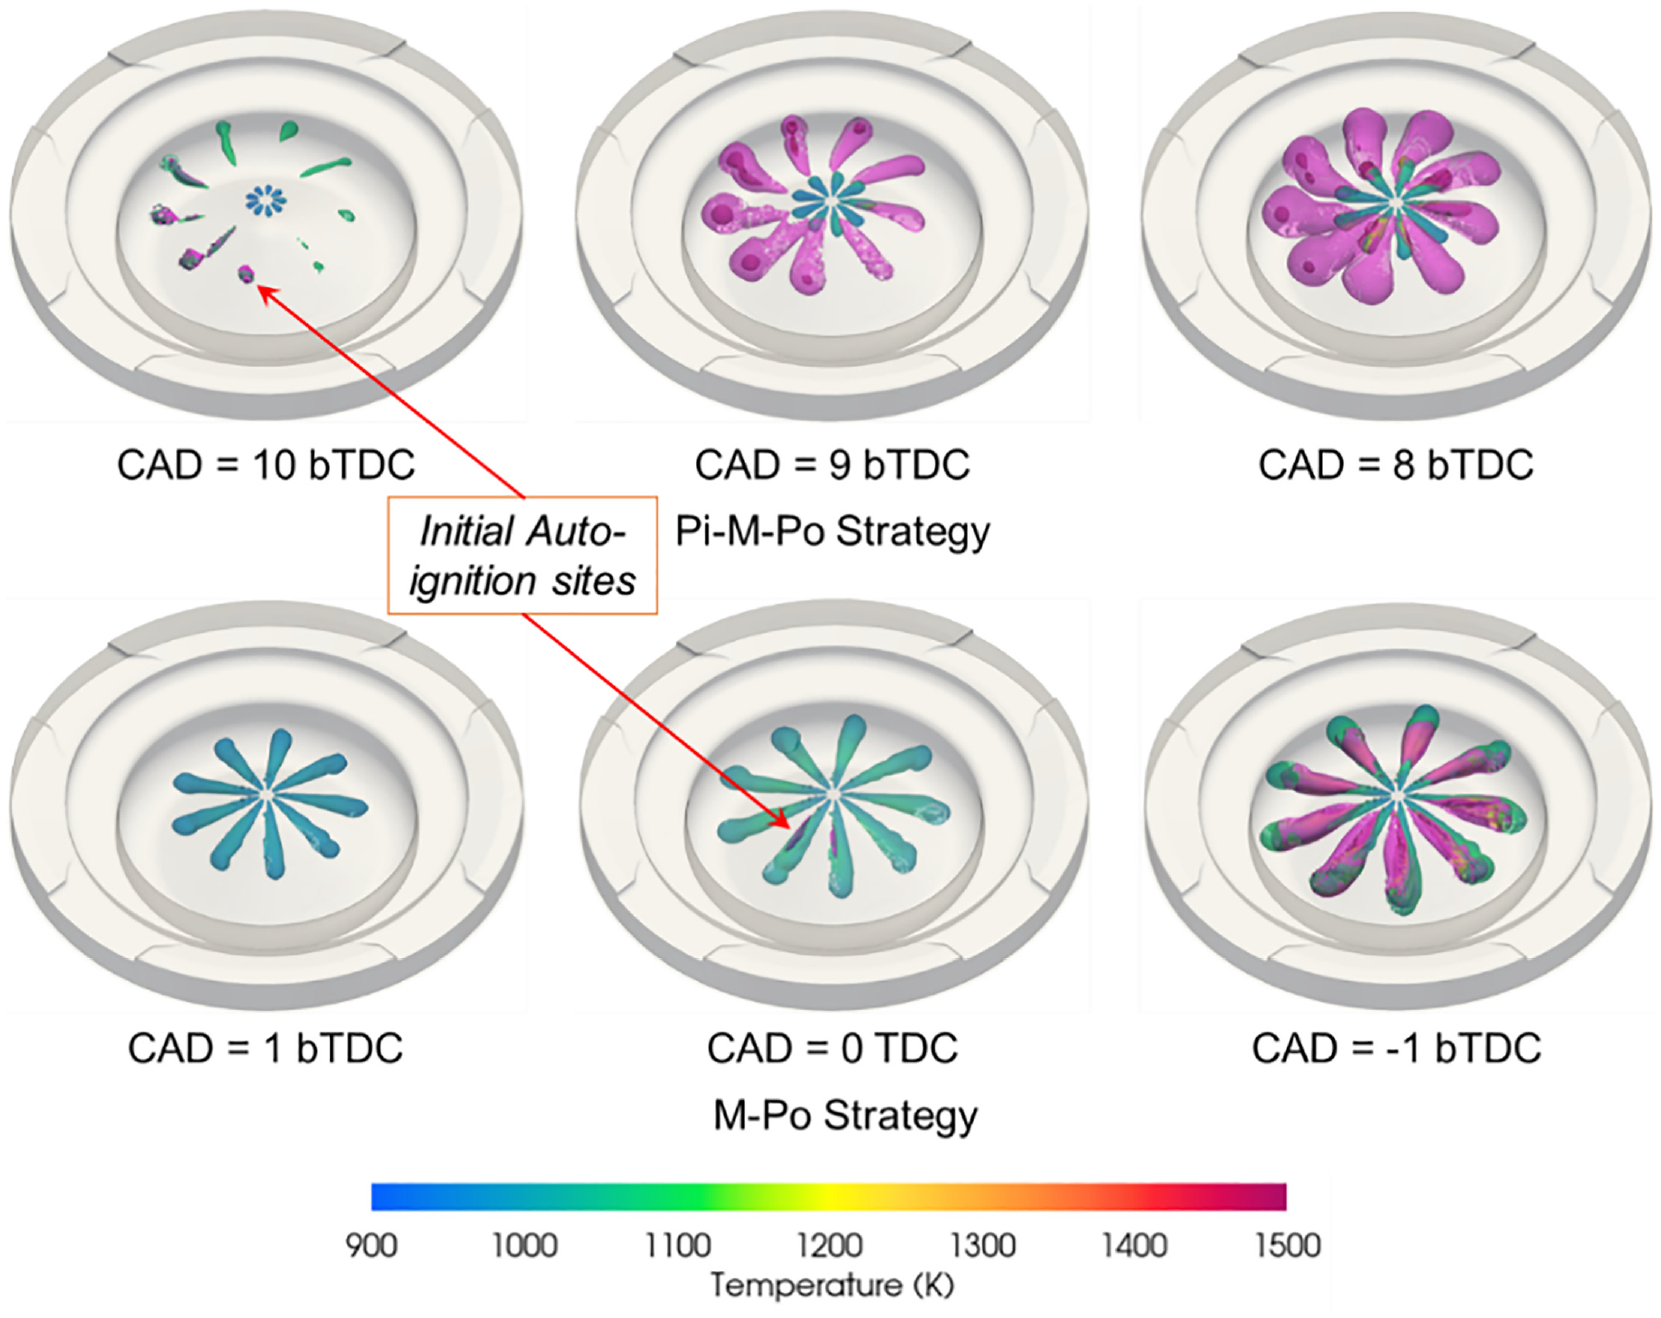
Auto ignition in Pi-M-Po and M-Po strategies. (Color notation is same as that of Figure 8).
LI strategy – injection timing sweep
Simulations were carried out at different injection timings for Pi-M-Po strategy in order to gain further confidence in the CFD methodology. The injection timing was modified for all the injection pulses simultaneously to carry out this set of simulations. Figure 20 shows the comparison of the in-cylinder pressure and HRR at different injection timings for the set of simulations along with the nominal injection timings. It can be observed from Figure 20 that the simulations capture the in-cylinder pressure and HRR quite well over the entire injection-timing sweep. Figure 21 shows the comparison of the IMEP and ITE at different injection timings. SOI-4 has similar injection timings as that of the baseline case of Pi-M-Po shown in Figure 17, and therefore, its combustion and performance characteristics are not shown again in Figures 20 and 21. It is also to be noted that the pressure and temperature conditions at the inlet and exhaust boundaries for this set of simulations are the same as that of the baseline case. Therefore, some uncertainties in terms of the mass trapped exist, which may result in an error in the performance characteristics. Although the simulations show some difference in the performance characteristics compared to the experiments at early SOIs, the overall trends of the performance characteristics are well captured by the CFD model. From the above discussion, it can be concluded that the CFD methodology is able to capture the combustion and performance characteristics of the LI strategy over a wide range of operating conditions.
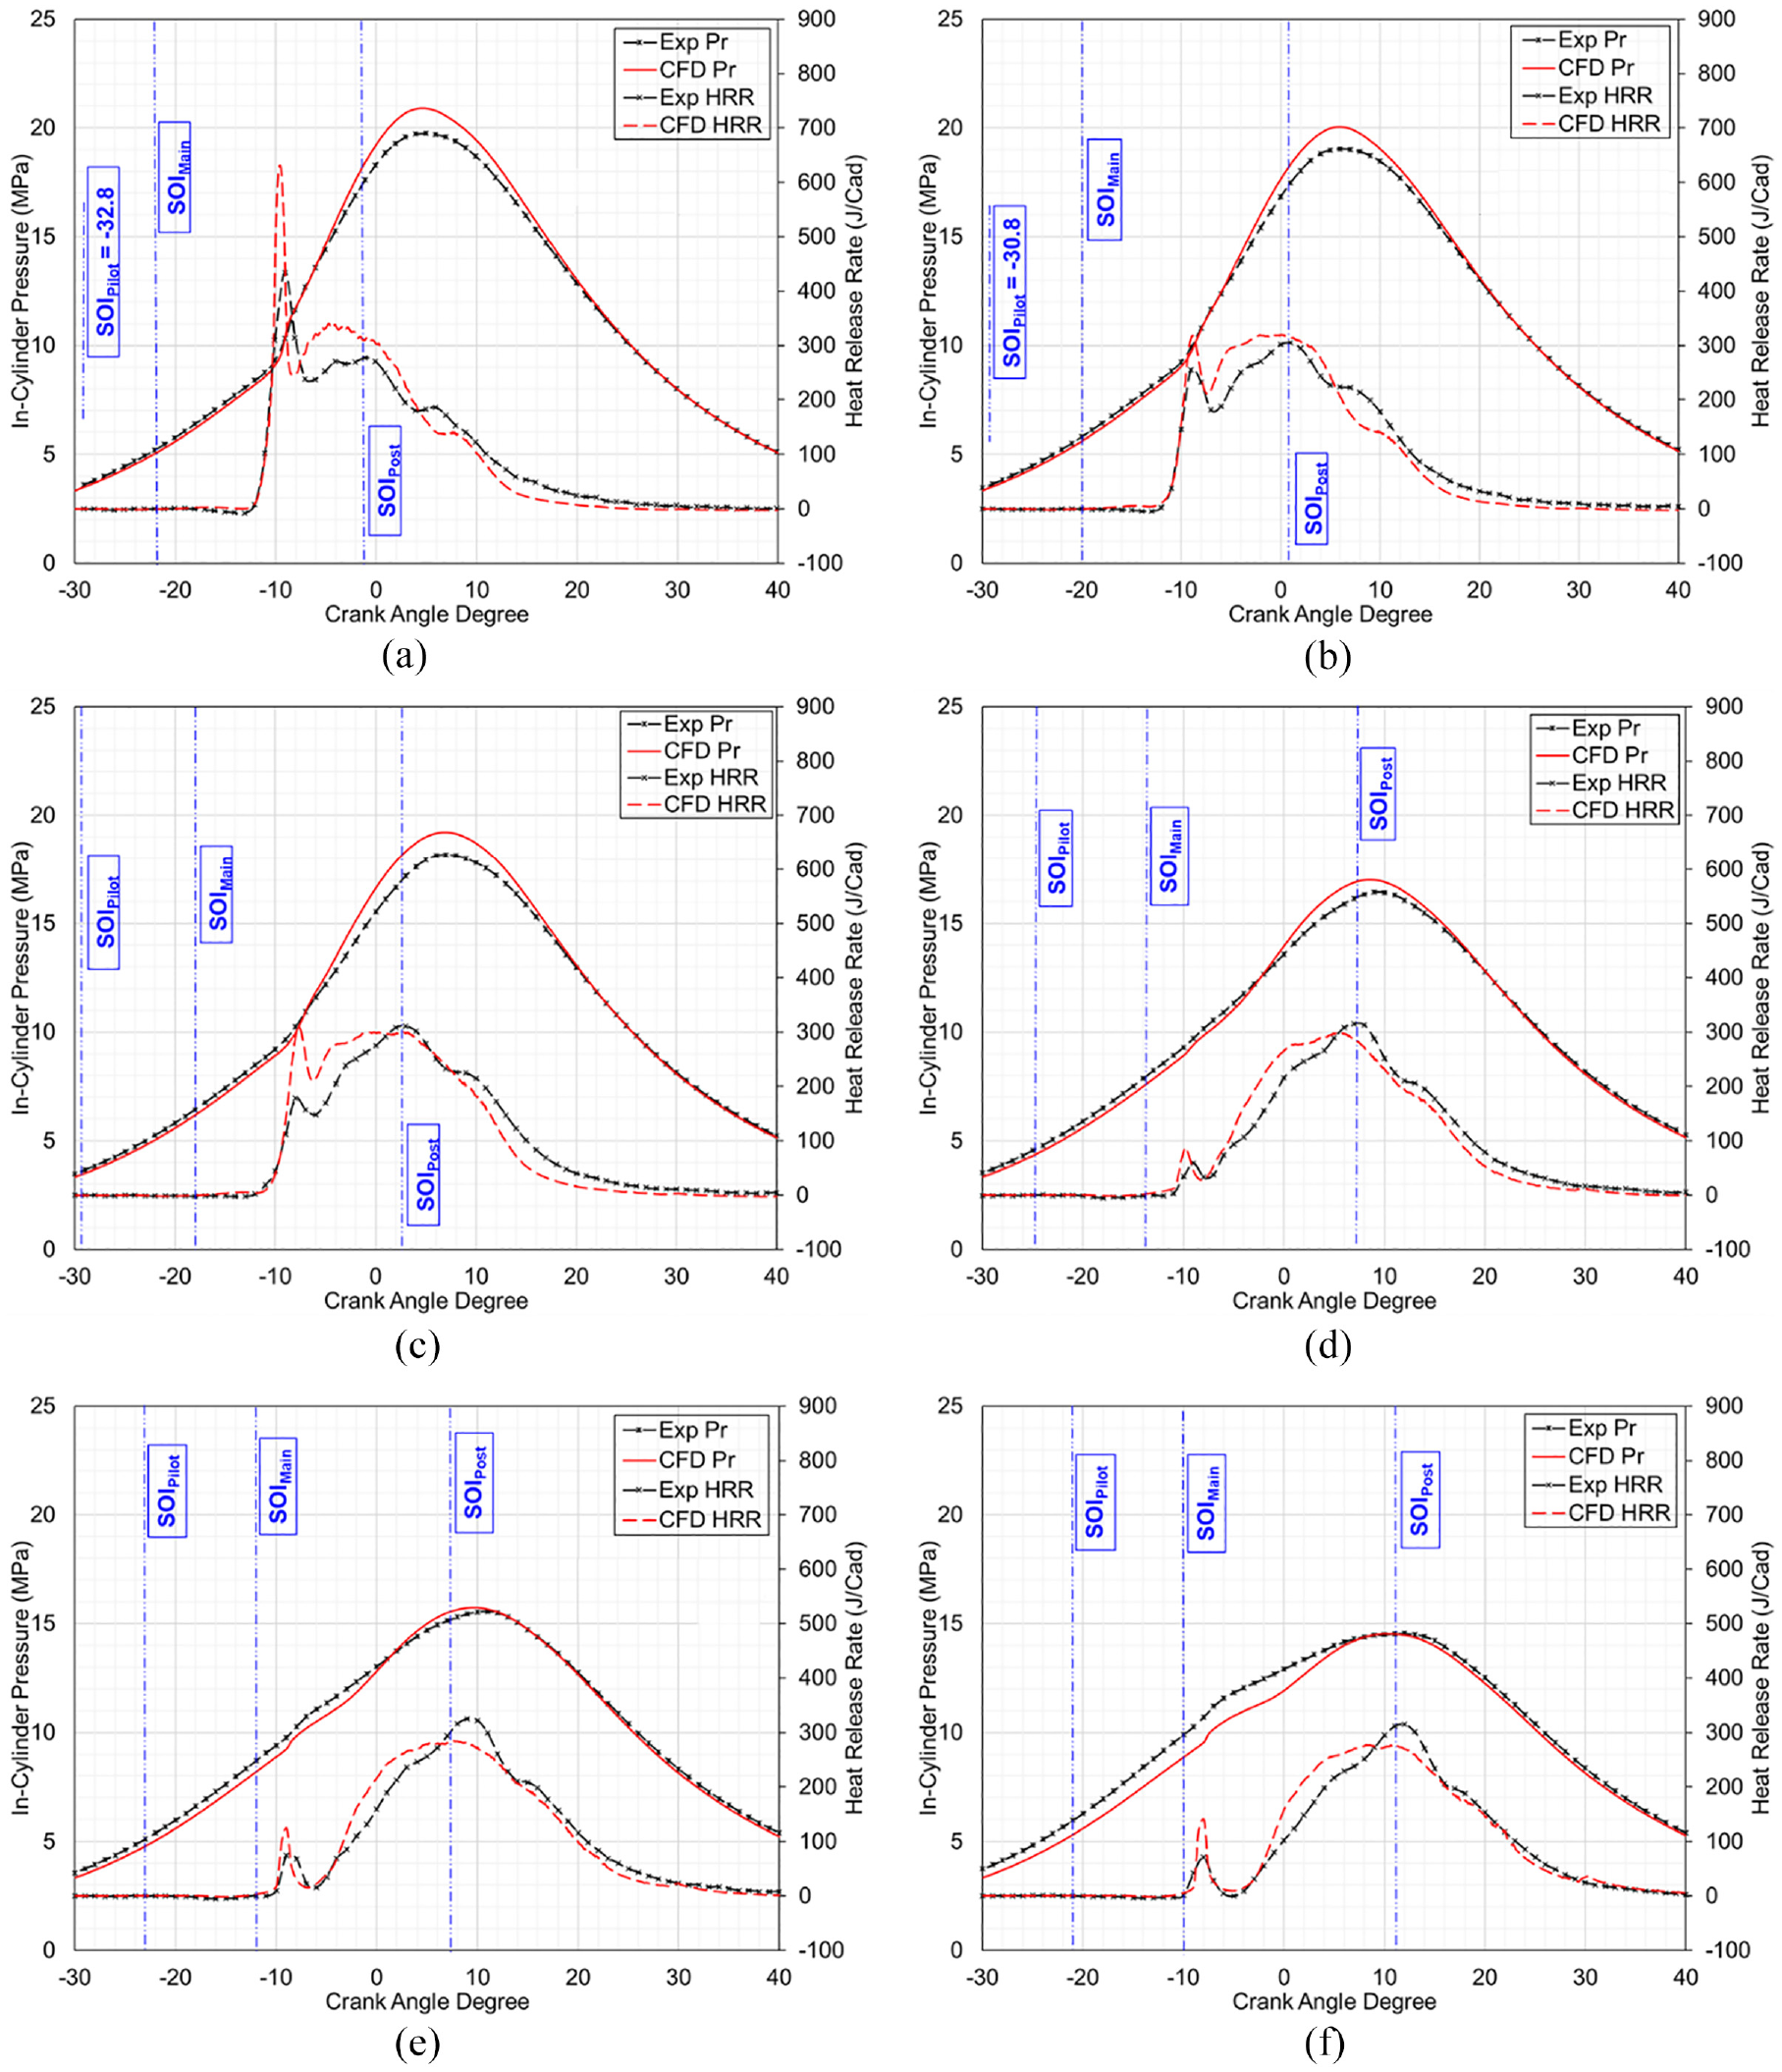
Comparison of in-cylinder pressure and HRR for Pi-M-Po case at different injection timings: (a) SOI-1, (b) SOI-2, (c) SOI-3, (d) SOI-5, (e) SOI-6, and (f) SOI-7.
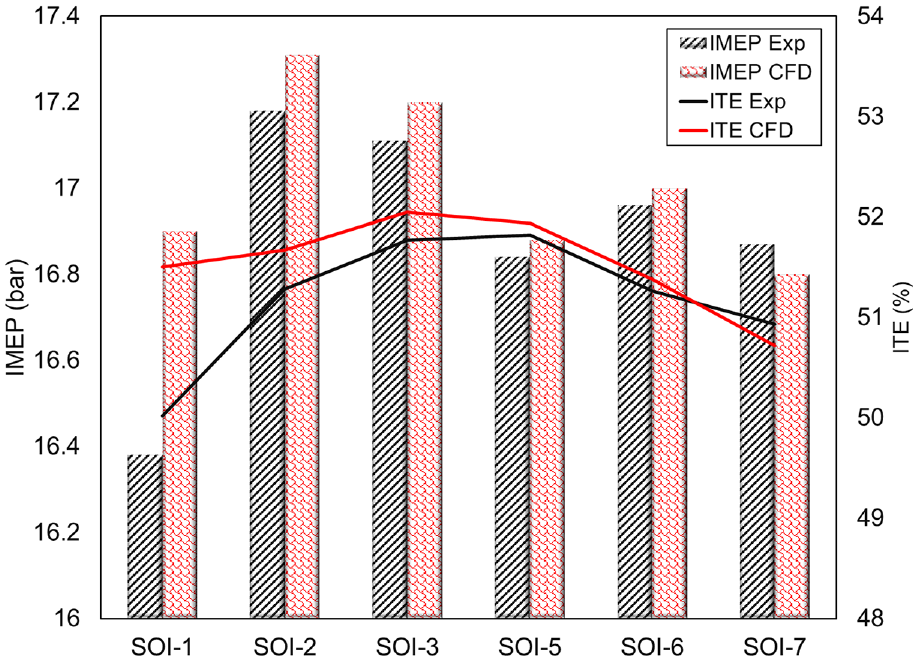
Comparison of IMEP and ITE for Pi-M-Po case at different injection timings.
Unburned hydrocarbon (UHC) and carbon monoxide (CO) emissions for different LI cases
Figure 22 shows the UHC and CO emissions for different LI cases. It can be observed that the Pi-M-Po case has the least UHC and CO emissions compared to the other cases (including those of the EP cases). It is also observed that the UHC emissions of the Pi-M case are comparable with that of the Pi-M-Po case. Further, the CO emissions for the LI cases are an order of magnitude lower than those of the EP cases. The difference in the quantity of emissions for various cases presented in this study are expected to be because of the differences in the injection strategies. However, a thorough comparison between the experimental and the simulation results is warranted in order to understand the emission behavior more accurately.
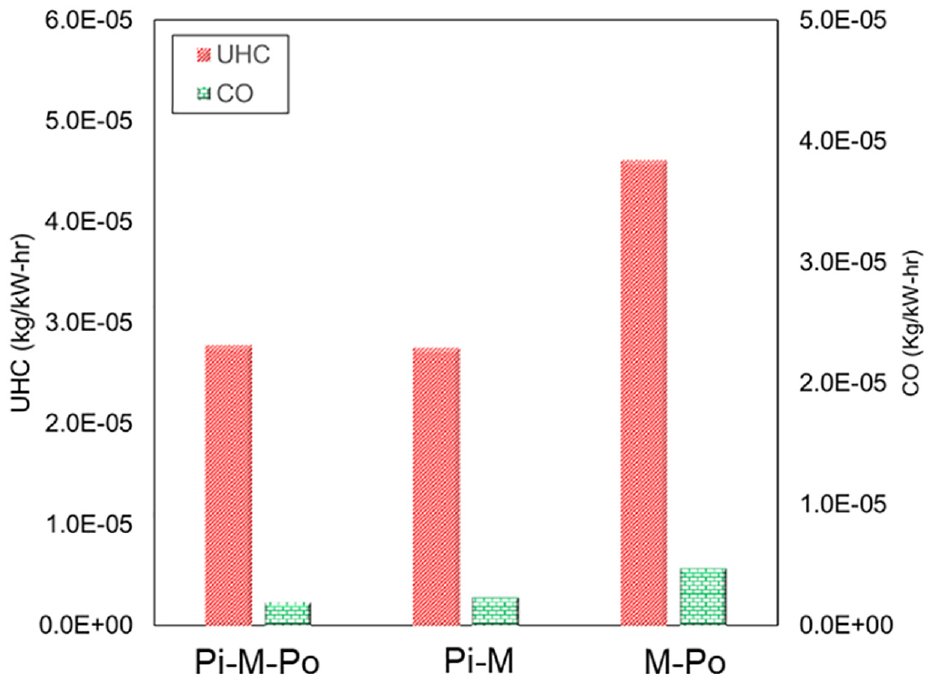
Comparison of UHC and CO emissions for different LI cases.
Conclusions
In this paper, CFD simulations were carried out to model the combustion process in a heavy-duty GCI engine. Different injection strategies viz., LI and EP have been studied to understand their effect on the combustion and performance of the engine. Two chemical mechanisms viz., Andrae and Liu mechanisms were used to compare their ability to model the combustion process at different injection strategies. The simulations were found to capture the experimental combustion and performance characteristics quite well. The following conclusions are drawn from this study:
Andrae mechanism was found to capture the ignition delay and combustion behavior more accurately for the range of simulations compared to Liu mechanism for EP strategy.
There are fundamental differences in the process of combustion initiation for the two injection strategies. The auto-ignition starts closer to the center of the chamber for the LI strategy, whereas it starts near the periphery of the chamber for the EP case. This is likely found to influence the premixed combustion behavior in the EP case, especially at higher pilot mass fractions. However, further analysis is required to understand the effect of liner temperature and heat transfer model on the premixed combustion behavior for EP case at higher pilot fuel mass fractions.
Combustion and performance characteristics are sensitive to the pilot injection mass fraction in both LI and EP strategies. In the EP strategy, higher pilot mass fraction was found to marginally shorten the ignition delay and significantly rise the magnitude of premixed heat release rate. In the LI strategy, a higher pilot mass fraction was not found to result in shorter ignition delay, however, the magnitude of premixed heat release increased.
LI strategy with three injection pulses results in higher IMEP and ITE compared to all the other cases which is because of smoother HRR profiles.
The authors acknowledge that there is a scope to improve the current computational methodology; especially for EP simulations with higher pilot injection mass fractions, however that requires more accurate information on the boundary conditions and mass split across the different injection pulses along with better estimations of wall temperature and heat transfer characteristics. Further studies should focus on the modeling and analysis of heat transfer losses to improve computational methodology. The computational methodology developed in the present study can be used for optimization studies on the engine to improve its performance further.
Footnotes
Acknowledgements
The authors would like to acknowledge Navistar for their continued partnership in this work through the SuperTruck program and acknowledge Jim Cigler, Raj Kumar, Jer-Sheng (Jason) Chen and Ryan Vojtech for providing the engine geometry and rate of injection data. Special thanks to Buyu Wang for setting up the experiments. The authors also acknowledge Laboratory Computing Resource Center (LCRC) at Argonne National Laboratory for providing computational facility for the CFD simulations carried out in this work. The authors would also like to acknowledge Convergent Science for providing licenses for CONVERGE software.
Declaration of conflicting interests
The author(s) declared no potential conflicts of interest with respect to the research, authorship, and/or publication of this article.
Funding
The author(s) disclosed receipt of the following financial support for the research, authorship, and/or publication of this article: This study was supported by the US Department of Energy (DOE) under cooperative agreement DE-FOA-0001447: ADVANCED SYSTEMS LEVEL TECHNOLOGY DEVELOPMENT, INTEGRATION AND DEMONSTRATION FOR EFFICIENT CLASS 8 TRUCKS (SUPERTRUCK II).