
Abstract
This paper presents a three-dimensional (3-D) computational fluid dynamics (CFD) study of a motored cooperative fuel research (CFR) engine at research octane number (RON) relevant condition. The boundary conditions for 3-D simulations were generated with a one-dimensional GT-Power model. For the first time in literature, a carburetor was added to a virtual CFR engine model with 3-D CFD. Therefore, the proposed setup can simulate the fuel and thermal stratifications inside the engine cylinder with realistic detail. The transient simulations in this work were performed within the Reynolds-averaged Navier-Stokes (RANS) framework with a Realizable k-ε turbulence model. Major conclusions from the present work are: (1) The in-cylinder flow of the CFR engine is swirl-dominated due to the existence of the intake valve shroud. (2) There is a significant amount of liquid droplets entering the cylinder during the intake stroke. The maximum instantaneous amount of liquid for 50% PRF 87 (containing 87% iso-octane and 13% n-heptane (v/v)) and 50% ethanol mixture is indicated to be around 26% of total injected fuel mass. (3) The heat of vaporization (HoV) of the fuel is responsible for creating both temperature and charge stratification inside the cylinder.
Keywords
Introduction
Spark ignition (SI) engine knock is influenced by the interactions between fuel combustion chemistry and engine characteristics. While the combustion chemistry is dependent on fuel properties, the engine characteristics can be sub-divided into three categories: geometric features, operating conditions, and charge preparation. 1 Such a complex parametric dependence prohibits general engine independent quantification of knock propensity for fuels. Therefore, the knocking tendencies of fuels are measured in the Co-operative Fuel Research (CFR) engine. The first CFR engine was built by the Waukesha Engine Company in 1928 and the same design is still used today.
Two different sets of standard ASTM conditions2,3 are used for knock evaluation in CFR engines. The outcome of the experiments at these two conditions are expressed as the research octane number (RON) and the motor octane number (MON). While the RON is supposed to represent the normal road performance of the fuel at moderate inlet air temperature (52°C) and engine speed (600 rpm), the MON is expected to indicate the performance of the fuel at more severe conditions like higher cylinder inlet temperature (149°C) and speed (900 rpm). However, modern turbo/super charged and direct injection SI engines operate close to the RON conditions.4,5 In an elaborate review by Szybist et al., 6 many fuel properties like heat of vaporization (HoV), laminar burning velocity, and octane sensitivity (RON-MON) have been identified to be influential factors for modern SI engines. In order to consider the differences in operating and design conditions of modern engines with respect to the same for CFR engines, Kalghatgi 7 has proposed the concept of octane index (OI = (1–K)×RON + K×MON, where K depends on the engine operating conditions). Despite the differences between modern SI engine operating conditions and standard ASTM conditions,2,3 the CFR engine is still the only fuel standardization tool.
The use of CFR engine for experimental determination of combustion characteristics is common in literature.8–11 However, the numerical simulation of CFR engine is sparse. Recently, García et al. 12 have developed a virtual 1-D model of CFR engine with GT Power. 13 Wolk and Chen 14 simulated partial fuel stratification in a CFR engine running in homogeneous charge compression ignition (HCCI) mode. In this work, 14 the mechanism of partial fuel stratification at ambient and boosted intake pressure conditions was explored with 3-dimensional (3-D) computational fluid dynamics (CFD) simulations. Mauro et al. 15 used closed single cycle CFD simulations of the CFR engine at RON relevant conditions to investigate the heat release during iso-octane combustion. Both the above studies14,15 employed simplified geometries of the CFR engine, without incorporating key features, such as the intake valve shroud, spark plug cavity, and knock meter port cavity. Han et al. 16 also performed closed single cycle 3-D CFD simulations of the CFR engine at RON and MON relevant conditions for PRF/alcohol blends.
Recently, Pal et al. 17 developed a virtual 3-D CFD model of the CFR engine based on the combustion modeling strategy from Pal et al. 18 and incorporated a realistic engine geometry for the first time. In this work, 17 multi-cycle Reynolds-averaged Navier-Stokes (RANS) simulations were performed to predict cycle-averaged combustion characteristics including knocking. The virtual engine predicted the experimentally obtained knock related parameters such as maximum amplitude of pressure oscillations (MAPO), crank angle corresponding to start of knock, and average energy of resonance. Probst et al. 19 utilized the virtual CFR engine model 17 to demonstrate a concurrent perturbation method (CPM) to speed up CFD simulations for predicting cycle-to-cycle variability (CCV) in engine knock. In another recent work, Pal et al. 20 used the virtual CFR engine model to determine the corresponding knock-limited spark advance (KLSA) and 50% burn point (CA50) at the respective KLSA timing for gasoline surrogates blended with di-isobutylene (DIB), isobutanol, and anisole.
Similar to Szybist et al., 6 Pal et al. 20 also showed that along with the RON and MON, laminar burning velocity has a significant influence on the knocking phenomena as well. However, the effects of HoV on knocking was not investigated by Pal et al.17,20 Bestel et al. 21 performed experiments and 3-D CFD modeling of CFR engine, adapting the realistic CFR engine model from Pal et al. 17 The end gas auto ignition was compared between pipeline natural gas and reference methane/hydrogen blends. The 3-D CFD results in this work 21 revealed that (a) the end gas temperature is higher for methane/hydrogen blend and (b) the turbulent flame velocity is similar for both pipeline natural gas and reference methane/hydrogen blends.
Along with fuel properties, the in-cylinder flow conditions that are largely governed by engine geometry and operating conditions also have significant influence on the knocking behavior. Recently, Chen et al. 22 studied the influence of turbulence intensity on SI engine knock with 3-D CFD simulations. In this work, 22 the in-cylinder turbulence intensity was manipulated by varying the initial swirl ratio before compression. A non-monotonic trend of knocking intensity was observed with increasing turbulence intensity. Since turbulence increases flame propagation speed, 23 it was concluded by Chen et al. 22 that the faster flame propagation with increased turbulence resulted in higher compression heating effect on the end-gas and advanced the timing of knock onset. However, when the turbulence intensity increased beyond a certain value, the flame propagation was adequately high to prevent end-gas autoignition due to insufficient reaction time. Such high turbulence inside the combustion chamber may have some detrimental effect on the engine performance as well. In this regard, Hill and Zhang 24 have pointed out that excessive in-cylinder turbulence may decrease volumetric efficiency and increase wall heat loss. Furthermore, from a combustion perspective, increased turbulence intensity may increase noise and NOx emissions. 24
The inhomogeneities (or stratification) in terms of fuel/air ratio inside the cylinder also have considerable impact on SI engine knock. Wang et al. 25 used large eddy simulation (LES) to show that increased fuel stratification decreases the flame propagation speed. As a result of decelerated flame propagation, the pressure oscillation and peak pressure decrease rapidly with the increase in fuel stratification. Li et al. 26 experimentally investigated the effects of blending two fuels with different octane ratings on the knock resistance of a stratified charge SI engine. Li et al. 26 pointed out that engine knock can be suppressed if the higher octane fuel is present with increased concentration in the end gas.
A stratified flame ignition (SFI) hybrid combustion technique was investigated by Wang et al.27,28 that utilizes the charge stratification effect on in-cylinder combustion. During such a hybrid combustion mode, direct injection is used to form a rich mixture around the spark plug while port fuel injection supplies lean homogenous mixture throughout the cylinder. This way, the rich mixture provides combustion stability, and the slower flame propagation prevents auto-ignition in the lean region. Such a two-zone (i.e. rich spark plug and lean end-gas zone) combustion concept has also been investigated both numerically and experimentally by Bai et al. 29 It was observed in this work 29 that the two-zone combustion strategy suppressed knock, lowered hydrocarbon and NOx emissions, but increased carbon monoxide (CO) emission.
The effects of temperature stratification on knock development has been studied extensively by Griffiths and Whitaker30,31 and Pöschl and Sattelmayer. 32 Recently, the maximum pressure oscillation amplitude (MAPO) value was found to decrease significantly with medium to high levels of temperature stratification by Wang et al. 25 However, increased temperature inhomogeneity also promotes the occurrence of auto-ignition kernels in the unburnt fuel/air mixture.25,33 Shahanaghi et al. 34 investigated different ignition scenarios of the end-gas using an elemental problem of sinusoidally varying temperature profile in SI engine context. Fuel mixtures containing 87% iso-octane/13% n-heptane (v/v) and 62% iso-octane/18% n-heptane/20% ethanol (v/v) were used for comparison in this study. 34 It was pointed out that the possibility of deflagrating combustion is higher with ethanol blending for similar temperature stratification. Furthermore, it was also shown that both thermal diffusion and chemical kinetics are important contributors to knocking for stratified temperature conditions.
Ghaderi Masouleh et al. 35 demonstrated with LES on an engine-like setup that temperature stratification contributes toward the cycle-to-cycle variations (CCVs) in SI flame front propagation also. It was pointed out in this work 35 that CCVs are more severe if the spark plug is near the wall as wall heat transfer increases thermal stratification. Chen et al. 36 performed a multi-cycle LES study to understand the cyclic variability of auto-ignition kernel development and propagation of pressure waves under mild and heavy knock conditions in a gasoline-fueled DISI engine. A three-component toluene primary reference fuel (TPRF) was used to represent fuel chemistry.
It is evident from the abovementioned literature review that both fuel and thermal stratification are heavily influential factors to SI engine knock. The CFR engines are the sole global tools for standardization of gasoline knocking tendency. Despite CFR engines being carbureted, 3-D CFD simulations assuming homogeneous gaseous fuel/air mixture have mostly been performed in literature. Although Thiart et al. 37 have shown the existence of thermal and charge stratifications in the CFR engine, the 3-D CFD model was used for simulating only a single cycle in that study. 37 Therefore, the literature lacks information on real in-cylinder conditions within CFR engines.
Considering the gaps in literature, a realistic 3-D CFD model of gasoline CFR engine capable of simulating charge and thermal stratification at RON relevant conditions is presented in the present work. A schematic representation of this model is shown in Figure 1. As shown in the figure, only non-reactive cold flow has been simulated here. Moreover, a 1-D model of the CFR engine has also been developed to aid the 3-D CFD simulations. Both 1-D and 3-D models have been validated with experimental data from a standard industrial CFR engine. Additional validations have been done for the numerical setup used in the 3-D CFD simulations. To obtain experimental data for the cold flow condition, the CFR engine setup was run with deactivated spark plug immediately after the fired cycles. 38 The following research objectives are pursued here for motored CFR engines at RON relevant conditions:
Preparation of a validated 3-D CFD model
Characterization of the in-cylinder flow field
The effects of HoV of ethanol on (a) average cylinder temperature, (b) thermal stratification, and (c) mixture stratification
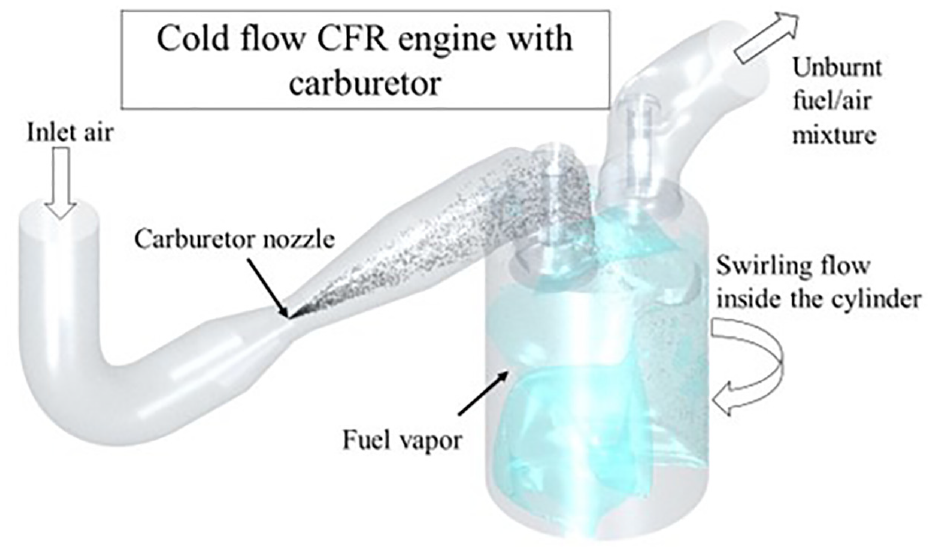
Schematic of the non-reacting CFR engine analyzed in the present work.
Since the primary reference fuel (PRF) mixtures are used as reference fuels during octane rating evaluation, the PRF 87 mixture containing 87% iso-octane and 13% n-heptane (v/v) has been used in this work as a base fuel. Moreover, the effect of ethanol blending has been assessed by comparing the PRF 87 case with 75% PRF 87/25% Ethanol and 50% PRF 87/50% Ethanol blends.
CFR engine experiments
The main purpose of the CFR engine experiments in this work was to generate data for input and validation of the numerical setup. Detailed description of the experimental setup (located at Neste Oyj) can be found in the recent work by Keskinen et al. 38 Major design features of the CFR engine are shown in Table 1. Moreover, as shown in Table 1, the experiments were performed at RON relevant engine speed, intake pressure, and temperature 38 conditions. However, as mentioned earlier, the spark plug was deactivated to create cold flow conditions during the measurements.
CFR engine specifications and octane number measurement methods.
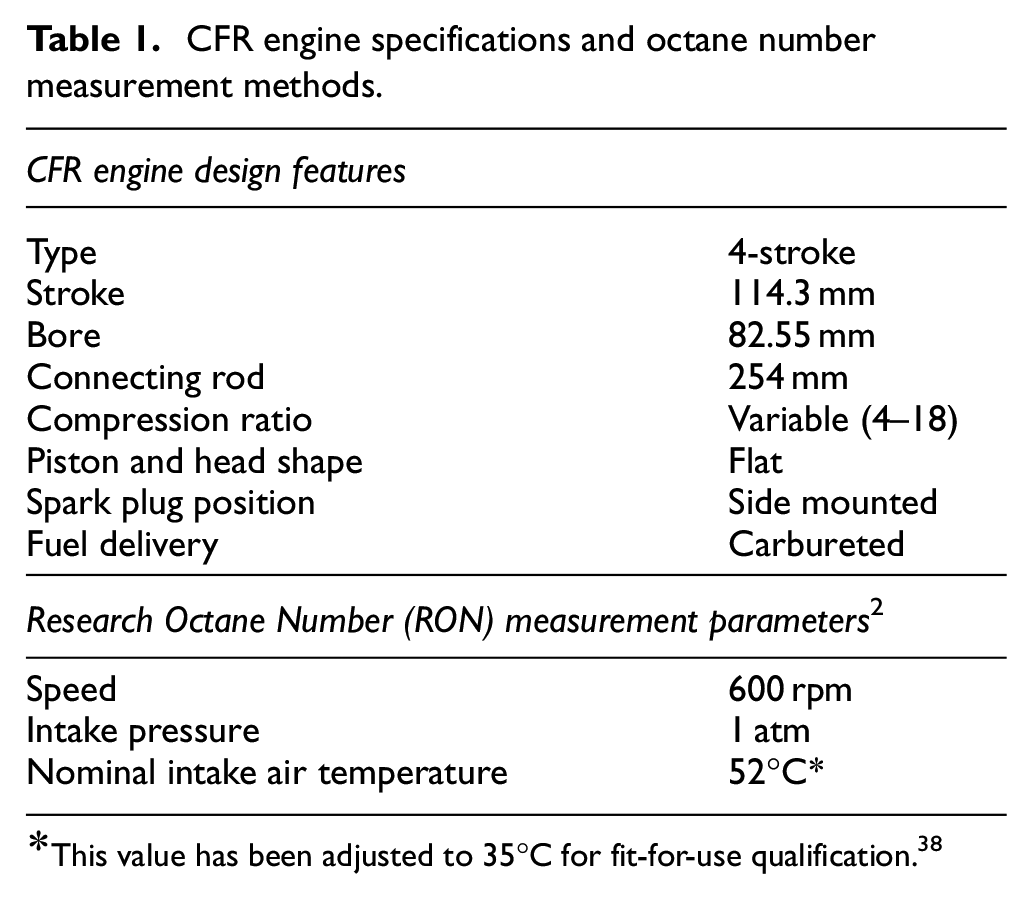
This value has been adjusted to 35°C for fit-for-use qualification. 38
The spark plug deactivation was done immediately after the combustion cycles to include the effects of wall heating on charge mixing. In order to ensure that the cylinder walls are heated during the motored operation, only 250 cycles were considered after switching off the spark plug. The motored cylinder pressure was averaged over consecutive cycles for generating the validation data. Additionally, the intake pressure traces and mean temperature after the carburetor were also measured. Finally, the compression ratio (CR) was measured in terms of digital counter reading (DCR) according to the relation
Simulation methodology
1-D CFR engine model
In this study, a 1-D model of the CFR engine was developed using GT-Power by Gamma Technologies. 13 Figure 2 shows the schematic description of the model. The main purpose of the 1-D CFR engine computations was to estimate the initial and boundary conditions for the 3-D CFD simulations. In the GT-Power model, intake and exhaust systems were modeled as 1-D fluid flows. The intake and exhaust valve lift profiles were adopted from the doctoral thesis of Foong. 39 Varying cross section for the carburetor, pressure loss, and wall heat transfer were also considered. Different fuel blends were constructed as homogeneous liquid mixtures with mass or volume weighted properties. A simplified carburetor model was considered for the present study based on the following assumptions:
(1) Mass flow of fuel through the carburetor is driven dynamically between the fuel line and the carburetor throat (venturi)
(2) The fuel delivery rate is controlled by the liquid level hydrostatic pressure. As shown in Figure 2, this fact was implemented in the model through the “lambda controller” feedback loop. This controller maintains the desired in-cylinder equivalence ratio (stoichiometric) by adjusting the fuel flow rate with a variable orifice size
(3) The intake port pressure loss is equal to the experimentally observed pressure drop reported by Keskinen et al. 38
(4) As shown in Figure 2, a temperature controller was incorporated to model the cumulative impact of spray evaporation on intake channel wall temperatures
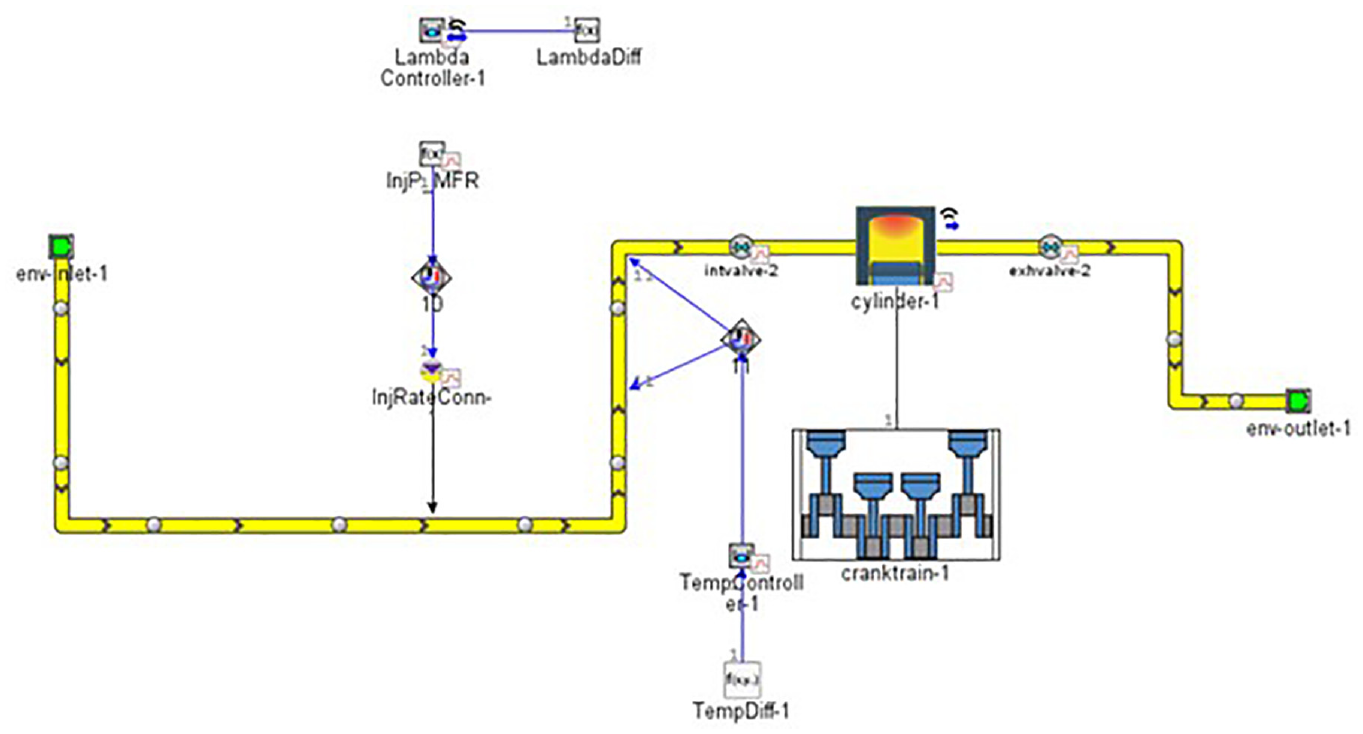
The single cylinder motored CFR engine model in GT-Power.
In the engine cylinder, the wall temperatures were adopted from Pal et al. 17 It has been shown by Lounici et al. 40 that the relatively simple Hohenberg’s correlation 41 provides short convergence time with accurate heat transfer prediction during compression stroke. Therefore, Fagundez et al. 42 also used this model for studying knock in a 4-stroke single-cylinder SI engine. Following these works,40,42 we used the Hohenberg’s correlation 41 to model in-cylinder heat transfer for the present 1-D motored CFR engine model.
3-D CFD model
The computational domain is shown in Figure 3(a) to (c). The geometries shown in Figure 3(a) and (b) were developed from an X-ray scan of the CFR engine head and cylinder assembly. 17 Furthermore, the carburetor shown in Figure 3(c) was modeled according to the dimensions observed from the CFR engine experimental setup at Neste Oyj. 38 The pressure sensor-equipped spark plug geometry was also incorporated as this was employed in the experiment. 38 This way, it was ensured in this work that the computational domain takes the real geometric intricacies into account. Furthermore, the liquid fuel flow rates for the three cases investigated in this work (i.e. PRF 87, 75% PRF 87/25% Ethanol, and 50% PRF 87/50% Ethanol blends in air) are also shown in Figure 3(d) along with the intake valve opening profile. These fuel flow rates were calculated with the 1-D GT-Power model described in the previous section and used as inputs to the 3-D CFD model. With these flow rates, the average equivalence ratio inside the cylinder after the intake valve closure was observed to be approximately 1.2.
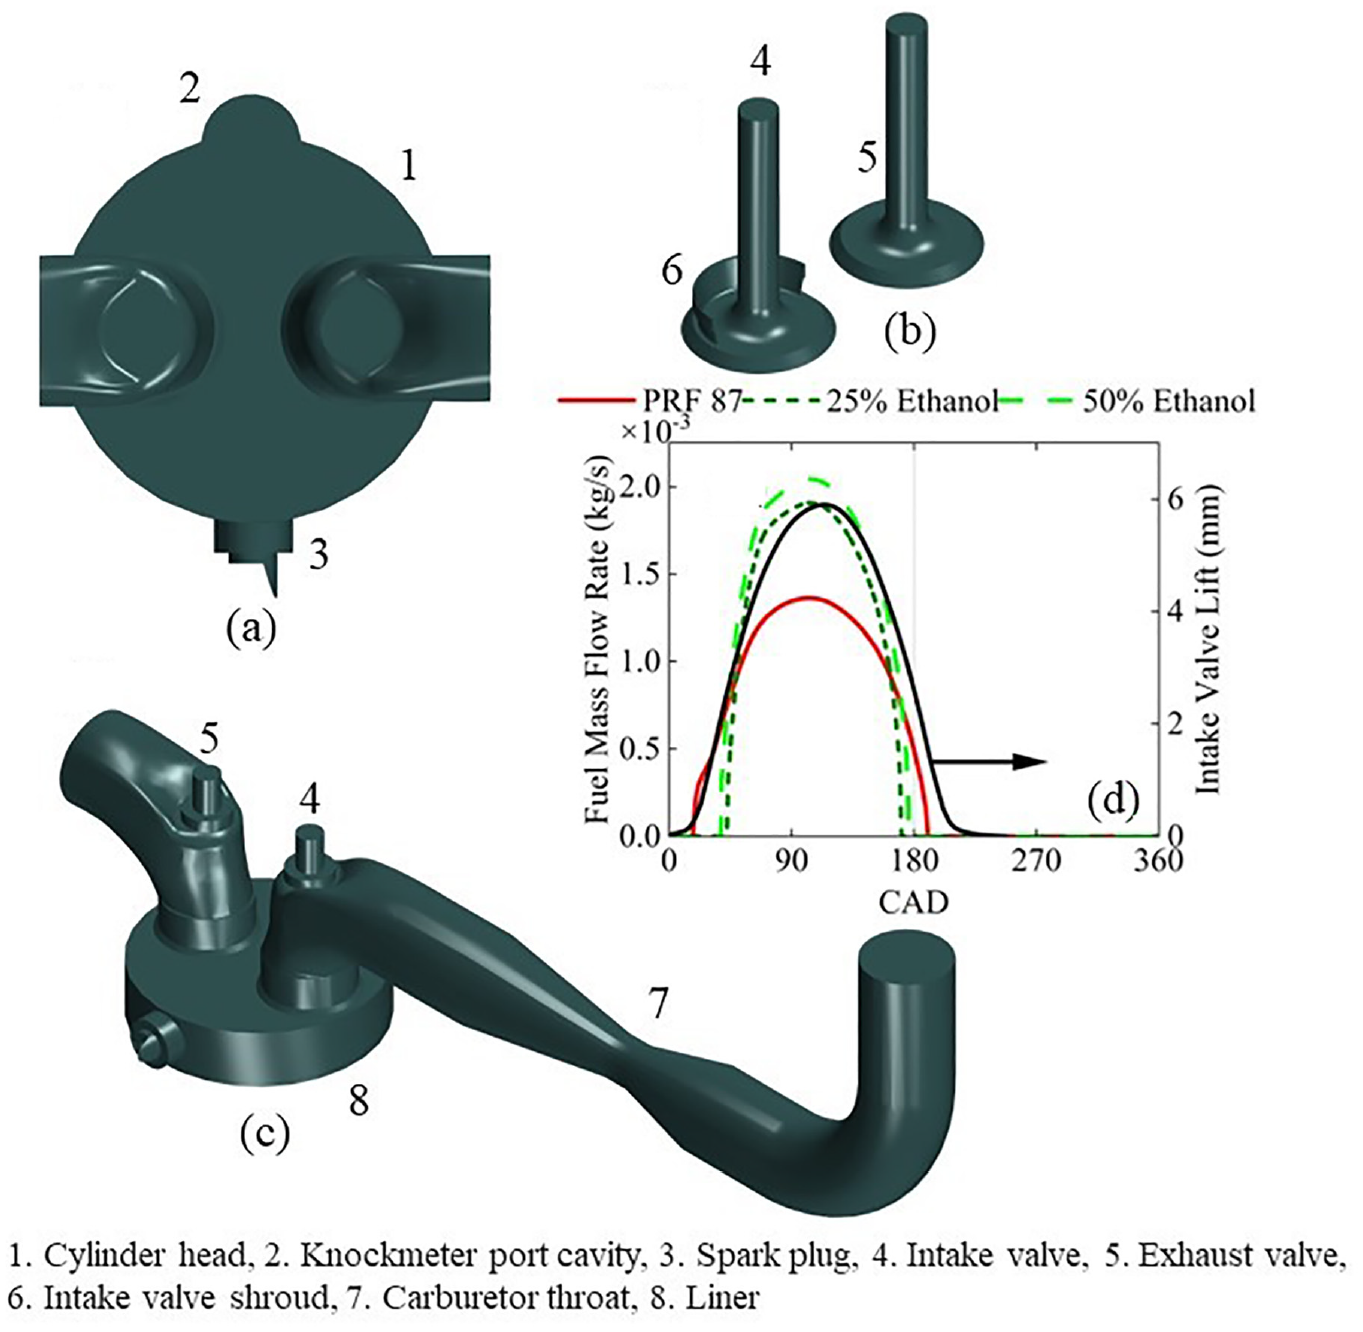
(a–c) Description of the computational domain used in the present work. (d) Mass flow rate of liquid fuel in the carburetor nozzle plotted with the intake valve lift profile.
In the engine cylinder, the following wall temperatures were adopted from Pal et al., 17 liner temperature (Tliner) = 430.1 K, cylinder head temperature including spark plug and knockmeter port cavity (Tcylinder head) = 525.2 K, piston temperature (Tpiston) = 485.2 K, intake valve temperature (Tintake valve) = 464.9 K, and exhaust valve temperature (Texhaust valve) = 519.6 K. Furthermore, the intake port wall is assumed to be at 300 K.
The commercial CFD code STAR-CCM+ v2021.3 43 was used to develop the 3-D numerical model and perform multi-cycle simulations of the CFR engine. The in-cylinder add-on was used to implement piston and valve motion, mesh morphing, and remapping of solution values. For avoiding the effects of initial conditions on the solution, five consecutive cycles were simulated and the results from the fifth cycle were considered for validation and further analysis. Figure 4 shows the mesh used for the computation in this work. It may be noted here that experimental data on the in-cylinder flow field within CFR engine is not available in literature. In the work by Barbato et al., 44 in-cylinder flow fields of the motored Darmstadt engine have been predicted within the RANS framework and validated against experimental data obtained with particle image velocimetry (PIV). It was observed that the RANS results corresponded well to the experimental values. 44 Therefore, the present work primarily adopted the meshing strategy used by Barbato et al. 44 Following the meshing strategy, the valve region was provided with regional mesh refinement (Figure 4) where the mesh size is 50% of the base mesh size. Moreover, 4 prism layers were considered for the near-wall region with a total thickness of 2 mm inside the cylinder. On the other hand, the ports contain 2 prism layers with a total thickness of 1 mm.
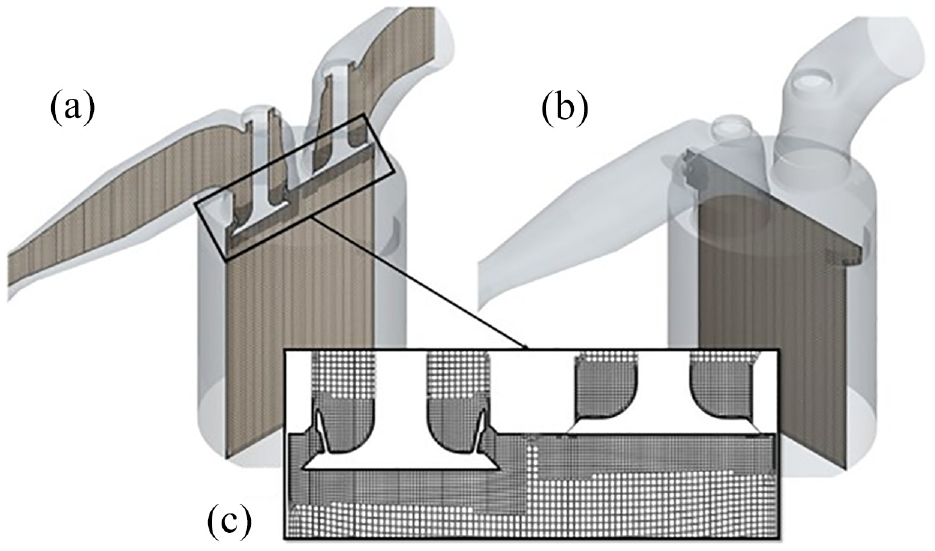
Computational mesh indicating local refinement areas on mid-cylinder planes passing through (a) both valves and (b) spark plug. (c) Local refinement near the valves.
In the present work, the mesh settings were validated against (a) the experimental data on the motored CFR engine cylinder pressure obtained at Neste Oyj 38 and (b) the DNS 45 and experimental 46 data on the non-reacting piston-cylinder assembly of Morse et al. 46 The results of the validation study are discussed the next section. Furthermore, a mesh sensitivity analysis was performed to show the effects of different base mesh sizes on the simulation results that are discussed in the Appendix.
Modeling of the gas flow
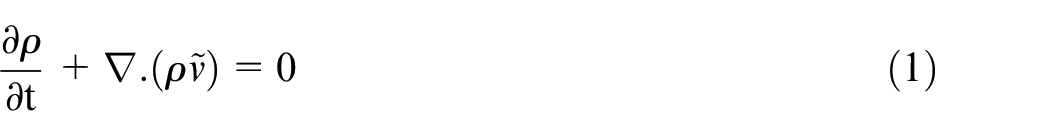
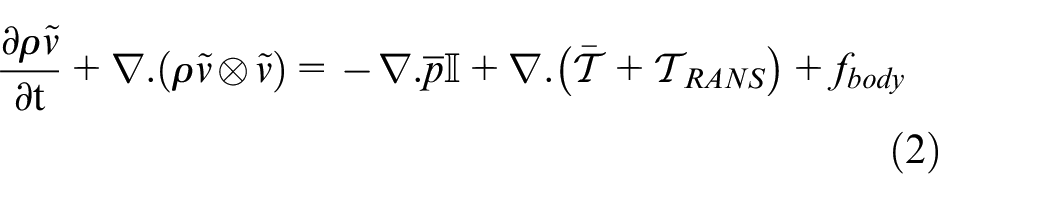
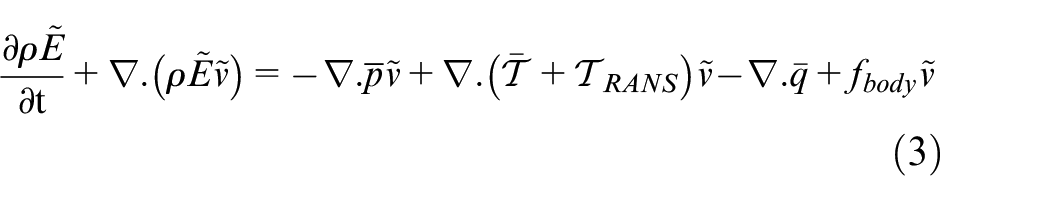
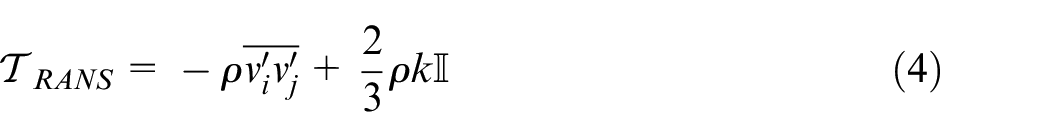
In the present work, the transient 3-D CFD simulations were performed within the unsteady Reynolds-averaged Navier-Stokes (RANS) framework using the pressure implicit with splitting of operators (PISO) algorithm 47 adopted for pressure-velocity coupling. Within the RANS framework, the mean mass, momentum, and energy balance equations can be written as:
Here,
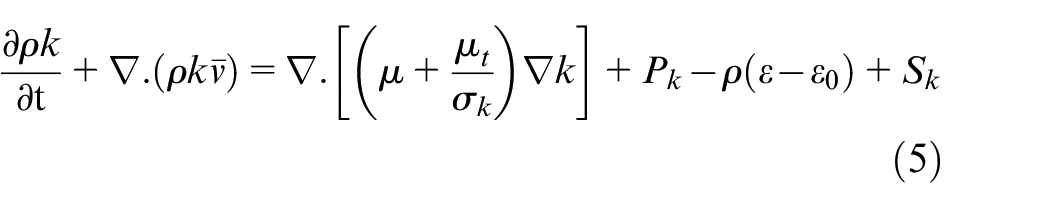
The two-layer version of the Realizable k-
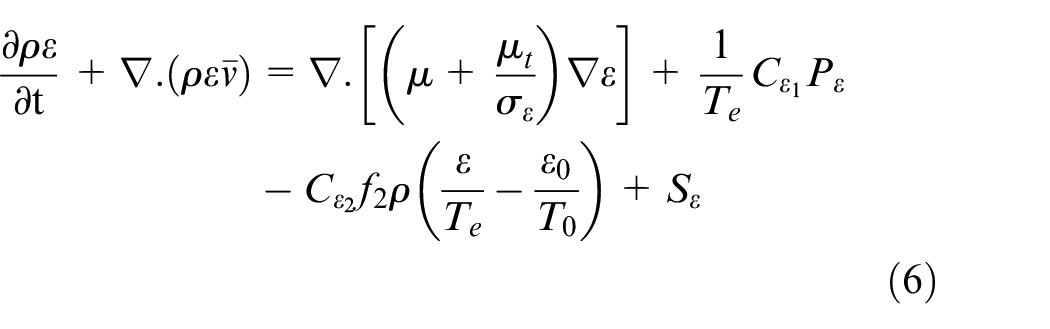
Here, μ is the dynamic viscosity,
In the present analysis, the multicomponent gas mixture was assumed to be ideal. Sutherland’s law was used for the calculation of dynamic viscosity. The thermal conductivity was determined from the assumption of unity Lewis number. The second order upwind discretization scheme embedded in STAR-CCM+ 43 was used for flow, energy, and species balance equations. The two-layer all-y+ wall treatment was adopted for predicting wall stress and turbulence parameters across the wall boundary layers. In the two-layer all-y+ wall treatment approach, blended wall functions consisting of low-y+ wall treatment for fine meshes, and high-y+ wall treatment for coarse meshes were implemented. The wall heat flux was calculated with the GruMO-UniMORE wall treatment approach.50,51 Finally, the time steps were chosen in a way to ensure Courant number values less than unity inside the cylinder, intake, and exhaust port. In some cells near the intake and exhaust valve openings, the Courant number was allowed to be higher than unity at certain time steps during the intake and exhaust stroke, respectively. However, this fact had minimum influence on the in-cylinder conditions.
Modeling of the carburetor fuel delivery system
In the present work, a simplified carburetor model was implemented with a single nozzle placed centrally at the carburetor throat. According to the standard procedures 2 , the nozzle and throat diameters were chosen to be 1.27 and 12.7 mm, respectively. It may be mentioned here that the literature does not contain any data on fuel delivery from the carburetor nozzle. Therefore, we have modeled the fuel flow as a low velocity spray with the following parameters: (a) spray cone angle is 2° and (b) liquid droplets have a constant diameter of 60 μm, and (c) liquid temperature before injection is 292.5 K. As the carburetor uses the pressure drop created at the throat to deliver fuel, the small spray cone angle is a reasonable approximation of the reality. The liquid temperature may also be justified from the fact that the liquid is supposed to be delivered at ambient temperature.
For the droplet size, a sensitivity analysis was performed. As the droplet size was changed, the highest impact was observed on the liquid fuel entering the cylinder. The variations are shown in Figure A1 in Appendix. It is clear from the figure that the changes in liquid mass inside the cylinder due to variations in droplet size are minimal. It was observed from the droplet sensitivity analysis that the results such as flow field and fuel distribution are not influenced significantly if the droplet size is varied between 40 and 80 μm.
For modeling droplet evaporation, the classical Spalding droplet evaporation theory 52 was adopted. According to this theory, the rate of change of droplet mass due to quasi-steady evaporation may be expressed as:

Here, d = droplet diameter,
Validation and mesh sensitivity study
The validation of the numerical setup described above was done in two steps. In the first step, the experimentally obtained average cylinder pressure profile from a CFR engine was used as a validation target. Figure 5 shows the comparison of the predicted and the measured values. It is clear from the figure that both the 1-D GT-Power and 3-D CFD model describe the cylinder pressure trace in an acceptable manner.
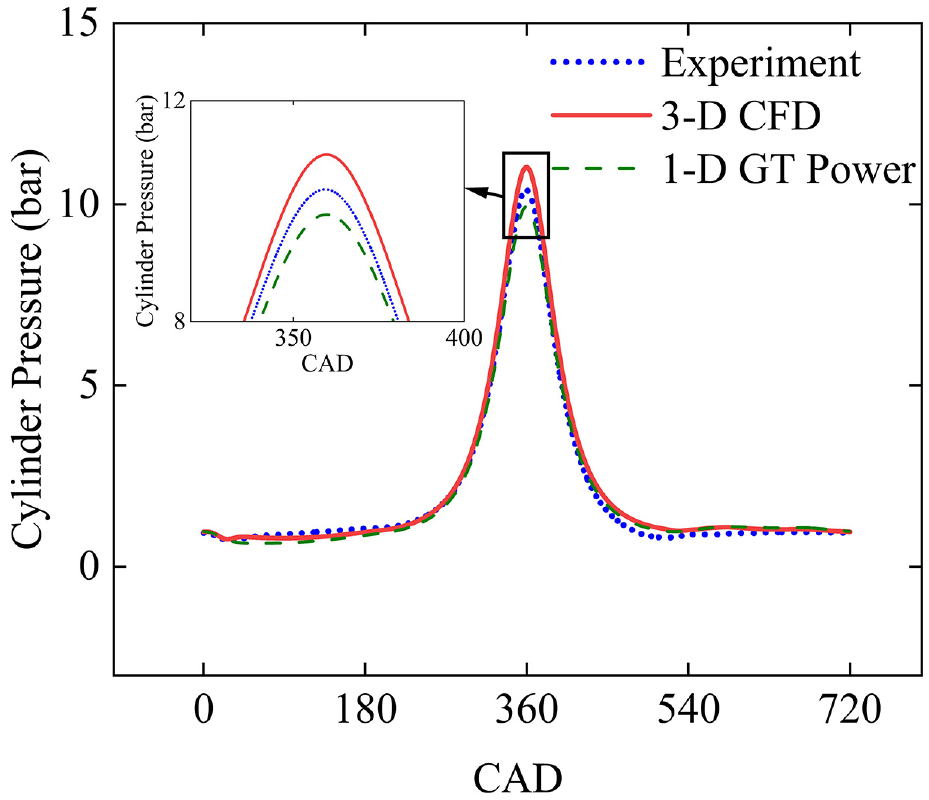
Comparison of computed pressure trace with the corresponding experimental data from motored CFR engine test.
After the validation of the model against experimentally obtained average cylinder pressure data, further validations were performed against the direct numerical simulation (DNS) data of Schmitt et al. 45 Here, simulations were performed in an axisymmetric, non-reacting piston-cylinder assembly from the work of Morse et al. 46 The Morse et al. 46 setup was used multiple times in the past to investigate different numerical configurations in CFD.58,59 In this case, the valve remains fixed and only the piston is moving creating a high velocity flow across the valve. Other geometrical details of this engine may be found in Ghaderi Masouleh et al. 35 and Schmitt et al. 45
For the validation of the Morse et al.
46
case, a similar meshing strategy was used as in Figure 4 including near-wall cell sizes. In addition, the same turbulence and wall models were used between the CFR engine and the Morse et al. cases. Figure 6(b) to (d) shows the comparison of radial distribution of axial velocity (
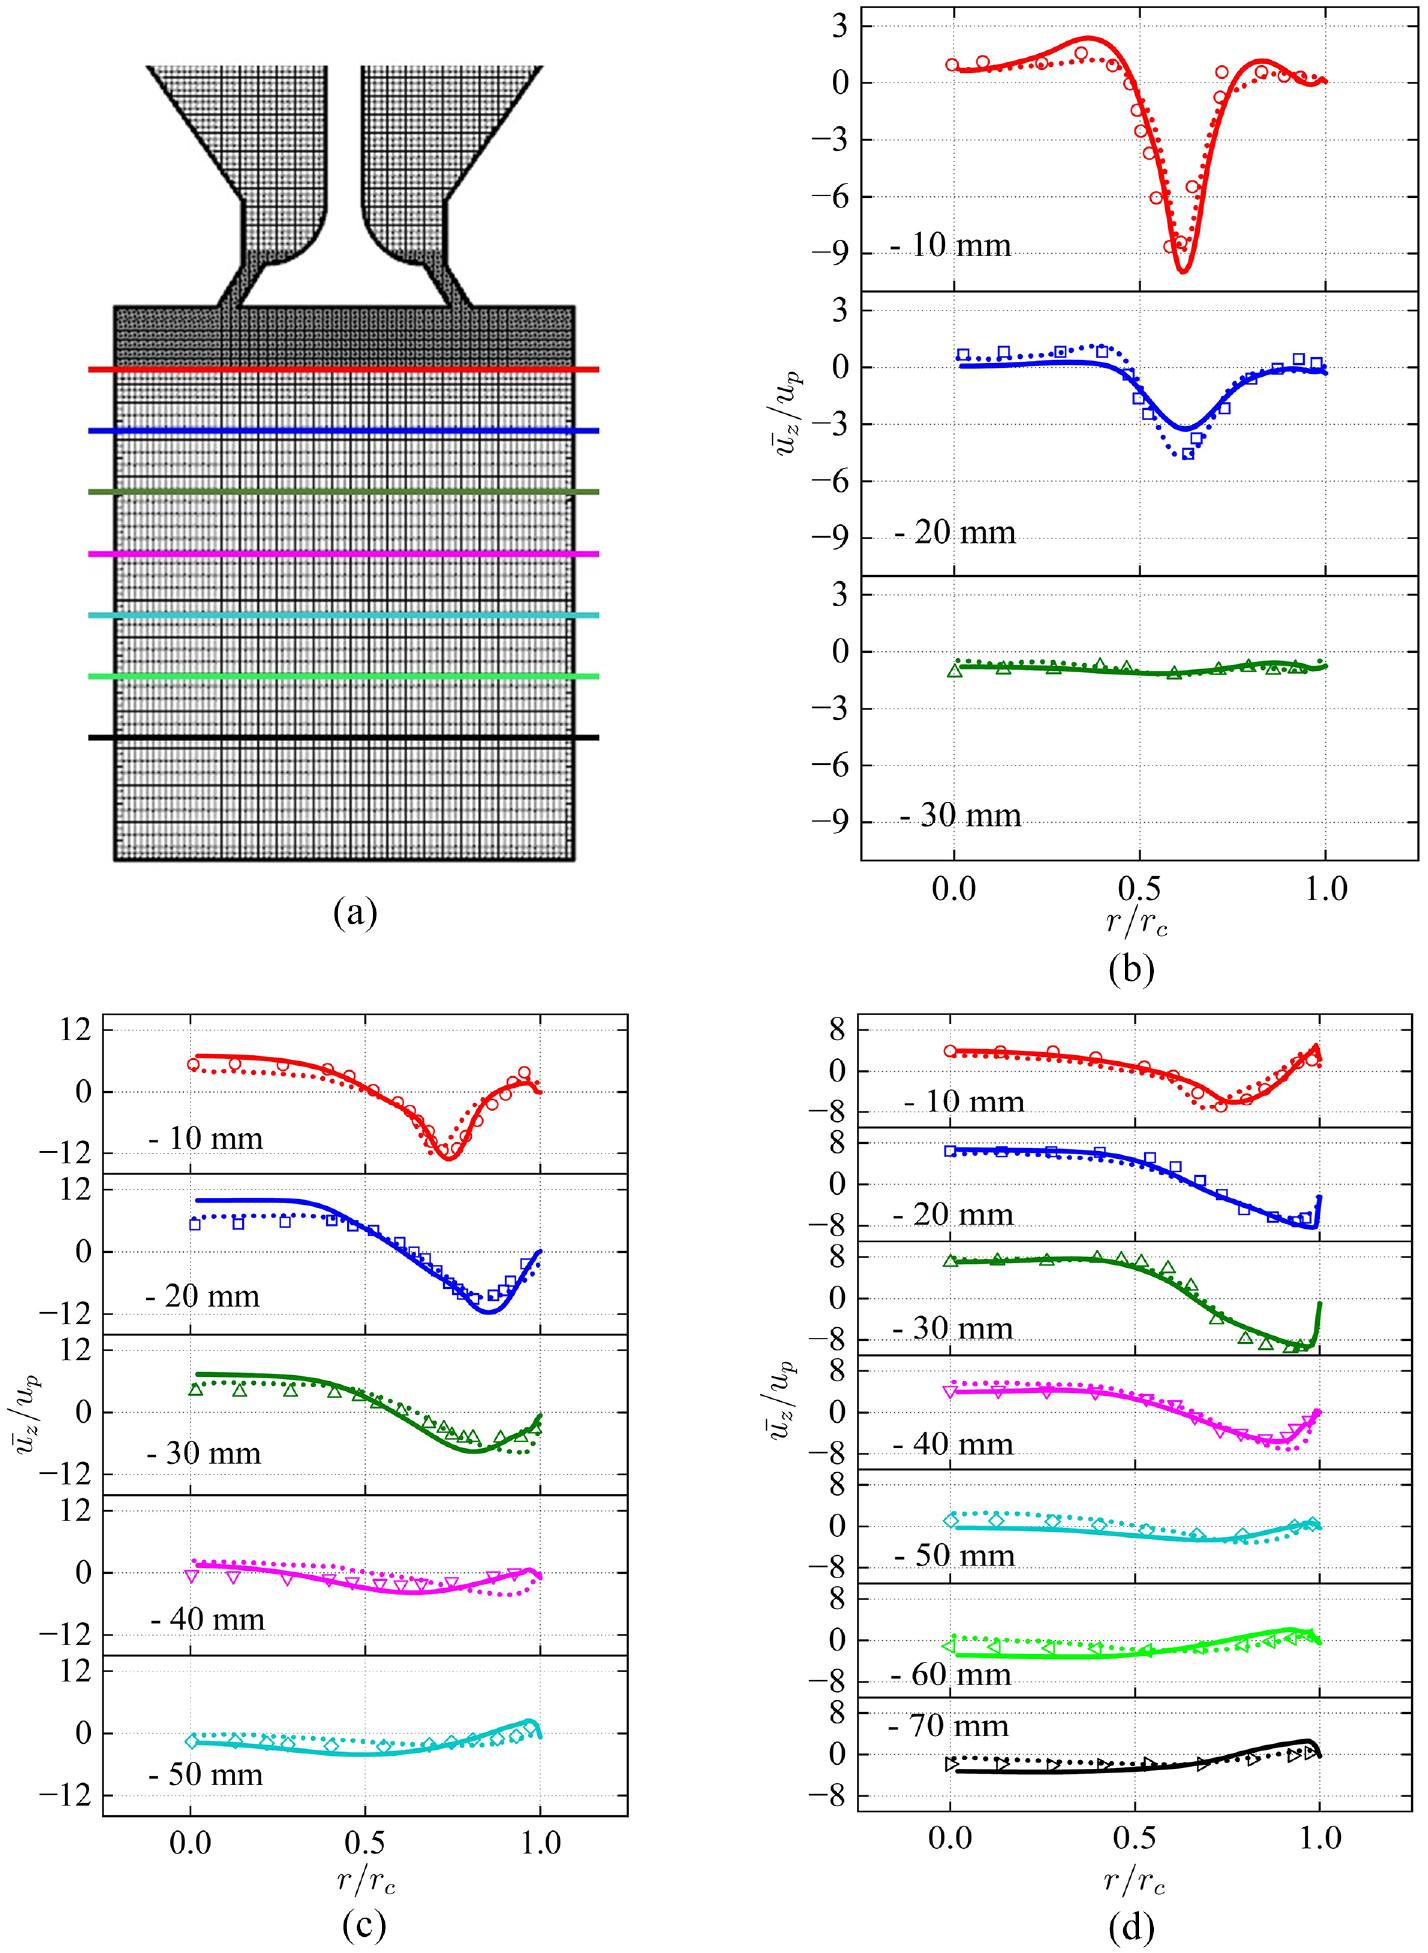
(a) Geometry, elevations, and mesh of the simulation domain (rc is the cylinder radius). Comparisons of axial velocity profiles obtained using RANS in this work (bold lines), DNS by Schmitt et al. 45 (dotted lines), and experiments by Morse et al. 46 (symbols) at (b) 36 CAD, (c) 90 CAD, and (d) 144 CAD after the top dead center.
Finally, a mesh sensitivity study is provided in Figure A2 in Appendix. It may be noted here that the valve region was refined according to the meshing strategy mentioned in Figure 4. Here, two crank angle positions – during the intake and compression stroke – were considered. It may be observed from the figure that the velocity and temperature contours are very similar for the 0. 75 and 1 mm base mesh sizes. On the other hand, the 1.25 mm mesh produces noticeably different contours. Therefore, in the present work, we used the 1 mm base mesh size for further investigations in this work.
Results and discussion
After the validation of the 3-D CFD model, it was used to investigate in-cylinder conditions within the CFR engine at RON relevant conditions. The results are divided into three sub-sections. First, the in-cylinder flow conditions are described. For the characterization of in-cylinder flow conditions, PRF 87-air mixture is considered as incoming charge. Then, the charge cooling effect of ethanol blending is analyzed. Finally, the in-cylinder stratification of temperature and fuel-air mixture is investigated.
General characterization of in-cylinder conditions
As shown in Figure 3, the CFR engine intake valve is equipped with a shroud. This shroud influences the fuel-air mixture flow pattern during the intake stroke. A description of such a flow is shown in Figure 7(a) at 120 CAD. It is clear from the figure that the shroud obstructs the flow. Such obstructions are expected to influence the swirl and tumble patterns inside the cylinder. The swirl can be defined as the charge motion around the axis of symmetry of the cylinder (Figure 1). On the other hand, the tumble is defined as a large vortex motion around an axis perpendicular to the symmetry axis.
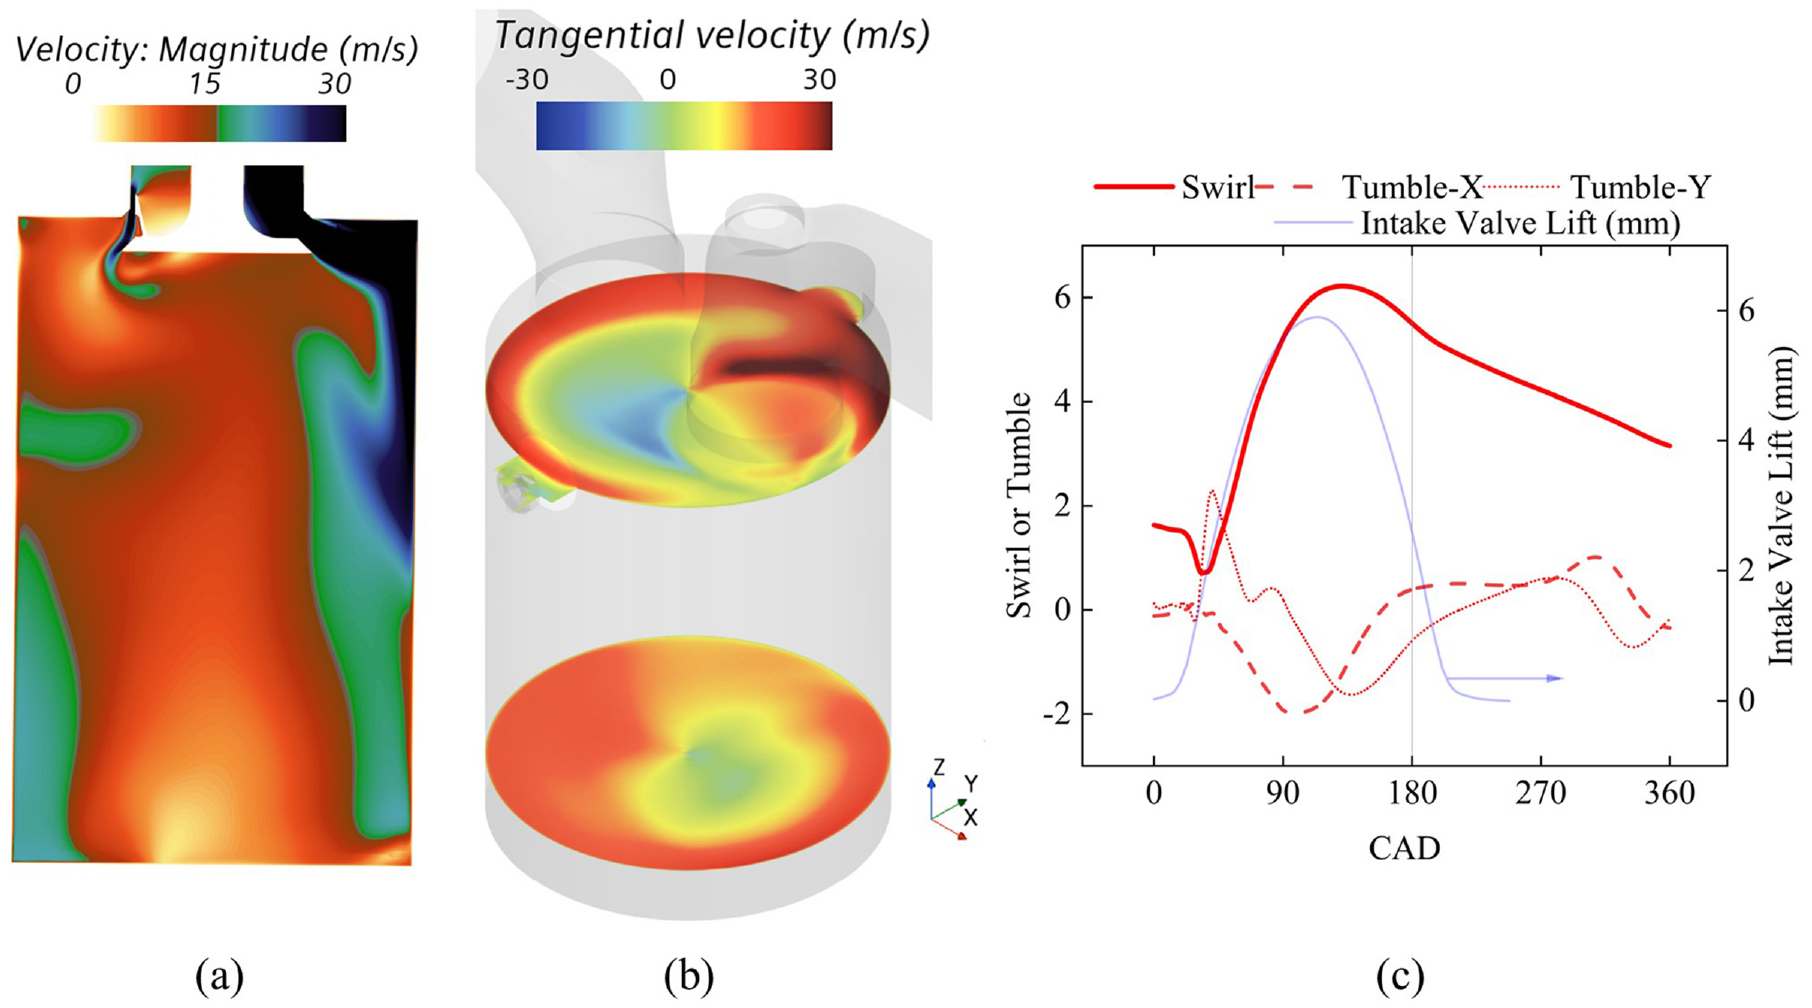
(a) The velocity contour on the plane passing through the middle of the intake valve during the intake stroke (at 120 CAD) for PRF 87-air mixture. (b) Tangential velocity contours at two different planes of the cylinder during the intake stroke (at 120 CAD) for PRF 87-air mixture. The positive direction of tangential velocity is counterclockwise for top view on the cylinder head. (c) Variation of the average swirl and tumble inside the cylinder with crank angle for PRF 87-air mixture.
For understanding the flow inside the CFR engine cylinder, Figure 7(b) shows the magnitude of the tangential velocity component on two horizontal planes at 120 CAD. While the upper plane passes across the spark plug, the lower plane is closer to the piston and 90 mm below the spark plane. It is clear from the figure that the swirl is stronger near the cylinder head. The cause of such a strong swirl can be attributed to the valve shroud as it has been experimentally observed by Willis et al. 60 also for engines with intake valve shroud. Such a strong swirling flow near the spark plug is expected to have significant influence on the ignition process. 24
It may be seen from Figure 7(c) that during the start of the intake stroke, the swirl decreases and the y-component of tumble increases. During such initial stages of the intake stroke, the mass of fuel-air mixture coming to the cylinder is low. Therefore, the effect of intake valve shroud is minimal. Soon after the start of the intake process, the swirl starts increasing. The cylinder swirl peaks slightly after the maximum intake valve opening point as the mass of charge intake is also maximized with the valve opening. As shown in Figure 7(c), the in-cylinder flow is swirl-dominated with maximum swirl number of around 6.2 at 125 CAD.
Figure 8 compares the swirl for PRF 87, 75% PRF 87/25% ethanol, and 50% PRF 87/50% ethanol blends in air. It is clear from the figure that the addition of ethanol does not alter the swirl characteristics from qualitative perspective. However, a reduction of 1.6% and 3.7% in maximum swirl were observed for 75% PRF 87/25% ethanol and 50% PRF 87/50% ethanol cases, respectively. Additionally, it may be observed from Figure 8(a) and (b) that the turbulent kinetic energy (TKE) increases at a steeper rate than the swirl making the TKE peak around 60 CAD earlier than swirl. This is because of the early tumble-Y development in the cylinder during the start of the intake stroke in the range 30–70 CAD (Figure 7). As a result of this early tumble in the cylinder, the TKE is already high when the swirl starts to increase approximately after 40 CAD.
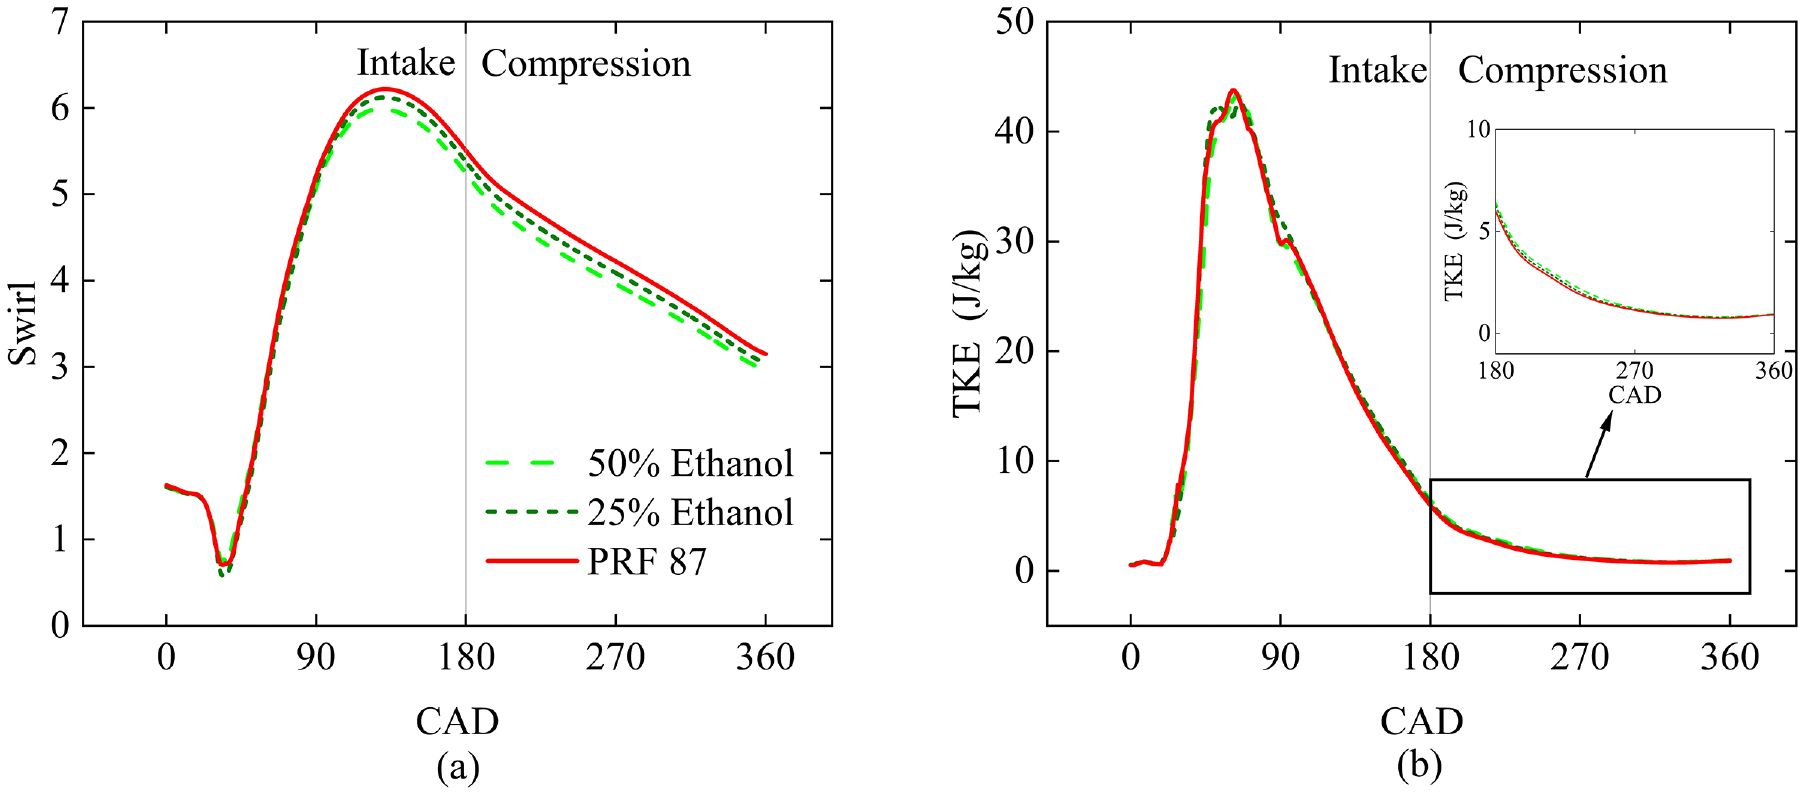
Comparison of in-cylinder average (a) swirl and (b) turbulent kinetic energy (TKE) for PRF 87, 75% PRF 87/25% Ethanol, and 50% PRF 87/50% Ethanol blends in air.
Charge cooling effect
The charge cooling effect of liquid fuels provide additional knock resistance along with the combustion chemistry.6,61 During the RON test, the fuel-air ratio is varied to maximize knock. As a result, the charge cooling effect is also expected to vary and become integrated with the measured octane rating. Many works have attempted to quantify the charge cooling effect on RON.6,62,63 In this regard, Foong et al. 64 proposed a modified experimental method that is supposed to eliminate the evaporative cooling effects of ethanol in gasoline/ethanol blends. In the modified technique, 64 an air heater was installed upstream of the carburetor. This heating maintained the average temperature of gasoline-ethanol-air mixture downstream of the carburetor constant and equal to gasoline-air cases. This way, it was hypothesized that the measured RON would reflect the fuel chemistry only. In this work, 64 it was also assumed that the gasoline evaporated completely in the intake port before entering the CFR engine cylinder.
In order to evaluate the charge cooling effect, the in-cylinder wall heat transfer is compared first in Figure 9. It may be noted here that the positive heat transfer signifies heat loss from gases to the wall and vice versa. It may be seen from the figure that the amount of wall heat transfer is comparable for the PRF 87 and 50% ethanol cases. Therefore, any charge cooling effect seen later may primarily be attributed to the HoV of ethanol, which is almost three times higher than gasoline. 65
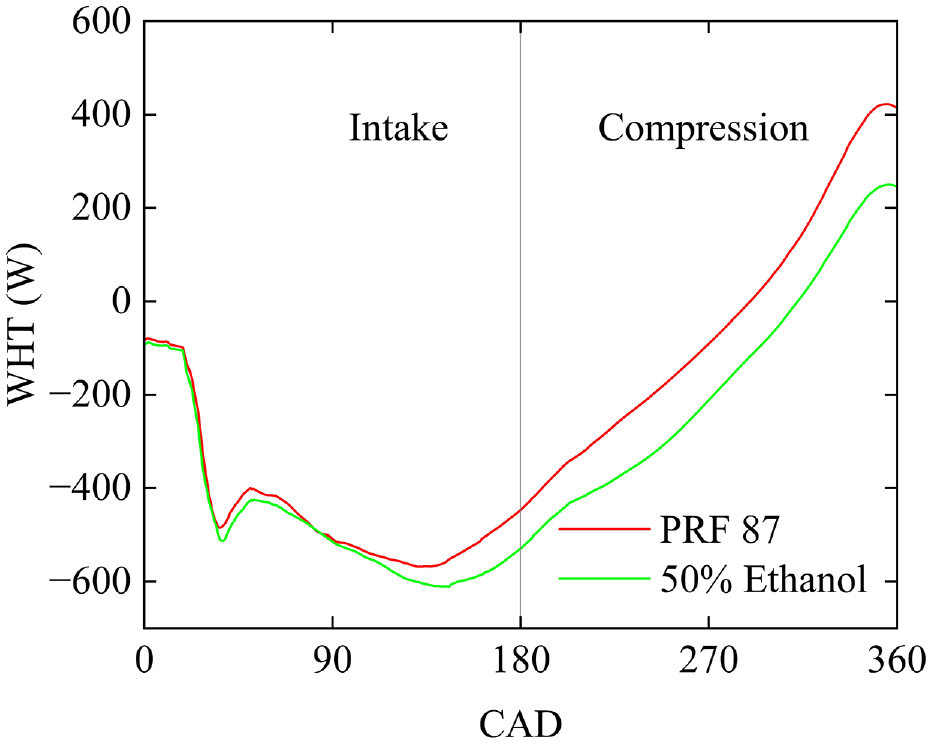
Comparison of in-cylinder wall heat transfer between PRF 87 and 50% PRF 87/50% Ethanol blends at firing TDC. Positive heat transfer signifies heat loss from the in-cylinder mixture to the wall.
Figure 10 shows the amount of liquid fuel entering the cylinder for PRF 87, 75% PRF 87/25% ethanol, and 50% PRF 87/50% ethanol blends in air as a percentage of total injected mass from the carburetor. It is clear from the figure that for PRF 87, a considerable amount of liquid mass enters the cylinder during the intake stroke. Immediately after the intake valve opening, some residual liquid from the previous cycle enters the cylinder. As a result, a small peak in liquid mass is visible in the range 0–50 CAD for all three fuel blends.
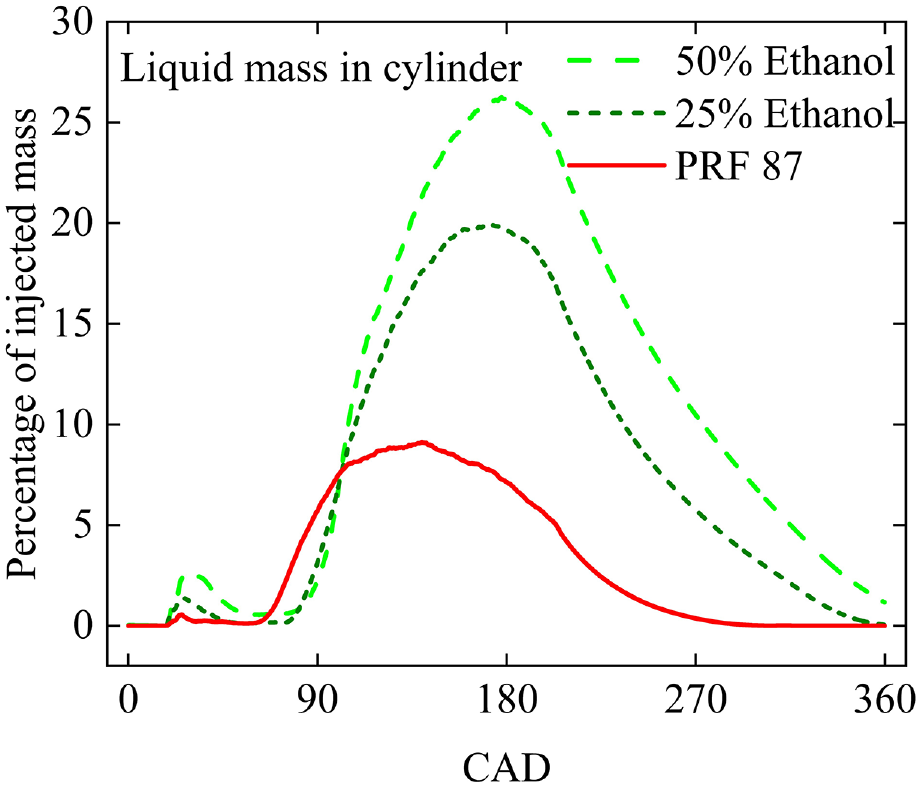
Amount of liquid fuel entering the cylinder as a fraction of total injected mass for PRF 87, 75% PRF 87/25% Ethanol, and 50% PRF 87/50% Ethanol blends in air.
The residual liquid evaporates inside the cylinder before the fresh liquid mass from the carburetor enters the cylinder. It may also be seen from Figure 10 that the fresh liquid fuel enters the cylinder at slightly earlier CAD for the PRF 87 case in comparison to the ethanol blended cases. Due to the elevated vapor pressure of ethanol blended PRF 87, the higher volatility of the liquid fuel causes increased evaporation for the 25% and 50% ethanol blends. Hence, lower amounts of liquid enter the cylinder initially for these blends. The maximum amount of liquid for the PRF 87 case was found to be around 9% of the total injected mass inside the cylinder. However, the in-cylinder liquid amount increases sharply with ethanol blending due to its higher HoV. It was found from the present study that the maximum amount of liquid is around 20% and 26% of total injected mass for the 25% and 50% ethanol cases, respectively.
The evaporation of fuel primarily takes place in the intake port. It was found in the present study that the maximum amount of in-cylinder liquid is about 61% lower than the maximum liquid amount in the intake port. However, this scenario changes with ethanol blending. For the 25% and 50% ethanol cases, the maximum amount of in-cylinder liquid is about 36% and 21% lower than the maximum liquid amount in the intake port, respectively. Therefore, it may be concluded that the higher HoV of ethanol results in reduced evaporation inside the intake port.
The liquid fuel entering the cylinder creates evaporative cooling effect. As the amount of liquid entering the cylinder increases with the addition of ethanol, the cooling effect also increases. Figure 11 shows the effect of ethanol addition on average cylinder temperature. It is clear from the figure that the addition of 50% ethanol to PRF 87 causes the maximum average temperature to drop by 33 K in the cylinder. This cooling effect is expected to enhance effective RON values on top of the fuel chemistry effects. 61 Furthermore, since there is also considerable amount of liquid entering the cylinder for PRF 87-air case, the effect of fuel chemistry and evaporative cooling cannot be separated completely.
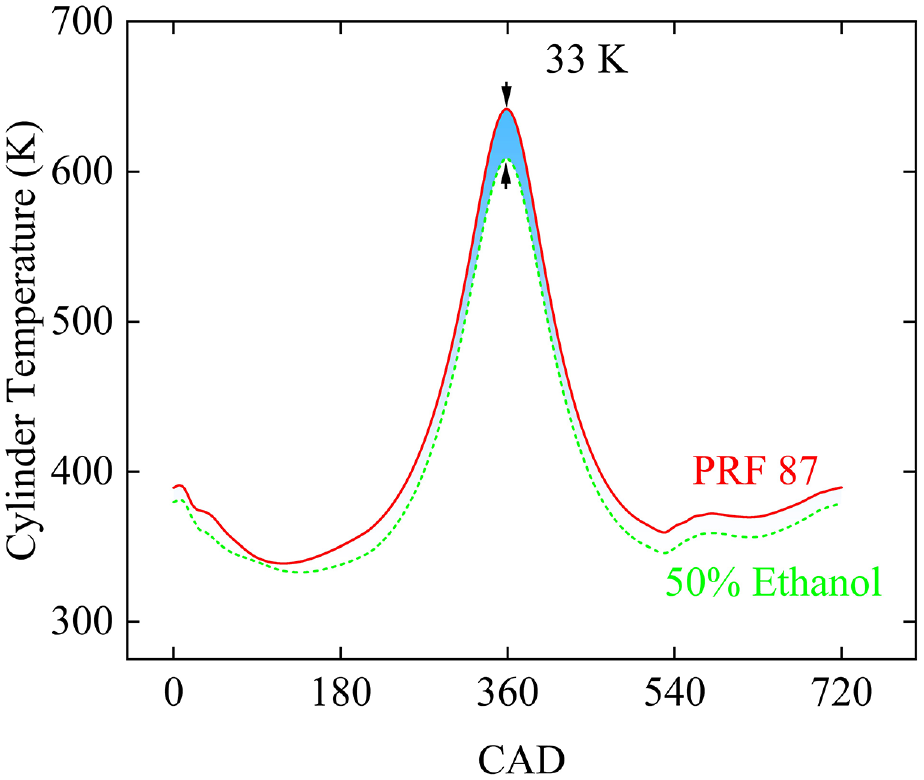
Change in average cylinder temperature due to ethanol blending.
Charge and temperature stratification due to ethanol blending
The differences in HoV between PRF and ethanol creates local stratification of charge and temperature. It is evident from Figure 12(a) to (d) that the stratification is quite significant at firing TDC (360 CAD). It may be noted here that the contours are shown in Figure 12 on a single plane passing through the middle of the spark plug and knock meter port cavity. It is observed in this work that the contours are similar in other vertical planes due to the strong in-cylinder swirl. It is clear from Figure 12(a) that the mixture is richer near the cylinder head for PRF 87. Furthermore, the in-cylinder swirl creates fuel rich pockets in the spark plug and knock meter port cavities. As shown in Figure 12(b), this fact is true for the 50% ethanol case also. However, the charge stratification is much stronger for the 50% ethanol case in Figure 12(b) in comparison to the PRF 87 case in Figure 12(a). Unlike the PRF 87 case, the rich mixture exists close to the piston for the 50% ethanol case.
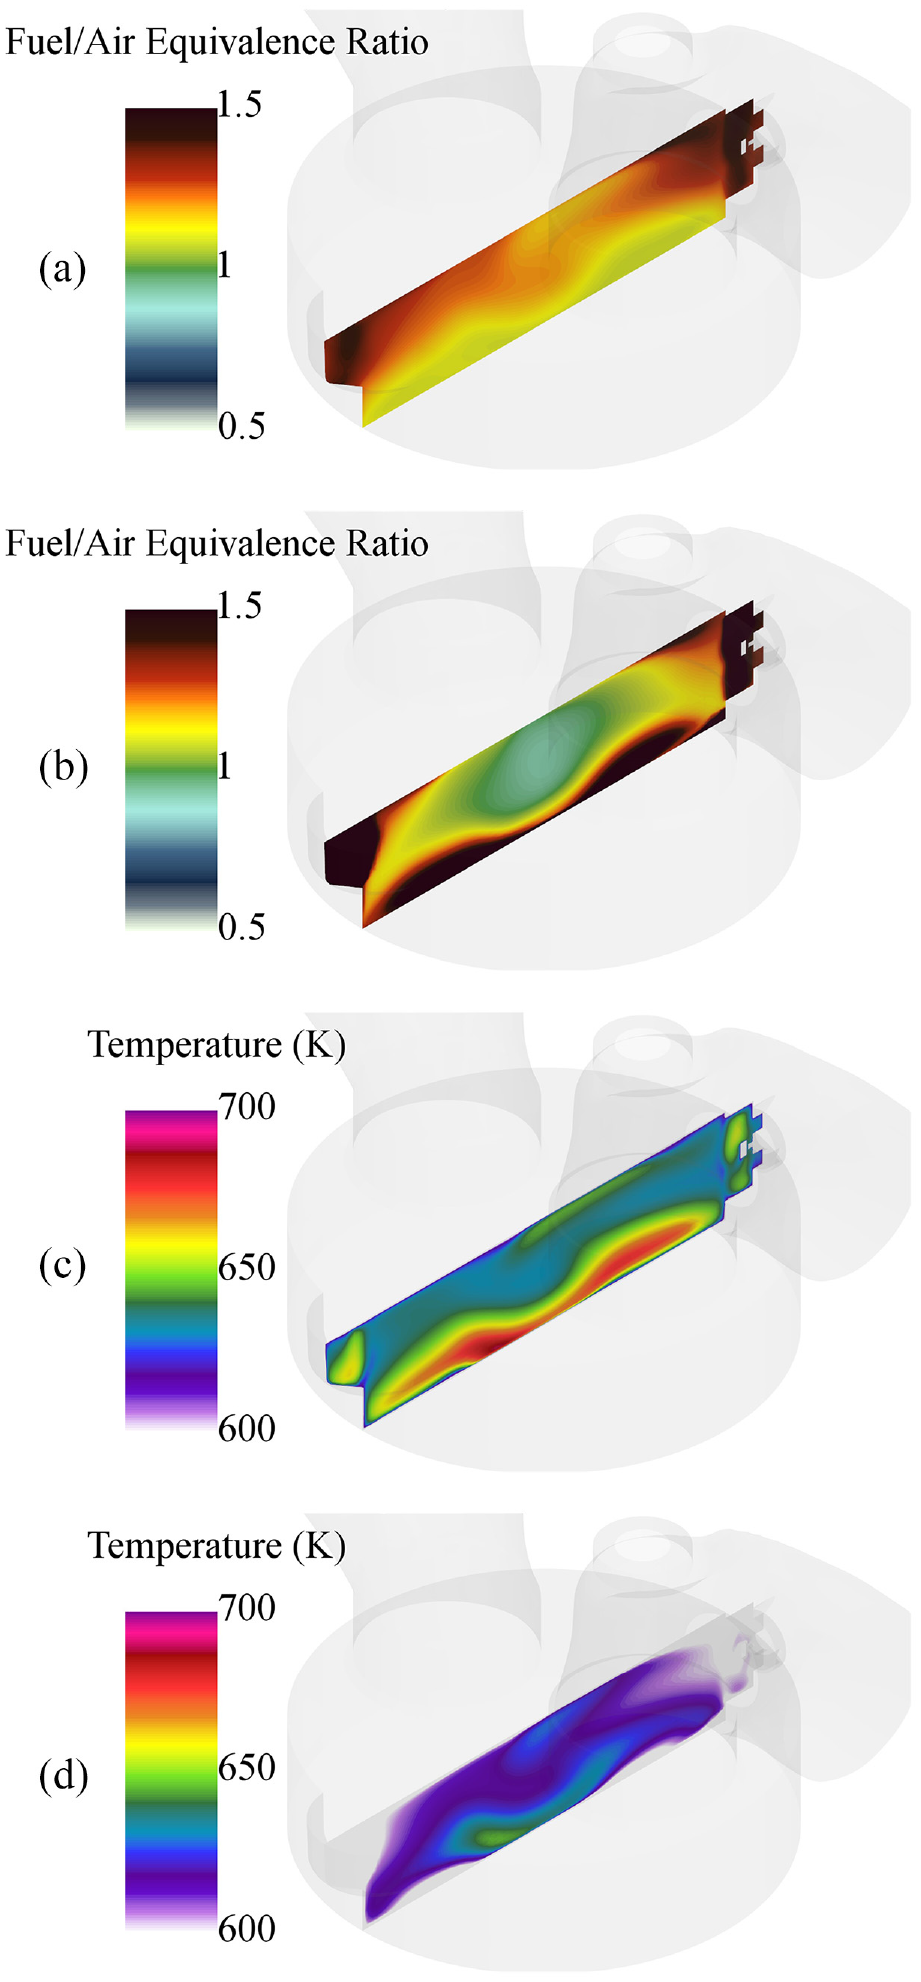
Contours showing equivalence ratio and temperature stratification in the cylinder for PRF 87 and 50% PRF 87/50% Ethanol blends at 360 CAD: (a) PRF 87 (360 CAD), (b) 50% Ethanol (360 CAD), (c) PRF 87 (360 CAD), and (d) 50% Ethanol (360 CAD).
The temperature stratification is shown in Figure 12(c) and (d) for PRF 87 and 50% PRF 87/50% ethanol blends in air, respectively. It is clear from Figure 12(c) that the mixture close to piston has higher temperature for PRF 87. On the other hand, the temperature values are much lower for the 50% PRF 87/50% ethanol blend due to the higher HoV of ethanol. The mixture near the spark plug is also significantly cooler in Figure 12(d) for the 50% ethanol case.
A quantitative overview of the in-cylinder charge stratification – in terms of standard deviation of equivalence ratio (SDϕ) – is shown in Figure 13. The initial peak of SDϕ at around 20 CAD is due to the fuel vapor and liquid mass entering the cylinder right after the intake valve opening. This peak in Figure 13 coincides with the start of increase in liquid mass after the intake valve opening in Figure 10. Due to the higher vapor pressure of ethanol blended PRF 87, the amount of fuel vapor in the intake port is increased with the increase in ethanol content in the liquid fuel. Furthermore, the total quantity of fuel is also increased with ethanol blending, so that the overall equivalence ratio is maintained. Therefore, the initial peak of Figure 13 shows the maximum value of SDϕ to be 2.25, 10.12, and 25.4 for PRF 87, 75% PRF 87/25% ethanol, and 50% PRF 87/50% ethanol cases, respectively. It may be mentioned here that such peaks in charge stratification are expected to occur for commercial gasoline/ethanol blends as well because ethanol increases the volatility of gasoline in the early stages of distillation curve. 66
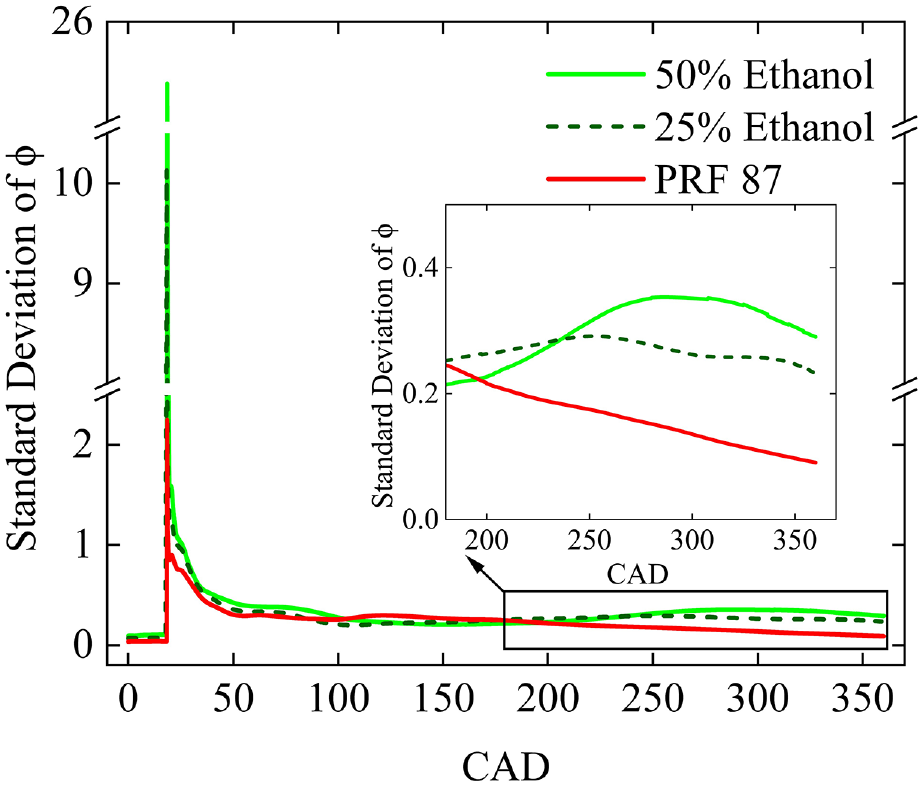
Standard deviation of in-cylinder equivalence ratio for PRF 87, 75% PRF 87/25% Ethanol, and 50% PRF 87/50% Ethanol blends in air.
The inset of Figure 13 shows the variation of SDϕ during the compression stroke. It is clear from the figure that the SDϕ for PRF 87 decreases monotonously during the compression stroke. On the other hand, the 50% PRF 87/50% ethanol case shows an increasing trend during the initial part of the compression stroke. This is due to the delayed evaporation – and therefore late mixing – of ethanol originating from its high HoV. After around 300 CAD, the ethanol is completely evaporated. Therefore, the SDϕ starts to decrease due to turbulence induced mixing. For the 25% ethanol case, the SDϕ is almost constant at around 0.23 during the compression stroke. The differences in stratification observed in Figure 12(a) and (b) at firing TDC is reflected here in Figure 13 (inset) also as SDϕ|50% ethanol > SDϕ|PRF 87.
For closer analysis at firing TDC, normalized in-cylinder equivalence ratio (h(ϕi)) and temperature (h(Ti)) distributions are shown in Figure 14(a) and (b), respectively. Here, Σh(ϕi) = Σh(Ti) = 1 and each discrete constituent of “h” equals the fraction of cylinder volume where either ϕi or Ti is fulfilled. It can be seen from Figure 14(a) that the equivalence ratio distribution ranges from lean (ϕ < 0.9) to significantly rich (ϕ >1.6) fuel-air region in the cylinder for the 50% ethanol case. This span gradually decreases as the amount of ethanol reduces in the fuel. As discussed earlier, this fact may be attributed to the increase in HoV due to ethanol blending. Figure 14(b) shows the variation of h(Ti) for PRF 87, 75% PRF 87/25% ethanol, and 50% PRF 87/50% ethanol cases. The charge cooling effect of ethanol is clearly visible here. The 25% ethanol case looks qualitatively similar to the PRF 87 case since the influence of ethanol is moderate for this case. However, for the 50% ethanol case, the effect of ethanol is so strong that the cylinder temperature reduces significantly.
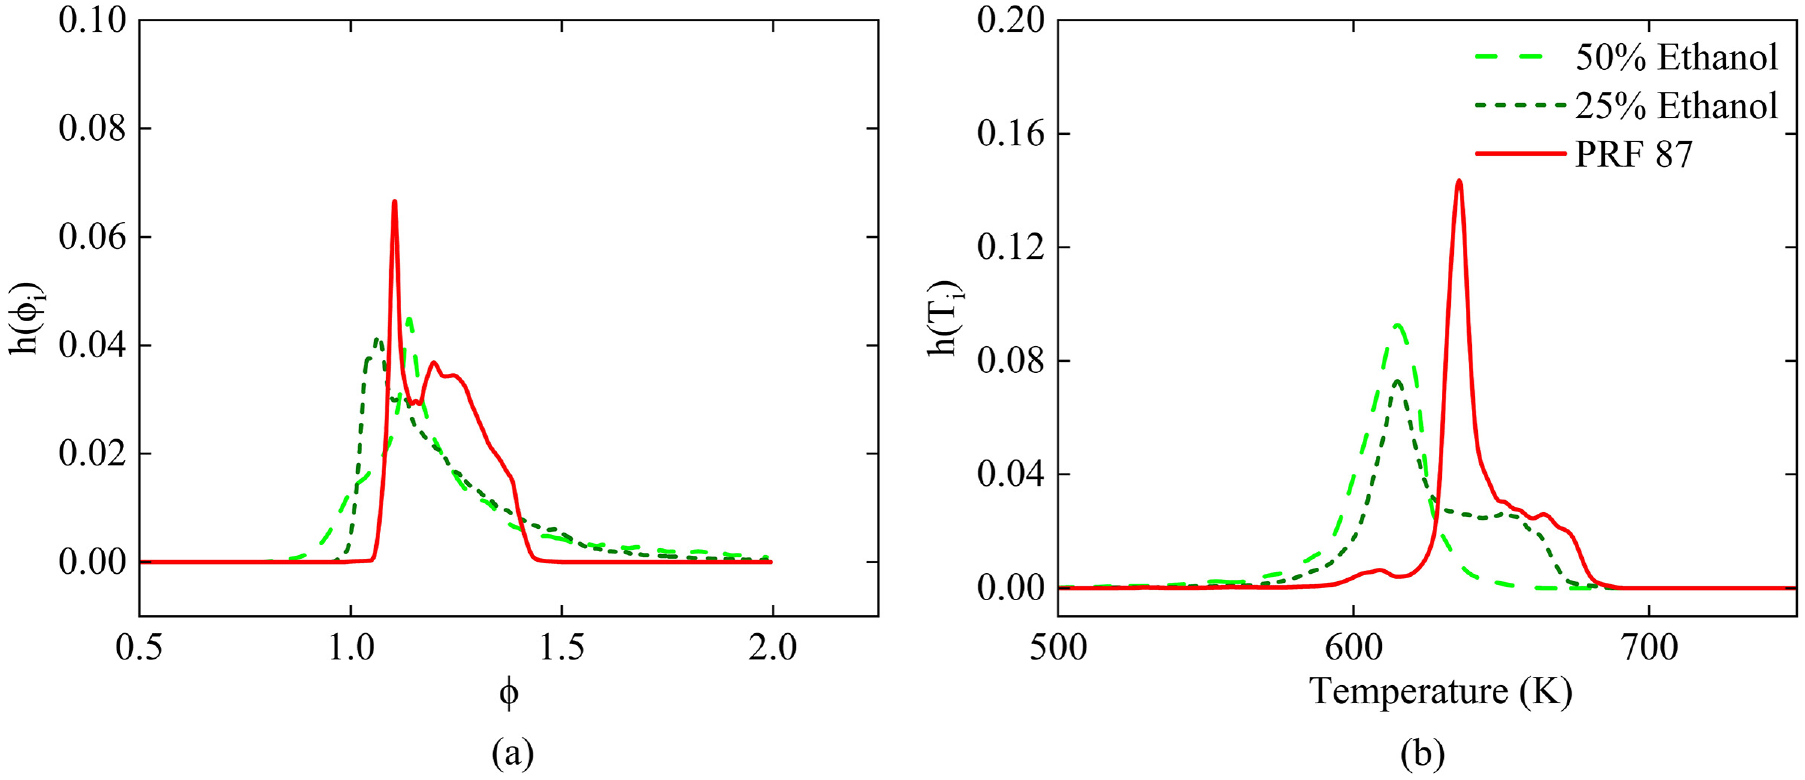
Probability density function of (a) equivalence ratio and (b) temperature at 360 CAD for PRF 87, 75% PRF 87/25% Ethanol, and 50% PRF 87/50% Ethanol blends in air.
Finally, Figure 15(a) to (c) shows the 2-D probability distribution of temperature and equivalence ratio in the cylinder at firing TDC (360 CAD). It can be seen from Figure 15(a) and (b) that the cylinder temperature decreases with ethanol while the mixing trend is similar. However, there is still considerable amount of fuel at temperatures higher than 650 K. The addition of ethanol makes the mixture approach higher equivalence ratios. On the other hand, the mixing is significantly different for the 50% ethanol case in Figure 15(c). While most of the mixture is below 650 K, two branches of data are clearly visible in the figure. This is due to the fact that the PRF 87 rich mixture remains at a higher temperature than the ethanol rich regions of the cylinder due to the higher HoV of ethanol.
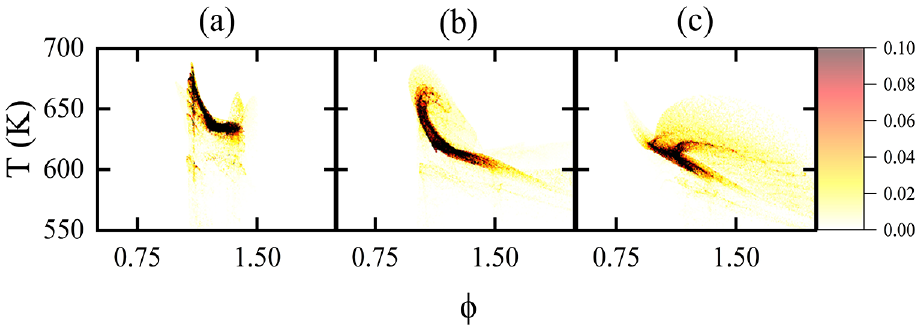
2-D probability density function of equivalence ratio and temperature at 360 CAD for (a) PRF 87, (b) 75% PRF 87/25% Ethanol, and (c) 50% PRF 87/50% Ethanol blends in air.
Conclusions
Here, the in-cylinder mixing of fuel and air at RON relevant conditions were investigated numerically for a CFR engine. The transient 3-D CFD simulations were performed within the Reynolds-averaged Navier-Stokes (RANS) framework with a Realizable k-ε turbulence model. The numerical setup was validated against experimental in-cylinder pressure data from a CFR engine and DNS data in an engine-like geometry. 45 Major findings are summarized as follows:
The CFR engine in-cylinder flow is primarily swirl dominated. The intake valve shroud is responsible for generating the swirl.
At RON conditions, although the evaporation of fuel primarily takes place in the intake port, a significant amount of liquid enters the cylinder. The maximum amount of liquid for PRF 87, 25% ethanol, and 50% ethanol cases was found to be around 9%, 20%, and 26% of total injected mass inside the cylinder, respectively.
The charge cooling effect from the higher HoV of ethanol is considerable at firing TDC. In the present case, the change in average temperature due to blending 50% ethanol with PRF 87 was found to be around 33 K.
While the higher vapor pressure of ethanol blended PRF 87 plays a key role in charge mixing during early stages of intake stroke, considerable charge stratification is observed inside the cylinder during the compression stroke as well. The primary driver behind this stratification is the difference between the HoV and vapor pressure of the fuel blends.
Similarly, the difference between the HoV of the fuel blends creates temperature stratification also.
The effects of stratified in-cylinder conditions on knock remains to be investigated. Moreover, the present study can be further extended to different multicomponent fuel blends.
Footnotes
Appendix: Sensitivity analysis of base grid size and droplet size at carburetor nozzle
The droplet size in the carburetor nozzle is expected to influence the amount of fuel entering the cylinder. As the droplet size decreases, they evaporate faster. Furthermore, due to the lower momentum of the smaller droplets, they travel faster and enter the cylinder in higher quantities. This fact is observed in Figure A1 where the increase and decrease in the liquid fuel mass is highlighted due to the decrease and increase in the droplet diameter, respectively. However, it is clear from the figure that the deviation is within 2% of the total injected mass. Due to this small difference, a constant droplet diameter of 60 μm was used for further analysis in this work.
Figure A2 (a-l) shows the effect of base grid size on the simulation results on a plane perpendicular to the spark plug and passing through the center of both intake and exhaust valves. Figure A2 (a-f) shows the in-cylinder flow velocity and temperature distributions at 120 CAD when the intake valve is wide open. It can be seen from the figures that the patterns are mostly similar despite minor differences in the valve region for the temperature contours. Similarly, in Figure A2 (g-l), the flow velocity and temperature contours are similar to each other towards the end of the compression stroke. After this grid sensitivity analysis, the base grid size of 1 mm was adopted for further simulations.
Acknowledgements
The authors acknowledge the computational resources provided by the Aalto Science-IT project and Aalto Research Software Engineers (RSEs). We thank Olli Ranta and Otto Blomstedt for assistance. The submitted manuscript was created partly by UChicago Argonne, LLC, Operator of Argonne National Laboratory. Argonne, a U.S. Department of Energy Office of Science laboratory, is operated under Contract No. DE-AC02-06CH11357.
Declaration of conflicting interests
The author(s) declared no potential conflicts of interest with respect to the research, authorship, and/or publication of this article.
Funding
The author(s) disclosed receipt of the following financial support for the research, authorship, and/or publication of this article: This study is financially supported by the Research Council of Finland (grant no. 346918 and 332835). Financial support from Neste Oy is gratefully acknowledged.