
Abstract
An ethanol-fueled Atkinson cycle PFI SI engine using exhaust rebreathing (ER) was evaluated under 110 different operating conditions. While ethanol is an important biofuel to reduce greenhouse gas emissions, Atkinson cycle engines have been studied as low-consumption alternatives for hybrid architecture vehicles. The operating conditions were validated with GT-Power® and the resulting combustion and performance parameters were trained by a series of artificial neural network (ANN) structures in order to learn and reproduce the non-linear correlations. The ANN structures were analyzed by number of nodes, hidden layers, and optimization methods. TPA results showed that ER tests had higher indicated thermal efficiency and lower combustion temperatures than both the standard Atkinson cycle and Otto cycle conventional throttled valve strategy with a similar engine setup. The best ANN to accurately predict all six outputs with easy-to-measure operating conditions was a combined ANN-PSO model, with two hidden layers with [30 10] nodes to predict net IMEP, airflow, total mass trapped and burned mass percentage, and a complementary 10-nodes PSO hidden layer, to predict PMEP, and the average exhaust runner temperature. The final model can predict and calibrate an Atkinson cycle PFI SI engine operating with ER with significant accuracy and no need for further TPA simulations.
Introduction
Spark-ignition engines development has led researchers from both industry and academia to seek maximum operational benefit over the years, resulting in the emergence of advanced combustion modes such as spark assisted controlled auto-ignition (SACI) and controlled auto-ignition (CAI).1–3 Added to that, the increasingly strict environmental regulations made renewable fuels such as alcohols to be explored by engine developers in search for higher efficiency and less environmental impact.4–8 Alcohol fuels for internal combustion engines can reduce green-house gas (GHG) emissions related to global warming. 9 Among these fuels, ethanol has been studied for automotive applications in its anhydrous form or blended with other fuels or water in internal combustion engines.10–12 Aspects that contribute to improve engine efficiency when fueled with ethanol instead of conventional gasoline include its higher-octane rating and latent heat of vaporization which led to a better combustion phasing and increased volumetric efficiency.13,14 As drawbacks, ethanol has lower volatility and lower calorific value in comparison to gasoline, which increase cold start calibration costs and penalize vehicle fuel consumption, respectively. 15 The search for reducing the carbon footprint in the transport sector makes it clear that, for the desired levels of CO2 emission in the coming years, only a ban on internal combustion engines, something that is unlikely in many countries, or an increase in the use of biofuels such as ethanol are measures that will make it possible to achieve the goals. 16 Ethanol, therefore, is also considered an alternative for hybrid electric vehicles, where autonomy can be increased through electrification or another form of propulsion.17,18
In addition to biofuels, several studies with the purpose to increase SI engine performance added changes to engine operating systems, such as variable valve actuators (VVA), and improvements to engine modeling. Mechanical cam-based valve actuation systems tend to waste power on pumping losses for wide ranges of engine speeds and loads, while some VVA systems can provide full freedom to vary the valve lifts, timings, and duration for different engine operating conditions.19,20 Variable valve actuators can allow different strategies such as LIVO (Late Inlet Valve Opening), EIVC (Early Inlet Valve Closing), or even multi-lift strategies, 21 such as negative valve overlap (NVO) and exhaust rebreathing (ER). Combined with the use of VVA, the Atkinson cycle has been shown very effective to improve fuel economy of ICEs. In this particular cycle, the volume ratio used for expansion is higher than the volume ratio used for compression. 22 In the present work, Atkinson cycle was achieved with the use of early intake valve closing (EIVC). Recent studies have again shown that SI engines with Atkinson cycle were able to obtain higher net indicated thermal efficiency, and less knock tendency due to lower combustion temperatures.23,24 The use of the Atkinson cycle also leads to a reduction in NOx emissions, both in part load and full load. The reduction in temperature, pressure and density obtained through EIVC leads to lower flame temperatures, but also leads to an increase in CO emissions by worsening the combustion process. 25 Due to its potential to reduce consumption compared to the Otto cycle, engines with Atkinson cycle are also being studied for use in hybrid electric propulsion systems, such as in series with an electric engine, thus increasing the vehicle’s autonomy and reducing its known drawback of combustion deterioration because of the lower effective compression ratio.26,27
Studies regarding ER showed that with CAI, an experimental engine had better fuel economy and lower NOx emissions than with conventional throttled four-stroke SI operation. 28 In addition, a combination of inlet boosting, adequate injection timing and exhaust rebreathing optimization could reduce CO and HC emissions, extending the low-load limit of a gasoline engine with partially premixed combustion. 29 The use of ER has also been explored as a way of reducing fuel consumption through CAI of the end-gas in an AVL-CSI (compression and spark ignition) system for an SI gasoline engine. 30 Continuing to explore the use of CAI in SI engines to increase efficiency and reduce emissions with the use of internal EGR and low temperature combustion, the use of ER and NVO were tested and valve profiles for CAI control were determined for real operating conditions. 31 Although the use of VVA and strategies such as ER are still incipient in the current scenario of light transport vehicles, research on engine development, and even patents 32 that explore this process for creating high-efficiency engines are already a reality.
Concerning engine calibration modeling, a previous study from the authors showed that artificial neural networks (ANN) and particle swarm optimization (PSO) could correctly predict valve timings and NVO duration for an SI engine. It enabled higher engine indicated thermal efficiencies from lower to higher loads. 33 In a gasoline engine, Fagundez et al. 34 used a genetic algorithm optimization on a validated GT-Suite hydraulic VVA system model to theoretically reduce the break specific fuel consumption in 13.1% through late exhaust valve closure (LEVC) and EIVC. Li et al. 35 developed a simplified thermodynamic based engine model for prediction of combustion phasing of an ICE engine using exhaust rebreathing technique. Even though the model was successful in predicting the engine parameters, it is still complex and requires intra-cycle calculations of mass flows, which implies in high computational cost.
This work aims to validate the application of ANN models to predict engine operating parameters and variables that cannot be measured when the exhaust rebreathing valve strategy is applied along with the Atkinson cycle in a SI engine. For that, 110 experimental engine conditions were validated through a GAMMA Technologies GT-Power® engine model and several combustion outputs, such as the total mass trapped at the cylinder, were collected for the training of the ANN models. In addition, this paper shows the combined application of renewable ethanol fuel (with low environmental impact) with the benefits of a fully variable valve actuation system to explore and optimize the SI engine part load performance and emissions through the application of residual gas trapping via ER, and wide-open throttle (WOT) part load operation enabled by EIVC load control. The novelty of this work relies on the application of ANN to predict combustion process variables obtained with GT-Power® using the ER valve strategy, allowing the sweep of experimental engine operating points within the limits of the ANN model without the need for further validation by thermodynamic models. Although the ANN application in ICEs has been presented to predict specific engine system behavior (generally to be implemented in more complex complete engine models),36–38 a similar methodology to calibrate and optimize the operating process of an Atkinson cycle engine with ER has not yet been presented in the literature. More than that, the use of ER as a form of charge dilution (internal EGR) may promote a faster engine dynamic response than the use of external EGR due to shorter path that the exhaust gas has to overcome to the cylinder, enabling cycle-to-cycle RGF control.
Methodology
The section is divided in the following subsections: the description of the ER valve strategy; an explanation about the GT-Power® models’ validation and the second exhaust valve sweep; and a brief description of the optimization algorithms tested to fit the ANN model to the experimental data.
Exhaust rebreathing valve strategy
The rebreathing method through exhaust valve reopening during the intake stroke is an approach to increase residual gas fraction in the combustion chamber. The exhaust valve reopening promotes exhaust gas backflow into the cylinder, and the amount of residual mass to enter is controlled by the length of the rebreathing event, the time when the rebreathing event occurs during the intake stroke, and the interaction with other valve events. 39 The hot residual gases trapped in the cylinder increase charge temperature and requires higher intake pressure to induce the same amount of air compared to a condition with low residuals. Thus, part load pumping losses may be minimized when using ER strategy. In addition, load control can be done either by throttle or using EIVC. When EIVC is implemented with a FVVT system, it provides WOT operation capacity at all engine operating conditions, 26 which further reduces SI part load pumping losses.
In this research, ER time and length were varied during the intake stroke with EIVC as a load control method. The second exhaust valve (V2) was reopened during the intake stroke to enable exhaust gas backflow to the cylinder, whilst the first exhaust valve (V1) had its standard opening profile maintained. A comparison between valve timings of a conventional throttled SI engine (ctSI) valve strategy (Otto cycle), an Atkinson cycle with EIVC and an Atkinson cycle with ER strategy is shown in Figure 1. It should be noticed that the residual gas trapping due to positive valve overlap (PVO) presents some limitations for WOT operation as it requires lower intake pressure than exhaust port pressure in order to promote exhaust gas backflow. While the PVO duration event increases, intake pressure increases up to the point when combustion stability occurs, reducing dethrottling capability of the PVO valve strategy at low loads.
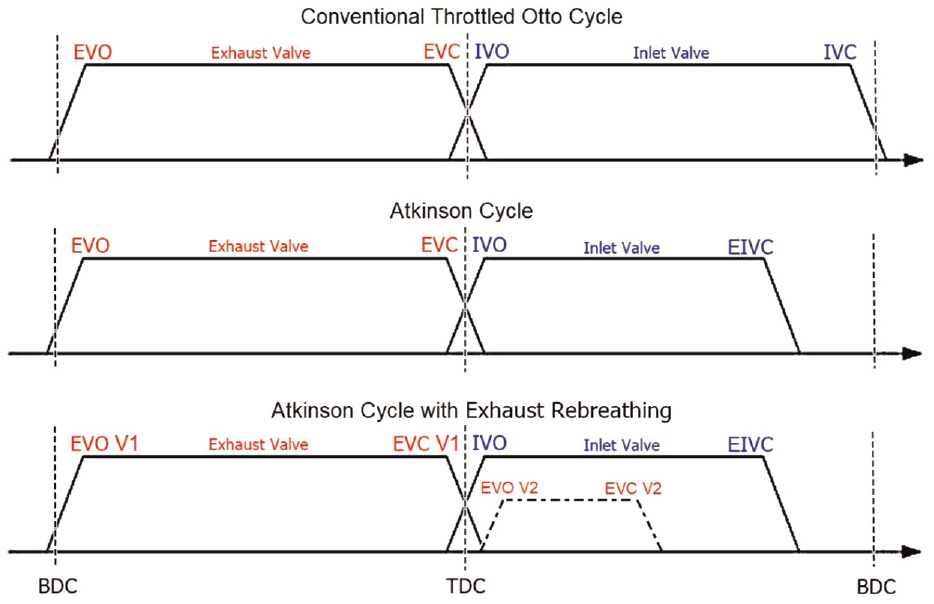
Comparison of ctSI, Atkinson cycle, and ER valve profiles.
According to Zhao, 40 when the auxiliary exhaust valve is reopened simultaneously to the intake event, the charge temperature is reduced during a longer period due to the in-cylinder heat transfer. The ER strategy has been used to promote CAI combustion 32 in-cylinder thermal stratification. 41 Lately, thermal stratification has been proposed as mean to enable CAI operation at conditions were traditional HCCI combustion control is poor. Even though the use of exhaust rebreathing valve strategy via second exhaust valve event is not implemented in road vehicles, the upcoming stricter emissions legislation may provide new opportunities for this residual gas trapping strategy, especially when coupling with WOT part load operation via Miller and Atkinson cycle concepts, which is the case of EIVC load control strategy.
Three-pressure analysis models and exhaust valve sweep data acquisition
The GT-Power® Three Pressure Analysis (TPA) method was used to validate a total of 110 ER models, based on 110 exhaust rebreathing experiments with different engine operating conditions. Added to that, six standard Atkinson cycle models and six ctSI models at minimum spark advance for best torque (MBT) conditions were validated for valve strategy comparison purposes. The 110 ER models considered sweeps of three important experimental conditions: engine load, auxiliary exhaust valve rebreathing period, and spark timing. The engine load ranged from 2.1 to 9.1 bar IMEP, while the spark timing ranged from more delayed conditions to MBT for each load, reaching a maximum spark advance at −45 ATDC, before which misfire started to happen.
The instantaneous in cylinder pressure profiles were used as inputs to the TPA routine. 42 In addition, experimental condition values such as inlet temperature, fuel, and air mass were used to determine the combustion progress.
The validated models used a two-zone Hohenberg heat transfer model to calculate apparent heat release rate from the experimental in-cylinder pressure data. Hohenberg’s correlation 43 is based on Woschni’s work, 44 but is easier to apply due to motored pressure non dependence and corrections related to heat transfer underestimation during compression and overestimation during combustion. On previous research, the authors found that Hohenberg’s correlation was the one with the best performance in a two-zone model for a SI engine fueled with hydrous and wet ethanol fuels. 8
For the comparison between valve strategies, TPA simulation results for indicated thermal efficiency and in-cylinder peak temperature were made between ctSI, Atkinson cycle and ER valve strategies to determine whether the use of ER with ethanol can improve SI engine operation in terms of both efficiency and environmental impact.
ANN models inputs, outputs, and hidden structure definition
Artificial neural networks are called connectionist models because of the connections found between the nodes. 45 ANN model weights (wi) are adjusted during training according to a learning rule method until the artificial neural network performs the desired task correctly. 46 Unlike weights, that are adjusted separately for each input assigned to a node, the ANN biases (bj) are constants used to adjust the output along with the weighted sum of the inputs of the node. 47 Since weights and biases are like adjustment parameters, artificial nodes in a large number of hidden layers often correlate events where there is no correlation because they exceed the complexity level of the problem, leading to a reduction in generalization and causing overfitting. 48
Regarding the selection of inputs for the ANN structures to be tested, the definition was based on a simple criterion: only controllable variables during operation that could potentially impact the exhaust rebreathing process were considered eligible. Among the controllable variables, the chosen inputs included intake manifold temperature, spark timing, fuel flow rate, and the opening and closing times of each of the four valves, specifically labeled as IVO V1, IVO V2, IVC V1, IVC V2, EVO V1, EVO V2, EVC V1, and EVC V2.
Six engine operating parameters were defined as outputs of interest for ER determination using Artificial Neural Networks: net IMEP, PMEP, air flow, total mass trapped at the cylinder (TMT), burned mass percentage at combustion start (BMP0) considering EGR, and average exhaust runner temperature (ART).
ANN inputs and outputs were normalized through the MatLab®mapminmax function, between −1 and +1. Initialization of weights and bias for the layers used the inbuilt function rand, to randomize the distribution, in a limited range between −2 (Lwlim) and +2 (Uplim) according to equation (1),
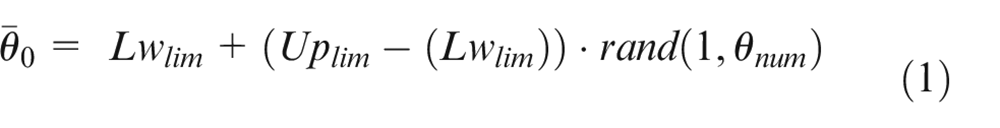
where
The neural transfer function used to calculate the hidden layers outputs from their net inputs was the tangent-sigmoid transfer function. This transfer function has the form given by equation (2), with the hidden layer output
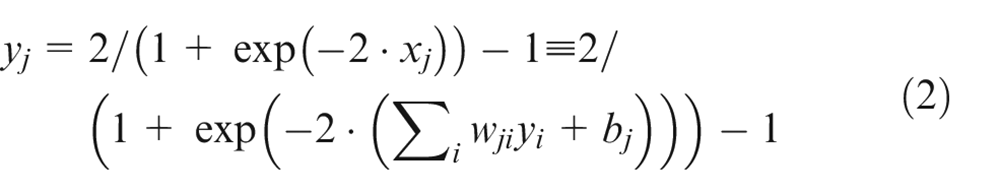
where
The ANNs used in this research were evaluated in three different ways: the hidden layer structure, considering number of nodes and hidden layers; the training procedure for best ANN selection; and the method used for weights and biases optimization. ANN models hidden layer structure were tested with 1, 2, and 3 layers, whilst the number of hidden layer nodes varied between: 10, 20, 30, and 40 for one hidden layer; [20 20] and [30 10] for two hidden layers; [15 20 10] and [20 15 15] for three hidden layers.
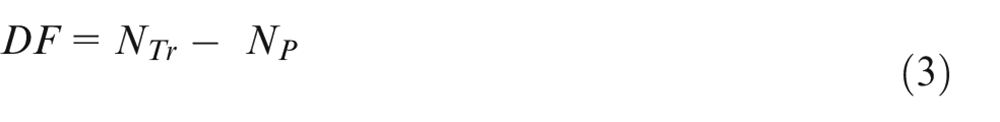
The degrees of freedom of each ANN model were evaluated according to equation (3), relating the total number of measured input points for training (NTr) and the number of parameters (NP), given by the weights and biases, in the network.
The final data configuration for ANN training was 913 input points. For ANN models validation, 297 input points were used from random experimental ER tests from all engine loads. This way, the validated dataset ensured that all engine loads were evaluated. Thus, a total of 1210 input points were used, from which 75% were used for training and 25% were used for validation.
If the fit to the experimental data remains inadequate using a single ANN structure, even after testing various methods of weight and bias optimization, a combined structure test will be conducted using two ANNs. In this approach, the initial ANN structure will retain the outputs that demonstrate a satisfactory fit based on error calculations. Conversely, outputs with poor fit will be retrained using the same 1210 input points but in a simpler ANN structure. These retrained outputs will undergo individual error testing to assess their fit. The structure with the lowest error, in combination with the initial ANN, will be selected. This second structure will have distinct weights and biases and will exclusively utilize the data from outputs that were not adequately adjusted by the initial ANN for training and testing purposes. Consequently, it will be treated as a combined ANN structure.
Figure 2 displays a flowchart of the entire modeling and optimization procedure, from the GT-Power® model validation and experimental data acquisition to the final ANN model selection.
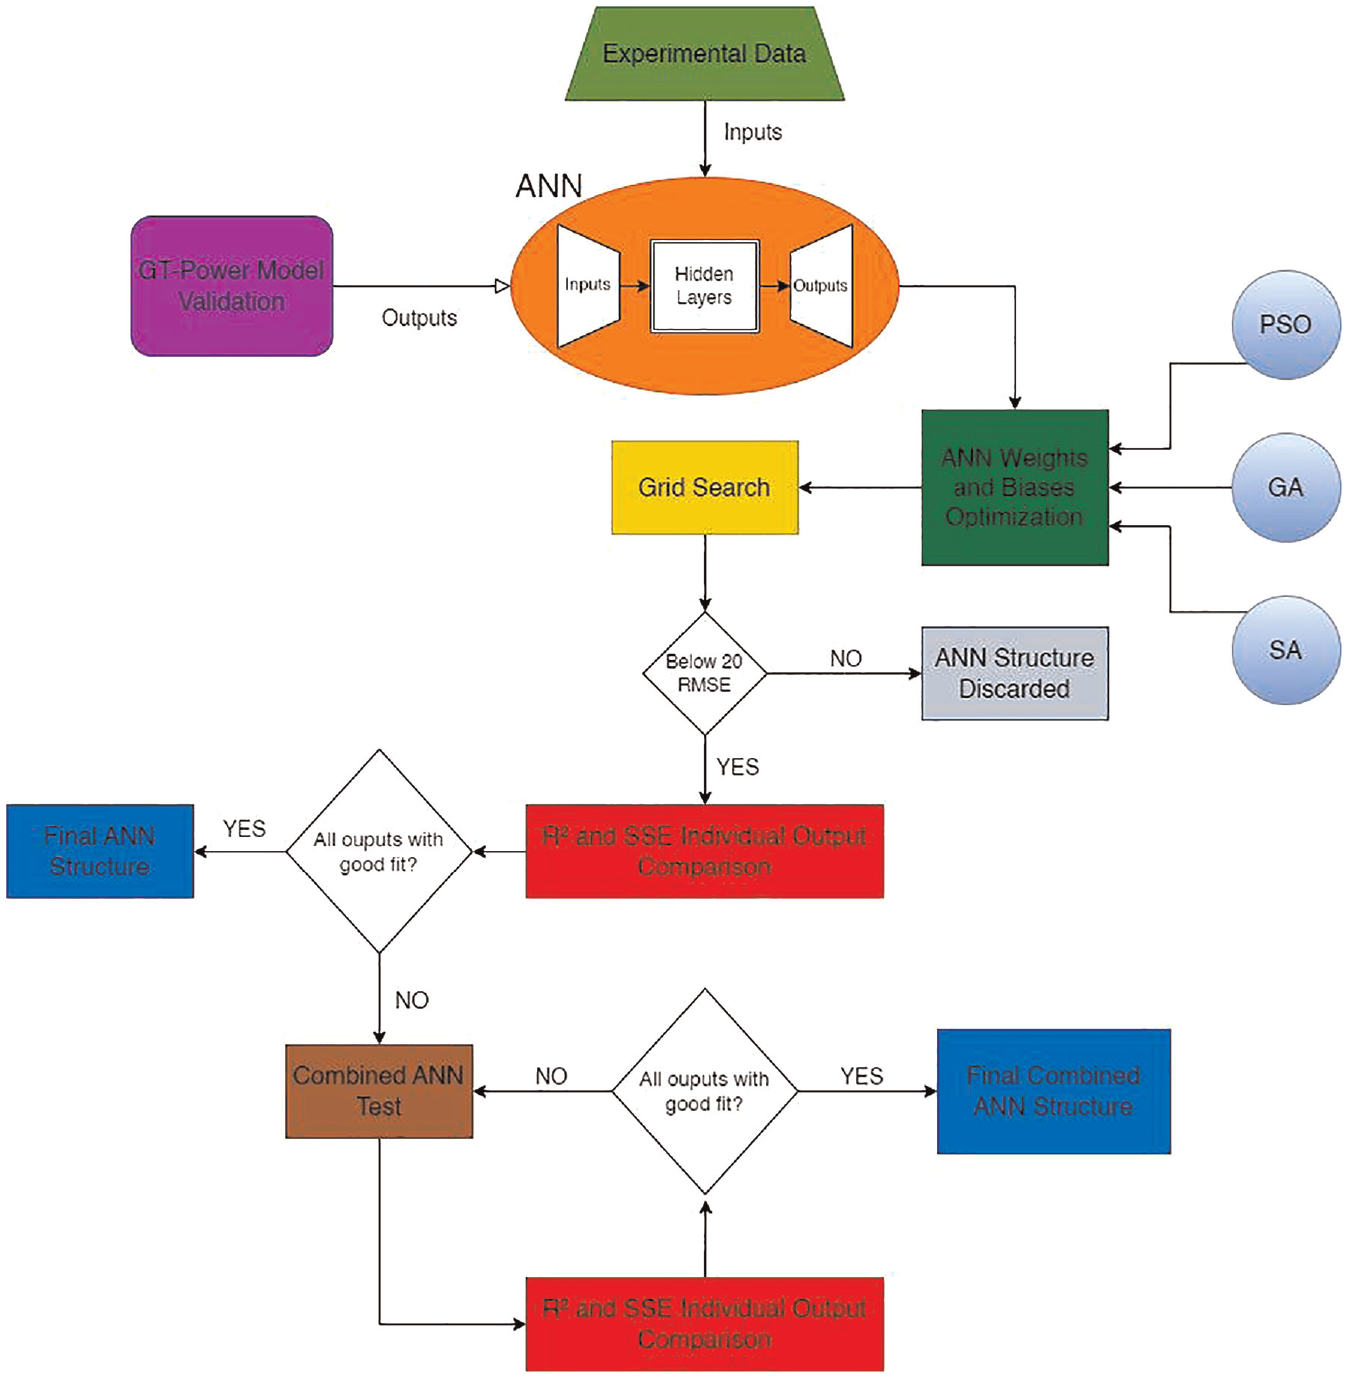
Modeling, optimization, and ANN selection flowchart.
Weights and biases optimization methods
Regarding the optimization methods for the ANN weights and biases, a hybrid approach was tested with three stochastic algorithms for large-scale systems followed by a deterministic optimization with the MatLab® built-in function fmincon with the interior-point algorithm. The stochastic algorithms used were a Particle Swarm Optimization (PSO) based on the one from Kennedy and Eberhart, 50 a Genetic Algorithm (GA) based on the one from Goldberg 51 and a Simulated Annealing (SA) based on the one from Ingber. 52
The objective function (Fobj) to be solved was a least squares function, with a sum of the normalized outputs as shown in equation (4),
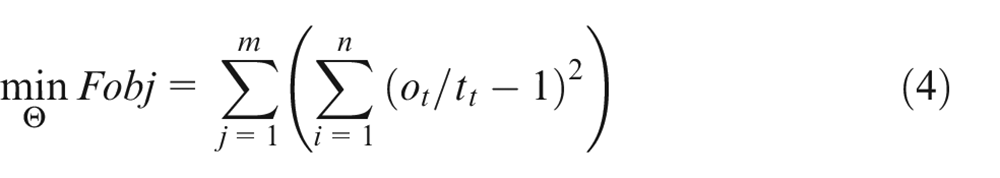
where m is the number of outputs, n is the number of experimental values for each output, ot are the ANN training output values, and tt are the experimental targeted values for training.
Also, θ =
1-D thermodynamic model error calculation
The GT-Power® models had their performance evaluated through the coefficient of determination (R2) and the root mean squared error (RMSE) for in-cylinder pressure and volume, along with some desired outputs. ANN models had their performance evaluated: graphically through Pearson’s coefficient of correlation (R) between outputs and targets and the RMSE of all outputs, for ANN structure comparison; and numerically through R2 and the Sum of Squared Errors (SSE) percentage of the predicted values against the training and validation targeted points, to elucidate differences between ANNs structure, optimization methods and training procedure. Equations (5)–(8) show how R, R2, RMSE, and SSE were calculated, respectively:
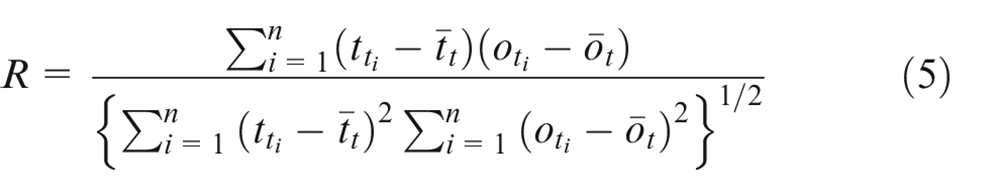
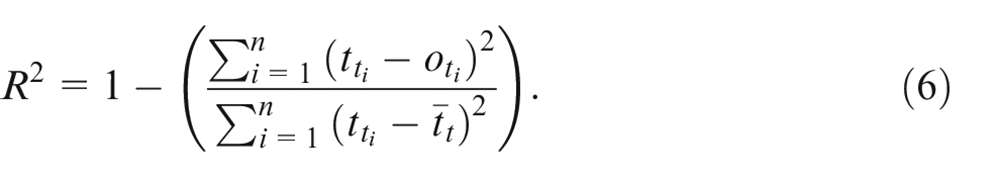
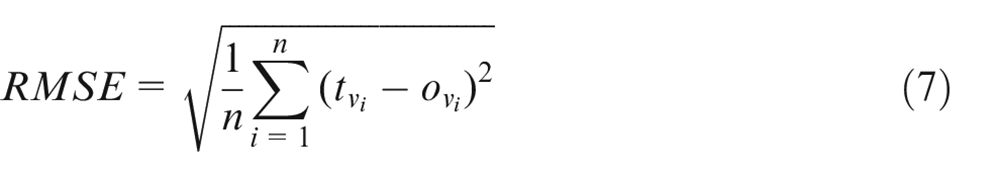
where n is the number of experimental values for each output, ot are the ANN training output values, ov are the ANN validation output values, tt are the experimental targeted values for training,
Experimental setup
The experimental setup is divided into three subsections: description of the SI engine and test cell; description of the ER experiments; and data analysis.
SI engine and test cell description
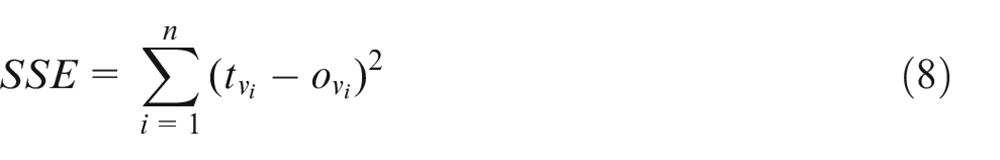
Ricardo Hydra single cylinder camless research engine with port-fuel injection (PFI) was tested with anhydrous ethanol fuel with several exhaust rebreathing valve profiles under Atkinson cycle. Main engine characteristics are presented in Table 1.
Main engine characteristics.
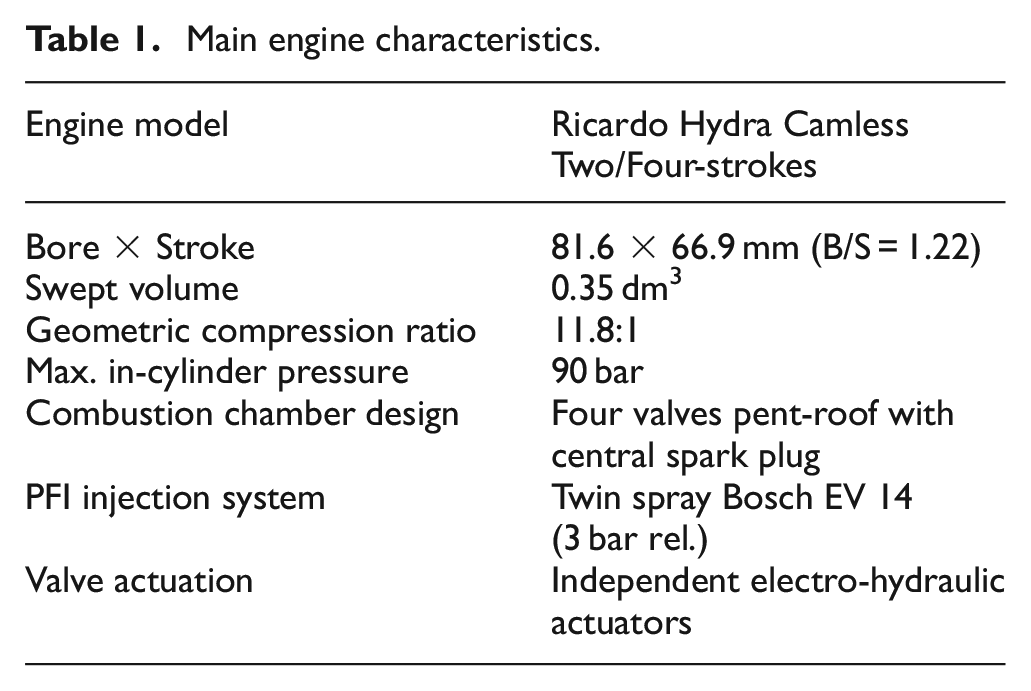
All engine characteristics and peripherals, as shown in Figure 3, were the same as the ones described in Fagundez et al. 34
Test cell schematics.
Test description
Several exhaust valve opening periods and timings were tested during the intake stroke to investigate the effect of the rebreathing on engine operation. Due to valve control limitations, only one exhaust valve could be actuated to open during the exhaust stroke, whereas the other exhaust was used to promote the ER. This incurred in exhaust gas backflow from the exhaust ports to the cylinder which increased residual gas trapping. A target valve lift of 3.0 mm was used in order to prevent valve to piston contact during tests. Other work performed at the same engine 27 investigated the impact of low valve lift compared to higher valve lifts, and it is known that engine performance could be enhanced while using a higher valve lift. On the other hand, as the present work investigates engine operation only with target 3.0 mm valve lifts, it proposes a comparative performance analysis at a constant valve lift condition. Two different approaches were taken in an effort to simplify the tests: for low loads, from 2.0 and 3.1 bar IMEP, the rebreathing period was set while intake valves were opened during the later phase of the intake event; for medium to high loads, from 4.5 to 9.0 bar IMEP, the end of the rebreathing period was set to occur near the BDC in order to provide IVC near the bottom dead center to increase combustion temperature and provide higher effective compression ratio as possible.
All tests were taken at 1500 rpm with the stoichiometric air/fuel ratio for the loads of 2.0, 3.1, 4.5, 6.1, 7.5, and 9.0 bar IMEP (±5.0% IMEP). Spark timing was varied in an attempt to achieve MBT operation. Additionally, the PFI timing was set to TDC at firing condition. The maximum spark advance was 45° BTDCf, before which the misfires started to happen, and the more delayed spark timings were around 10° BTDCf. Table 2 shows the valve lifts and valve events during ctSI, Atkinson cycle, and exhaust rebreathing for MBT operation. It is important to mention that only in the ER strategy a variation in the second exhaust valve movement was evaluated, whereas in the other two modes of operation, the first and second exhaust valves were equally moved.
Exhaust and intake valves variation according to load for ctSI, Atkinson cycle and ER strategies under 1500 rpm and MBT operation.
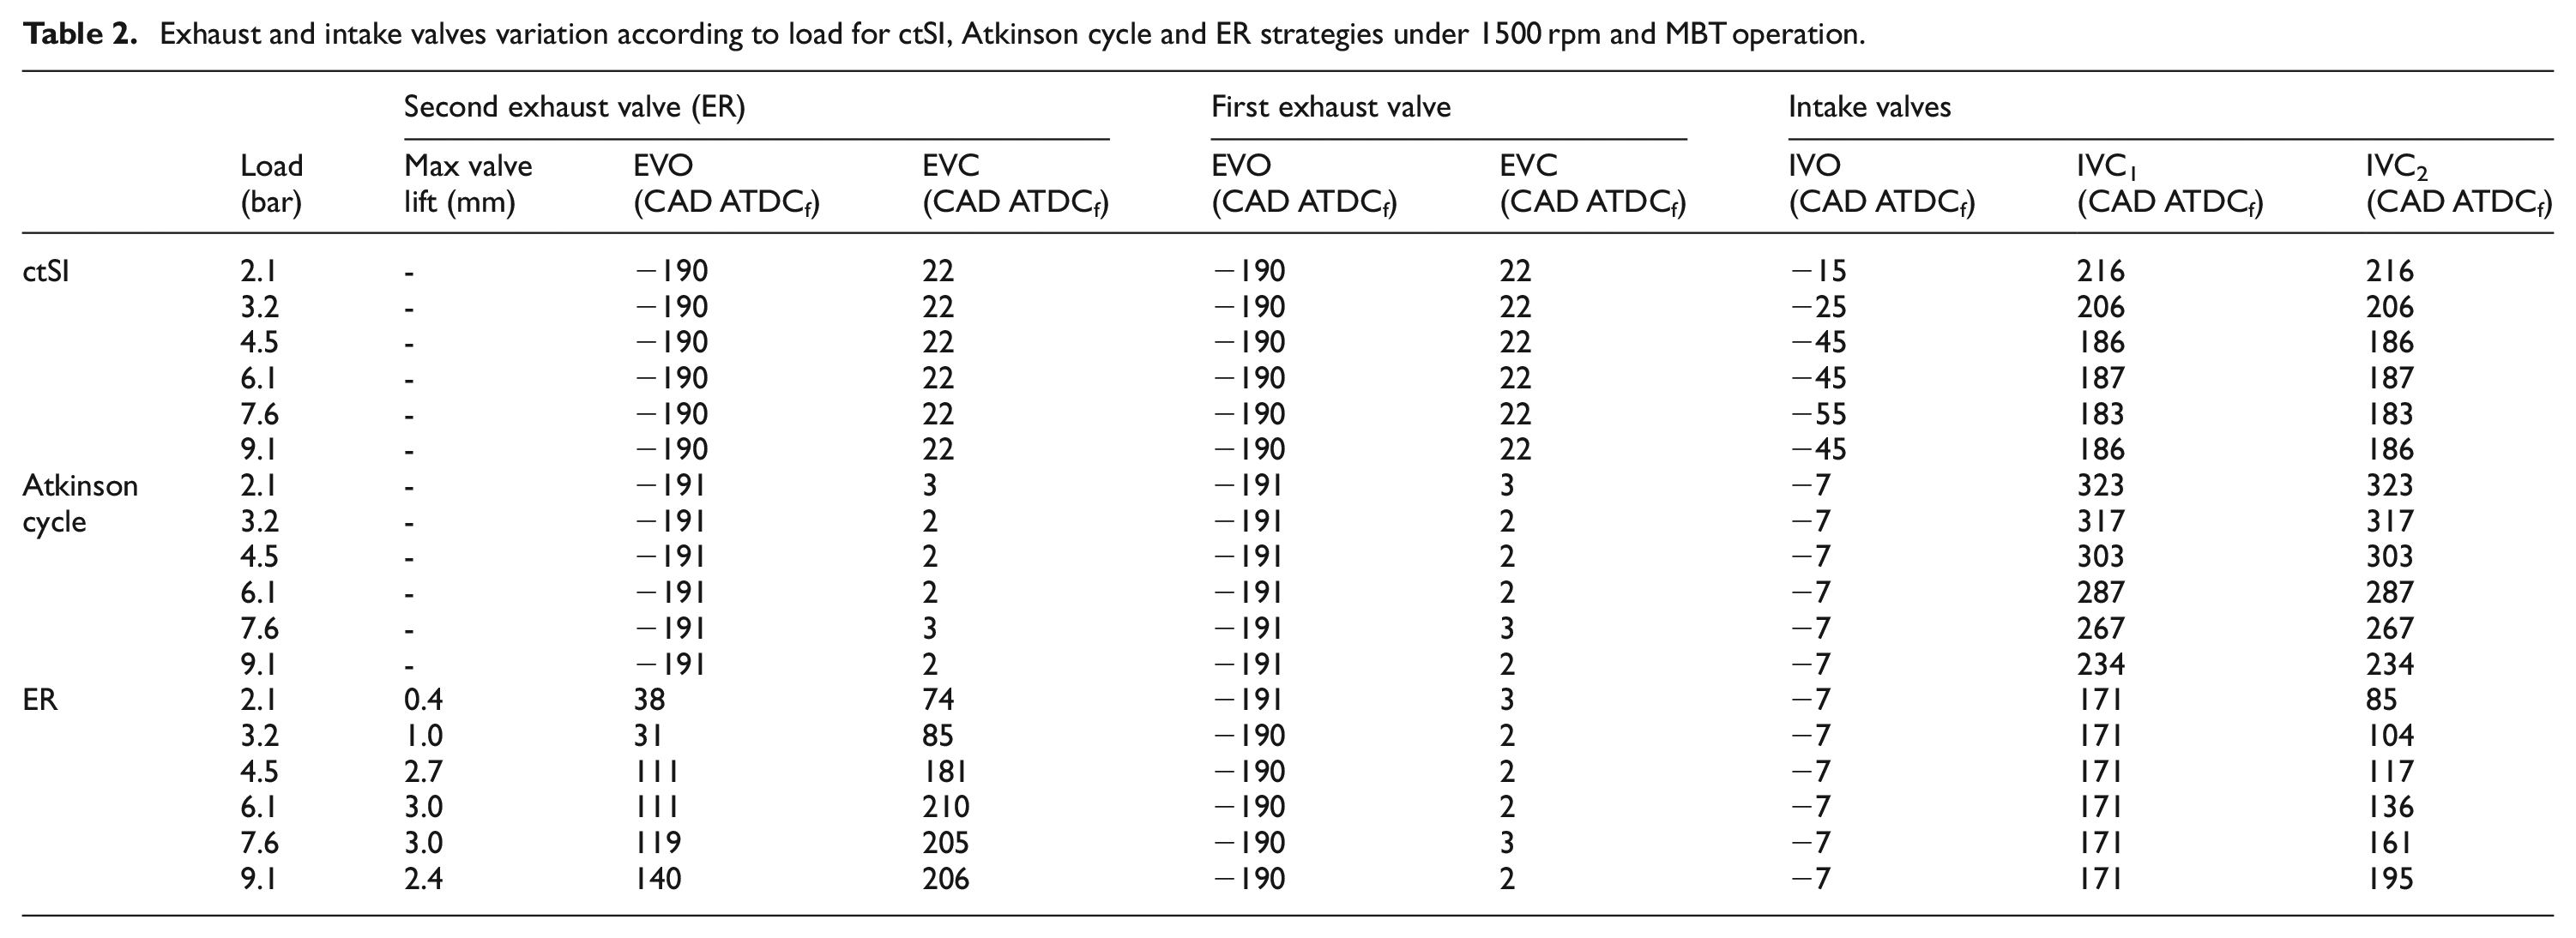
It should be noted that Table 2 shows the valve variations in ER mode of operation only for the best efficiency condition. Overall, 110 operating conditions were tested in ER mode, with variation mainly in the ignition timing, IVC2, and the opening and closing moments of both exhaust valves.
Data analysis
Output parameters that were relevant from the engine calibration point of view and investigated in this study were: net indicated mean effective pressure (IMEP); pumping mean effective pressure (PMEP) and air flow. The air flow was defined based on the fuel flow values to maintain a stoichiometric air-fuel ratio (λ = 1).
The calculation methodology for the efficiency related parameters was based on gross IMEP, given by equation (9):
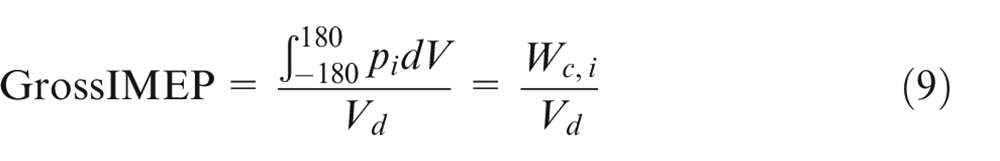
where
The pumping work was also considered due to the intrinsic nature of the ER strategy with the intake and exhaust valves. Therefore, PMEP is given by equation (10):
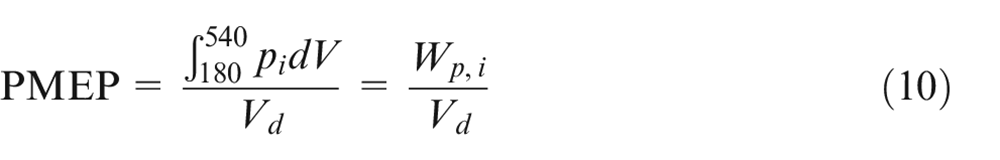
where Wp,i is the pumping work per cycle.
With gross IMEP and PMEP defined, it is possible to determine the net IMEP, which is the mean effective pressure calculated based on the amount of fuel-air mixture that is actually burned in the engine, according to equation (11):

The net IMEP was used through the whole work to compare engine operating load.
Results
The results section is divided into several subsections: the first shows the results for GT-Power® validation for 110 experimental ER tests on the SI engine and the comparison between ctSI, Atkinson cycle and ER at MBT; the second compares the different artificial neural network models built to learn and reproduce the SI engine behavior from the experimental inputs and GT-Power® outputs considering ER, engine load, and spark timing sweeps; the final subsection proposes a combined ANN structure that can represent the experimental process with less prediction error for each output variable separately.
1-D thermodynamic model validation
Aiming to determine key operating parameters from the exhaust rebreathing strategy, the use of TPA models on the GT-Power® environment was of fundamental importance. While net IMEP, PMEP and air flow could be determined experimentally, the burned mass percentage (BMP0) reinserted during ER and total mass trapped (TMT) during the operating cycle could only be obtained by analyzing each combustion process through TPA simulation. Furthermore, the average exhaust runner temperature was also assessed as a means to determine the ER profiles based on the exhaust gases released. Figure 4 shows the GT-Power® ER models validation in terms of Log P/Log(V/Vmax) at MBT engine conditions. Although only the MBT tests validation are shown, it should be highlighted that all 110 ER tests, six Atkinson cycle and six ctSI tests were validated similarly.
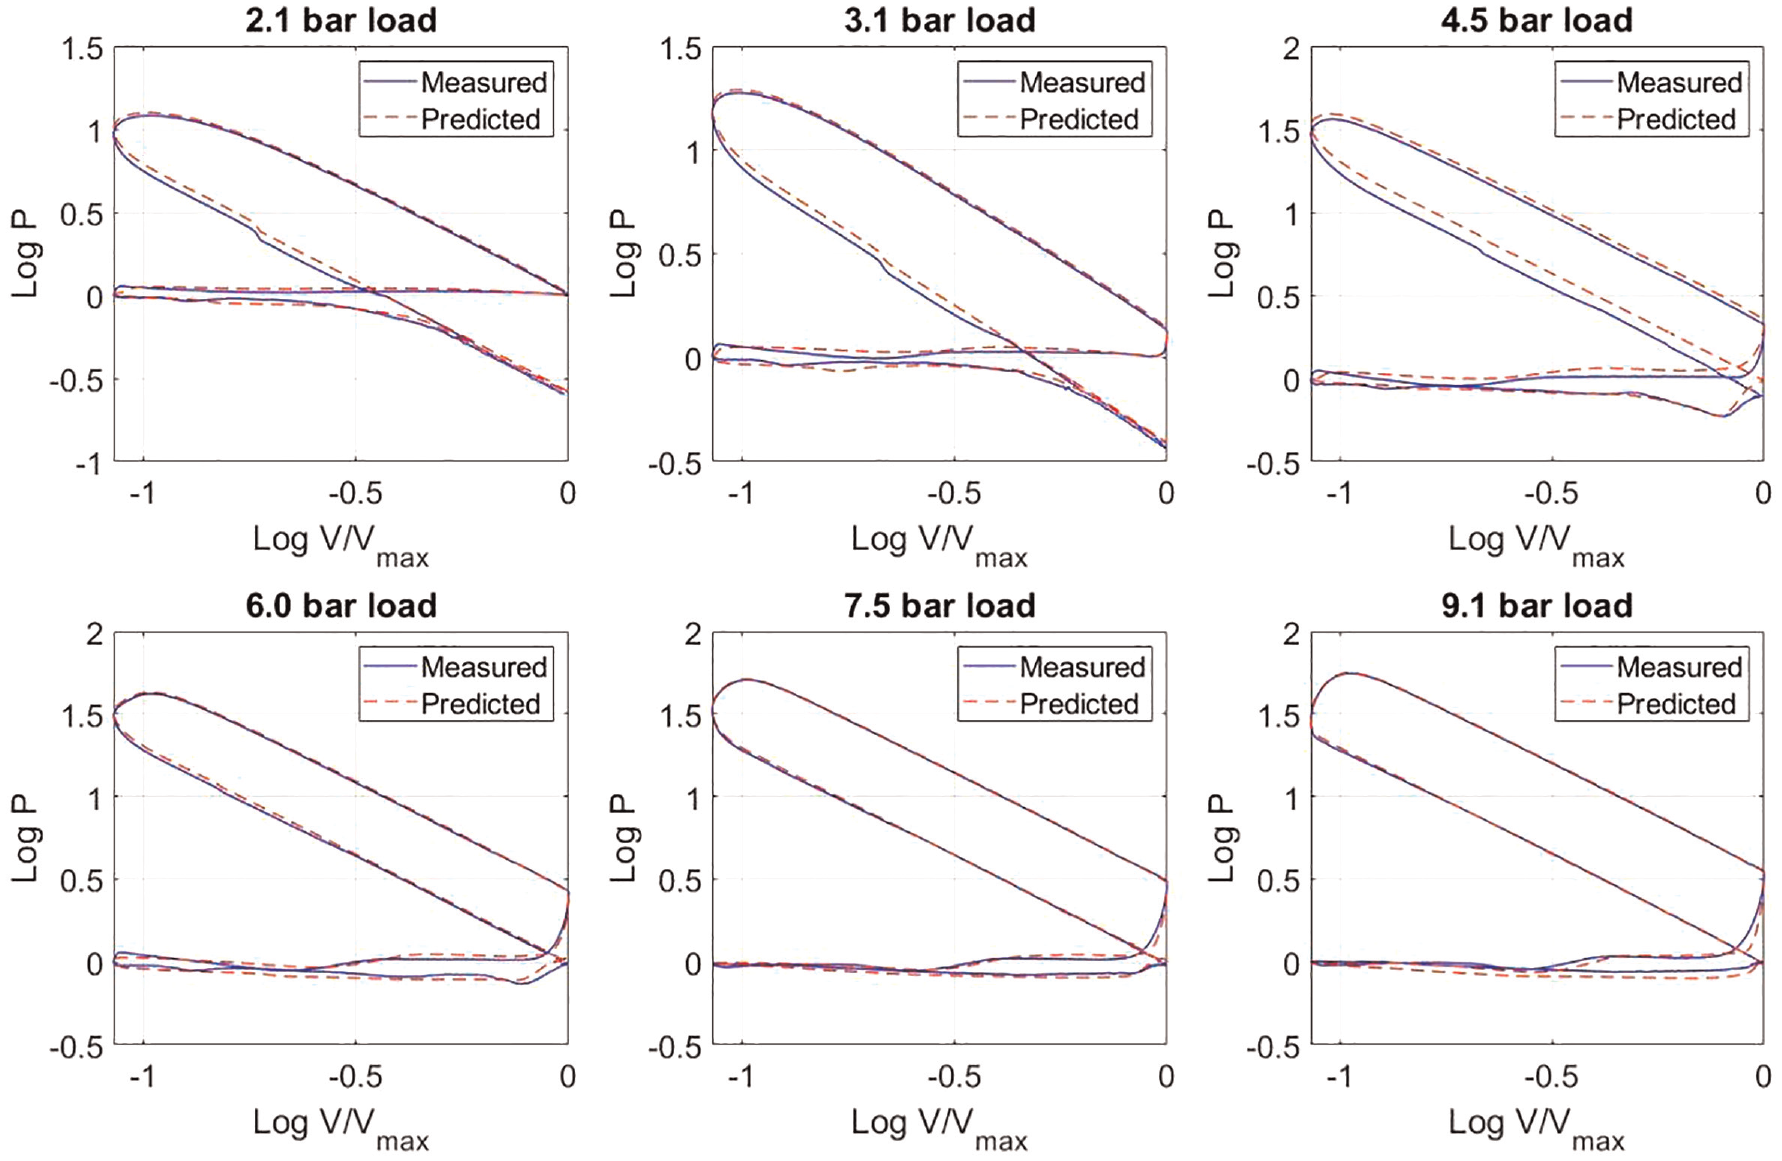
GT-Power® models validation Log P/Log(V/Vmax) for ER at MBT.
TPA simulation adjustments had good accuracy, especially in the intermediate and high loads of the SI engine. At intermediate engine loads, some models predicted higher values of in-cylinder pressure during the high-pressure cycle, causing a detachment that is visible in Figure 4 between measured and predicted curves. These differences, however, were low regarding absolute values. The errors between measured and GT-Power® predicted values of Log P/Log(V/Vmax) can be seen in Table 3 for each engine load in terms of R2 and RMSE.
R2 and RMSE average values between SI engine measured and GT-Power® predicted data for Log P/Log(V/Vmax).
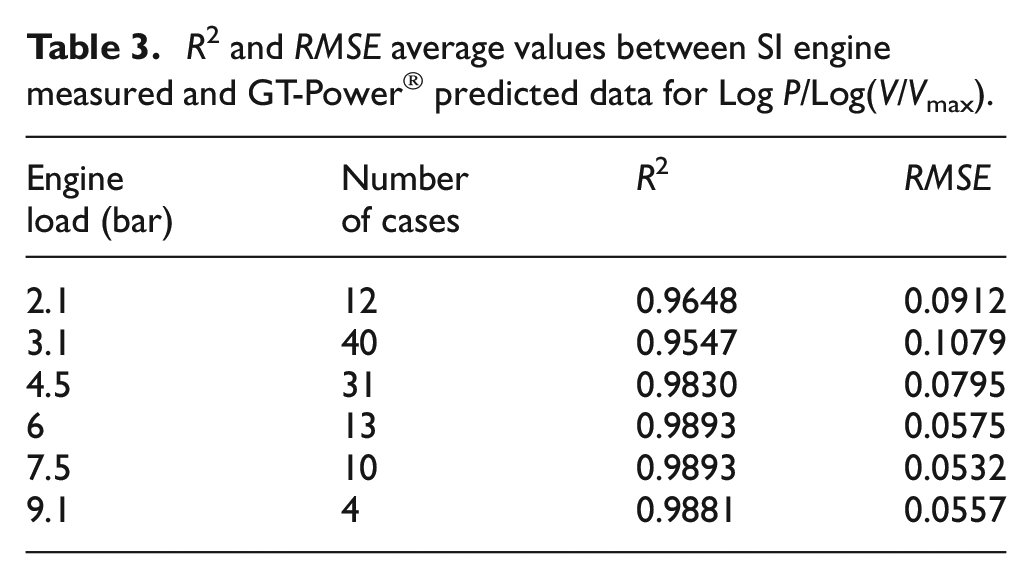
As previously stated, 2.1 and 3.1 bar loads showed the greatest differences between measured and predicted values, a fact corroborated by the average error values in Table 3. Nevertheless, all average values of R2 were above 0.95, showing good correlation between the evaluated cycles, but warning that some curves may not have achieved excellent fit. RMSE results, in the same way, showed that lower engine loads were the ones with more adjustment errors in the models, whereas intermediate and high load models adequately represented the SI engine in all cases tested. This occurs because, in cases where the engine load was lower, pumping work had a relatively higher impact on overall engine operation. As pressure values during pumping period are lower than 110 kPa, while high-pressure values are generally above 1000 kPa during power stroke (and increase with engine load), at lower the loads the pumping deviation had a greater impact on to the R2 and RMSE than at higher loads, causing the GT-Power TPA curve fitting criteria to be worse.
It is also important to evaluate the models in terms of some desired outputs. Net IMEP, PMEP, and air flow are three of the adjustment parameters considered by the TPA models and also three of the outputs to be evaluated by the ANN models. Good adjustments between measured and GT-Power® predicted values are essential to ensure that the other outputs trained by the ANN models are reliable and correctly represent the exhaust rebreathe process.
Figure 5 shows the GT-Power® validation and RMSE value for net IMEP, PMEP, and air flow for all 110 experimental tests performed. Although uncategorized by different engine load, net IMEP results present the SI engine load sweep made during the experiments.
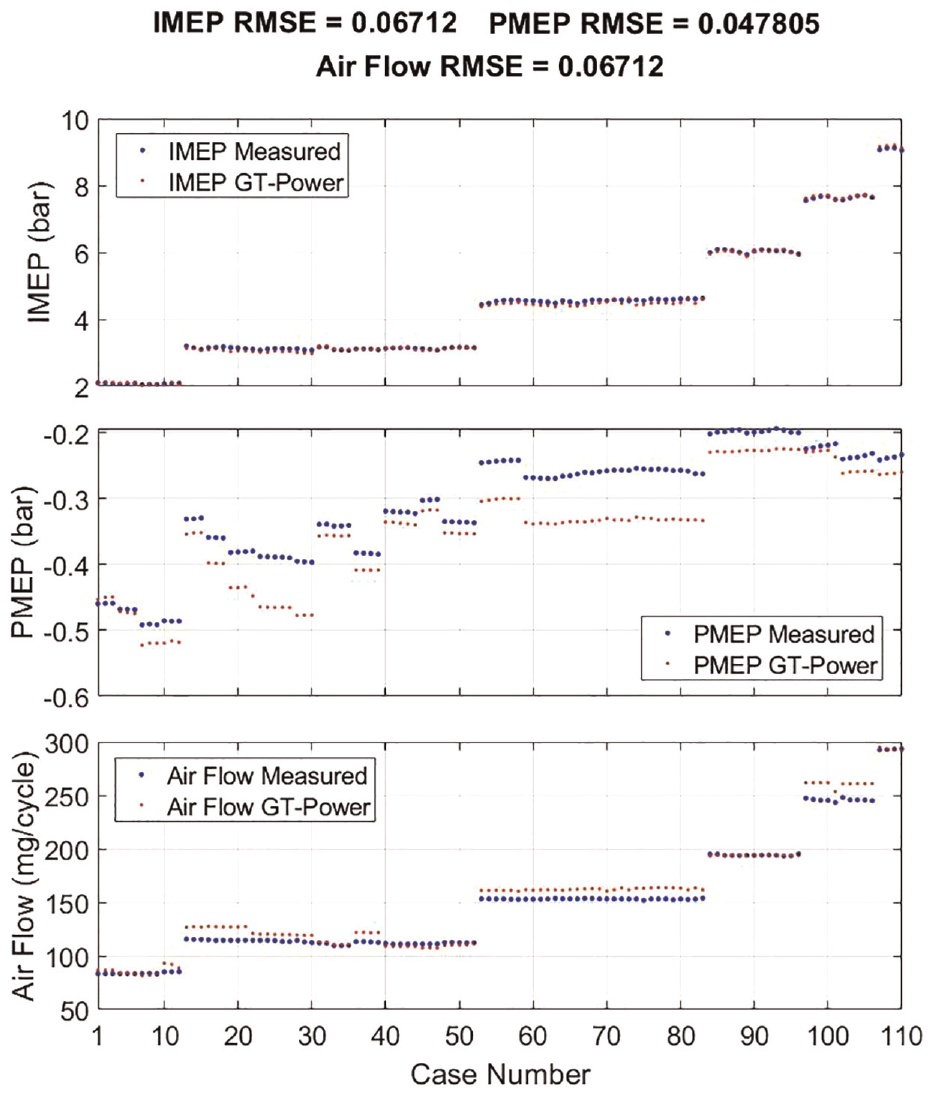
GT-Power® models’ validation and RMSE for IMEP, PMEP, and air flow.
The outputs in Figure 5 show a good fit between measured and GT-Power® predicted values. The absolute error for PMEP was higher for some 3.1 and 4.5 bar IMEP cases, with maximum variation of −0.5 bar. Air flow validation also presented good fit between measured and predicted values, with more prominent variations in some 3.1, 4.5, and 7.5 bar load and low overall RMSE.
Figure 6 shows the comparison between the ctSI valve strategy (Otto cycle), the standard Atkinson cycle and the Atkinson cycle with ER valve strategy results for indicated thermal efficiency and in-cylinder peak temperature for the SI engine TPA simulations considering the MBT experimental tests.
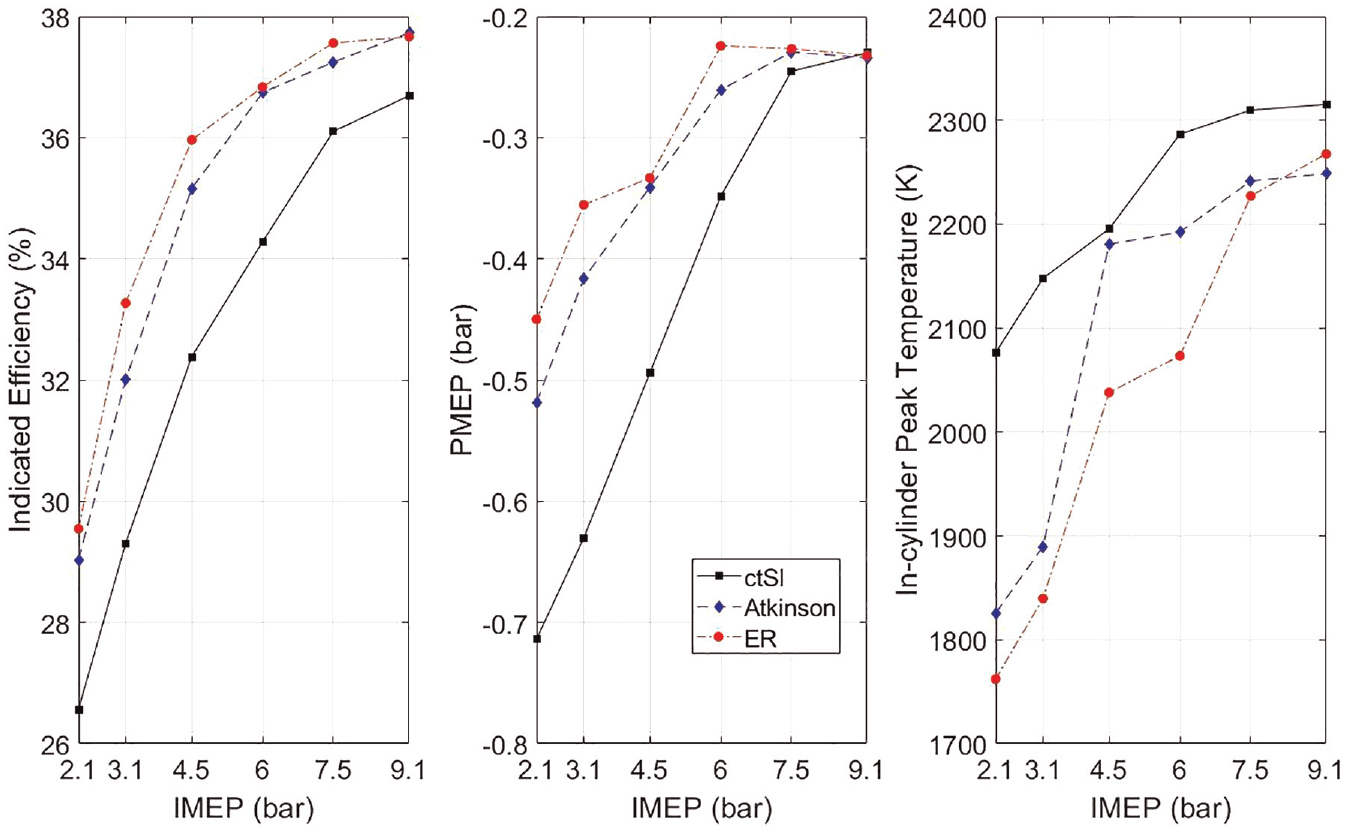
GT-Power® models predicted indicated thermal efficiency, PMEP and maximum in-cylinder temperature at MBT conditions for ctSI, Atkinson cycle, and ER.
The ER valve strategy obtained better results for SI engine indicated thermal efficiency along all tested loads, except at 9.1 bar, where the Atkinson cycle was slightly more efficient. As seen in Figure 6, there was an evident improvement in engine efficiency using ER and Atkinson cycle valve strategies in comparison to ctSI especially due to reduced pumping losses when using WOT and EIVC load control strategies. These losses become evident through the comparison of PMEP curves, where conventional Otto cycle operation shows significantly higher losses at lower loads since the throttle valve must close to restrict the airflow and reduce the intake pressure, while at Atkinson cycle and ER, the engine operation was unthrottled. As expected, the in-cylinder peak temperature was lower for ER in almost all engine loads because of charge dilution. The achieved results demonstrate that, for the tested engine and particularly under low load conditions, the ER valve strategy was more efficient than Atkinson cycle or conventional Otto cycle operating modes, with all three strategies using ethanol as fuel, while it would also lead to reduced NOX emissions due to lower temperatures during combustion.28,53,54
With the set of results obtained for the validation of GT-Power® ER models, it is possible to state that the outputs are reliable for training and validation by artificial neural networks, with low expected errors between simulated and experimental values.
ANN models training and validation performance
Along with the weights and biases parameters tuning, the grid search acts as a hyperparameter optimization by analyzing the number of nodes and hidden layers of each structure, discarding the ones with higher training and validation errors. 55 It is not necessary to individually analyze each output in this initial grid search analysis, which is why a global RMSE value is considered for each structure.
Figure 7 shows the RMSE value for all eight ANN structures tested for both training and validation performance. A red line was drawn on the bar graph as a limiting value, where any structure with RMSE above the line was discarded.
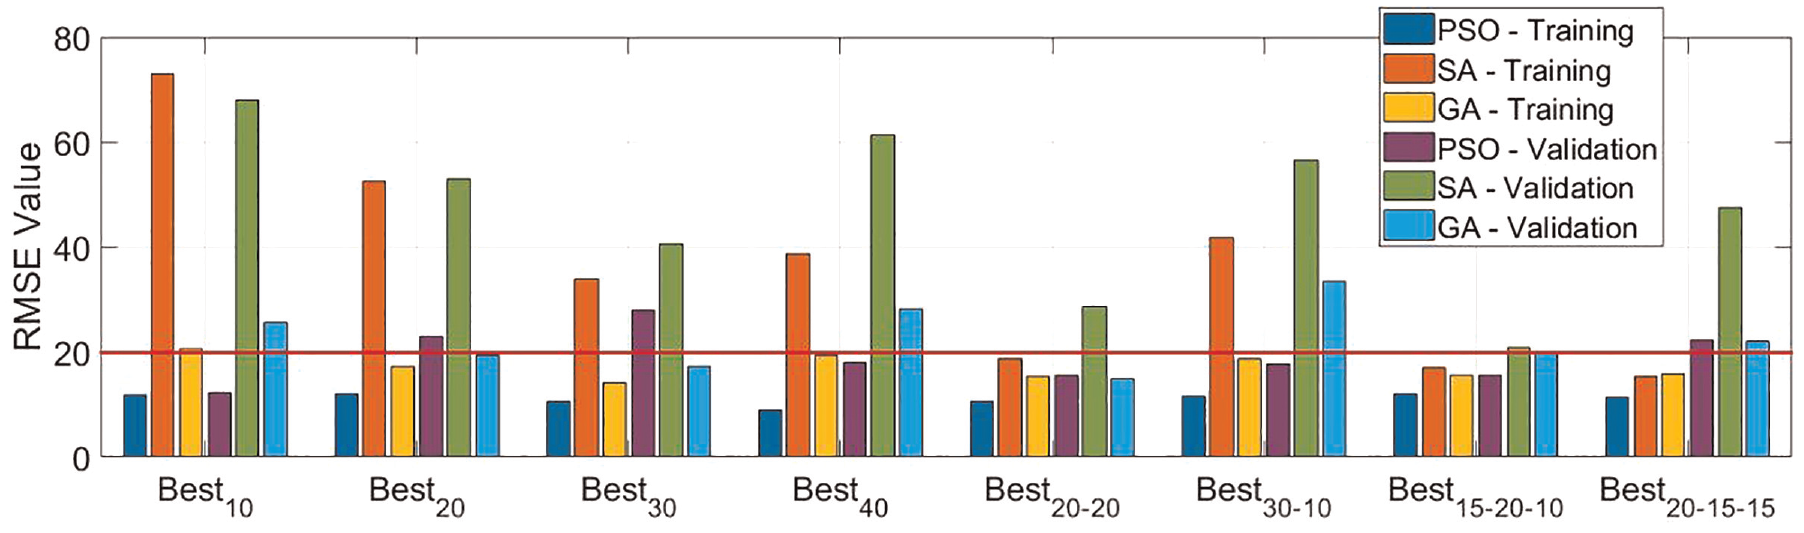
Grid search between PSO, SA, and GA for all ANN structures tested.
In this first assessment, no ANN model with simulated annealing optimization obtained RMSE lower than 20 for both training and validation. Among the models with PSO optimization method, structures with a positive first outcome were: one hidden layer with 10 nodes, one hidden layer with 40 nodes, two hidden layers with [20 20] nodes, two hidden layers with [30 10] nodes, and three hidden layers with [15 20 10] nodes. For optimization with GA method, the selected ANNs were: one hidden layer with 20 nodes, one hidden layer with 30 nodes, and two hidden layers with [20 20] nodes.
Table 4 shows the optimization elapsed time for each ANN structure tested, as a way to compare the different methods in terms of the trade-off between computational cost and performance.
Optimization methods elapsed time.
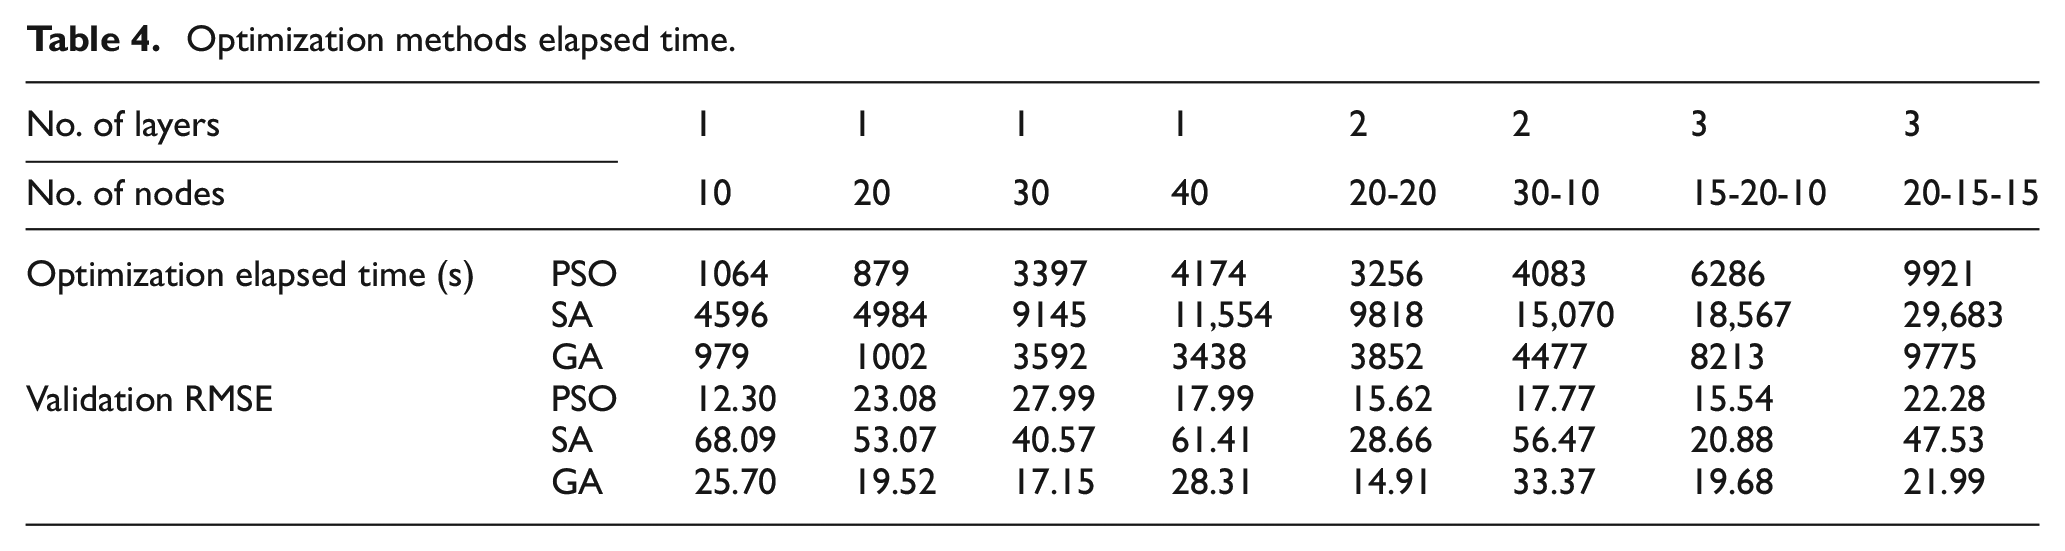
In addition to Figure 7, one can observe in Table 4 the computational cost of each method. It is possible to notice that PSO and GA have similar optimization elapsed times, with a slight advantage for PSO when the number of layers in the ANN increases. On the other hand, the SA method has a computational cost that is at least four times higher than the other two, and the worst validation performance. Combining both results, the trade-off makes it clear that the use of the SA method is unfeasible for the sequence of analyses, while PSO and GA can have their analyses deepened for some structures. It is necessary to emphasize, however, that the absolute computational cost of each model is highly dependent on the processing capacity of the machine used to run the model. Additionally, since the three compared optimization models are stochastic, there may not be a clear linearity between the increase in ANN complexity and the increase in computational cost.
In most cases, network structures with the lowest errors showed similar RMSE values between training and validation, indicating that the selected structures had no problem of overfitting the training data. The selection of the best ANN structure and the best optimization method involves the individual analysis of each output. For the model to be considered suitable for representing the engine, the accuracy of all outputs, or at least the majority, must be high.
Of the various structures selected for further evaluation with PSO and GA optimization methods, the ANN-PSO [30 10] structure had the best outputs accuracy for IMEP, Air Flow, TMT, and BMP0, as shown in Table 5.
R2 and SSE values for the best ANN structure selected.
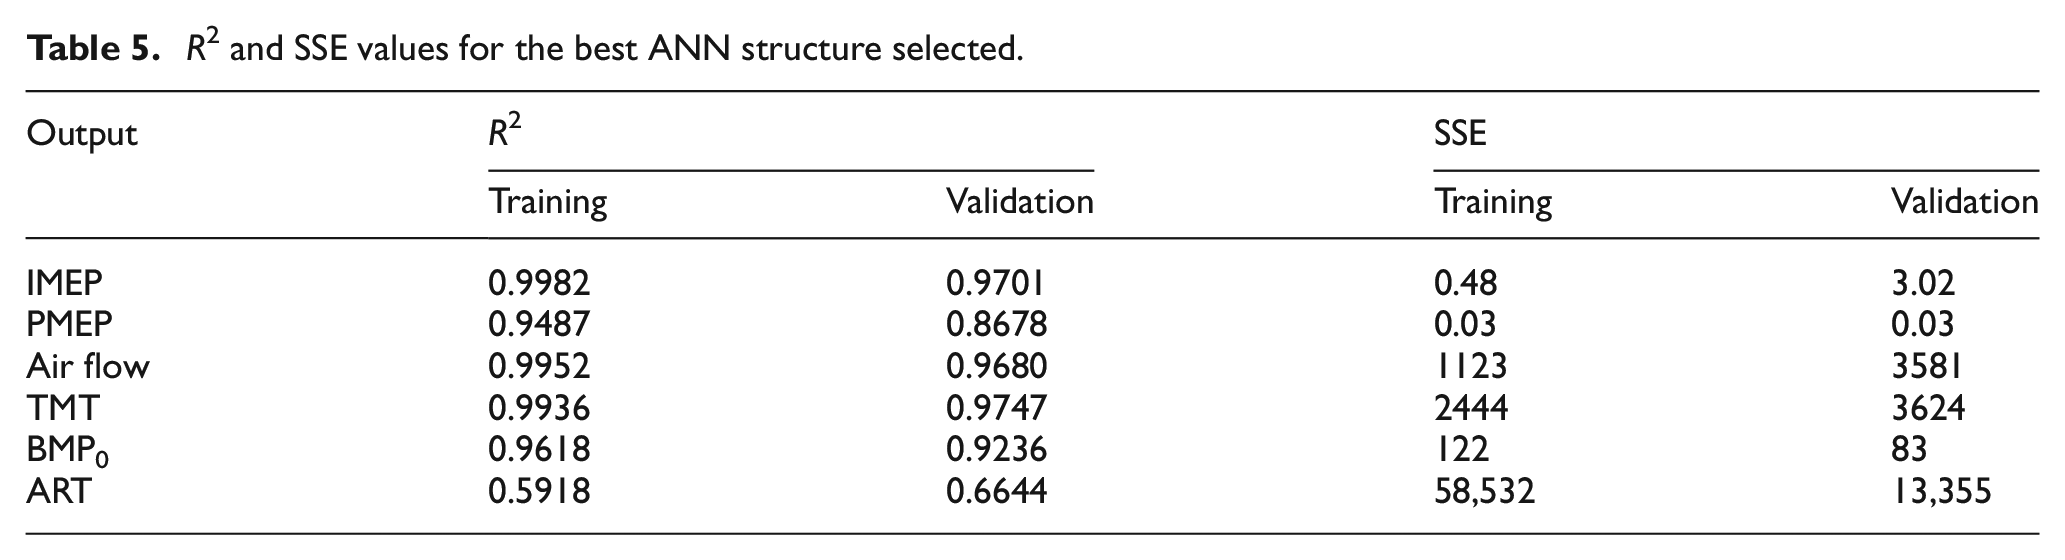
Error evaluation by R2 and SSE are complementary in the analysis of the ANN structures. While R2 value shows whether the outputs of the model have good precision compared to the experimental targets, the SSE is able to quantify more properly if the model incurs in high predicted errors.
Regarding the values of R2 and SSE for the best ANN with a [30 10] hidden layers structure, there was no overfitting of the training data, and the precision achieved by four of the six outputs of the model was satisfactory. Net IMEP, air flow, total mass trapped, and burned mass percentage at combustion start achieved high R2 results for both training and validation, whilst SSE values were relatively low for trained and validated results. One should notice that SSE order of magnitude will vary according to the output values order of magnitude. Thus, outputs such as air flow will in general have a greater magnitude of error than PMEP values. When analyzed together with the R2 values, however, the SSE values show that the only output with high predicted errors was the average exhaust runner temperature, while PMEP had low precision in the validation results, although the error order of magnitude was low. PMEP and average exhaust runner temperature higher scattering are illustrated in Figure 8.
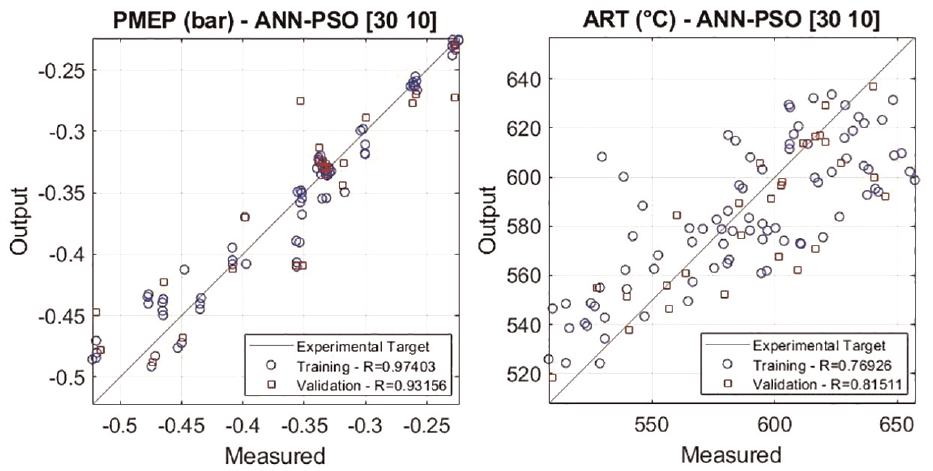
PMEP and average exhaust runner temperature (ART) training and validation error.
The non-linearities of the exhaust rebreathing process were more efficiently represented with a structure such as the ANN-PSO [30 10] when compared to other structures with less hidden layers or nodes. Even so, only four out of six outputs obtained optimal predictions, reaching insufficient accuracy values for PMEP and average exhaust runner temperature. In an attempt to obtain better results for these two variables, an alternative model was tested.
ANN combined structure final model
Even the structures with the largest number of parameters were not able to adjust the weights and biases so that all outputs obtained optimal validation results, indicating that the number of parameters was not the limiting factor of the model performance. A simple alternative for obtaining an ANN structure capable of accurately predicting all six outputs of interest is to combine two different models, with different sets of weights and biases. This is the testing method, referred to in the methodology section, in case the singular structures fail to adequately adjust all the outputs. To create this combined model, only the data from PMEP and average exhaust runner temperature outputs were separated for further training of simpler ANN structures, while the ANN-PSO [30 10] structure was used to predict the already validated outputs. Three different structures were tested with particle swarm optimization: one hidden layer with 5, 10, and 15 nodes. Table 6 shows the R2 and SSE for these three complementary ANN structures.
R2 and SSE values for the best complementary ANN structure for PMEP and average exhaust runner temperature (ART) prediction.
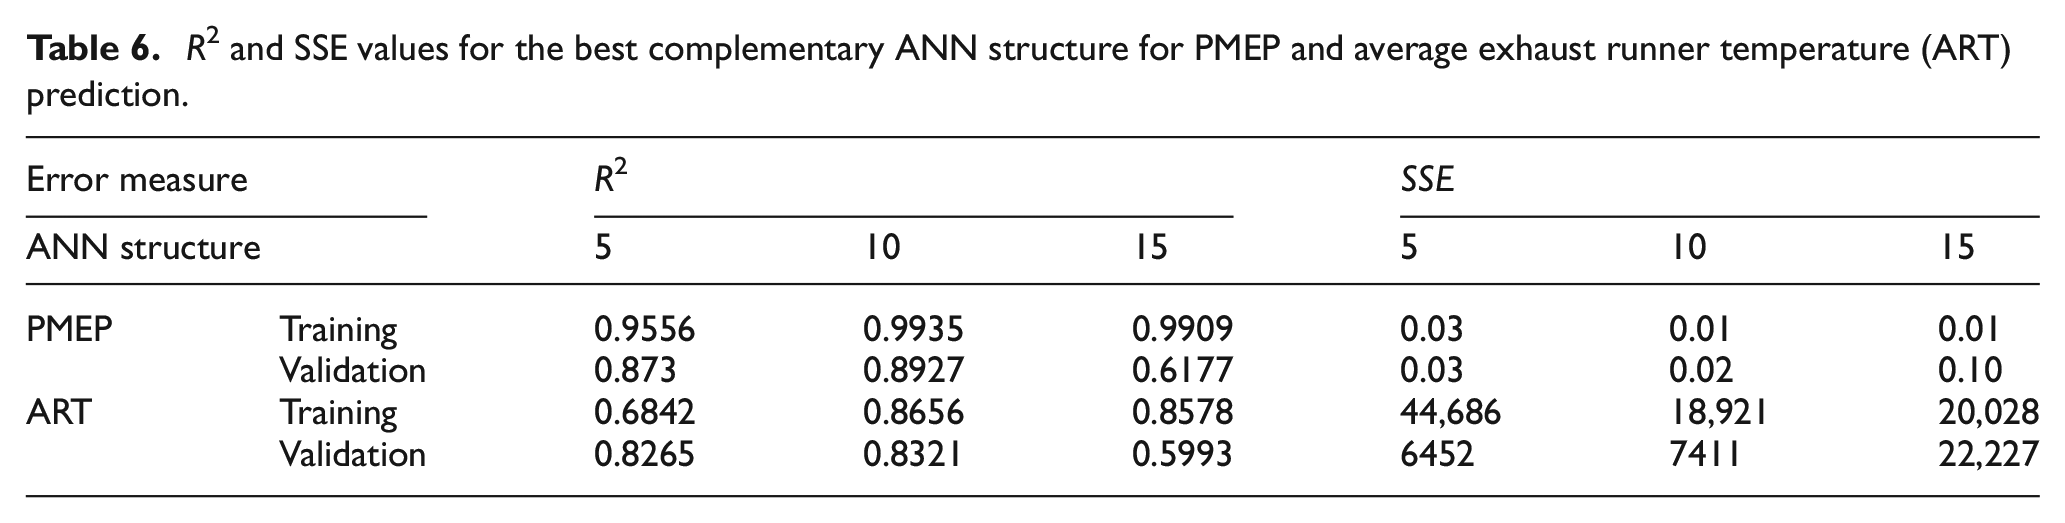
The structure with the best R2 and SSE results for predicting PMEP and average exhaust runner temperature outputs, considering both training and validation, was the 10-nodes hidden layer. Although the five-nodes structure obtained better SSE result for average exhaust runner temperature validation, SSE training values indicated high predicted errors.
When combining the initial ANN-PSO [30 10] with the complementary results of ANN-PSO 10 for PMEP and average exhaust runner temperature, the outputs correlation to the experimental targets are shown in Figure 9.
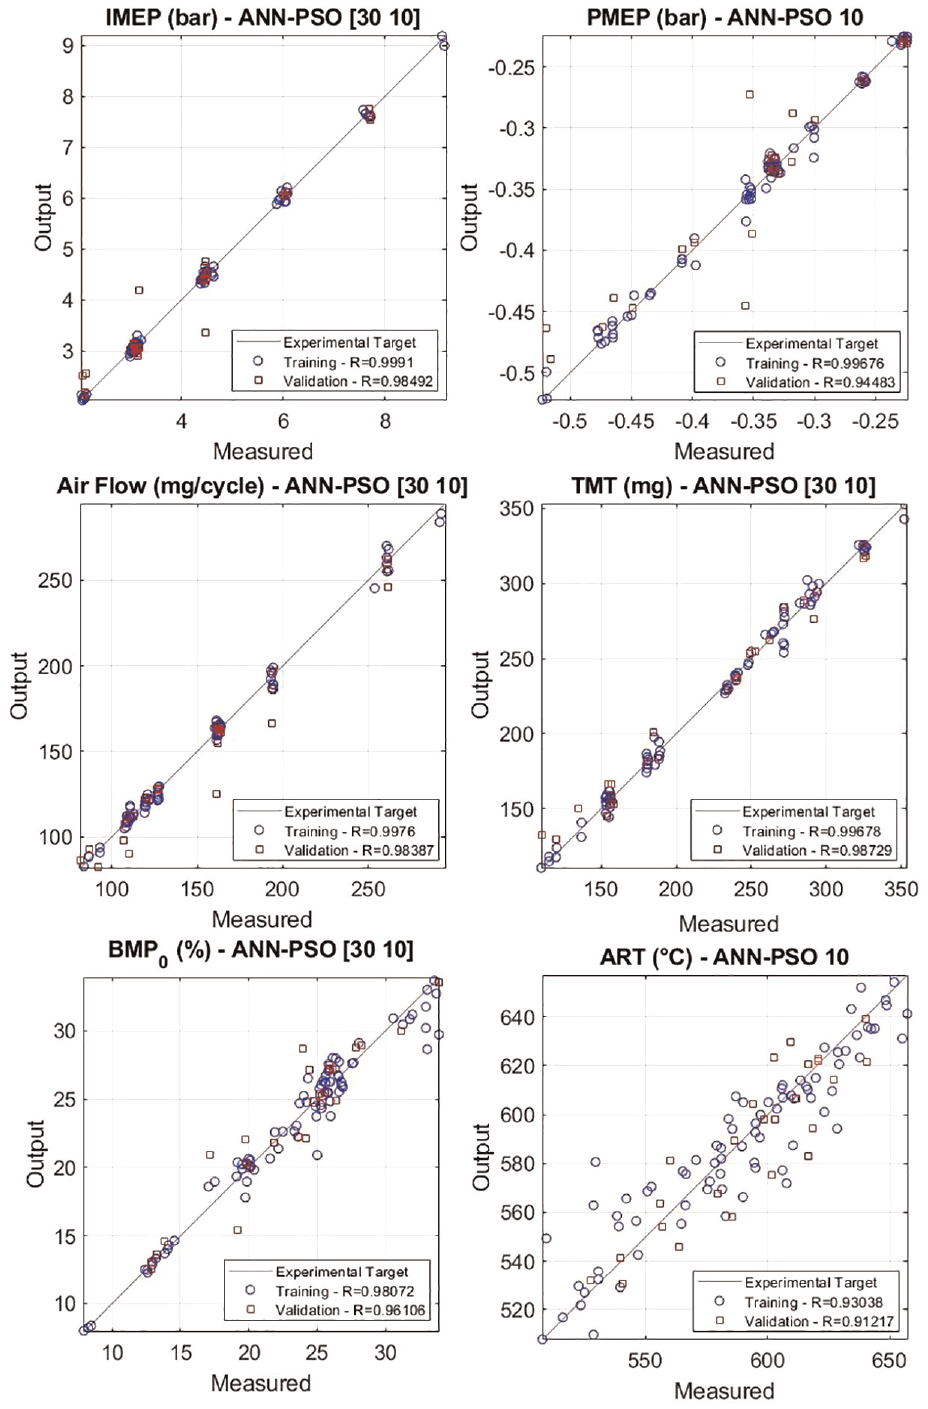
Combined ANN-PSO [30 10] and ANN-PSO 10 model training and validation outputs and measured targets.
The combined ANN structure obtained results with high R2 and low SSE for all outputs, as shown in Tables 5 and 6, with a low overall variance and good precision, reaching a final validated model for the prediction of the ER operation in a SI engine fueled with ethanol. For a wide applicability, it is important that the ANN model has been trained with as many SI engine operating conditions as possible to allow an accurate design of the ER valve strategy.
The schematics of the resulting ANN structure with 11 inputs and 6 outputs is shown in Figure 10, with two hidden layers with 30 and 10 nodes, respectively, for IMEP, air flow, total mass trapped and burned mass fraction at combustion start outputs, and a 10-nodes hidden layer for PMEP and average exhaust runner temperature prediction.
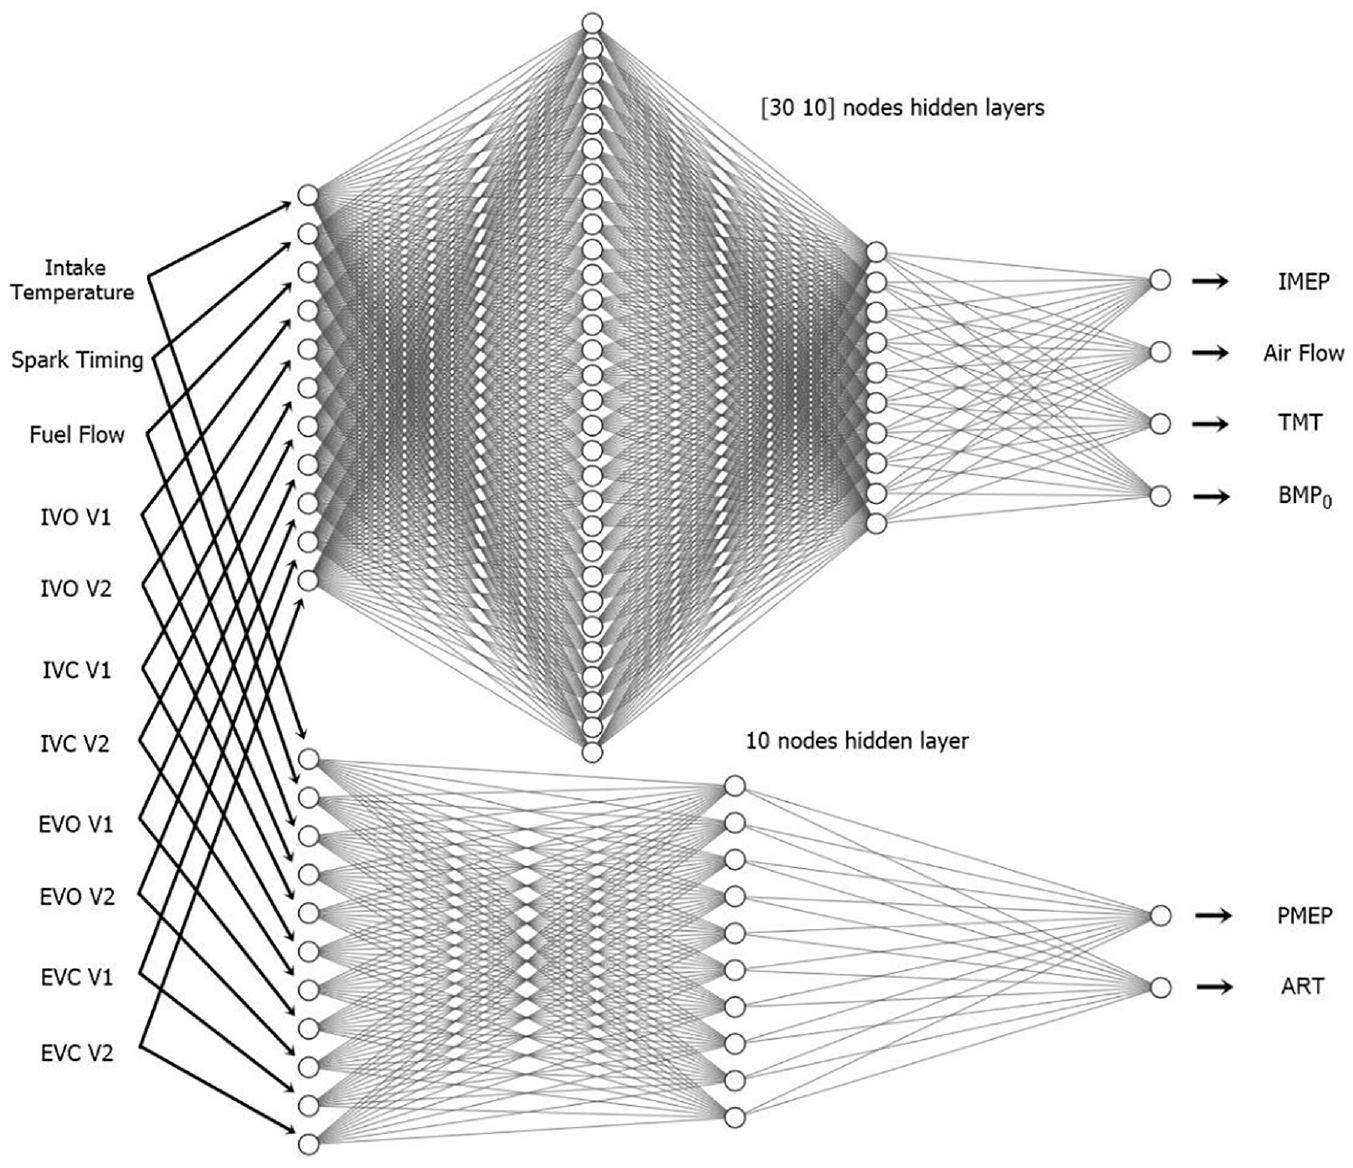
Combined ANN-PSO model for exhaust rebreathing outputs prediction.
As seen in Figure 10, the combined structure uses the same input values to predict six outputs, four of them from the [30 10] nodes hidden layers and two from the 10 nodes hidden layer, with two different sets of weights and biases. Therefore, it is understood through the final structures that IMEP, air flow, TMT, and BMP0 have a higher level of correlation, and these four outputs can be jointly predicted through the 11 inputs used, using a set of fixed weights and biases. On the other hand, PMEP and ART did not have the same level of correlation with the other outputs, and due to the greater error associated with trying to predict them jointly with the other four outputs, another structure was used, with one layer and 10 nodes, for the separate prediction of these two outputs, with another specific set of weights and biases. Thus, the four outputs of the [30 10] structure are independent from the two outputs of the structure with one layer and 10 nodes, but both structures use the same 11 inputs with the same training and validation values.
Still, the use of structures with multiple inputs and multiple outputs (MIMO) in general achieves better performance and demands less computational cost in model development than the alternative of several multiple inputs and single output (MISO) models. Even more than that, training the network structure with more than one output can help the ANN model to learn different characteristics of the process, such as outputs interdependency, and reduce the probability of overfitting. 56
Thus, the ANN combined model could accurately predict some of the combustion process outputs in an Atkinson cycle spark ignited engine operating with a complex valve strategy such as exhaust rebreathing using only easy-to-measure engine parameters, for example, spark timing, valve timings, and fuel flow. This is an important advantage, as this type of prediction would be more difficult and mathematically challenging if a phenomenological, semi-empirical or CFD model was applied. The low computational cost requirement to obtain a trained ANN model makes it possible to use for ECU calibration, with easy connection to receive the outputs data from a supervisory system. This methodology allows real-time prediction of parameters that present non-linear response and require offline validation with third-party thermodynamic models, such as GT-Power®. This would enable the necessary online combustion feedback required for controlling advanced combustion strategies as HCCI, SACI, and other which requires accurate in-cylinder thermal state control to achieve low temperature combustion modes.
The proposed ANN application methodology can be implemented during initial engine development stages based on engine performance simulation results (as those obtained from Gamma Technologies GT-Power®, Ricardo WAVE® and AVL Boost™) as a possible alternative to help engine developers to overcome future stricter emission legislations which will only be met with the application of advanced engine technologies. Once trained and validated, the ANN model can be decoupled from GT-Power® or any other software used to create the model, simplifying the engine testing process and reducing the associated computational cost. More than that, the importance of developing a calibration and optimization methodology for an Atkinson cycle VVA strategy combined with the use of ethanol is directly linked to the need to reduce the carbon footprint of internal combustion engines, whether by using hybrid electric vehicles or by using biofuels.
Conclusion
The case study explored the use of ANN to predict ethanol fueled engine operating parameters when using exhaust rebreathing valve strategy in an Atkinson cycle SI engine enabled via EIVC load control. Computational engine modeling in 1D engine gas dynamics software was performed in order to build an ANN model that facilitates engine performance prediction, providing a tool for future engine calibration processes using ER. Several ANN structures were trained and tested in the Matlab® environment, and the best model was obtained considering the lowest errors between predicted values and experimental targets. The main results were as follows:
When comparing GT-Power® TPA results at MBT, ER tests had higher indicated thermal efficiency than ctSI and standard Atkinson cycle from 2.1 to 7.5 bar IMEP and lower combustion temperature;
Degrees of freedom and grid search evaluations were efficient methods to select ANN structures with better generalization, lower overfitting probability and lower RMSE values;
The proposed methodology of 1D model outputs to ANN training was able to predict variables related to the Atkinson cycle with ER only using easy-to-measure operating conditions;
A combined ANN-PSO [30 10] structure was able to obtain four of the six desired outputs with validation R2 above 0.92, with a complementary 10-nodes hidden layer to predict PMEP and ART with enhanced accuracy.
Mapping and calibrating an Atkinson cycle engine using ethanol through ANN models can facilitate its further use in a hybrid electric powertrain solution with a reduced carbon footprint.
Footnotes
Appendix
Declaration of conflicting interests
The author(s) declared no potential conflicts of interest with respect to the research, authorship, and/or publication of this article.
Funding
The author(s) disclosed receipt of the following financial support for the research, authorship, and/or publication of this article: The authors would like to thank the National Council of Technological and Scientific Development (CNPq), the Coordination for the Improvement of Higher Education Personnel (CAPES) and the Research Support Foundation of Rio Grande do Sul (FAPERGS) for the financial support for this project.