
Abstract
Knocking limits the performance and efficiency of highly compressed, downsized spark ignition combustion engines. In this paper, the effect of the first-stage ignition on knock is analyzed using a quasi-dimensional engine model. The standard coherent flame model is used for turbulent combustion, and five available reduced chemical kinetics mechanisms are applied to thermal ignition of the end-gas. Measurements in a modified CFR engine operating with two PRF mixtures are used to test the predictive ability of the models and to identify the conditions that lead to knocking. Although the chemical kinetics models used predict similar autoignition delay curves, they do not result in the same knock predictions. The results show that the chemistry must correctly capture the NTC range to predict the observed onset of knocking. In addition, the chemistry models are used to determine the first- and second-stage ignition delay times and their dependence on engine speed and compression ratio. Results show that the autoignition stages occur at relatively fixed temperatures, independent of engine speed and compression ratio. A sensitivity analysis shows that only one set of reactions in the low-temperature chemistry contributes to first-stage ignition, which in turn determines the onset of knocking. This suggests that fuel additives that inhibit or delay the inflection in the NTC region from low- to high-temperature could prevent knock in SI engines.
Keywords
Introduction
The global emissions from transport in 2018 accounted for 8285
One of the strategies to mitigate the anthropogenic effects on global climate change is to reduce the emissions from passenger cars. While long term change points to a larger use of electrification, green hydrogen, and biofuels, 4 immediate action has focused on weight reduction and increase in vehicular efficiency. Engine efficiency is one of the components and, therefore, the thermodynamic efficiency of engines should be increased in order to decrease the emission of green house gases.
The thermodynamic efficiency of spark ignition (SI) engines is mostly limited by knocking. In the last few years, advancements in downsized, highly compressed engines have pushed the limits of knocking resistance. 5 However, further advancement has been hampered by the inherit difficulty in directly observing the chemical and physical phenomena leading to knocking, as well as, understanding the detailed effects of the fuel chemistry in the onset of engine knocking. 6 The use of modeling to understand knocking and also as a tool to design and optimize fuels and engines has increased in importance in the last years. 7 The usability of the models increase when they are comprehensive and run sufficiently fast to be incorporated in numerical simulation codes.
From the chemical point of view, many current methodologies to predict the conditions that lead to knocking and the severity of the wave propagation that follows rely on detailed or reduced chemical kinetics mechanisms to predict the chemistry of flame propagation and auto ignition. 8 Commercial fuels are complex mixtures of hydrocarbons and other oxygenated species and their complete chemical kinetics description requires hundreds of chemical species and thousands of chemical reactions. 9 The predictions of these mechanisms are tested against measurements in canonical experiments, such as shock tube and rapid compression machine ignition delay times, as well as species concentrations in laminar flames, counter flow, uniform flow, and perfectly-stirred reactors. However, even when comparison to measurements predict general behavior, there is no certainty that the mechanisms will be able to provide good prediction of device specific measurements, 10 specially when low-temperature chemistry is involved. When considerations of cost, computational time, and predictability of measurements are taken into consideration, the decision to model real devices fall back to either using simple, mostly incomplete, classical knocking models, or to a complete dismissal of the modeling effort and a complete reliance in global engine measurements.
The objectives of this work are two-fold. First, an analysis is performed for the prediction of the onset of knocking at a relatively simple engine simulation using five detailed and reduced mechanisms for PRF (Primary Reference Fuel) mixtures. It is shown that even when the mechanisms provide similar predictions of shock tube ignition delay time, IDT (Ignition Delay Time) curve, they fall short in producing consistent predictions of the onset of knocking under transient engine conditions. One of the mechanisms is then selected and used to analyze the effects of the timing and intensity of the first-stage ignition in the main ignition event. It is shown that delaying first-stage ignition is the key measure to avoid end-gas autoignition, regardless of engine speed and compression ratio.
Background
Knocking limits the operation of highly compressed, downsized SI engines. It starts with a thermal ignition of the end-gas caused by the pressure increase resulting from the propagation of the turbulent deflagration wave and engine dynamics. Typically temperature,
Abnormal combustion
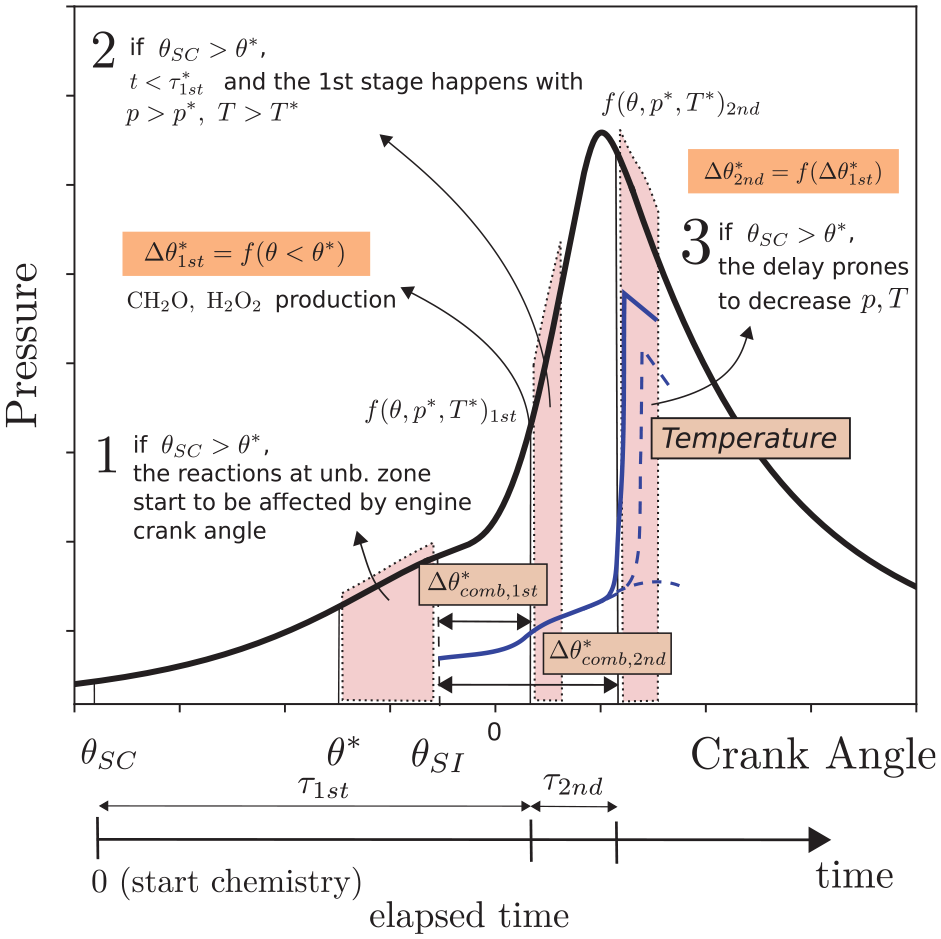
Knocking refers to the occurrence of spontaneous combustion of the air-fuel mixture leading to high frequency pressure oscillation within the combustion chamber. The three main steps during abnormal combustion are illustrated in Figure 1. They are the onset regime, that leads to autoignition of the end-gas, the pressure discontinuity, due to strong instantaneous heat release, and the pressure oscillations, caused by reverberation of sound waves. 16 These concepts are approached in the literature by(1) identifying the mechanism of autoignition,(2) defining which physical features lead to the formation of pressure waves, and(3) determining which effects cause the pressure waves to reach high intensities.
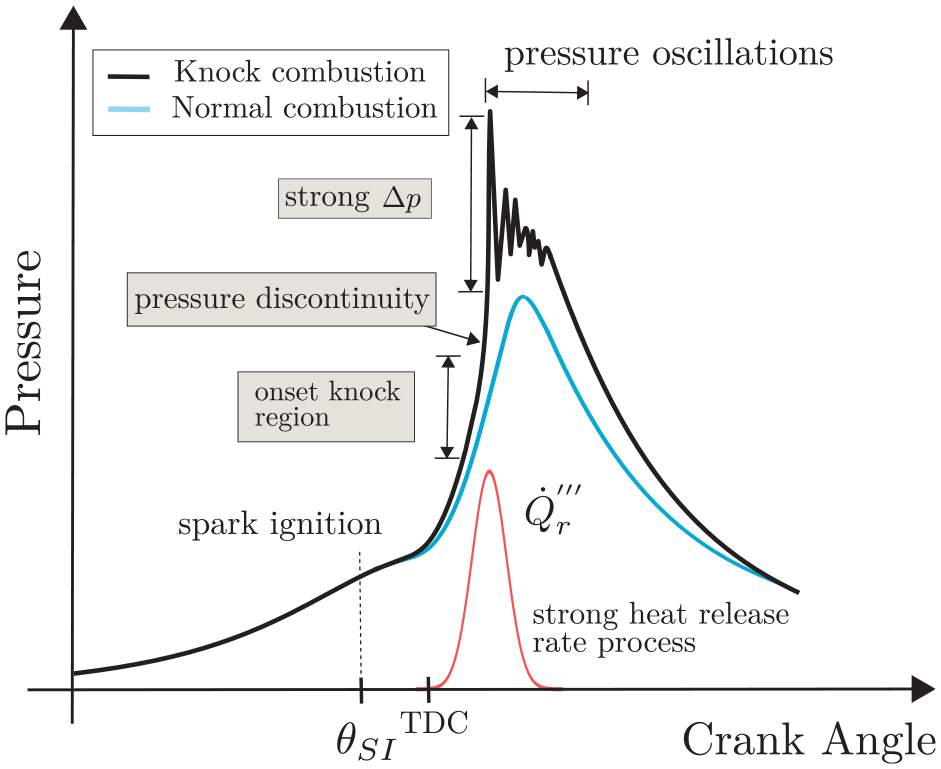
Schematic in-cylinder pressure behavior, for normal and abnormal combustion.
The propensity to engine knocking has been modeled using either semi-empirical algebraic or differential equations. One of the first algebraic models was proposed by Douaud-Eyzat 17
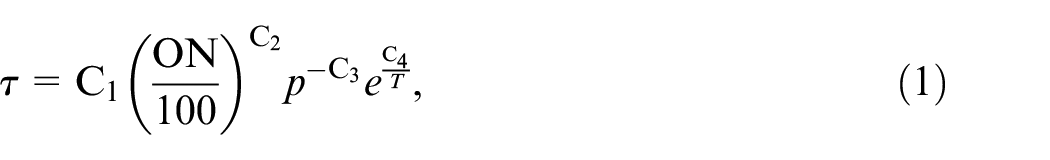
where
Later work added other parameters to the original model, such as residual gas fraction, 18 equivalence ratio, 19 and characteristics of the Negative Temperature-Coefficient (NTC) region in the IDT curve. 20
Most engine simulation models adopt the Linvengood-Wu, equation (2). In this model, the integral from the crankshaft angle corresponding to the inlet valve closing
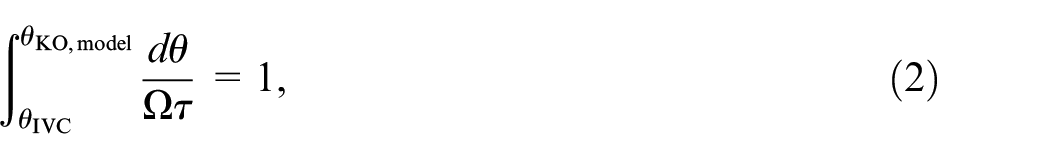
must be equal to unity. In the integrand,
Using chemical kinetics mechanisms, Foong et al. 21 investigated the autoignition in a CFR engine employing mixtures of ethanol with several PRF and TRF (Toluene Primary Reference Fuel), using the same standard conditions of the research octane number (RON). Among the results, they concluded that the incorporation of the NO chemical mechanism improved the level of agreement between numerical predictions and experimental results for fuels with low ethanol content.
Although many works follow the direction of increasing the number of parameters in the Linvengood-Wu model, the presence of the cool flame precludes obtaining a general simple algebraic or differential model, since it is strongly affected by the air-fuel combustion chemistry.
First-stage ignition
During flame propagation in the engine cylinder, the pressure and local temperature ahead of the flame front increase exponentially. Roughly speaking, when the residence time to completely burn the unburned fraction ahead of the flame exceeds the engine ignition delay time, the end-gas will experience autoignition.
In the last two decades, several studies, for example, Refs.8,22–27 have shown that the onset of knocking is affected by the existence of the NTC region in the ignition delay time curve. Works in rapid-compression machines (RCM) concluded that the knocking originates from the localized development of hot spots in an inhomogeneous temperature field. However, in temperatures in the NTC range, colder spots my experience ignition before hotter spots. On the other hand, works performed by Dal Forno Chuahy et al. 28 and Splitter et al. 29 showed that using the pre-spark heat release controlling can change the behavior of knock in the NTC region, extending the resistance regarding the autoignition process.
Figure 2(a) presents the IDT curve of an n-hptane/air mixture (PRF00) at 20 bar, calculated using the Cai and Pitsch
30
chemical kinetics mechanism. The NTC region exists from about 800 K to 900 K. The inset in the lower right corner shows the temperature evolution of the thermal ignition starting at 900 K. In Figure 2(a) is shown the existence of the first-stage ignition at
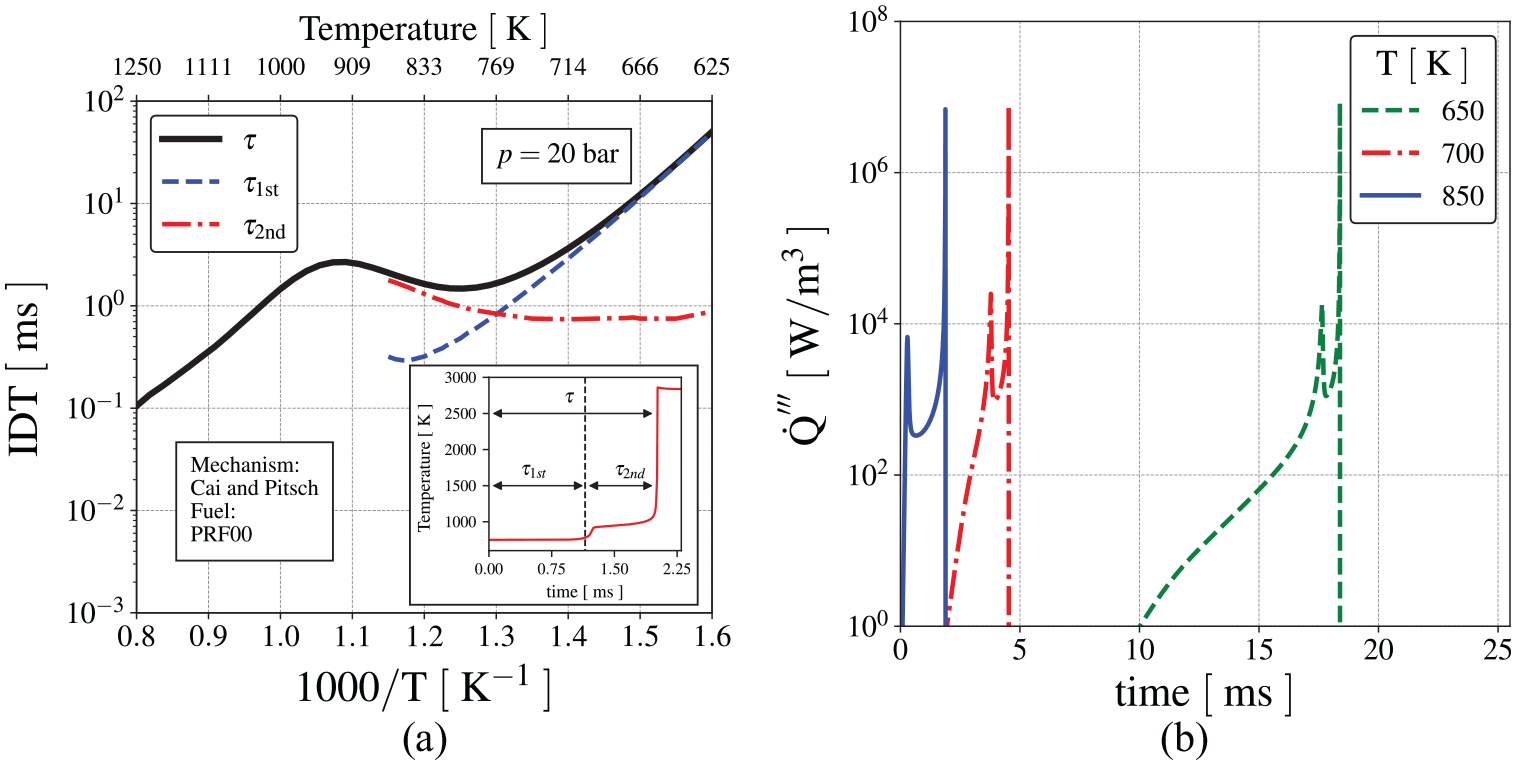
Ignition delay time for an adiabatic and isocoric reactor of homogeneous stoichiometric PRF00/air mixture, (a) ignition delay time and (b) heat release rate history for autoignition at
Thermal ignition chemistry
The basic chemistry leading to thermal ignition is well known. Basically, the reactions that promote thermal ignition are those that lead to the rapid build-up of a radical pool sufficient to initiate and sustain radical chain propagation and heat release. The reactions that inhibit thermal ignition are those that lead to radical termination. Differently from what occurs in flames, during thermal ignition the higher alcanes respond along different reaction paths, depending on the temperature and pressure.31–36 The radicals build-up is marked by the
Under certain conditions, a cool flame may propagate as a wave. Stable premixed cool flames have been experimentally observed and numerical simulations have investigated the complex transitions and flame structures that originate from the interactions between the cool and the high-temperature flames. These interactions may be important for internal combustion engines, since the location of the cool flame can influence the ignition delay time and engine knocking in spark ignition engines.24–27
The low-temperature chemistry leads to the first-stage ignition and both, the first- and second-stage ignitions, can be detected in ignition delay time curves. However, it is not clear how much the first-stage delay is affected by the transient temperature and pressure conditions in the end-gas, at different engine compression ratio and speeds, and how much the variation of the timing of the first-stage ignition affects the timing for the second-stage ignition. If the timing for the second-stage ignition is sufficiently delayed, knocking may be prevented.
In order to analyze these trends, an engine model which includes the modeling of the main combustion and the end-gas is required. The model needs to be tuned to measurements, to check its predictive capabilities, and then used to analyze the effects of engine speed and compression ratio on the development of the first-stage ignition and its role in the end-gas autoignition.
Materials and methods
A two-zone model is used here to study the effect of the first-stage ignition on the onset of knocking. The zones are separated by the turbulent flame brush. The Standard Coherent Flame Model (CFM) 39 is used to calculate the turbulent flame speed and to track the flame position as the combustion proceeds after the spark ignition. The burned gas behind the flame is assumed to remain under chemical equilibrium. The unburned gas ahead of the flame experiences physical effects, from the heating caused by the pressure variation and cooling by heat transfer to the cylinder walls, as well as, chemical effects, from the slow development of a low-temperature combustion chemistry. The chemistry of the unburned gas (the end-gas) is modeled assuming a uniform pressure, temperature, and composition fuel-air mixture and using reduced chemical kinetics mechanism.
Figure 3 presents a rendering of the model. In Figure 3,
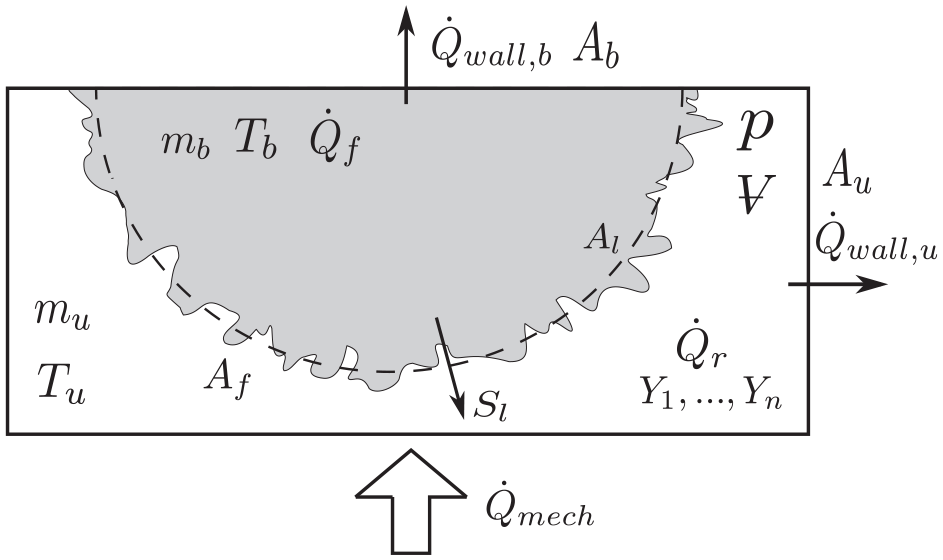
Rendering of the engine combustion model.
Engine modeling
The engine two-zone model represents the knocking process as a pure autoignition event that occurs in the bulk of the unburned zone. Thereby, no wall effect, other than heat transfer, is taken into account. In this way, the effects of the chemical kinetics mechanism in the end-gas can be analyzed independently of any physical effects resulting from mixture non-homogeneity. The modeling assumptions are summarized as follows: (1) The main combustion is spark ignited and occurs in a turbulent flamelet regime, (2) the states of the burned and unburned mixtures are spatially homogeneous, (3) the combustion products in the burned zone are at chemical equilibrium, (4) the chemical reactions in the unburned mixture are modeled using a detailed chemical kinetics mechanism, (5) the flame sheet dividing the burned and unburned zones has zero volume, (6) the flame heat release is calculated by the difference in thermal energy between the burned and unburned states, (7) no heat transfer occurs between the zones (i.e. across the flame brush), and (8) the gas mixtures behave as ideal gases.
The simulations start from bottom dead center (BDC) after intake. The system of equations are based on those found in Ferguson. 40 The equation for the conservation of energy in the burned zone is
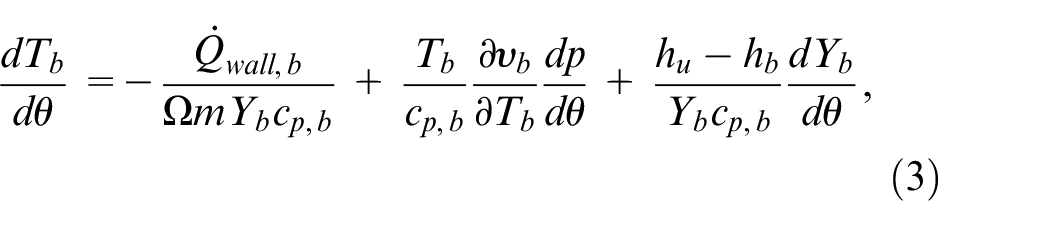
where the first term on the right-hand side is the heat transfer to the walls, the second term computes the mechanical work, and the last term is the rate of heat release of the flame front associated with the energy difference between the two zones and the rate of consumption of the unburned mixture. In equation (3),
Analogously, the equation for the conservation of energy in the unburned zone becomes
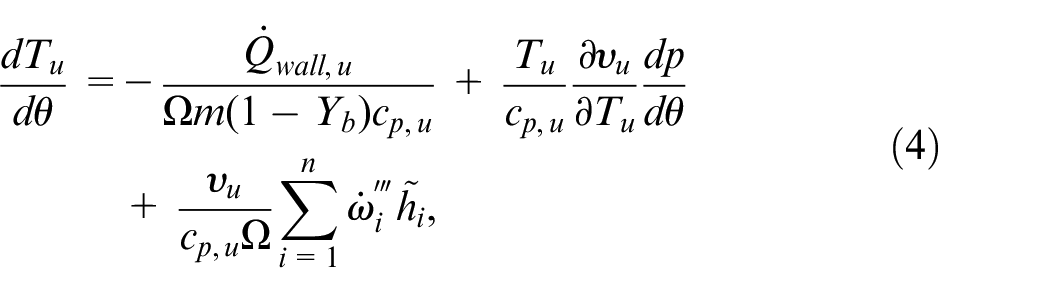
where the first two terms have the same interpretation as in equation (3) and the last term calculates the net thermal energy released by chemical reactions.
The turbulent flame front separates the unburned and burned regions. The burning rate of the turbulent flame front is defined as
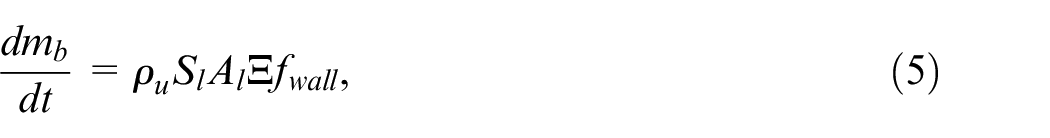
where
The flame wrinkling factor is described by a physical equation which computes the progressive transition from the laminar kernel to the fully turbulent flame
This equation was derived from the flame surface density model.39,41,42 The first term in the right-hand side of equation (6) represents the wrinkling of the flame caused by all turbulent scales, while the second term represents the mean stretch due to thermal expansion of the spherical flame which destroys the turbulent wrinkling.
43
In equation (6),
The efficiency function takes into account the reference laminar flame speed,
The equilibrium factor,
is the result of the analytic solution of the steady one-dimensional flame density equation.
46
It contains the calibrating coefficient,
In this work, the reference laminar burning velocity in equation (5) is computed using the Metghalchi and Keck
47
correlation for gasoline. The laminar flame surface,
Area of the turbulent flame front. The letter
The composition of the reactant mixture in the unburned zone is solved using the conservation of mass for the chemical species and reduced chemical reaction mechanisms. The reactant mixture is then consumed in the turbulent flame front and reemerges on the other side as a burned gas. The composition of the burned mixture always follows chemical equilibrium at
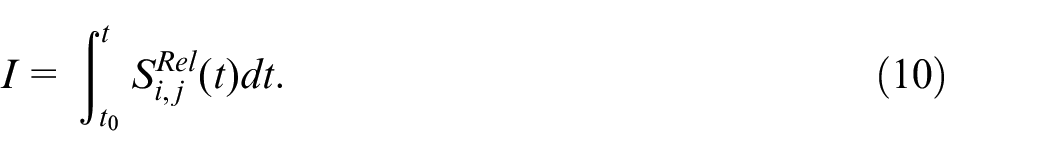
In order to follow the combustion chemistry at the end-gas, the most important reactions were sorted out in order to evaluate the main reaction paths and species in the low- and high-temperature regimes. For the selection of the important reactions, the relative sensitivity,
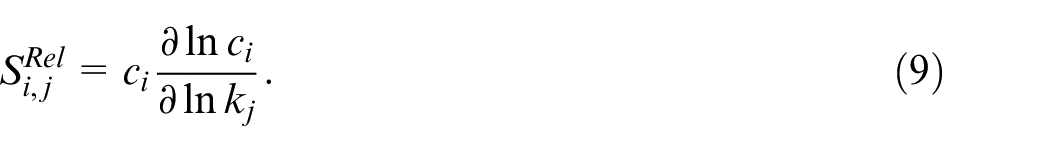
Then, the importance of each reaction was calculated by
An in-house code was built to simulate compression, combustion, and expansion in spark ignition engines. The simulations start at −146 CAD, at the intake valve closing (IVC), which corresponds to BDC. In all Figure, 0 CAD corresponds to TDC (Top Dead Center). The simulations run up to exhaust valve opening (EVO).
The code uses the Cantera library 52 for the calculation of thermodynamic properties and for the computation of reaction rates. The system of ordinary differential equations are solved by the algorithm LSODA53–55 and the program was written in Python language.
Measurements
A CFR engine (CFR Engines Inc.) was used for testing the engine simulation model and generating the knocking conditions. The tests were performed at Center of Applied Research at Technische Hochschule Ingolstadt, following the methodology described in da Silva et al.
56
The CFR engine is a stationary, constant speed, single cylinder, 4-stroke engine with a variable compression ratio. The in-cylinder pressure was measured during tests performed under standard RON conditions for spark ignited engines (ASTM D2699), that is, engine speed of 600 RPM, intake air temperature of
Figure 5 presents the measured pressure traces for both, normal (at compression ratio of 6.07 and 6.05) and abnormal (at compression ratio of 7.28) combustion, for PRF92 and PRF94, respectively. The pressure traces are averages over 200 cycles. The conditions for normal combustion, for example, those shown in Figure 5, were defined as the limiting conditions for the onset of knocking.
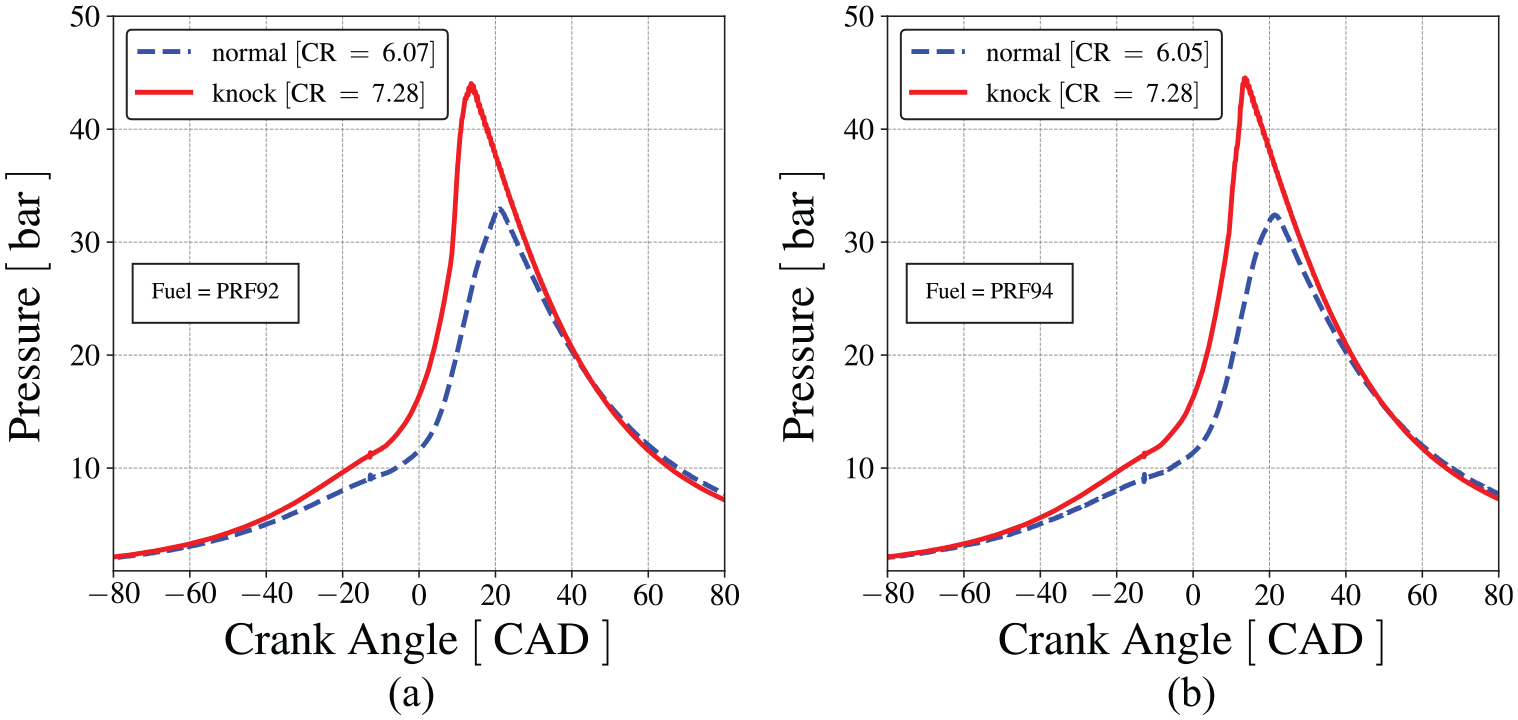
In-cylinder mean pressure traces measured in CFR engine for normal and abnormal combustion (a) for PRF92 and (b) for PRF94.
Results and discussions
The results of the engine model are compared to the measurements to ascertain its validity for this analysis. Then, the chemical kinetics mechanisms are further analyzed in respect to the results they provide for the end-gas. The role of the first-stage ignition is analyzed and finally, a sensitivity analysis provides the main reactions and species leading to the first-stage ignition.
Chemical kinetics mechanisms
Table 1 presents the five reduced chemical kinetics mechanisms used in this study to model the combustion of iso-octane/n-heptane mixtures with air. They were tested by comparing their capabilities of detecting the onset of knocking in the standard CFR engine. Reduced mechanisms were used manly due to the need to reduce the computational time, while still allowing for the inclusion of the most important chemical kinetics paths.
Chemical kinetics mechanisms used to model the end-gas thermal ignition.
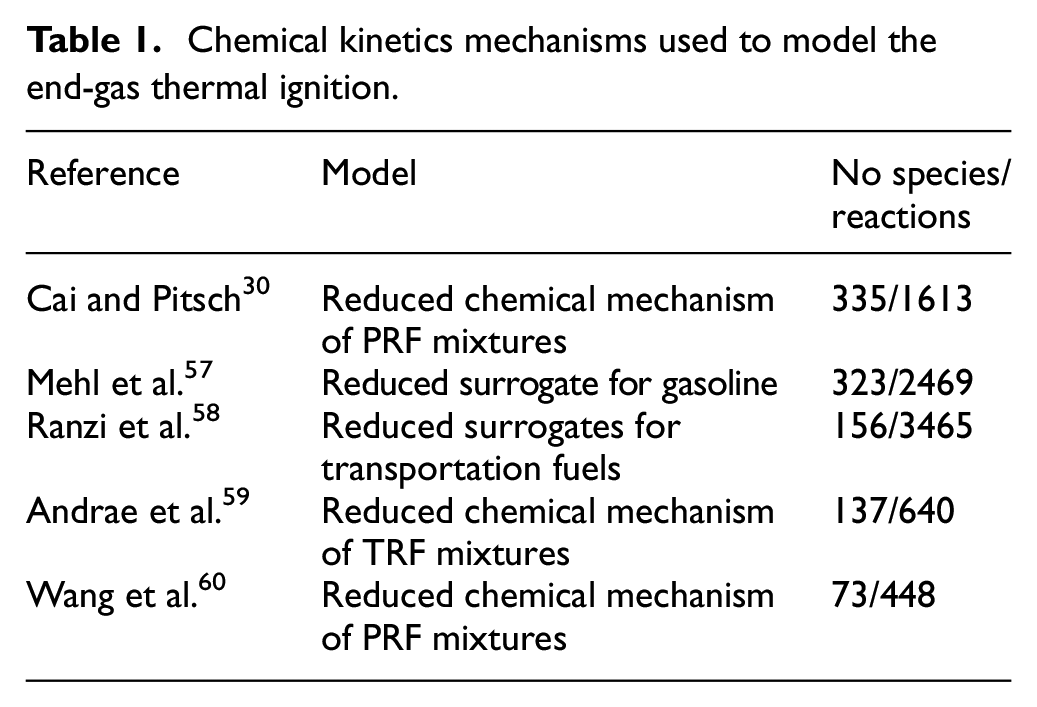
Figure 6 presents the ignition delay time curves calculated for PRF95, at
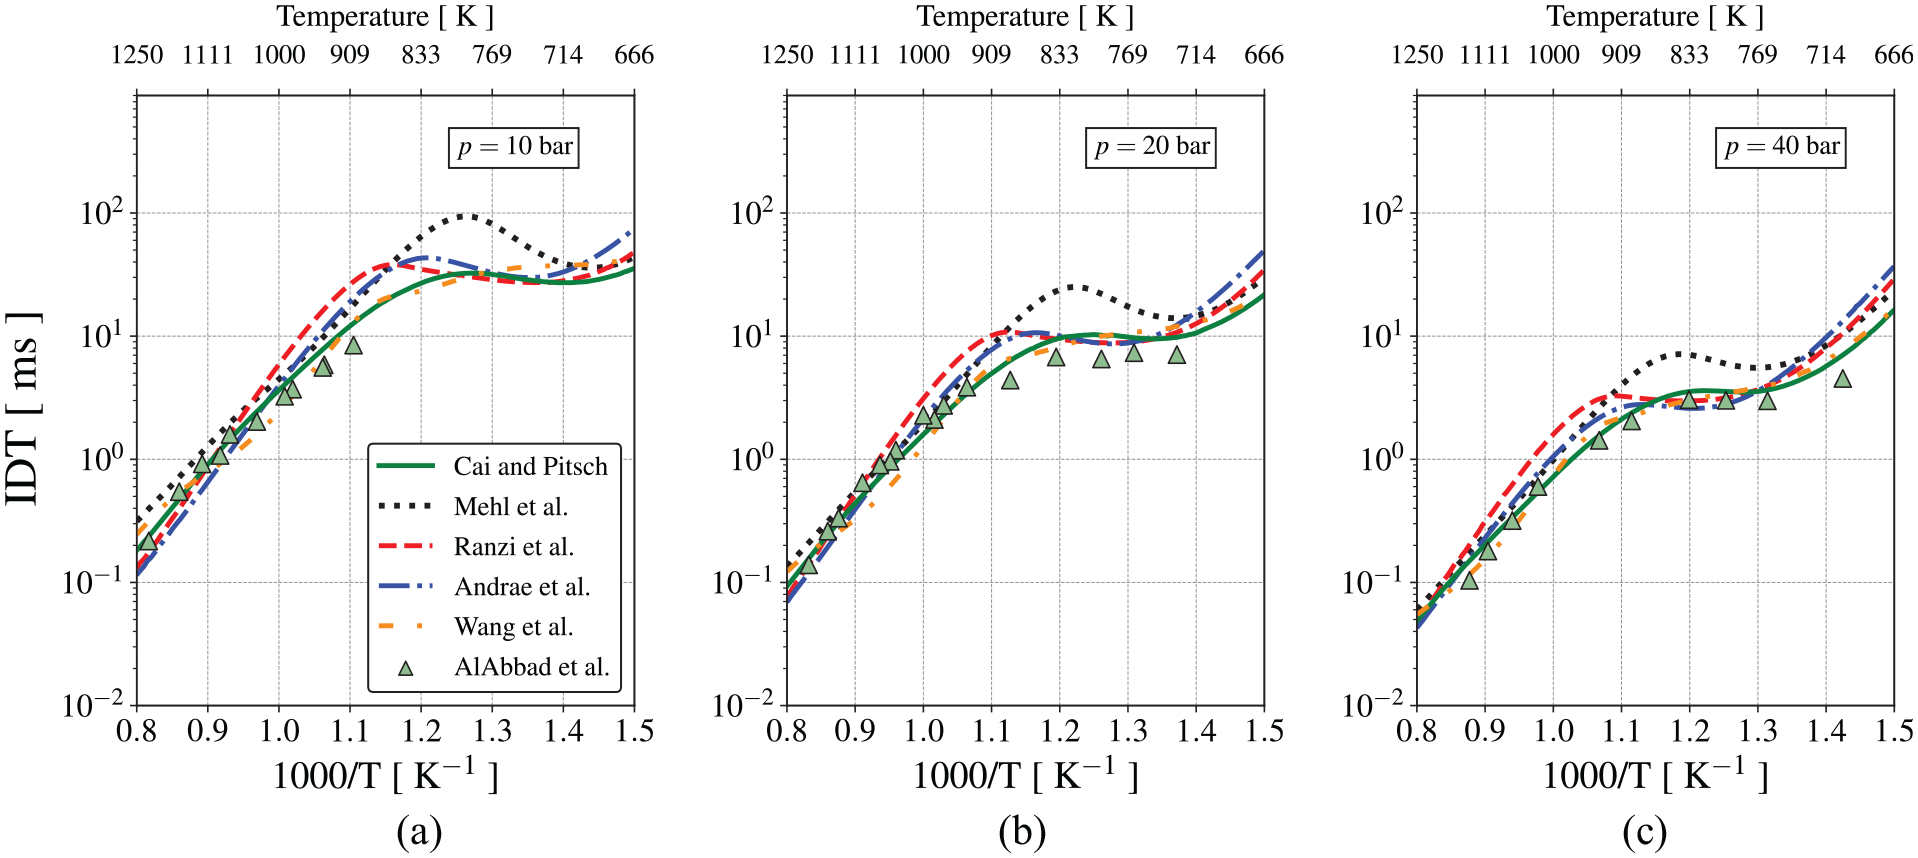
Ignition delay times for PRF95/air mixtures for
At temperatures above 900 K, all reduced mechanisms predict the general trend of the measurements, within typical uncertainties. As the NTC region is approached, the predictions begin to diverge from the measurements and among themselves. However, most mechanisms, except Mehl et al., 57 that overshoots the IDT in the NTC region, are able to predict the temperature range of NTC and the IDT peak. We note that, while Wang et al. 60 presents a reasonable prediction of the measurements, it does not produce a NTC region. At temperatures below 700 K, there are fewer measurements and the measurement uncertainty increases, preventing a fair comparison with the predictions. Overall, all mechanisms result in acceptable predictions in the high temperature range, while Cai and Pitsch 30 and Wang et al. 60 produce slightly better predictions in the intermediate- and low-temperature ranges for the conditions presented.
In the sense of the Linvengood-Wu equation, the capability of predicting IDT curves enables a mechanism to become a good predictor of the onset of knocking. This aspect is explored next. First, Andrae et al. 59 mechanism is used to explore the engine combustion model characteristics and results.
Test of the engine model
The following results present the comparison between the measured mean in-cylinder pressure and the pressure calculated by the engine model using Andrae et al. 59 mechanism, at engine speed of 600 RPM and stoichiometric mixture. The model was initially tuned to reproduce the pressure trace for PRF92, at compression ratio of 6.07, and then, applied to the prediction of the results for PRF94, at compression ratio of 6.05. Figure 7 shows that the numerical results are in good agreement with the measurements in the CFR engine.
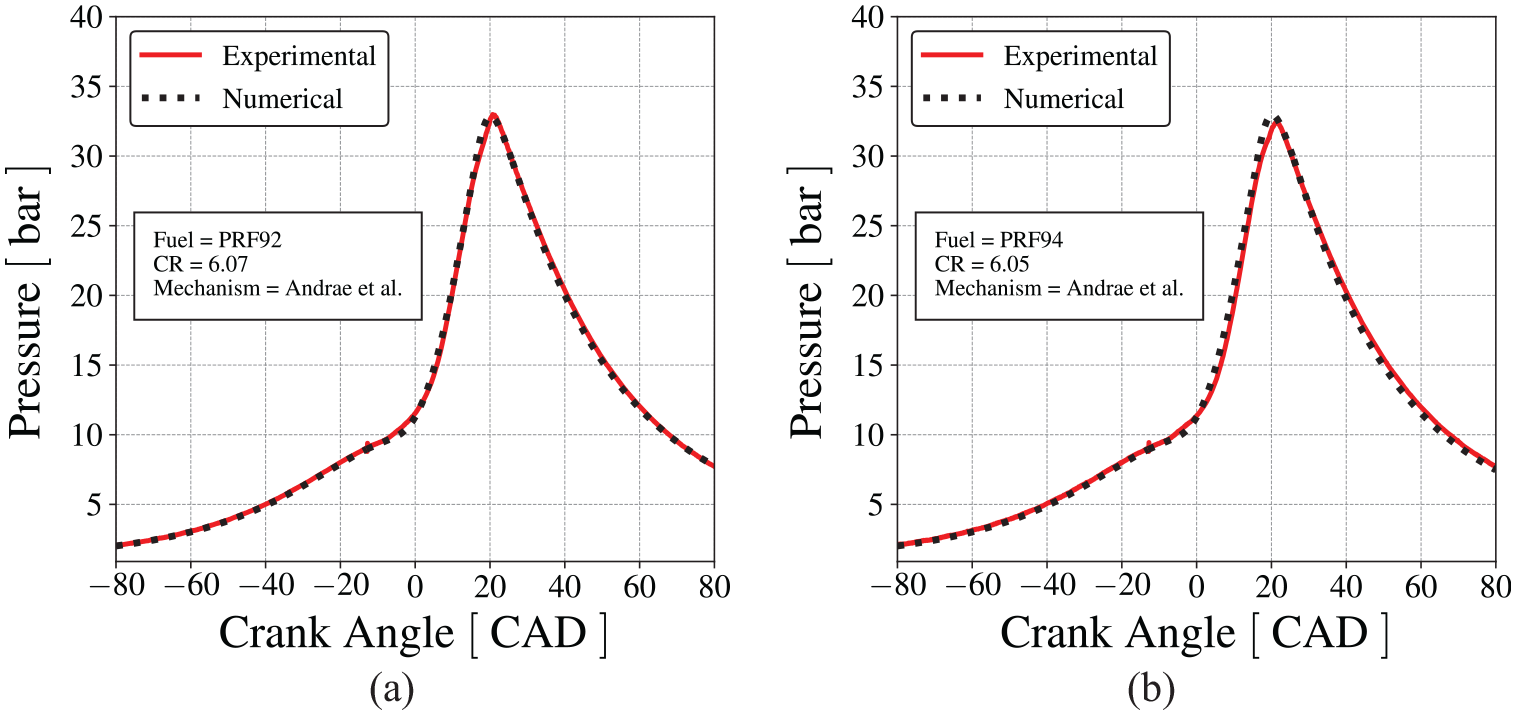
Comparison between the cylinder pressure measured in the CFR engine and the pressure predicted by the numerical model using Andrae et al. 59 mechanism for normal combustion, (a) for PRF92 and (b) for PRF94.
Figure 8(a) presents the behavior of the wrinkling factor,
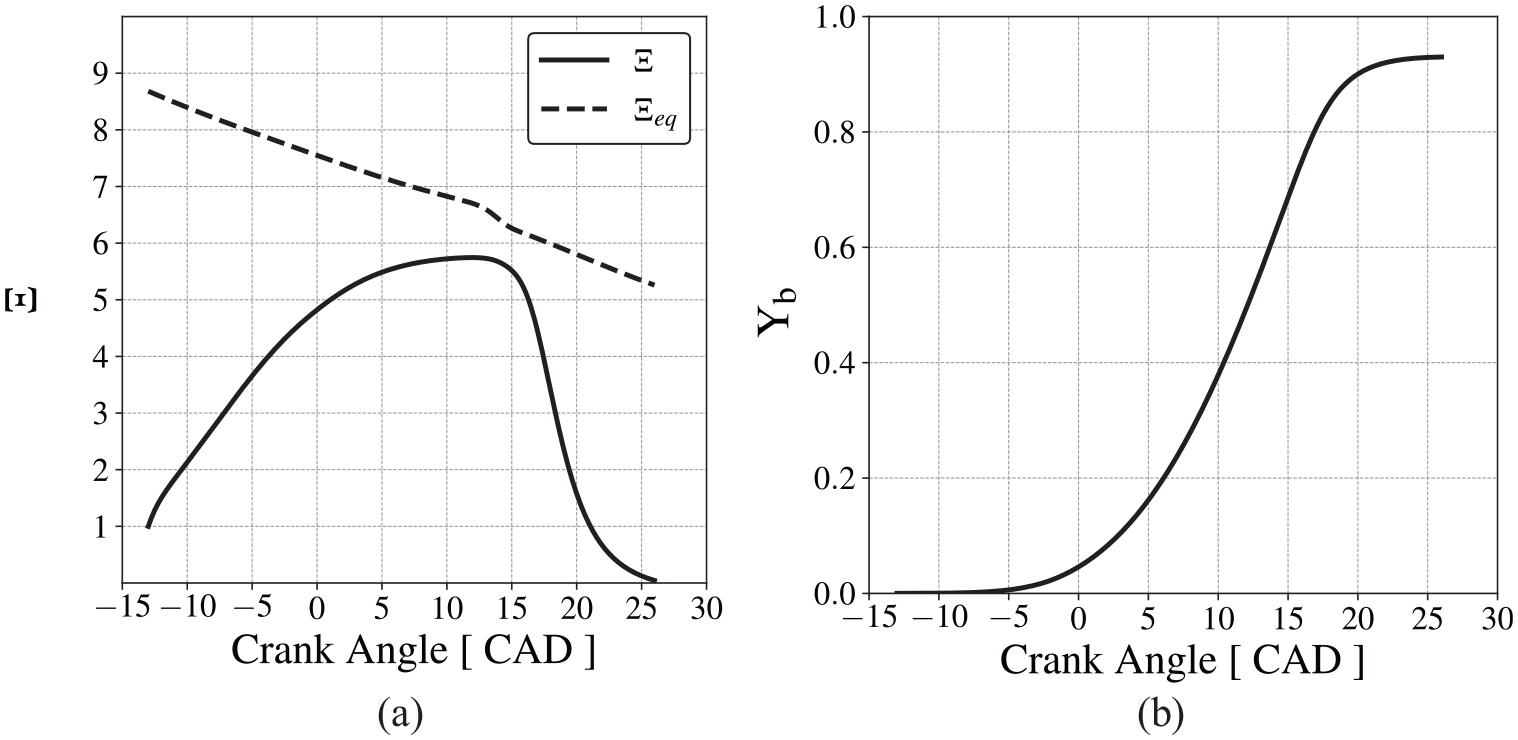
Submodels behavior with PRF92, Andrae et al. 59 chemical mechanism and CR = 6.07, (a) wrinkling factor and (b) mass fraction burned.
It is concluded that the model provides a reasonable reproduction of the flame propagation and the combined effects of the states of the burned and unburned fractions on the transient pressure and temperature. While several error compensation trade-offs may be present in the results of the model, it is possible to assume that the spatial average state of the end-gas is reasonably well predicted. Therefore, the predictive capability of the engine model is considered adequate for the purposes of this work.
Analysis of the onset of knocking
Using the model tuned to the measurements for PRF92 and tested against the measurements for PRF94 under normal combustion, the models of Andrae et al. 59 and Wang et al. 60 were applied to the simulations for PRF92 and PRF94 at the compression ratios considered to be at the edge of knocking in the CFR measurements (CR = 7.28). The air-fuel mixture is stoichiometric and the engine speed is kept at 600 RPM.
Figure 9(a) and (b) present the comparison of the measured pressure traces with the predictions using Andrae et al. 59 mechanism. The model identified the occurrence of autoignition for both fuels, but with a smaller pressure increase and maximum pressure than the measurements. It also captured the crank angle where the inflection in the measured pressure trace occurs (at about −8 CAD). Figure 9(c) and (d) present the results calculated using Wang et al. 60 mechanism. This mechanism captures both, the crank angle where the autoignition events start, and the rate of pressure increase. We recall that the simulation model only approximates the average of many cycle behavior. Therefore, we define the onset of knocking as the last cycle before any sudden pressure increase in noted. In this sense, in Figure 9, all phenomena that occur in a cycle after the first pressure increase due to knocking are meaningless in the light of the present model. The results are presented graphically in their entirety simply as an aid to the eyes to facilitate interpretation.
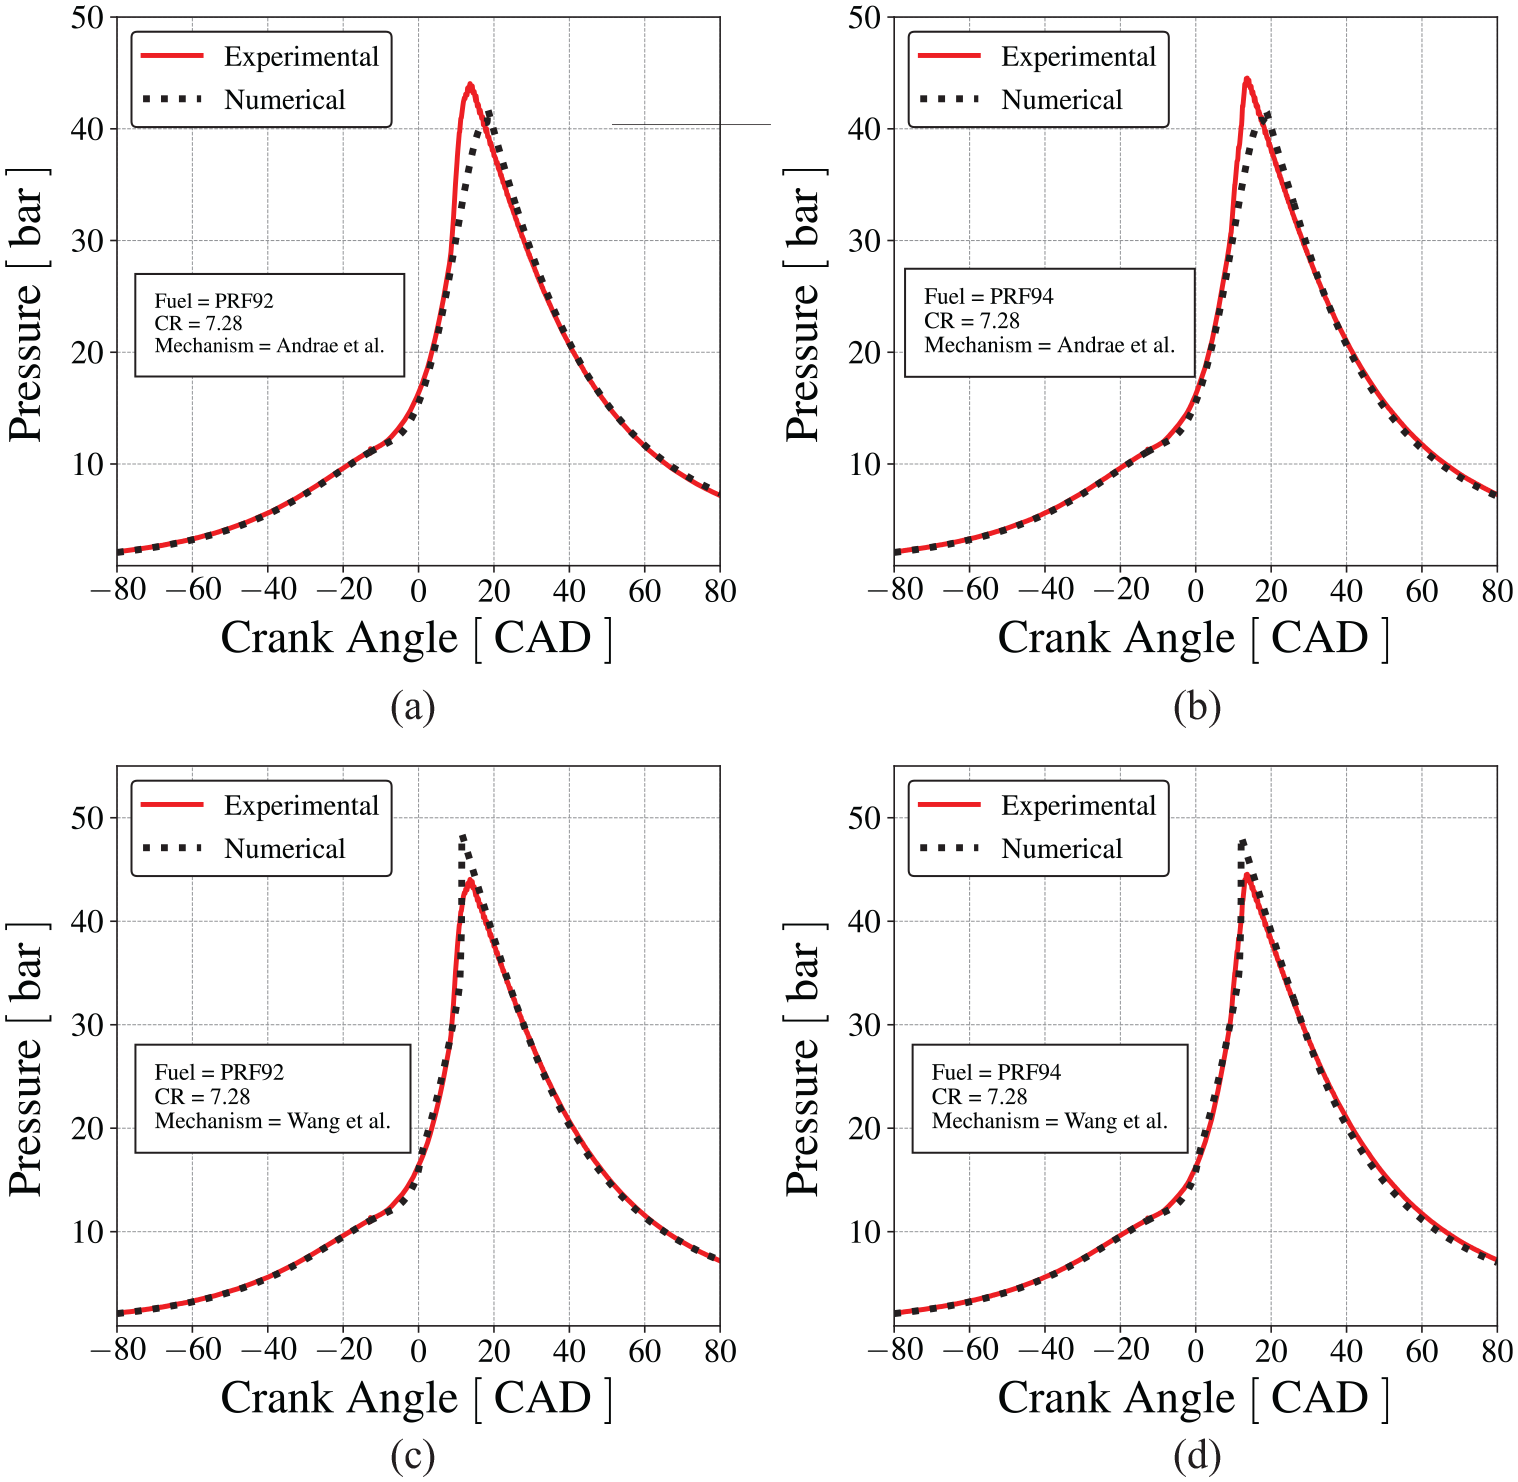
Comparison between the cylinder pressure measured in the CFR engine and the pressure predicted by the numerical model using Andrae et al. 59 and Wang et al. 60 mechanisms at conditions on the onset of knocking, (a) PRF92 with Andrae et al., 59 (b) PRF94 with Andrae et al., 59 (c) PRF92 with Wang et al., 60 and (d) PRF94 with Wang et al. 60 mechanisms.
Since all simulations have the same thermodynamic condition at the spark
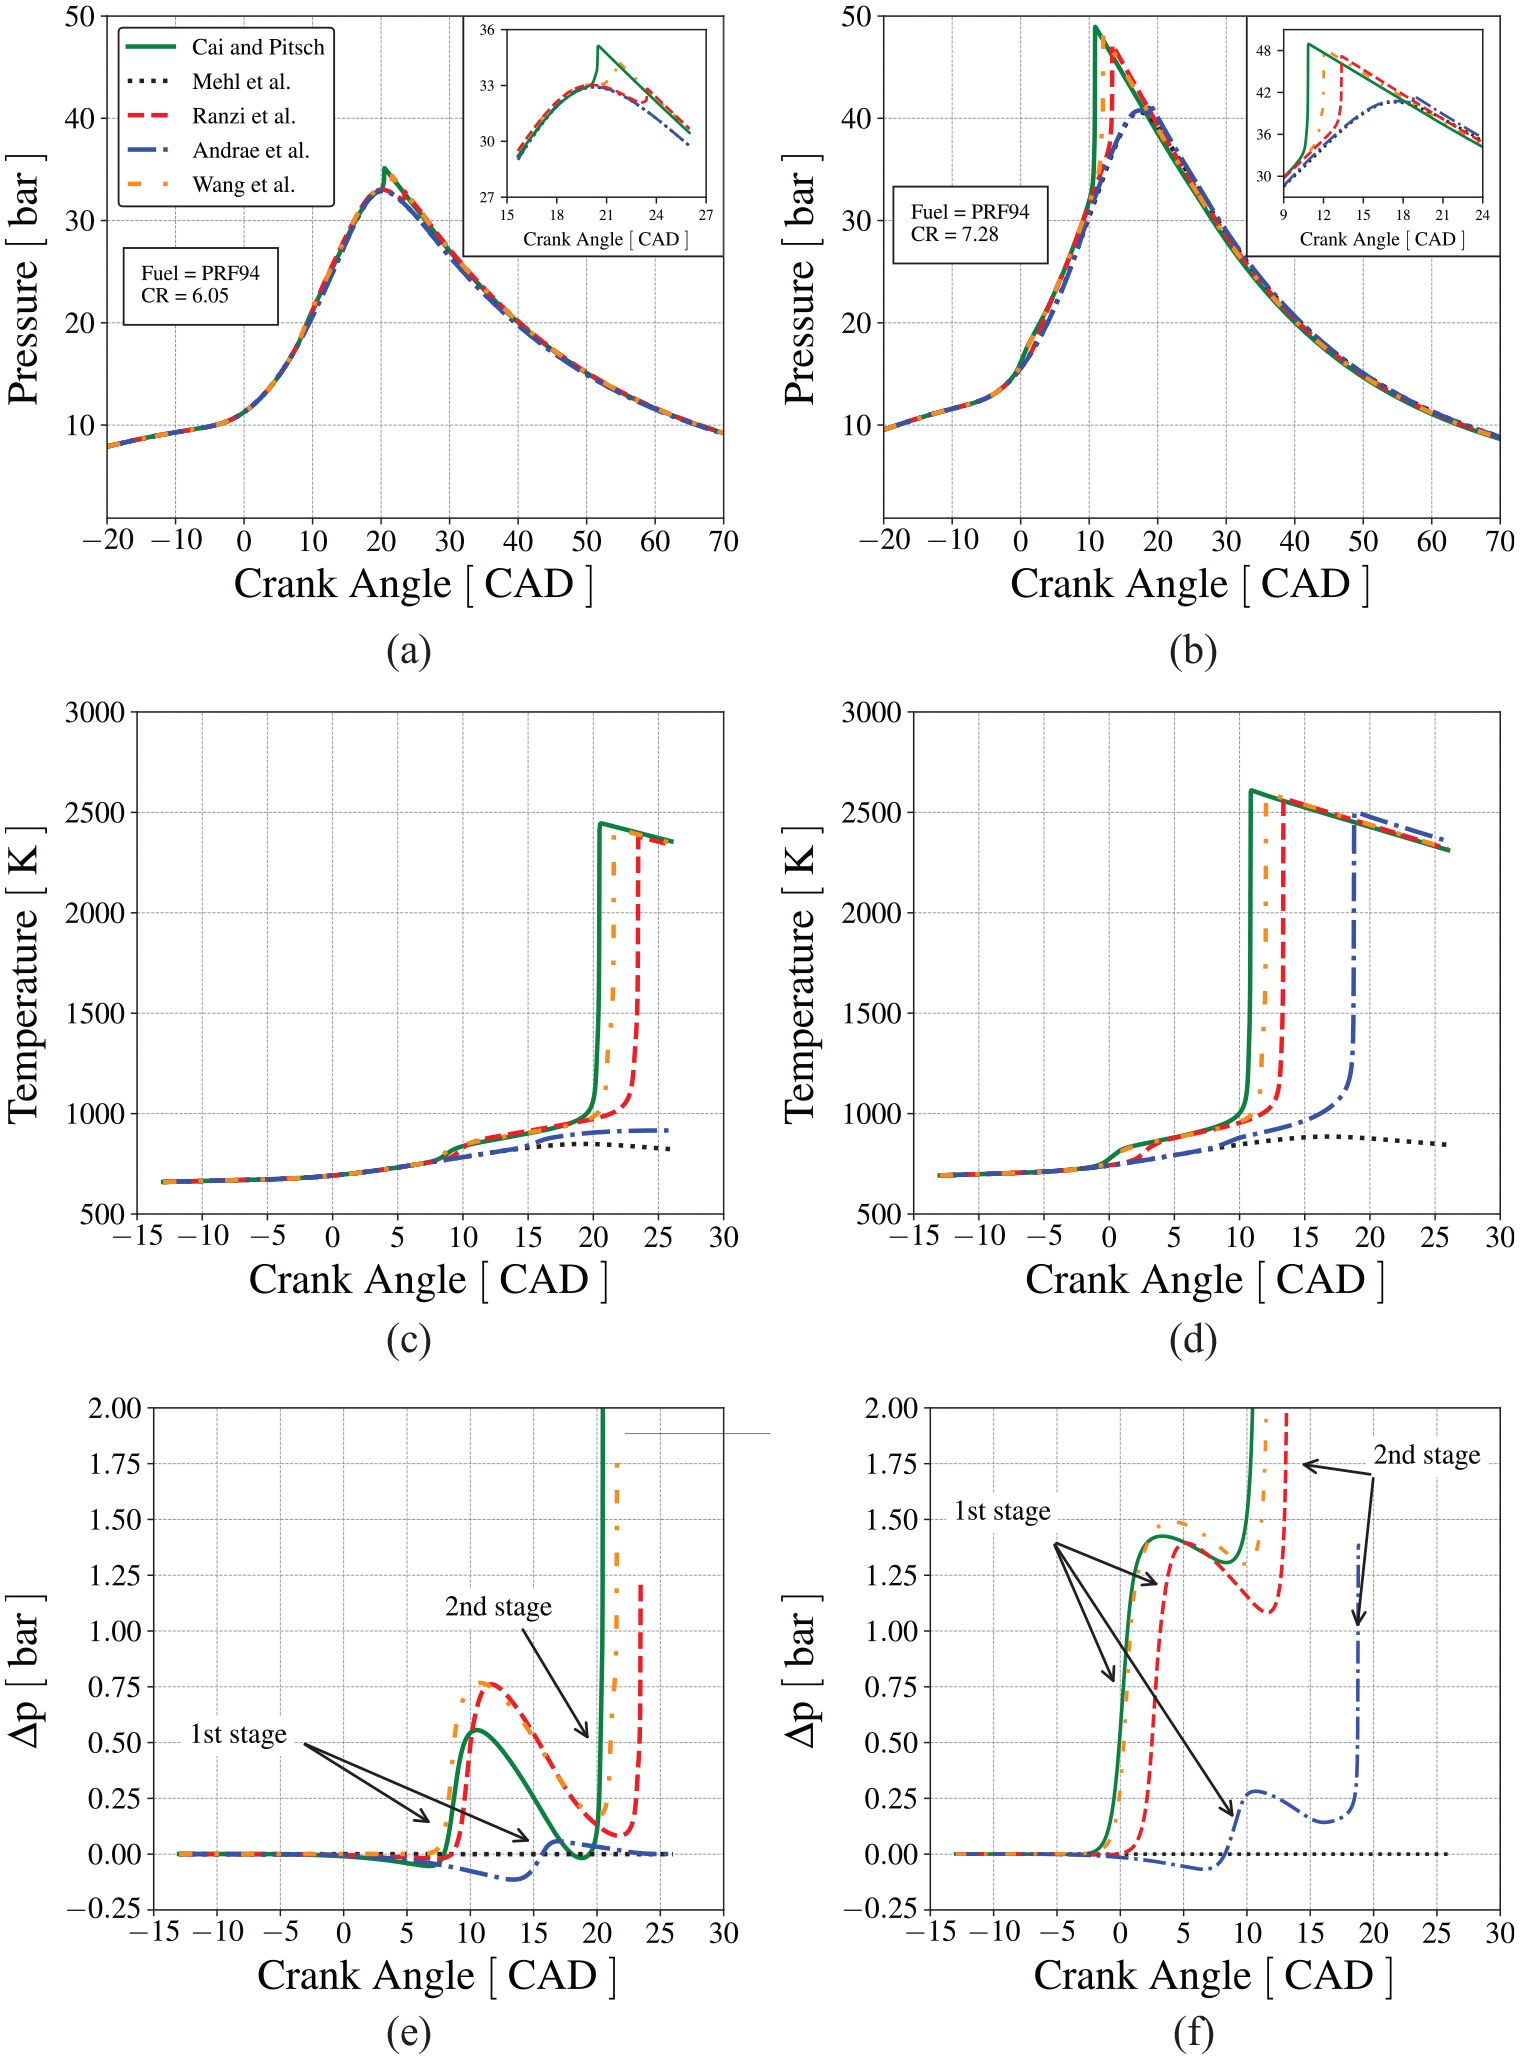
Comparison of the results of the numerical model, at two compression ratios and engine speed of 600 RPM, using different chemical kinetics mechanisms. In-cylinder pressure for (a) CR = 6.05 and (b) CR = 7.28, end-gas temperature for (c) CR = 6.05 and (d) CR = 7.28, and difference of the pressure traces predicted for conditions that lead to knocking and the pressure traces at the same conditions, but with the end-gas chemical kinetics turned off at (e) CR = 6.05 and (f) CR = 7.28.
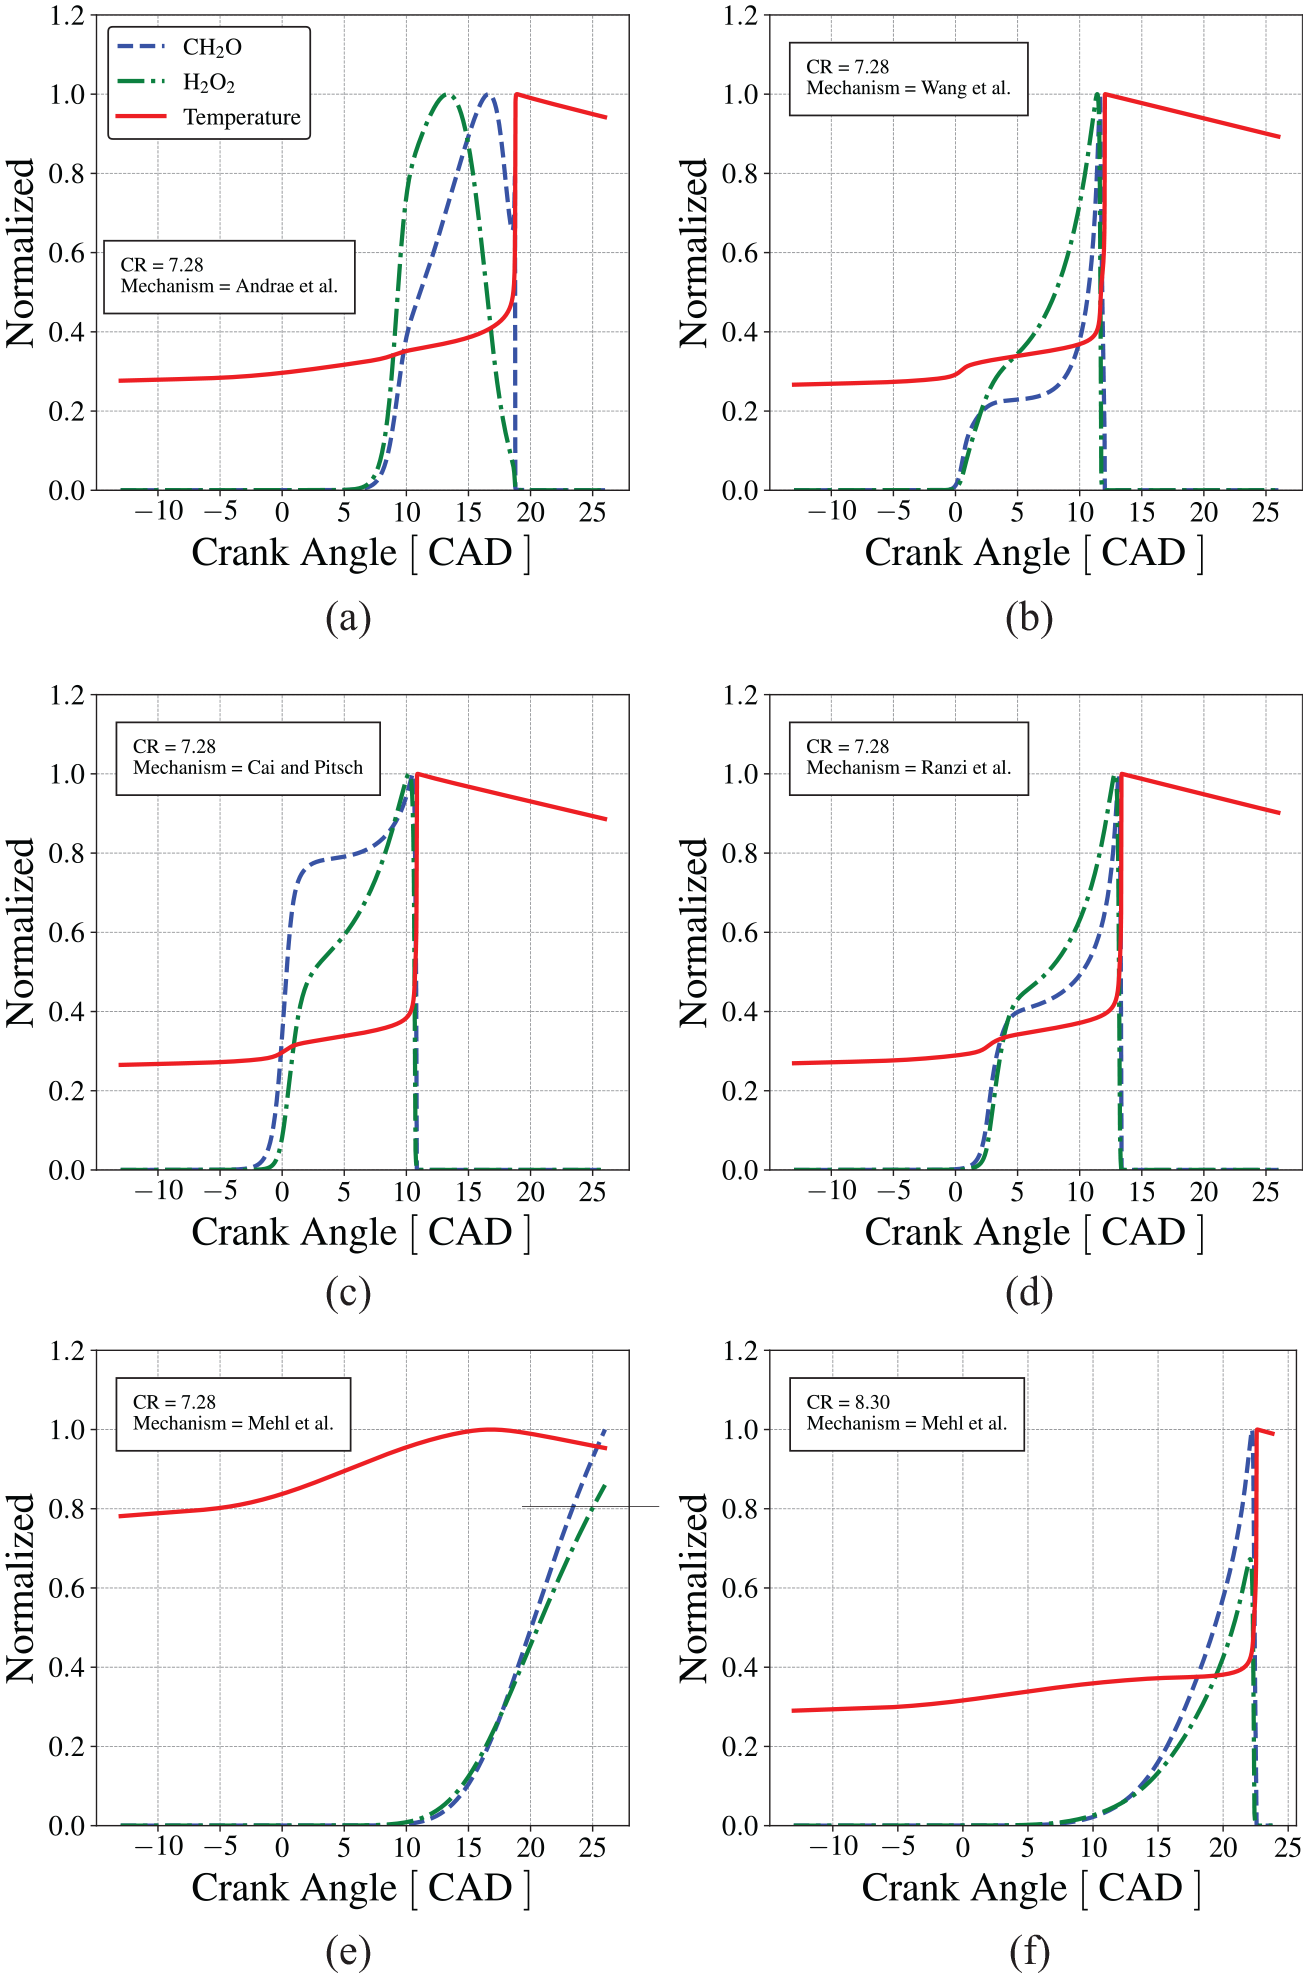
Figure 10(a) presents the pressure traces for the limiting condition when knocking is not detected in the measurements. Figure 10(c) presents the evolution of the unburned mixture temperature as predicted by the mechanisms from Table 1. In the range of crank angle between 5 and 20 CAD, all mechanisms, except Mehl et al., 57 show first-stage ignition. However, only the mechanisms by Wang et al., 60 Ranzi et al., 58 and Cai and Pitsch 30 resulted in second-stage ignition (autoignition of the end-gas). This ranking is not obvious when observing solely the IDT curves predicted by the mechanisms, as in Figure 6. One might argue that the mechanism by Mehl et al. 57 present the largest ignition delay time in the NTC region, which would be the reason why it does lead to ignition in the present situation. However, a similar analysis is not as well easily applied for the remaining mechanisms. In fact, the autoignition in Figure 10 comes from the dynamic coupling of the characteristic engine and reaction times. This behavior becomes more pronounced when the compression ratio is increased to 7.28, as shown in Figure 10(b) and (d). In this situation, the mechanism by Andrae et al. 59 also undergoes autoigniton of the end-gas. Reactivity increases in the order Cai and Pitsch, 30 Wang et al., 60 Ranzi et al., 58 and Andrae et al. 59 and the reason for this ranking is still not clear. If these different mechanisms would represent different fuels, the reason for their ranking would also be not clear as well.
In Figure 10(c) and (d), although the first-stage ignition occurs earlier for the higher compression ratio, the secondstage ignition occurs approximately at 1000 K and 33 bar. If we go back to Figure 6, we notice that at 1000 K and 30 bar, the IDT increases in the order Wang et al., 60 Cai and Pitsch, 30 Mehl et al., 57 Andrae et al., 59 and Ranzi et al., 58 a classification that underestimates the fact that Ranzi et al. 58 mechanism results in autoignition on Figure 10(b), while Mehl et al. 57 does not. This reactivity order is more closely followed by the order of IDT in the low-temperature range of Figure 6. Therefore, it seems that the end-gas ignition is more closely dictated by the occurrence of the first-stage ignition, while the second-stage ignition occurs at a fixed crank angle interval, or at a fixed temperature from the first.
A closer look at the pressure increase also evidences the different reactivity exhibited by the different mechanisms. Figure 10(e) and (f) present the difference in the pressure traces predicted for conditions that lead to knocking and the pressure trace at the same base conditions, but with the end-gas chemical kinetics turned off (a frozen condition),
Summary of the timing and properties at the first and second-stage ignition at CR = 6.05 and CR = 7.28, calculated by the chemical kinetics mechanism by Wang et al.,
60
at engine speed 600 RPM
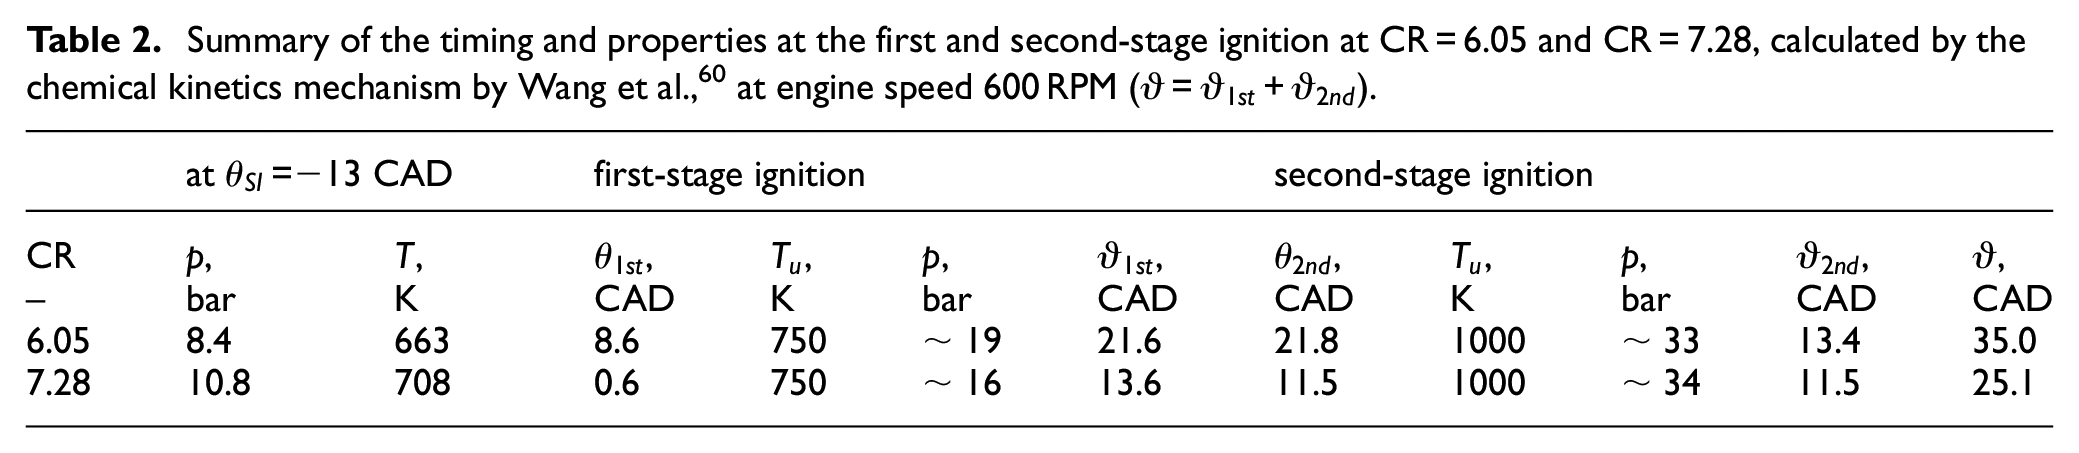
In both compression ratios shown in Figure 10(e) and (f), the spark occurs at −13 CAD. Following Table 2, the pressure and temperature at CR = 7.28 (Figure 10(b) and (d)), at the moment of spark, are about 28% and 7% higher, respectively, than the pressure and temperature at CR = 6.05 (Figure 10(a) and (c)). Therefore, at the lower compression ratio, since
The second-stage ignition occurs approximately 13.4 CAD after the first-stage ignition for CR = 6.05 and 11.5 CAD after first-stage ignition for CR = 7.28. In both cases, however, it occurs approximately at 1000 K and 33 bar. The shorter second-stage ignition delay,
At Figure 10(e), it is noticed a small pressure difference decrease after TDC, but before first-stage ignition at CR = 6.05, for the mechanisms of Cai and Pitsch, 30 Ranzi et al., 58 and Andrae et al. 59 For these mechanisms, the pressure developed when the end-gas chemical kinetics is on is smaller than the pressure developed when the end-gas chemical kinetics is off during the expansion period. To explore this aspect, the trade-off between flame speed and heat release rate is explored.
The characteristic times for compression and expansion are determined by the engine speed, which, thus, controls the charge compression and expansion. Besides the piston work, the temperature of the end-gas increases due to the compression work produced by the heat release from the propagation of the turbulent flame and also due to the heat release rate from the chemical reactions. The increase in end-gas temperature decreases the ignition delay time of the unburned mixture ahead of the flame front. Concurrently, the higher temperature increases the laminar flame speed in the turbulent flame, thus reducing the characteristic time to burn the end-gas. Therefore, the instant when end-gas autoignition occurs, at a given engine speed, is a consequence of the flame front propagation and the heat release in the end-gas, controlled by low-temperature kinetics.
Figure 11 presents the laminar flame speed,
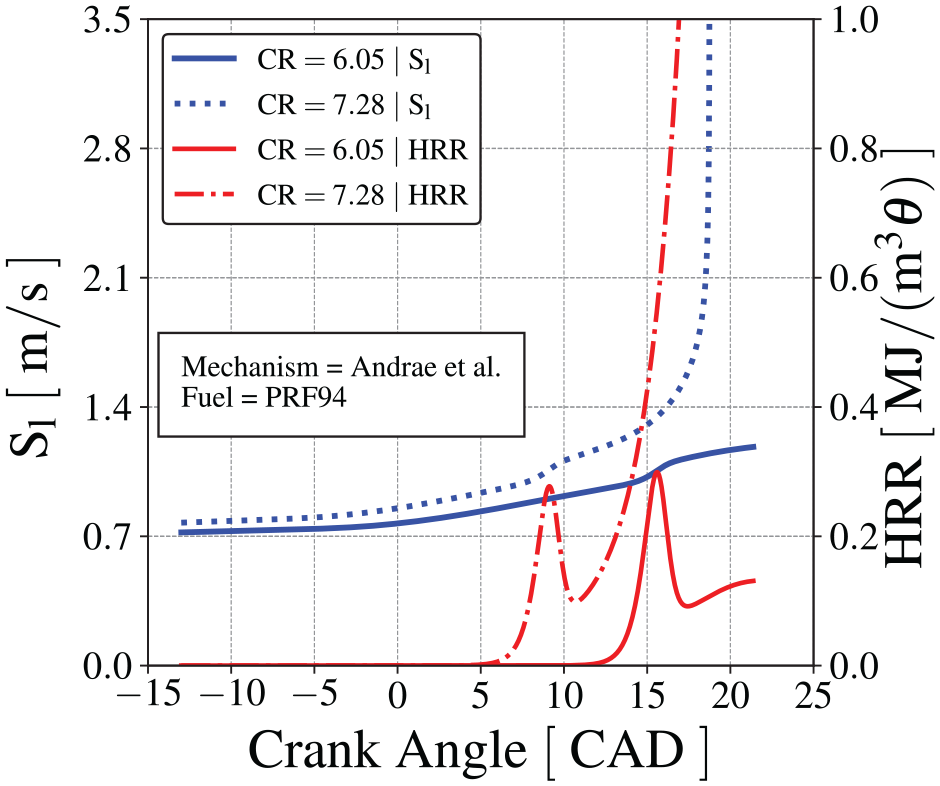
Flame front speed (blue lines) and heat release rate (red lines) using Andrae et al. 59 mechanism. The solid lines are the results for CR = 6.05 and dotted lines are the results for CR = 7.28. The engine speed is 600 RPM.
Figure 10(e) shows a pressure difference drop from 0 to 7 CAD. From Figure 11, the heat release rate during this period is negligible. From Figure 10(c), the end-gas temperature deviation from the result with no chemical kinetics is negligible. As a consequence, the laminar flame speed shown in Figure 11 is basically the same as that for the result with no chemical kinetics. Therefore, the pressure difference reduction observed in Figure 10(e) is due to a change in properties of the end-gas mixture leading to an effect equivalent to a small increase of the specific heat ratio.
Figure 10(e) shows the decrease in the pressure difference after the first-stage ignition, which is more pronounced for CR = 6.05. When the end-gas chemical kinetics is turned off, the cylinder pressure is a result from the competition of the expansion work caused by the piston, the compression work on the end-gas caused by the flame propagation, and the heat loss to the walls (recall that the CFR engine is motored to operate at 600 RPM). When the end-gas chemical kinetics is turned on, as shown in Figure 11, a positive (exothermic) heat release rate increases after 10 CAD as a result of the chemical reactions occurring during the second-stage ignition delay. In Figure 10(c), we observe an increasing departure of the end-gas temperature in respect to the temperature when chemical kinetics is off. However, the heat generated by the intermediate-temperature kinetics is not enough to compensate the effects of property change, and the pressure difference drops. At CR = 7.28, the faster flame propagation increases the rate of compression work on the end-gas and the heat release rate from the end-gas chemical reactions is also larger. As a consequence, the end-gas temperature departures progressively from the baseline and, even in the presence of a larger heat loss to the wall, the pressure difference remains approximately constant.
Effect of compression ratio
Figure 12 presents the in-cylinder pressure calculated for CR from 5.0 to 9.0 (with 0.4 increments), at 600 RPM, using Wang et al.
60
mechanism. The first-stage ignition is visible as a small pressure increase before the main end-gas autoignition. This pressure increase is clearly visible in the pressure trace for CR
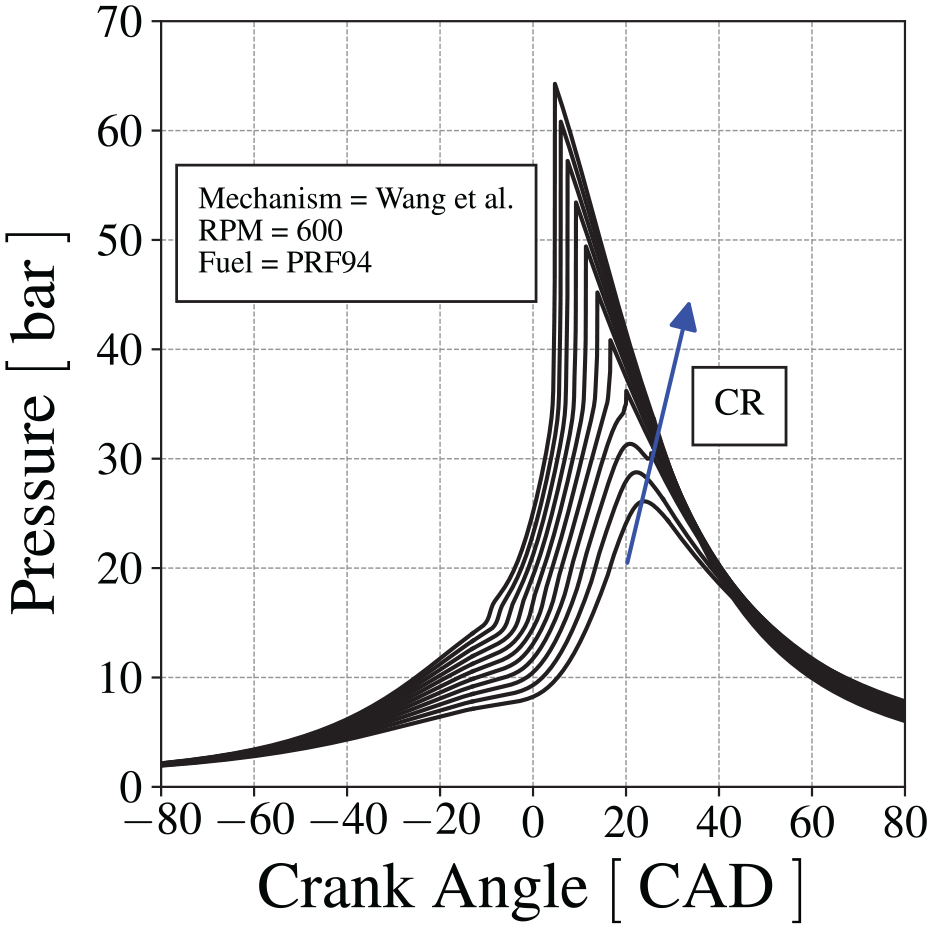
In-cylinder pressure for different compression ratios for Wang et al. 60 mechanism.
The timing for the first-stage ignition is mapped in Figure 13, as a function of the compression ratio, calculated using the four different chemical kinetics mechanisms. The conditions where second-stage ignition also occurs are indicated as a plus sign. As discussed above, Figure 13 shows that the first stage ignition occurs earlier as CR is increased, in a approximately linear dependence. The second-stage ignition occurs only for higher CR. The mechanisms by Wang et al., 60 Ranzi et al., 58 and Cai and Pitsch 30 result in approximately the same predictions for the first stage ignition delay time, as noticed in Figure 10.
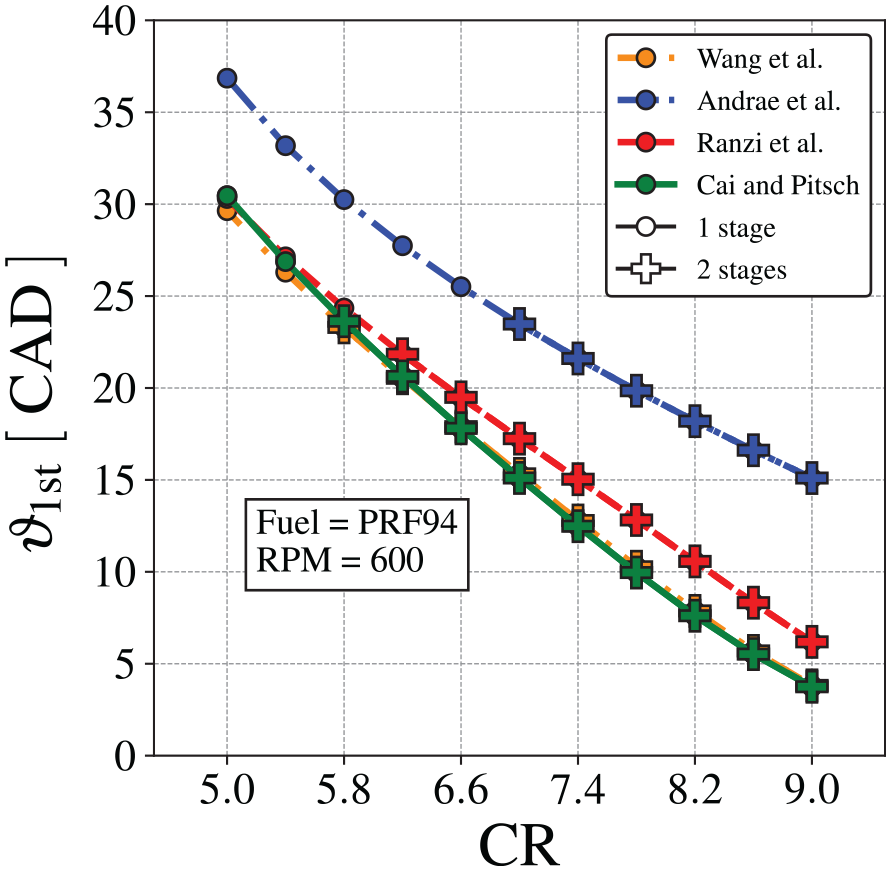
First-stage ignition delay angle,
Effect of engine speed
Figure 14 presents (a) the end-gas temperature and (b) pressure as a function of time, for different speeds, at the same compression ratio of 7.0, calculated using the mechanism by Wang et al. 60 The vertical dashed lines connecting the curves to the time axis identify the spark timing at each speed. Since compression is basically isentropic, all curves present essentially the same temperature and pressure at the instant of the spark, slightly above 10 bar. The insets present the same curves, but plotted as a function of crank angle. The curve at 600 RPM is similar to the curves presented in Figure 10.
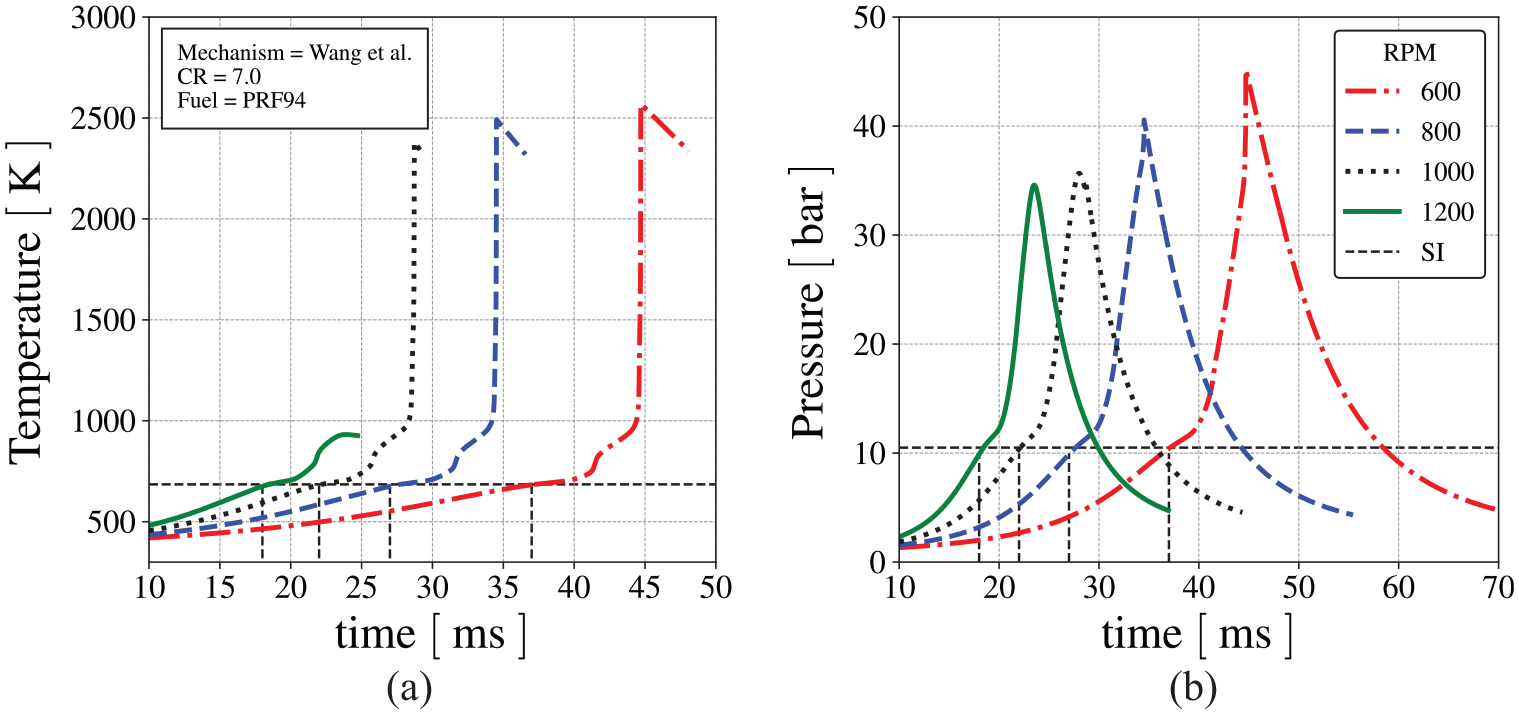
(a) End-gas temperature and (b) pressure as a function of time, for different engine speeds, at CR = 7.0, calculated using the mechanism by Wang et al.
60
The vertical dashed lines identify the instant of the spark at each speed,
Autoignition of the end-gas occurs at engine speeds below 1200 RPM. Figure 14(a) shows that the first-stage ignition occurs at about 750 K and second-stage ignition occurs when the end-gas reaches about 950 K to 1000 K. The peak end-gas temperature after autoignition is higher for the lower speed, since autoignition occurs still in the compression stroke. As the engine speed is increased, the second-stage ignition occurs earlier, but the timing in CAD is pushed forward, to conditions after TDC (see the inset in Figure 14(b)). The maximum pressure and temperature at higher engine speeds reduce, until, at 1200 RPM, autoignition ceases to occur. Figure 14(a) shows that the volume of end-gas when autoignition occurs reduce when engine speed increase. Therefore, although end-gas temperature and pressure is higher for lower speeds, it takes longer to consume the end-gas. However, the development of the combustion after autoignition is not the focus here and several effects are not modeled.
Figure 15 presents the first-stage ignition delay time, temperature and pressure as a function of the compression ratio for different engine speeds, using Wang et al. 60 mechanism. The plus symbols identify those conditions leading to second-stage ignition.
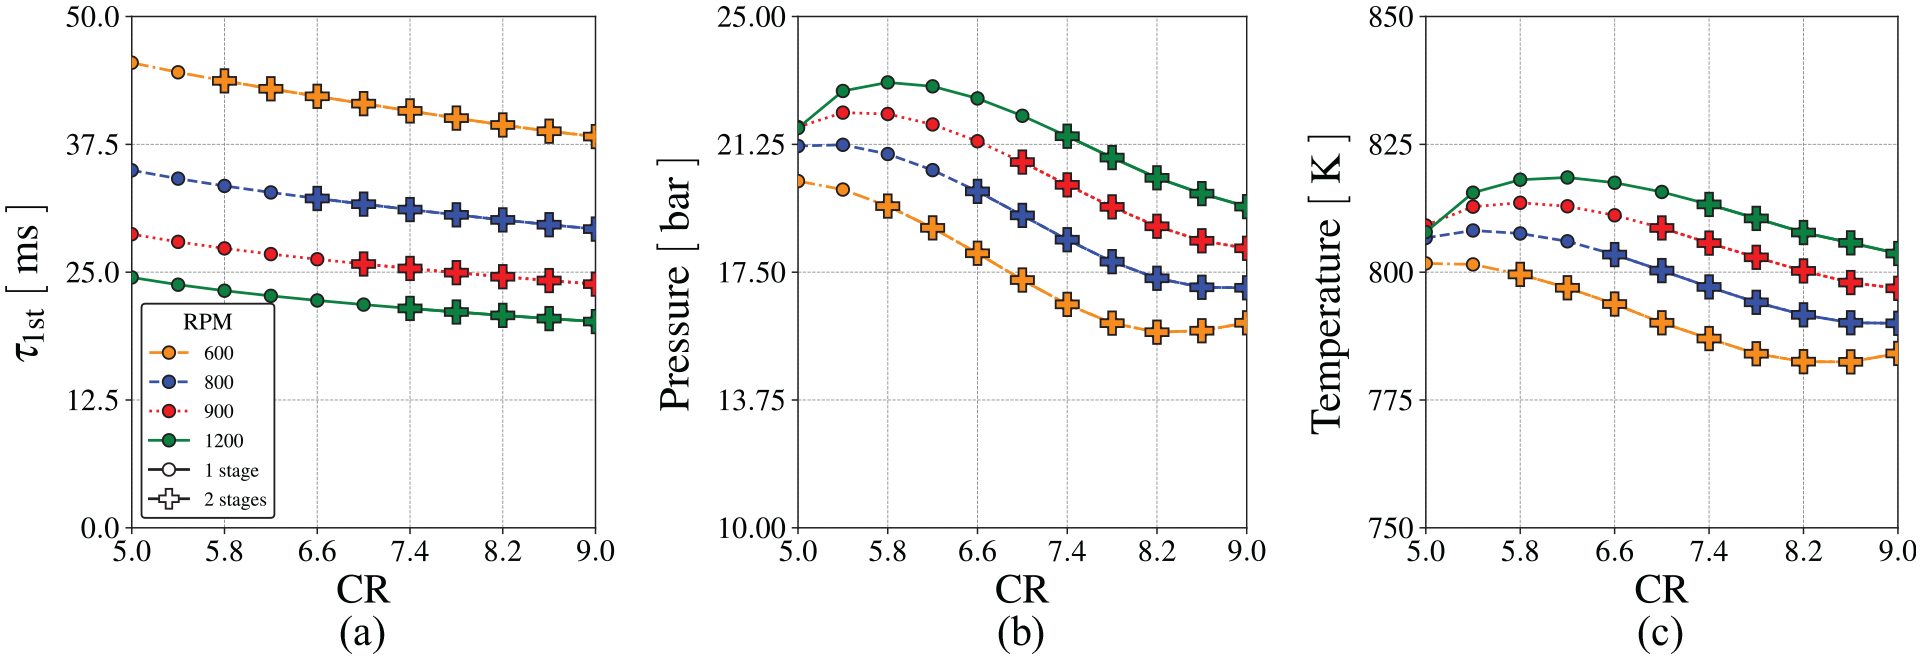
Behavior of first-stage ignition delay using Wang et al. 60 chemical mechanism for different engine speeds, (a) first-stage ignition delay, (b) pressure and (c) temperature.
As the compression ratio increases, the temperature and pressure at the spark ignition increase. It leads to a reduction of the ignition delay time of the first-stage ignition as the compression ratio increases. As the engine speed increases, the smaller elapsed time for heat transfer also increases the temperature and pressure of the end-gas at the spark ignition. Therefore, the ignition delay time for the first-stage ignition decreases as engine speed increases. Also, as the engine speed increases, the time available for combustion decreases. For higher speeds, the second-stage ignition only occurs at progressively higher compression ratios.
Figure 16 shows the ignition delay, expressed in crank angle, for the first-stage ignition,
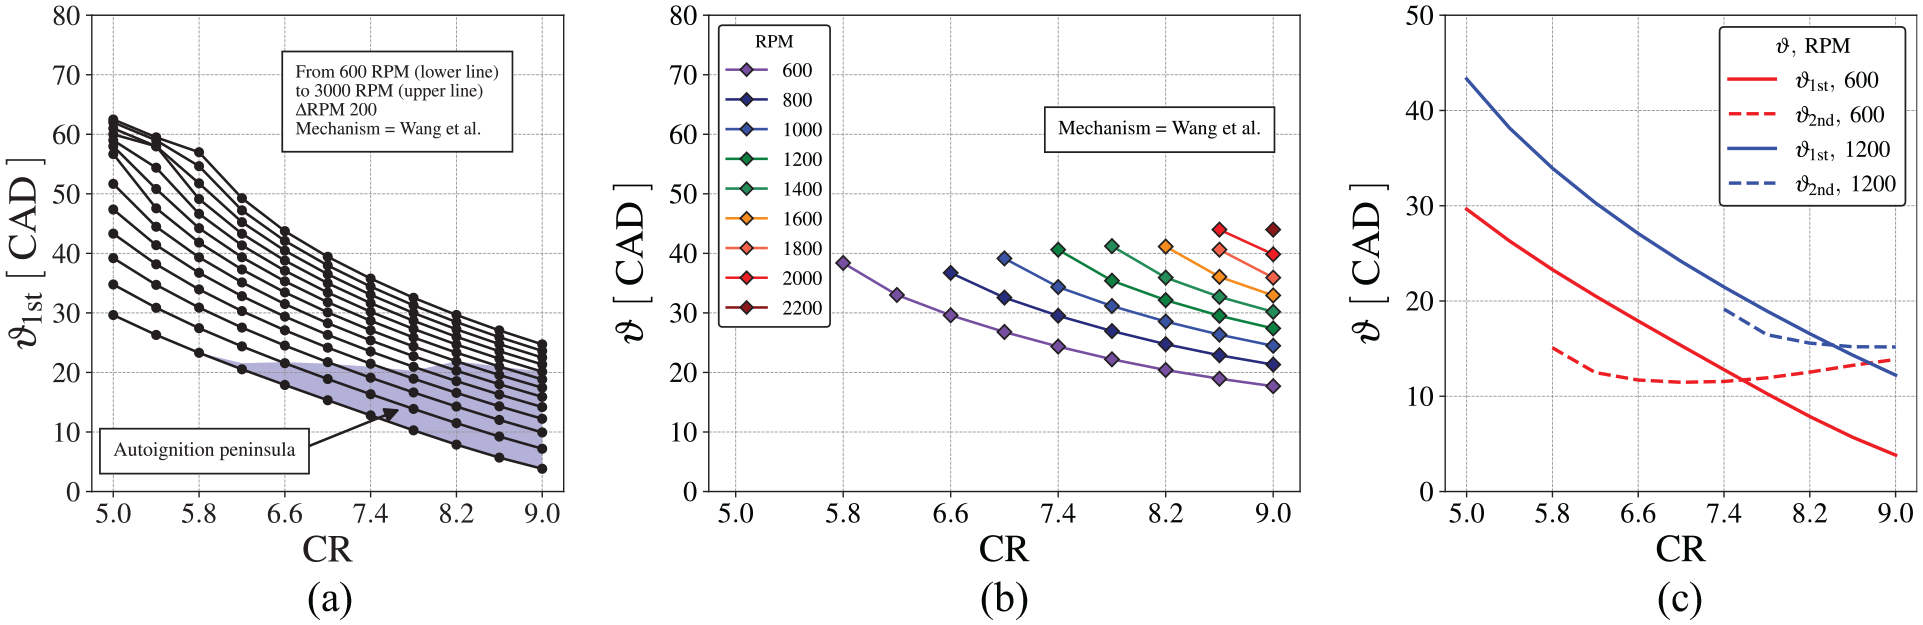
(a) first stage ignition,
From the analysis above, we might ask when the kinetics for the ignition delay becomes important during the engine cycle. During the engine simulation, it is relatively easy to start the kinetics calculation at any time. Defining
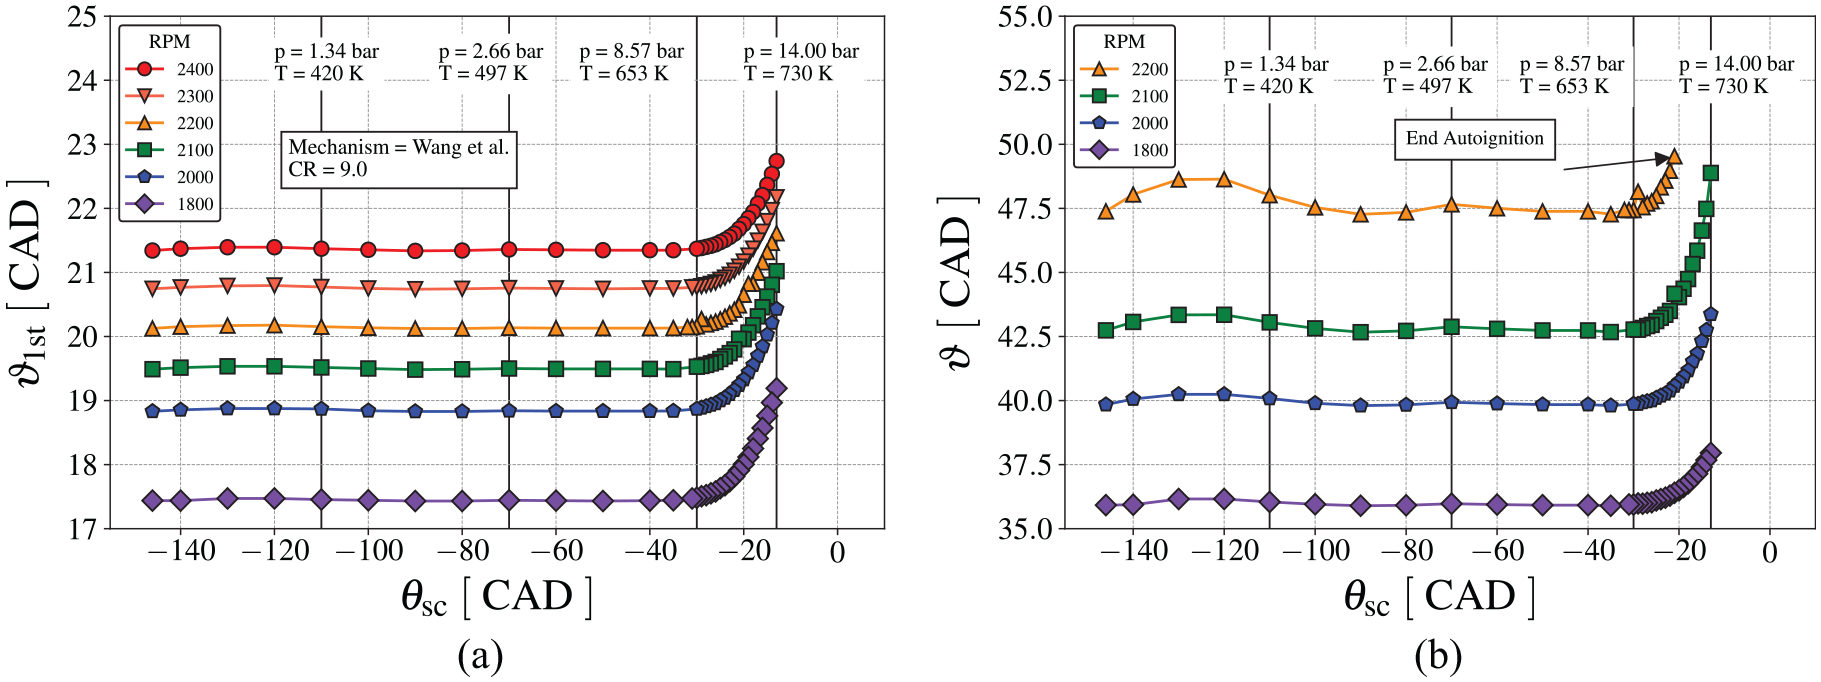
Analysis of the autoignition for different resident time of the unburn mixture using the Wang et al. 60 mechanism with PRF94, (a) first stage and (b) second stage.
From the results in Figure 17, it appears that chemical suppression of the first-stage ignition at temperatures above 650 K contributes strongly to delaying end-gas autoignition. In terms of an IDT curve, as that shown in Figure 2(a), this corresponds to a measure that would increase the
Figure 18 summarizes this conclusion. In this figure,
Scheme of key autoignition events during engine combustion. The
Sensitivity analysis
The prediction of the mechanisms can be further explored by analyzing the sensitivity of the production of given species to the rate of chemical reactions. The analysis will be limited to the engine operating at
The rate of formation of
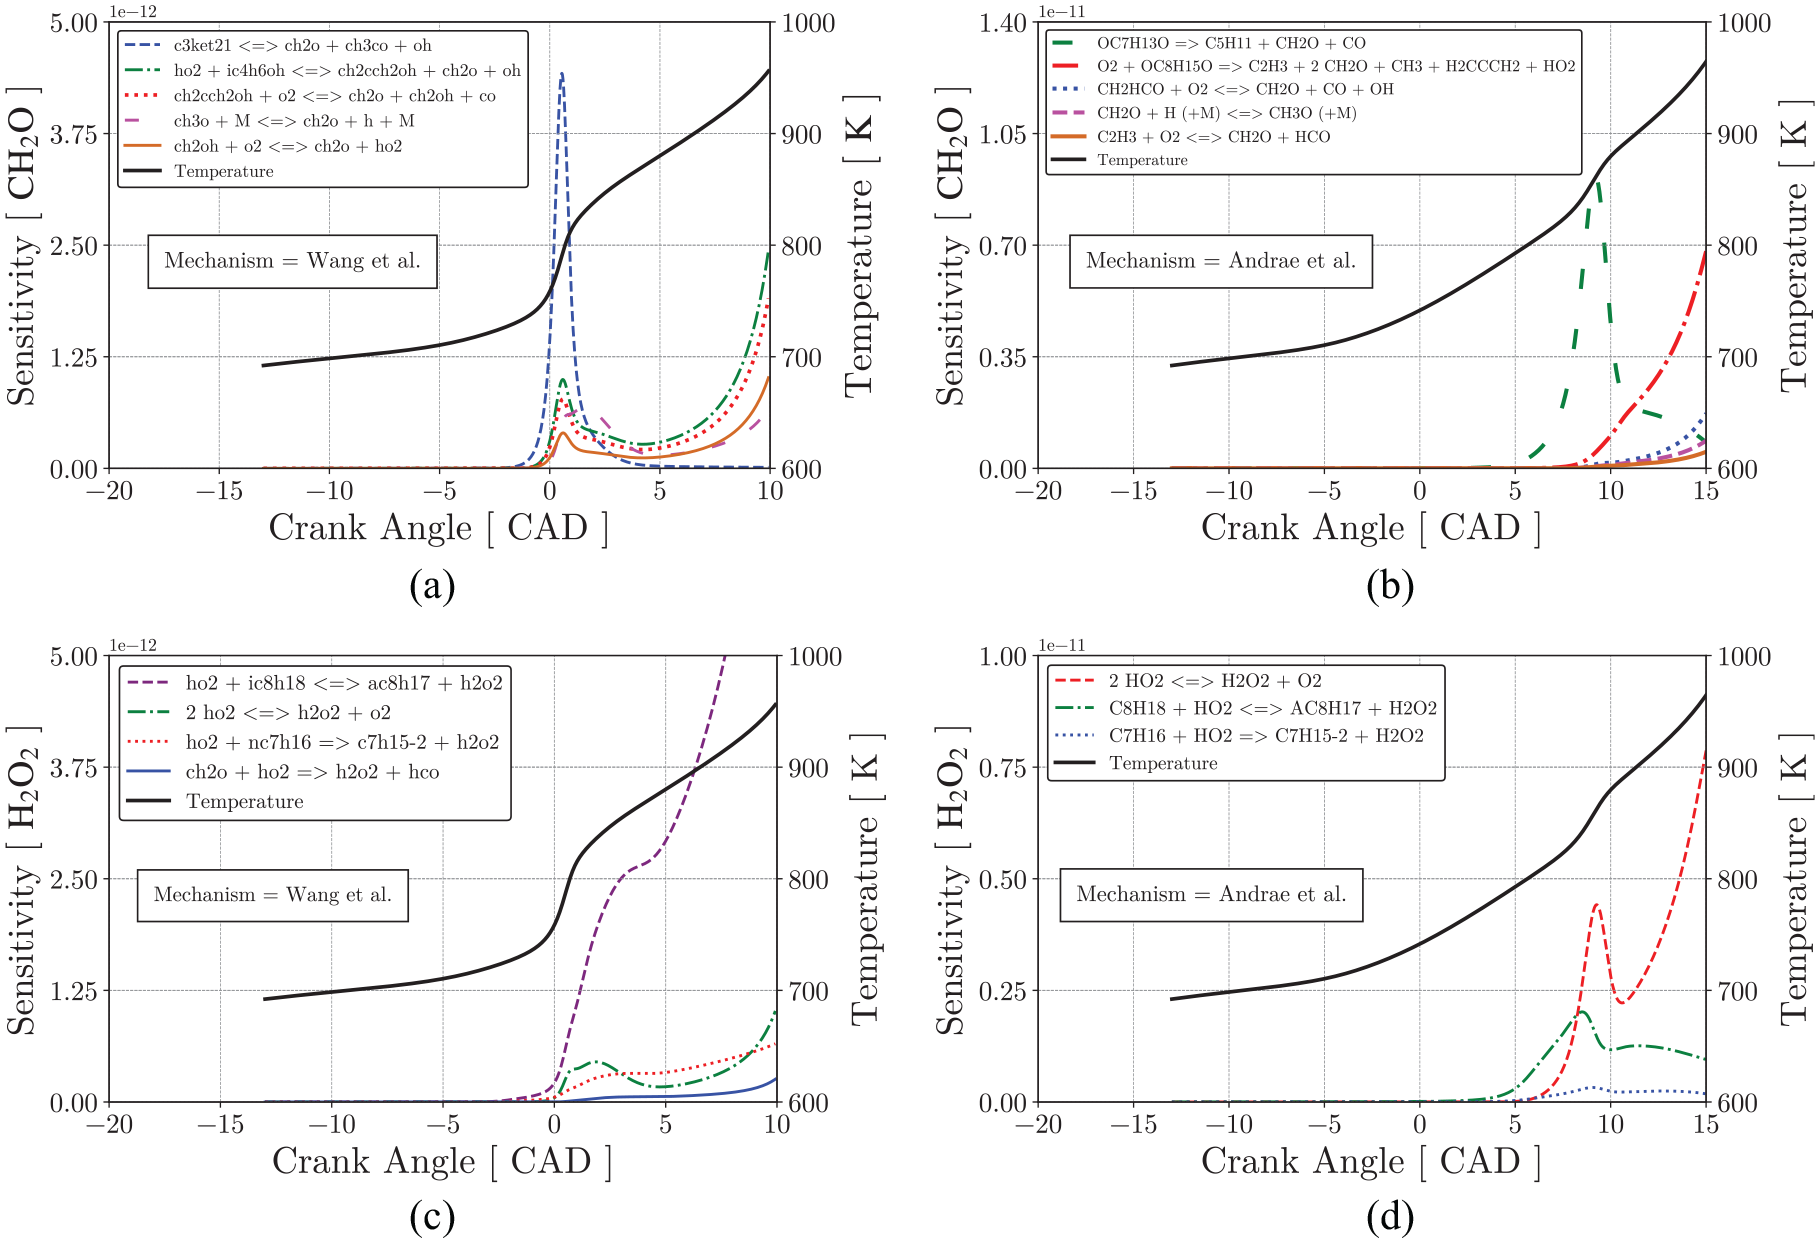
Figure 20(a) and (b) presents the relative sensitivity of the important reactions to the formation of
Figure 20(c) and (d) present basically the same result for both mechanisms, where the formation of the hydrogen peroxide is ruled by reactions involving the fuel species. Moreover, the reaction
Conclusion
In this paper, the onset of knocking in a CFR engine is analyzed using a two-zone model. The Standard Coherent Flame Model is used to track the flame position and to calculate the speed of the main turbulent flame. It is assumed that the burned gas behind the flame is in chemical equilibrium. The unburned gas ahead of the flame is considered to be spatially uniform and the chemistry is modeled using a detailed chemical kinetics mechanism. Heat transfer to the cylinder walls is estimated using a surface-averaged convection coefficient. The transient pressure traces obtained from the simulations are compared with measurements on a CFR engine operating with PRF92 and PRF94 mixtures under normal and knocking conditions.
The chemical kinetics mechanisms of Cai and Pitsch (335 species/1613 reactions), 30 Mehl et al. (323/2469), 57 Ranzi et al. (156/3465), 58 Andrae et al. (137/640), 59 and Wang et al. (73/448) 60 were used. When compared with available measurements in the high-pressure shock tube, all mechanisms provide reasonable predictions of the ignition delay in the NTC region, except for the mechanism of Mehl et al. 57 which overestimates the ignition delay time in the NTC region. When the mechanisms are applied to predict the CFR engine under knock conditions, all mechanisms except Mehl et al. 57 result in autoignition of the final gas, but at different crank angles than the measurements suggest.
The decrease in crank angle for ignition suggests that reactivity increases in the order of Cai and Pitsch, 30 Wang et al., 60 Ranzi et al., 58 and Andrae et al. 59 but this order is not clear in the IDT curves. Therefore, the most important question is how the autoignition kinetics in the end-gas are related to the variable pressure and temperature. The results indicate that the interaction of the chemical kinetics mechanism with engine operation is strongly dependent on the timing of the first-ignition stage. The results for PRF94 show that the first-stage occurs when the end-gas reaches about 750 K, regardless of engine speed. This temperature is near the local minimum in the IDT curve at the beginning of the NTC region (at the transition from low- to high-temperature) Thus, regardless of the many reactions that occur during the IDT period, the pressure at the moment of first stage ignition becomes a function of compression ratio and heat loss to the cylinder walls only. Second-stage ignition follows a similar trend and occurs when the end-gas mixture reaches approximately 1000 K. However, unlike the period before first-stage ignition, the temperature evolution in the end-gas during the second-stage is influenced by the reactions taking place. Then, the second stage ignition, although associated with high-temperature chemistry, it depends on the type and amount of species formed during the first-stage ignition.
Therefore, controlling ignition in the first-stage is the key to rule the occurrence of knocking. It is speculated that species that reduce the ignition delay at the local minimum at the beginning of the NTC region (shift it downward on the IDT curve) or shift it to a higher temperature (shift it horizontally to the left on the IDT curve) reduce the tendency to knock. This was illustrated by the results obtained with the mechanism of Mehl et al. 57 This mechanism does not lead to ignition in the second-stage at compression ratios lower than seven because the ignition delay in the NTC region is predicted to be too high. Therefore, developing an understanding of which species tend to delay first-stage thermal ignition by either lowering the local minimum or shifting it to the left is critical for developing fuels with the goal of increasing efficiency and energy density. This understanding can help identify species that can be added to fuel blends to reduce the occurrence of knock.
Supplemental Material
sj-pdf-1-jer-10.1177_14680874231193207 – Supplemental material for Effect of first-stage ignition on the onset of knocking in SI engines
Supplemental material, sj-pdf-1-jer-10.1177_14680874231193207 for Effect of first-stage ignition on the onset of knocking in SI engines by Rafael Meier, Augusto Finger Pacheco, Leonel R Cancino and Amir AM Oliveira in International Journal of Engine Research
Footnotes
Acknowledgements
The authors gratefully acknowledge the Center of Applied Research in Technische Hochschule Ingolstadt, Germany, for providing the experimental results and the support of POSMEC (The Graduate Program in Mechanical Engineering of Federal University of Santa Catarina, Brazil) and CNPQ 141136/2017-0 (National Council for Scientific and Technological Development, Brazil).
Declaration of conflicting interests
The author(s) declared no potential conflicts of interest with respect to the research, authorship, and/or publication of this article.
Funding
The author(s) received no financial support for the research, authorship, and/or publication of this article.
Supplemental material
Supplemental material for this article is available online.
References
Supplementary Material
Please find the following supplemental material available below.
For Open Access articles published under a Creative Commons License, all supplemental material carries the same license as the article it is associated with.
For non-Open Access articles published, all supplemental material carries a non-exclusive license, and permission requests for re-use of supplemental material or any part of supplemental material shall be sent directly to the copyright owner as specified in the copyright notice associated with the article.