
Abstract
In the present study, the predictive tool based on an artificial neural network is developed by means of the experimental data of two series hybrid electric vehicles. The experiments have been conducted on different driving conditions, including highways, traffic, and combined driving conditions. Then, the artificial neural network is developed to predict an arbitrary series hybrid electric vehicle’s required power. The instantaneous required power is divided into dynamic and steady power to size the combustion engine, electric motor, and high voltage battery of the series hybrid electric vehicle. The effects of different ambient conditions (including ambient temperature and altitude), the inverter and high voltage battery efficiencies, and the coast-down coefficients on the components sizing of the series hybrid electric vehicle are then investigated in different driving conditions. The results revealed that the maximum instantaneous power of the electric motor is associated with rapid acceleration in low-speed conditions, and the suburban driving route determines the combustion engine’s maximum power. Notably, the Worldwide Harmonized Light-duty vehicles Test Cycle is the most comprehensive among the available driving cycles, and most of the components’ sizes are determined by this cycle except the combustion engine’s maximum power. It is also realized that the cycle-wise investigation can be summarized into the Isfahan-Tehran route and Worldwide harmonized Light-duty vehicles Test Cycle calculations.
Introduction
The dramatic use of fossil fuels to run the transportation systems and, consequently, its pernicious effects on the human & non-human environment is nowadays one of the most significant concerns of the scientific community. 1 Meanwhile, the ascending surge of government environmental regulations for automotive companies is becoming stricter. Evidently, internal combustion engine vehicles (ICE Vehicles) have a fundamental role in this regard; resultantly, a great rush to thwart the adverse environmental effects of current primary transportation methods and obey the regulations have intensified recently. One of these attempts is to use hybrid energy/power sources to run the vehicles. The hybrid powertrain needs less infrastructural development compared to Fuel-Cell Vehicles (FCVs) 2 and Electric Vehicles (EVs). 3 Hybrid electric powertrains have also overcome the issue of the short driving range of EVs and do not have such a high manufacturing cost and rigorous safety considerations as FCVs. 4 Hybrid Electric Vehicles (HEVs) may use an electric motor to drive the vehicle and isolate the IC engine keeping it only to produce electricity (Series HEVs), both electric motor & IC engine collaborating to produce adequate power (Parallel HEVs), or a configuration to combine the series and parallel (Series-Parallel HEVs). 5 Due to their influence on cost-effectiveness, fuel economy, and environmental prospect, components sizing (CS) & power/energy management strategies (EMSs) are vital investigations to be accomplished on either of the architectures mentioned above. 6 The cost of the battery in a Battery Electric Vehicle (BEV) was around 50% of the whole vehicle price in 2017 and is predicted to lie between 18% and 23% in 2030 7 ; furthermore, even modern batteries are heavy and can occupy spaces from 450 to 600 l. 8 The size of ICE can also affect fuel consumption (FC) and exhaust emissions. These facts illustrate the importance of components sizing in this type of vehicles and consequently, the necessity of following investigations accomplished in this paper and by other researchers.
Various methods have been deployed to investigate the CS problem regarding case-specific circumstances. In many studies, the CS and EMS techniques are implemented based on experimental data. Due to their importance and influence on each other, plenty of research works develop CS and EMS methodologies in parallel. Following the literature, many utilized methods so far will be reviewed (Table 1).
Summarized Literature Review of this Study.
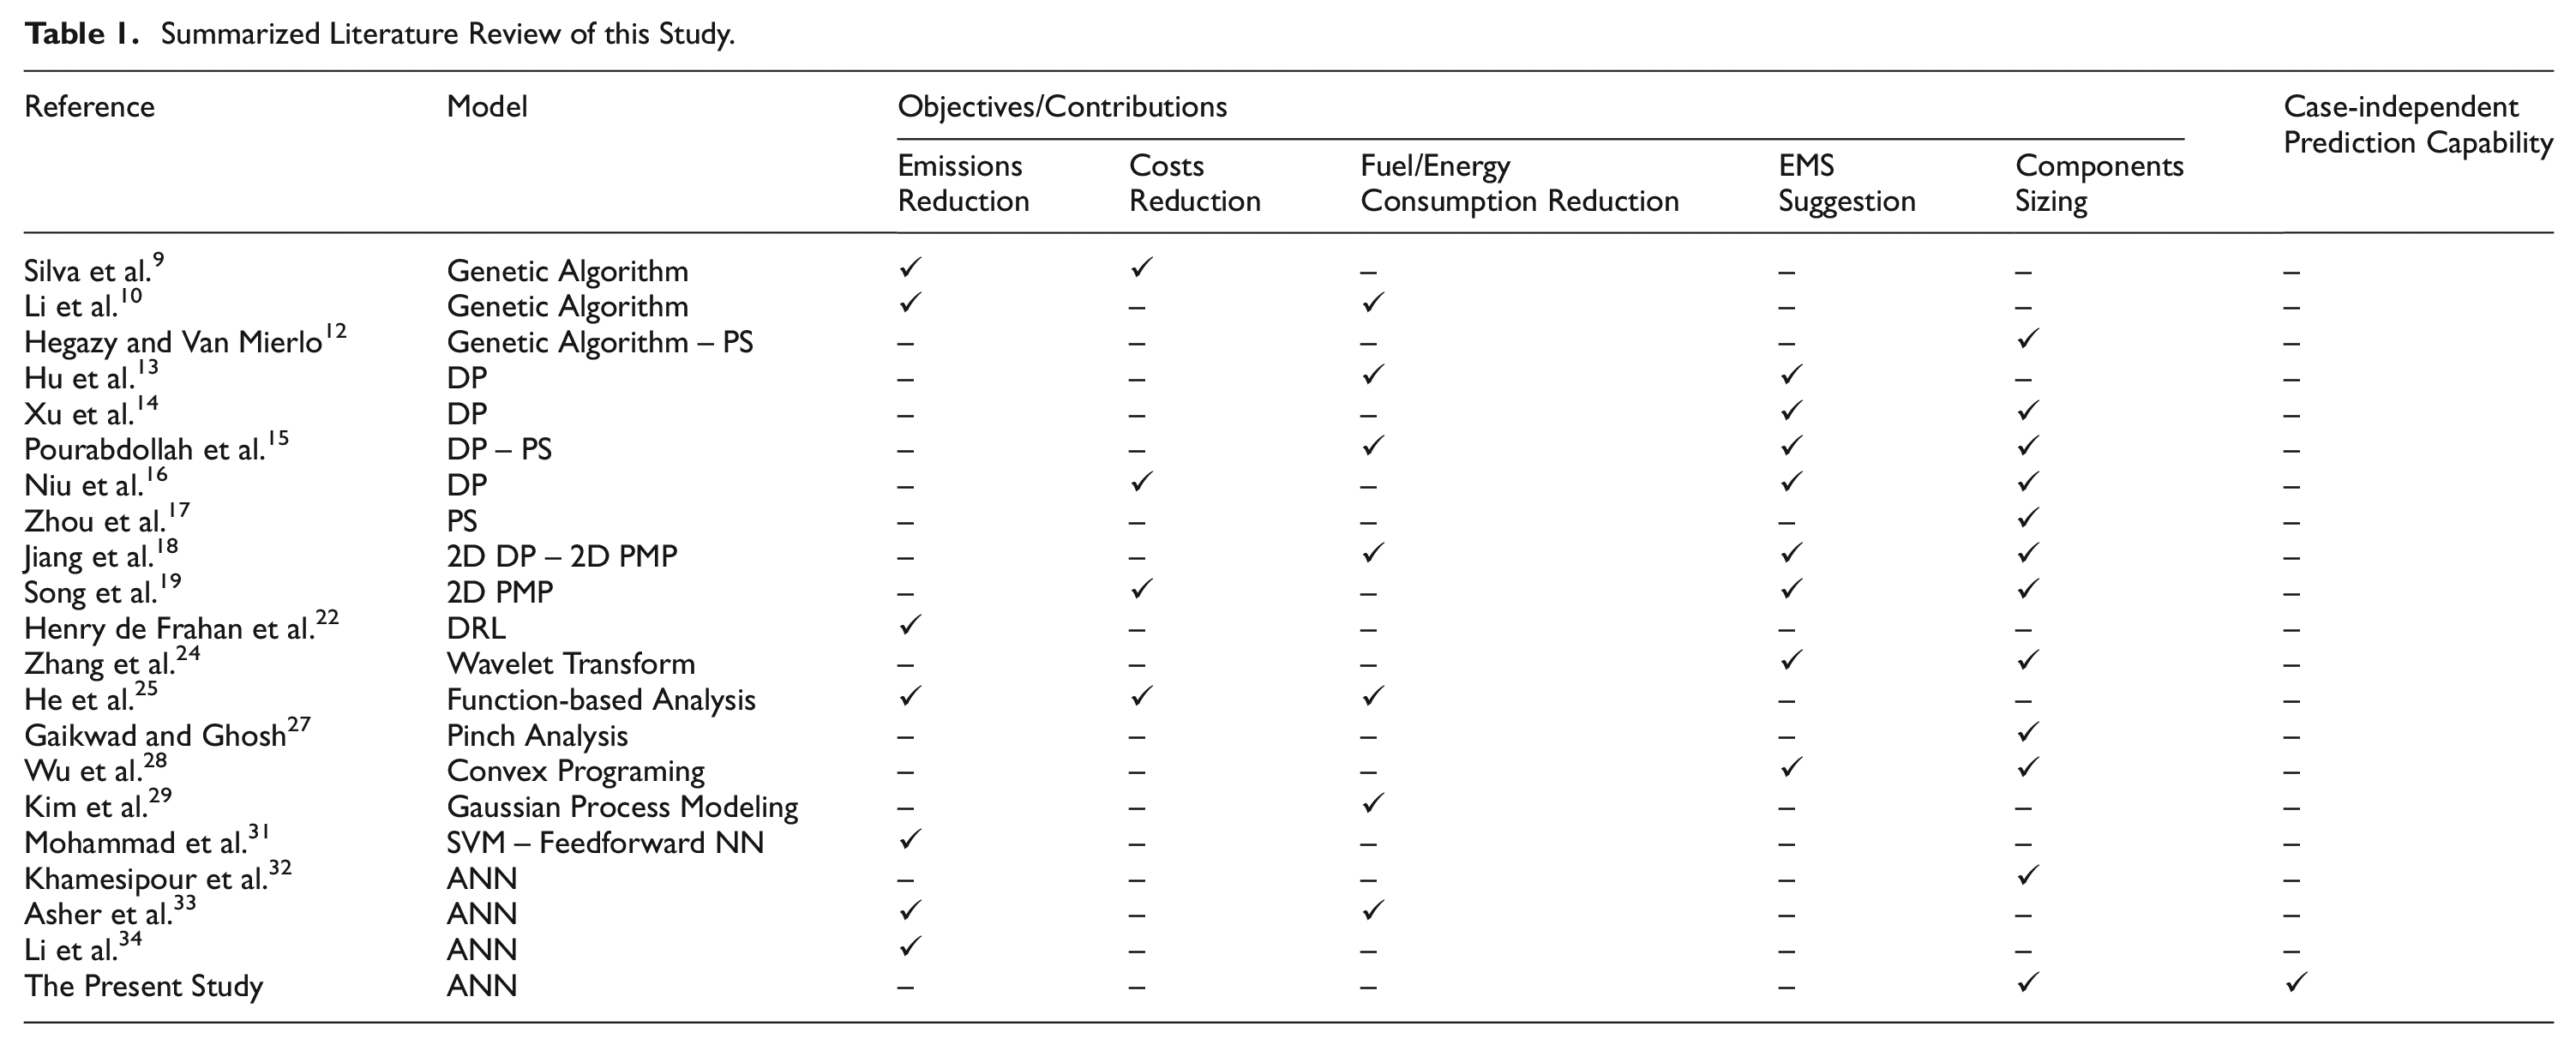
Genetic algorithm
Genetic algorithm is one of the methods that has been widely leveraged to optimize the size of components or propose EMSs. Silva et al. 9 adopted a genetic algorithm approach to carry out a multiobjective optimization for a plug-in hybrid electric vehicle (Plug-in HEV). Also, ADVISOR™ software was used in order to analyze pollutant emissions. They achieved a reduction in emissions and vehicle travel costs. Li et al. 10 utilized a genetic algorithm alongside GT-Power and MATLAB/Simulink software to improve the performance of an Atkinson cycle. A corresponding experimental investigation validated the results. The outcomes revealed sensible descent in the FC and emissions. The impacts of the genetic algorithm were also analyzed by Lü et al. 11
Particle swarm and dynamic programing
Particle swarm and dynamic programing (DP) were also common in this regard and, in some cases, were utilized alongside genetic algorithm. An optimization job deploying a genetic algorithm and particle swarm has been carried out for a fuel-cell HEV (FCHEV) by Hegazy and Van Mierlo 12 to assign the optimal size of components. Hu et al. 13 proposed a novel approach by employing a dual engine system in a series HEV and utilizing a DP algorithm to determine the optimized distribution of energy. Their results showed a 7.3% decrease in FC compared to other specific strategies. A two-loop framework having the DP in the inner loop for determining the EMS and a result-comparing coordinator as the outer loop was implemented by Xu et al. 14 For a fuel-cell city bus, simulations revealed an optimum of 150 Ah and 40 kW for battery capacity and fuel-cell net output power, respectively. Pourabdollah et al. 15 leveraged particle swarm optimization to find the optimal CS. DP was also used for finding optimal energy management; their results demonstrated a 10.4% FC reduction compared to the original power design. Another study by Niu et al. 16 proposed a hierarchical optimal sizing framework. The lower layer utilized the DP for EMS. The upper layer did the sizing optimization of the hybrid battery system (HBS) to achieve the minimum distance-based cost (DBC) in an electric taxi. As a result, the DBC, at first, ascended and then descended with increasing the lithium titanate battery size. In a research by Zhou et al., 17 a particle swarm optimization algorithm was used to put forward a novel sizing method for HEVs. The total efficiency increased by 1.71%.
Pontryagin’s minimum principle
Using pontryagin’s minimum principle (PMP), many researchers have fulfilled optimizations on various multi-power-source vehicles alongside other methods. In a work accomplished by Jiang et al., 18 a 2D (two-dimensional) DP algorithm was introduced to minimize the system degradation and energy consumption of a three-power-source bus; then, components sizes and EMS were both optimized using a 2D PMP strategy. A 2D PMP algorithm was also utilized in another research by Song et al. 19 for a plug-in HEV. Their algorithm could determine the EMS, battery size, and supercapacitor size. They also witnessed a 28.6% reduction in operating costs compared to a conventional hybrid powertrain with no supercapacitor.
Other methods like reinforcement learning-based algorithm and robust optimization-based strategies were established for different kinds of HEVs by Du et al. 20 and Koubaa et al. 21 A deep reinforcement learning (DRL) was also adopted by Henry de Frahan et al. 22 minimizing the NOx emisisons. Feroldi and Carignano 23 suggested a sizing methodology on the basis of providing the required power for a fuel cell/supercapacitor hybrid vehicle in real driving conditions; the methodology directed the authors to size the fuel cell and predict the number of supercapacitors needed. Zhang et al. 24 studied the optimal sizing of the energy storage systems (ESSs) of an EV. They adopted a power management algorithm based on wavelet transform to obtain the power proportionality between batteries and ultracapacitors. He et al. 25 performed a components sizing optimization by defining three functions of cost-to-power ratio, energy consumption, and greenhouse gas emission for considering economical, efficiency, and environmental aspects. They realized that using E25 as the fuel of the Plug-in HEV leads to 5.9% energy saving and 12.3% reduction in greenhouse gas emissions. Another attempt was made to assign optimal sizes to the components by Haezah et al. 26 via considering a particular hypothetical status for each sizing investigation of the plug-in HEV. Gaikwad and Ghosh 27 adopted the pinch analysis principles to introduce a different methodology to size the ESS and fuel-cell HEV. Their results were validated for WLTC Class-3 driving cycle. Taking advantage of convex programing, Wu et al. 28 proposed an optimization framework for energy management and CS of a plug-in fuel-cell vehicle. They estimated the battery rated power as 54 kW and battery energy capacity as 29 kW/h for the optimal sizes. In a study of fuel economy optimization by powertrain sizing, Kim et al. 29 created the vehicle design process and simulation; then, optimization was implemented by exploiting Gaussian process modeling.
Artificial neural network
CS, EMS, emissions, and FC issues have also been dealt with by Artificial Neural Network (ANN). With its powerful parallelism ability and inherent contextual information processing toward the problem, this tool first experienced a peak during the 1940s to solve many complex problems. 30 Mohammad et al. 31 utilized the support vector machine (SVM) and the feedforward Neural Network to model the NOx and other emissions of a diesel Compression-Ignition (CI) engine. Khamesipour et al. 32 predicted the components sizes of a series HEV based on 3000 experimental data and utilizing the ANN; their results revealed that 1.44 kW/h for battery size and 80 kW for electric motor power were optimal for the investigated cycles. However, vehicle parameters variations were not involved within their job. Asher et al. 33 gathered real world data of a hydraulic hybrid truck to utilize as an ANN inputs. The ANN model was implemented to predict the vehicle’s instantaneous FC and pollutant emissions. An ANN-based NOx & smoke emission model was presented by Li et al. 34 The ANN had the multi-layer perception (MLP) architecture and was trained by experimental data obtained from engine test bench. The simulation concluded the capability of MLP networks for capturing non-linear engine emissions. Nevertheless, the data collected by these studies were not vast enough to include specifications of different types of vehicles.
According to the literature, there have been some research studies on the subject of components sizing; but to the best of our knowledge, adequate attention has not been paid to the subjects of ambient circumstances, such as temperature and altitude. In addition, case-to-case-variant structural features of the HEVs, such as the battery and inverter efficiency, electric motor efficiency map, and the coast-down coefficients, have not been genuinely compounded to the subject of components sizing. The present study introduces an ANN based on 8000 experimental data of two Series HEVs. ANN is implemented to predict the components sizes of a series hybrid electric vehicle, including IC engine power, minimum high voltage battery size, and electric motor power. Notably, a novel method is implemented in the present study to determine the combustion engine power and battery size by load power decomposition to steady (average) and dynamic parts. The main objectives and contributions of this study are declaimed as follows:
Experimental data are deployed to construct and train an ANN-based model;
The predictive tool is developed and implemented to predict the required power of an arbitrary series hybrid electric vehicle;
The required power is decomposed into average and steady powers to determine the combustion engine power and battery size;
IC engine power, high voltage battery size, continuous peak power, and maximum power of electric motor are determined by post-ANN calculations.
Methods
In the present study, an artificial neural network is built based on experimental test trips of two series hybrid electric vehicles. This network is implemented to analyze the effects of boundary conditions on the components sizes of a series HEV. Eight thousand data series are implemented for a reliable ANN model. Seventy-five percent of all data are used for the network training and 15% of them are implemented for validation, the rest of 10% has been devoted to the network test. This model is implemented to calculate the IC engine and battery size of a series hybrid electric vehicle in different conditions. Figure 1 shows the flow diagram of the method in the present study. As shown in this figure, the experiments have been conducted on two series HEVs, and the extracted data is implemented to train an ANN. In parallel with the ANN training, a comprehensive tool based on ANN is prepared to predict a series HEV required power in any driving condition. Finally, the tool is used to analyze the effect of different conditions on the vehicle components sizing.
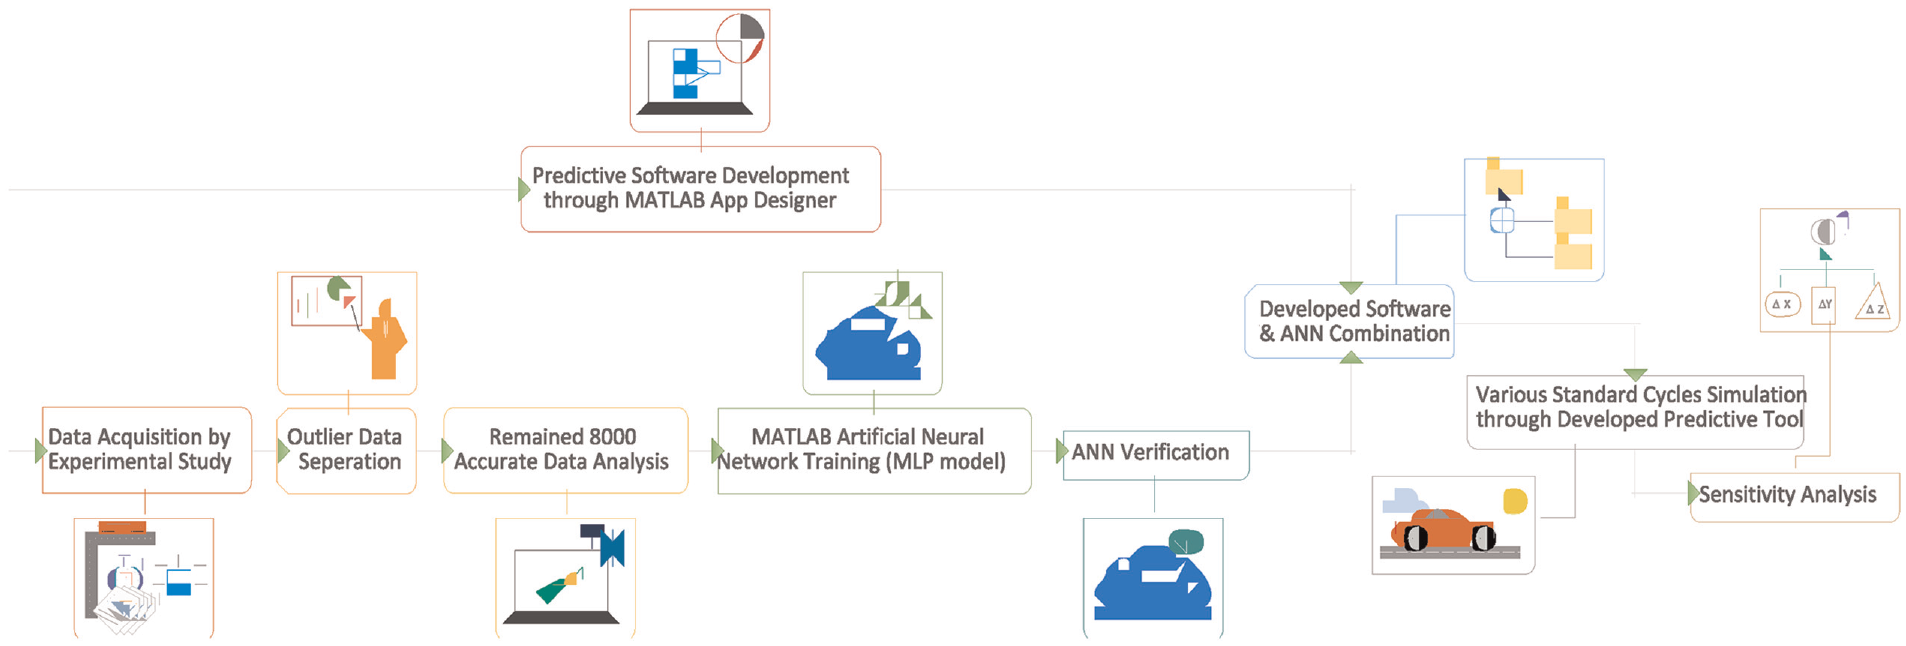
Flow diagram of the procedure in the present study.
Experiments
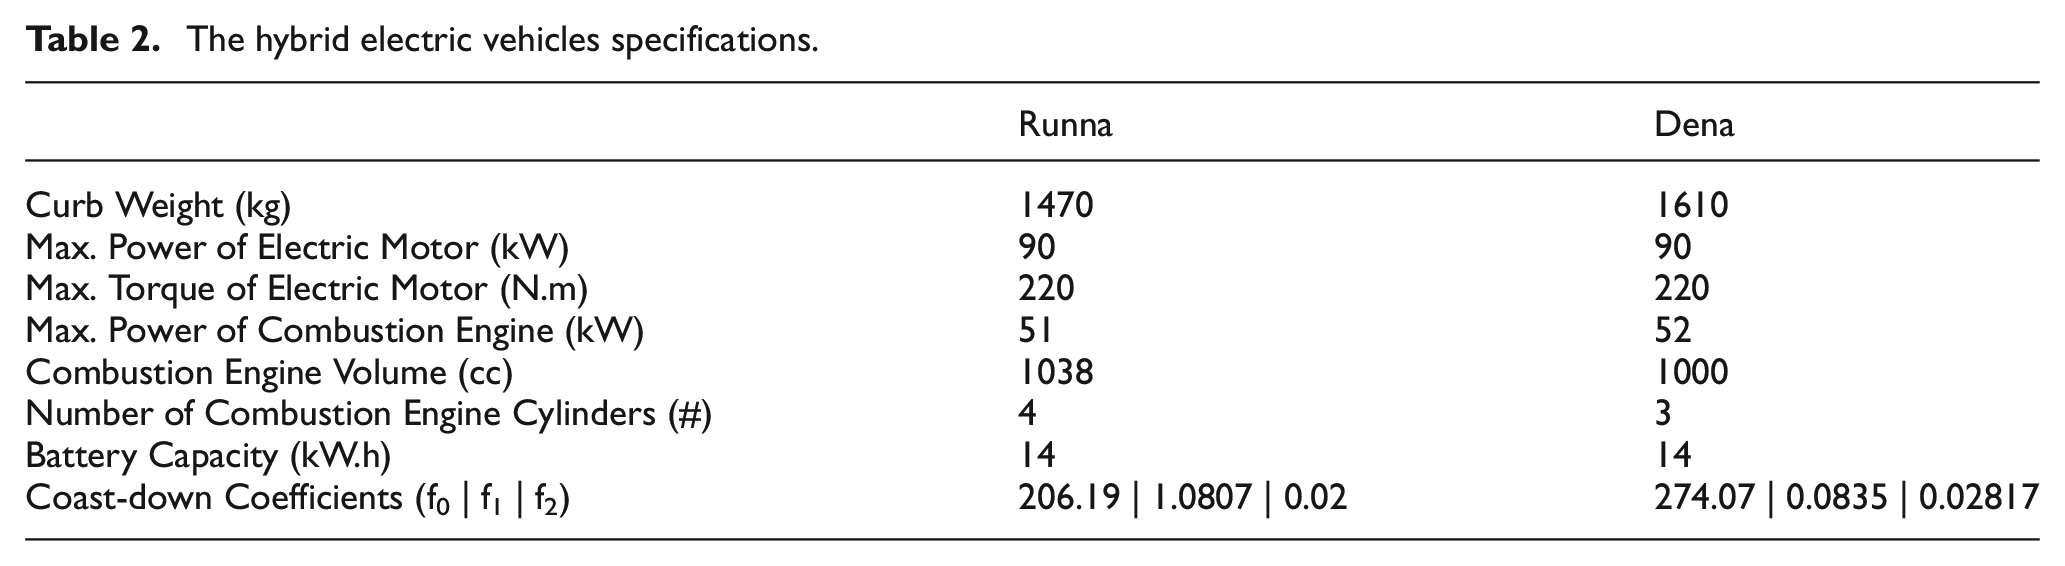
Two series hybrid electric vehicles are implemented in the present study. The tested vehicles are shown in Figure 2. Notably, vehicle specifications are demonstrated in Table 2.
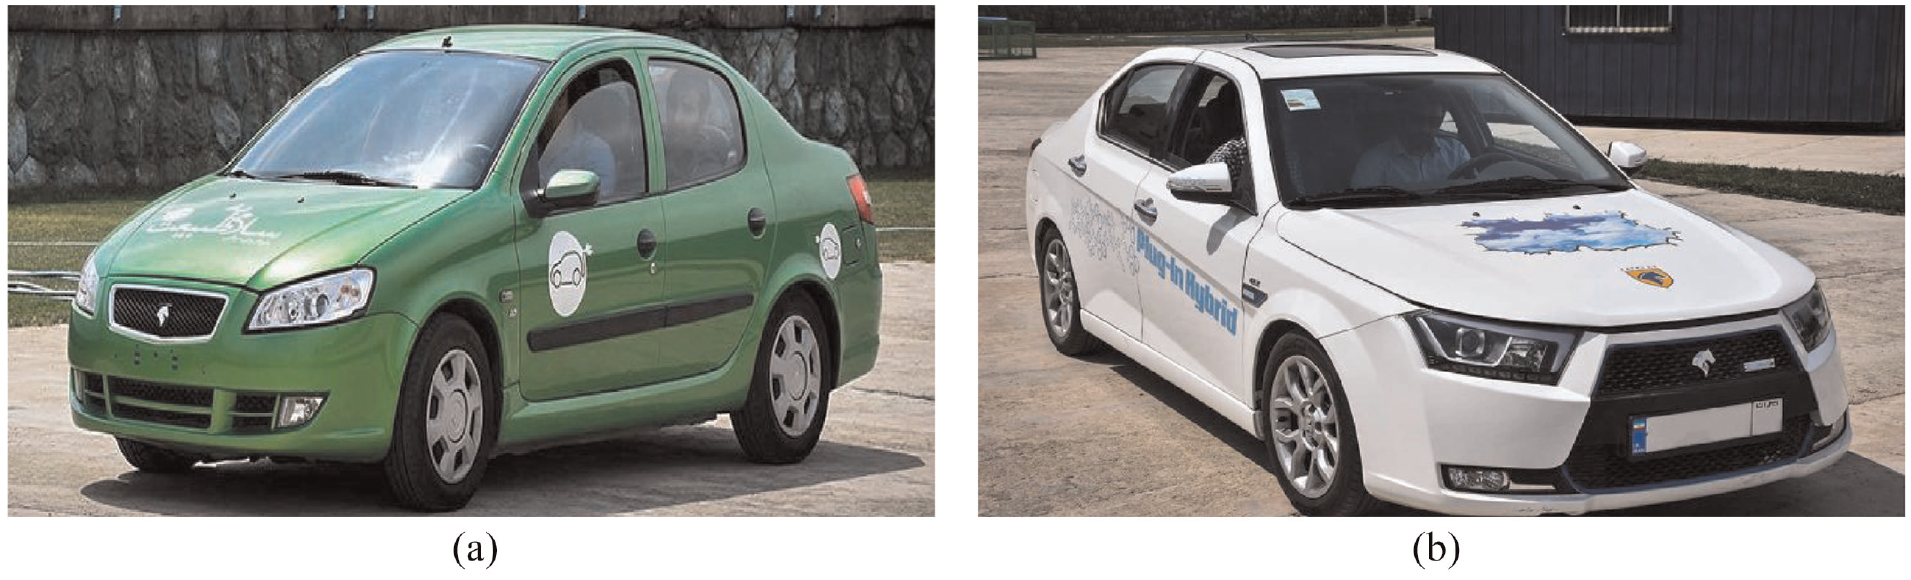
Hybrid electric vehicles in the present study: (a) Runna and (b) Dena.
The hybrid electric vehicles specifications.
Several test trips are defined to extract data from these vehicles. One of these test trips for the Runna vehicle is shown in Figure 3. As shown in this figure, different driving conditions, including traffic, highway, and slope conditions, are considered in this test trip. The combustion engine is set off during all tests to accurately measure the vehicle’s required power. The electric motor output power and instantaneous vehicle parameters are measured and recorded during test trips. Data transfer between vehicle modules such as VCU is fulfilled through the CAN 500 k network. Network output messages update every 10 ms or 100 ms regarding the importance of transferred data. ETAS/ES581.4 is the centric hardware between the vehicle VCU and computer to conduct the data acquisition. The vehicle temperature sensor is read by VCU also. After finishing the test trip and having the road path on Google Maps, the sea level altitude (or environmental pressure) is acquired via the Google Earth Pro app. Eight thousand data sets are, subsequently, extracted from different driving conditions –that is, different ambient and structural conditions of the vehicle- to have a reliable estimation by the ANN.
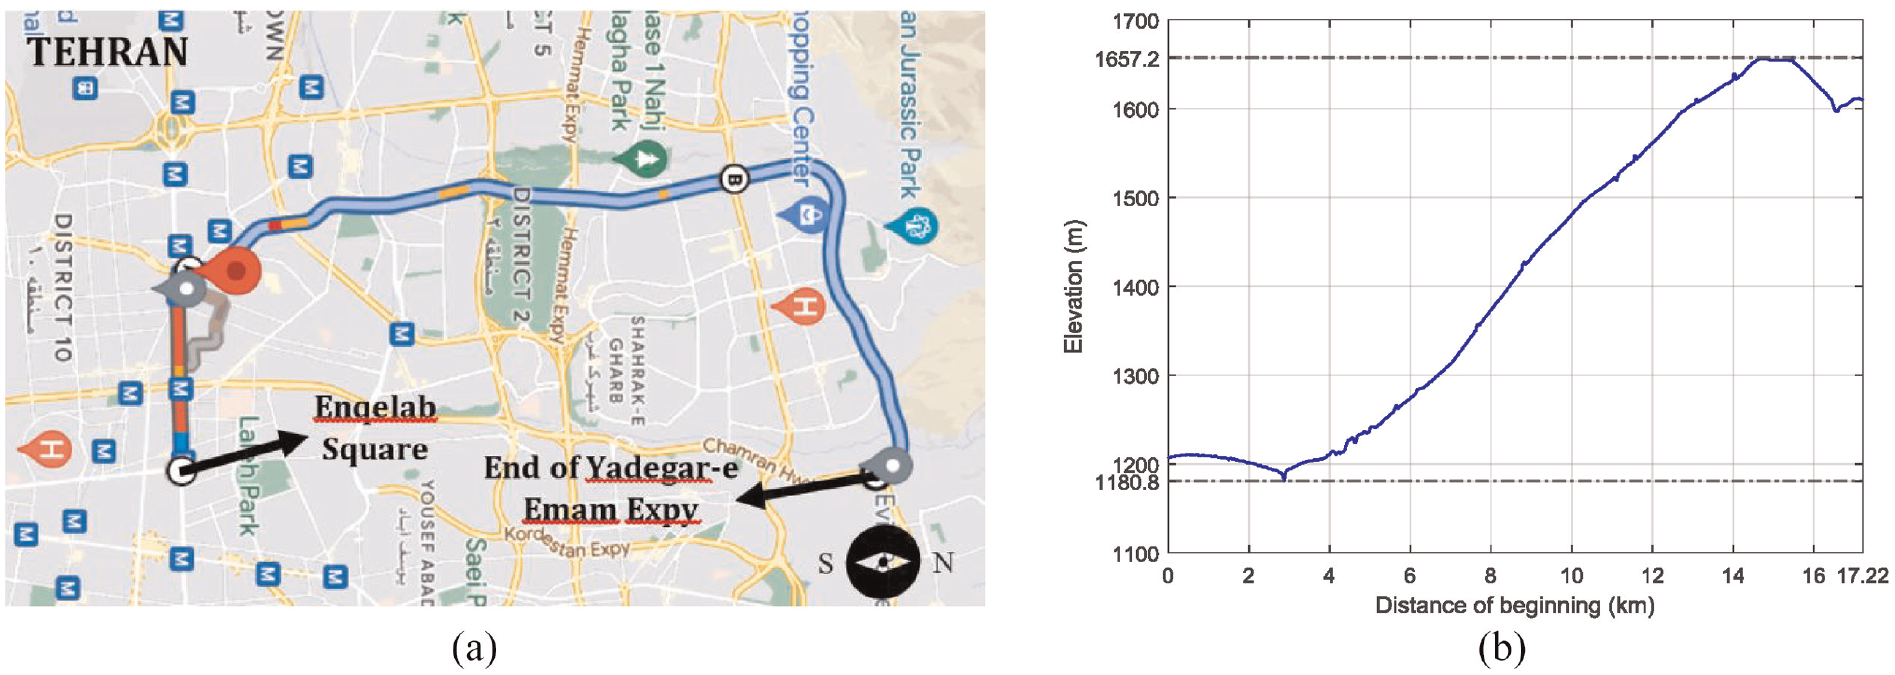
One of the test trips for the Runna vehicle: (a) test trip route in the Google map and (b) elevation from sea level during the test trip.
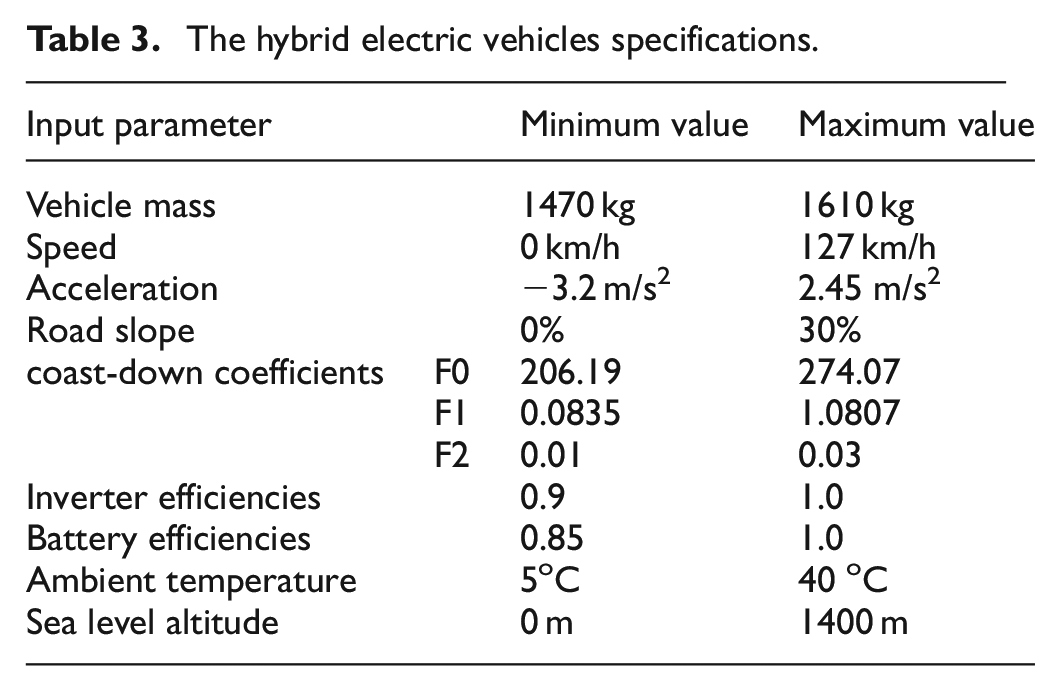
The ranges of different input parameters in the experimental test trips are demonstrated in Table 3. As shown in this table, efficiencies are more than 85%, and vehicle acceleration varies from −3.2 m/s2 to 2.45 m/s2.
The hybrid electric vehicles specifications.
Artificial neural network
The governing equation of the moving vehicle on the road is determined by equation (1),
5
where Pt is the instantaneous required power, Mv is the vehicle mass,
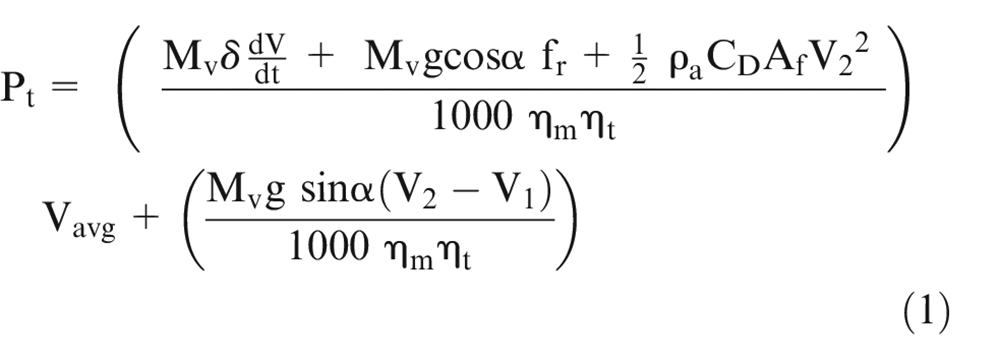
An artificial neural network is built on the experimental data of different test trips. Nine parameters are considered for the ANN input: vehicle mass, speed, acceleration, road slope, coast-down coefficients, inverter and battery efficiencies, and ambient conditions (including temperature and height). The instantaneous requested power of the vehicle is then calculated in the specified driving cycle by ANN. The schematic of ANN is shown in Figure 4.
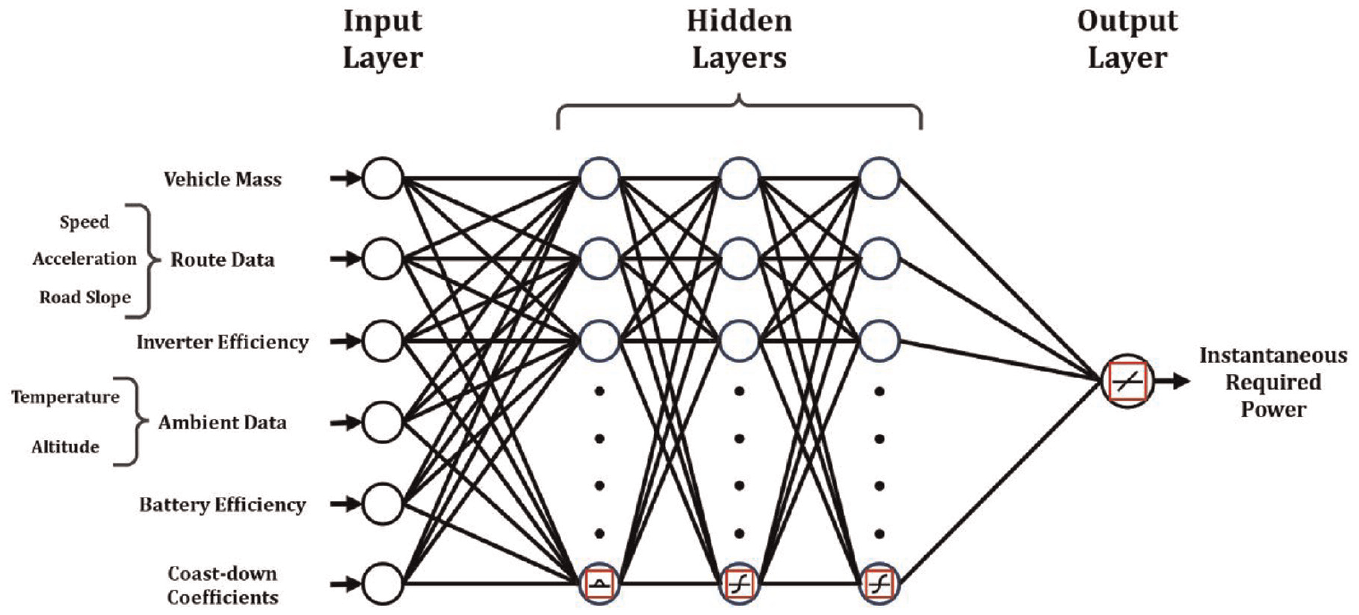
The general structure of the MLP.
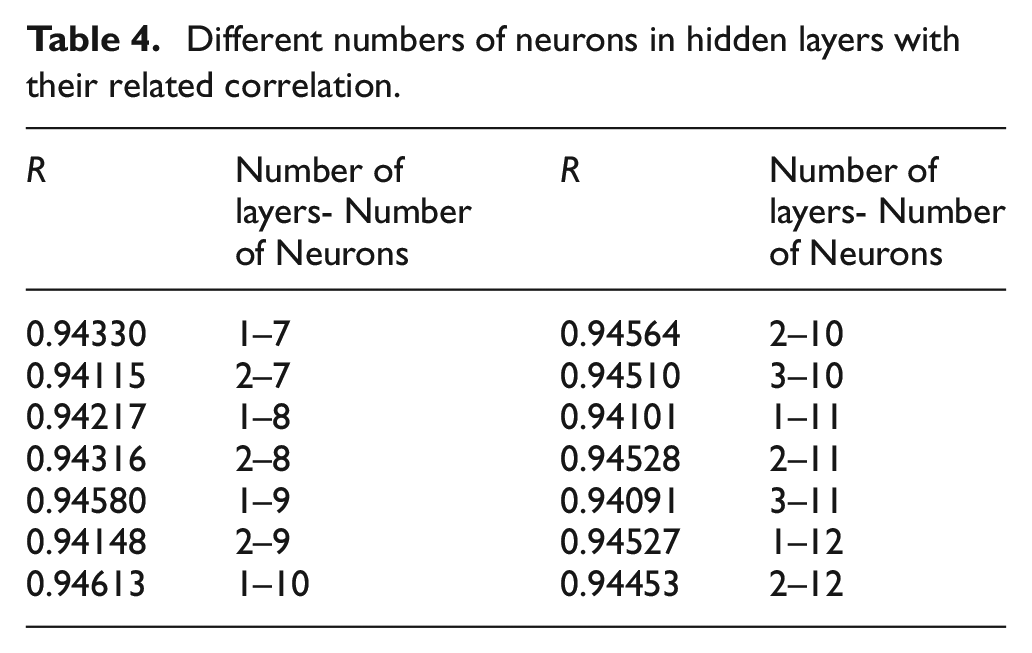
Multi-layer perception (MLP) is implemented in the present study to increase the robustness and repeatability of ANN. 32 Three layers, including the input, output, and hidden layers, are used in the presented ANN. The hidden layer can consist of one or multiple different layers. The effective parameters on the requested power are imported to the first layer, and the output layer calculates and classifies the required power. Different MLP models with a different number of neurons in hidden layers are examined to extract the best ANN model. The represented results of different ANN models are shown in Table 4. This table shows that the best architecture is extracted for the one hidden layer with 10 neurons.
Different numbers of neurons in hidden layers with their related correlation.
While the ANN can predict the vehicle power output in the range of trained input data very well, the larger(or smaller) HEV fleet outside of trained data(such as heavier HEVs) can be predicted by a combination of equation (1) and ANN. In this regard, the effect of parameters that are out of the trained data limit will be calculated by equation (1) and the other input data which are not considered in equation (1), would be predicted by ANN.
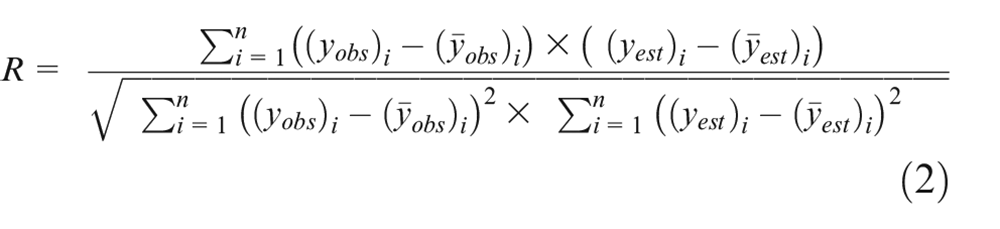
To check the prediction accuracy of ANN, certain numerical criteria are needed. Two specific numerical criteria of regression coefficient and root-mean-square error have been adopted in this study. The regression coefficient is the correlation between the estimated and actual values and is shown in equation (2), where n is the number of data,
The best network’s regression coefficient results are shown in Figure 5. As shown in this figure, the correlation coefficient for training, validation, and test data is 0.947, 0.95, and 0.93, respectively.
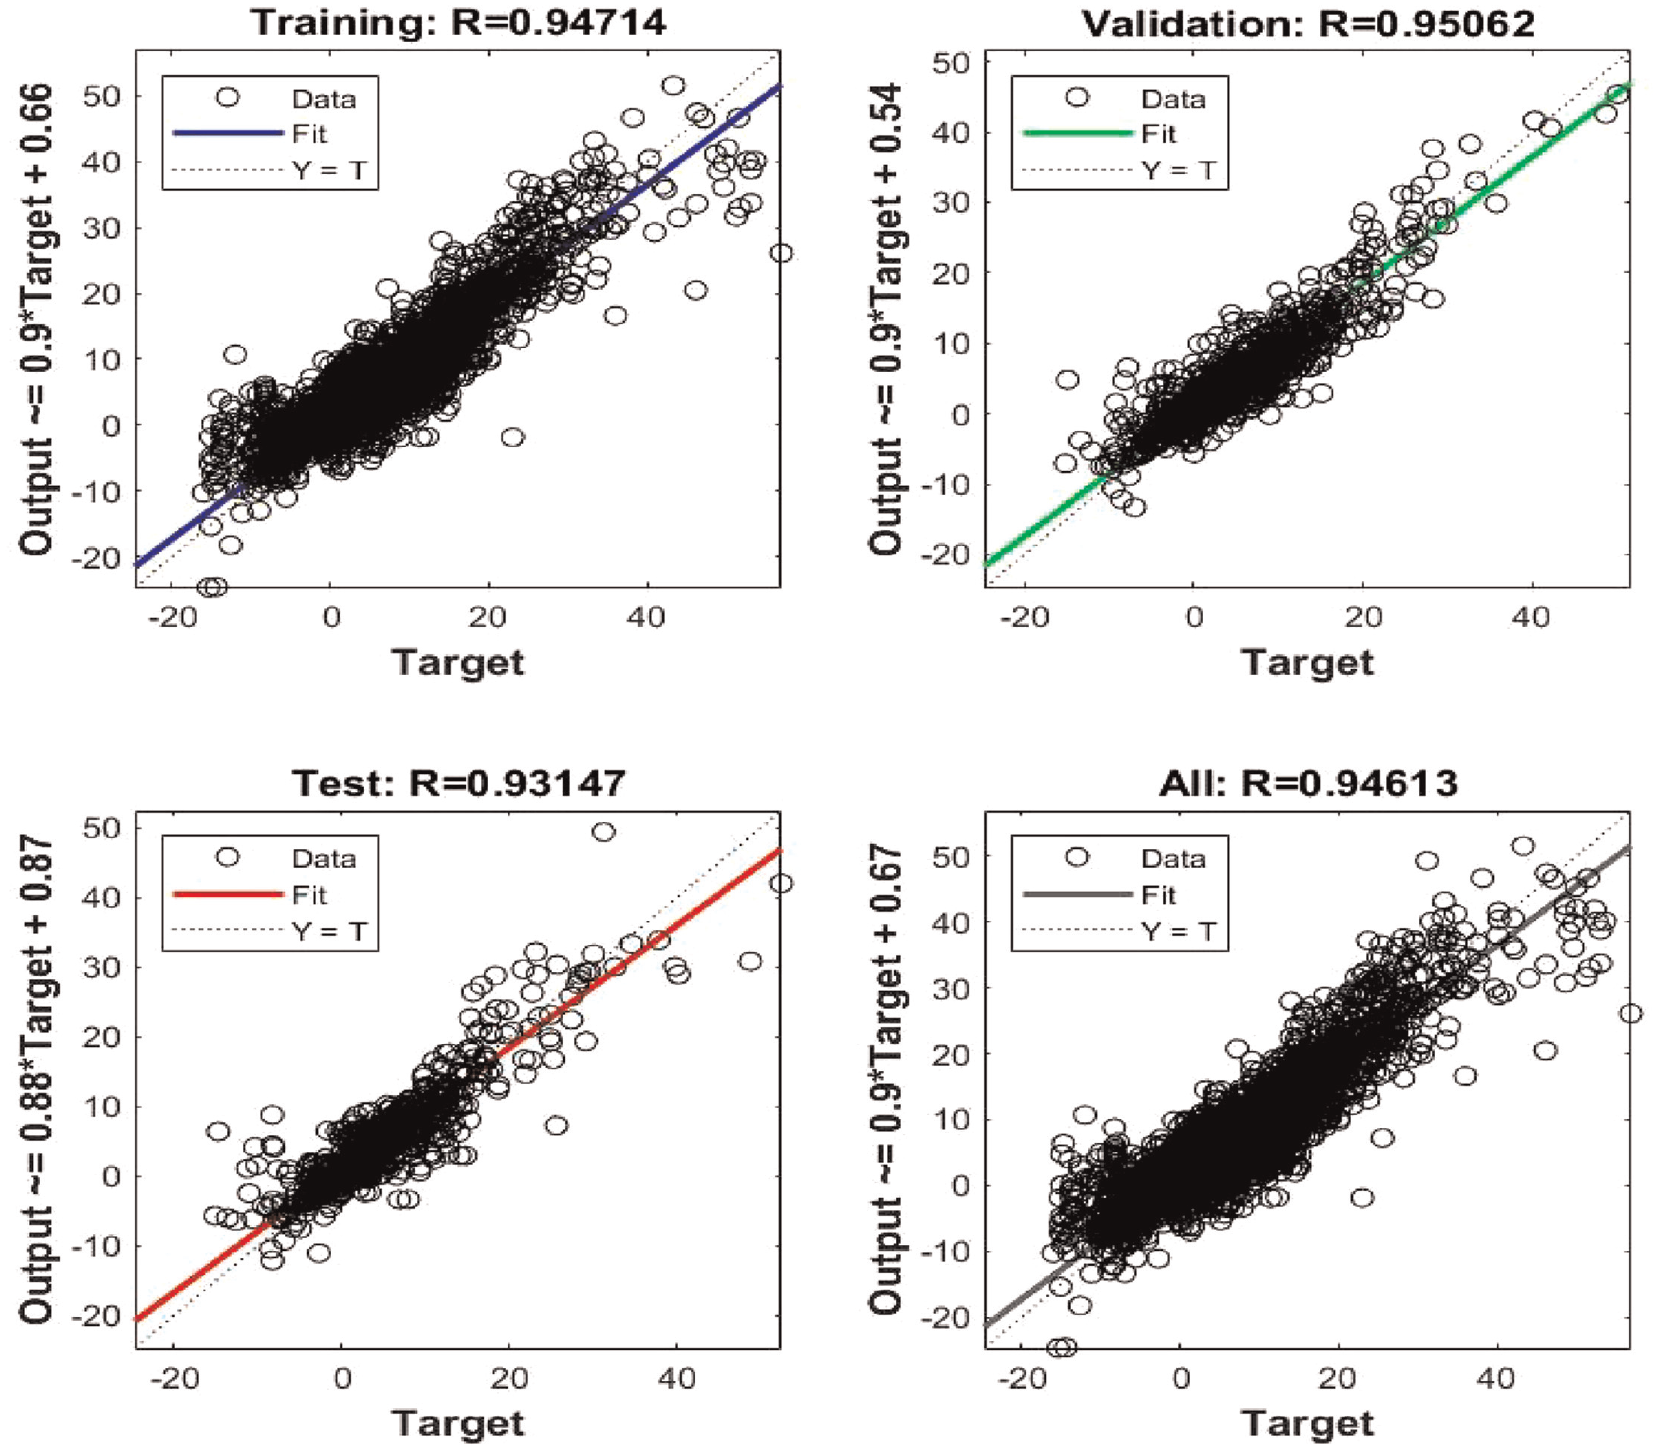
Regression coefficient of the best ANN for trained, validation, and test data.
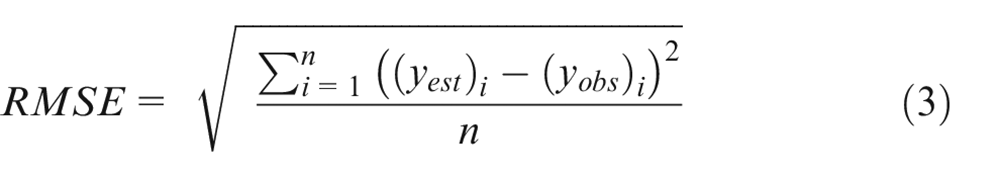
The root-mean-square error is shown in equation (3) and shows the average squared deviation of estimated values from the experimental ones. The small RMSE indicates a good prediction of ANN. As depicted in Figure 6, the value of the RMSE, in this research, is about 3.16, which shows a quite accurate estimation by the best ANN. The error has reached its best value after 50 epochs which emphasizes the high training rate of the presented network. This shows that all influential physical parameters that affect the vehicle output power have been considered in the ANN input.
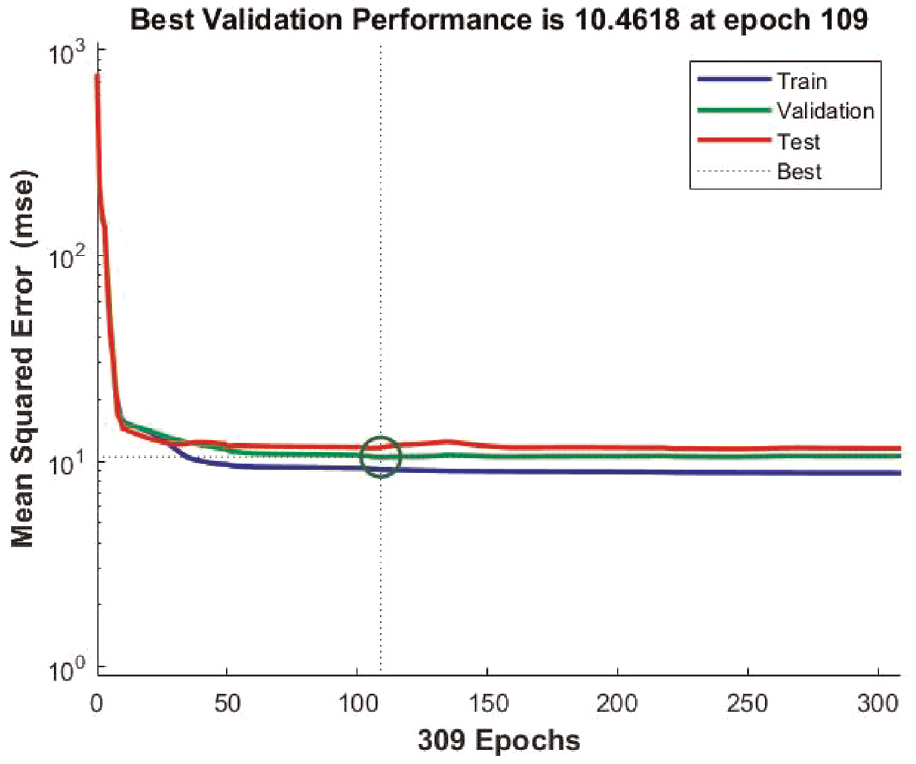
Mean-squared error plot of the best ANN.
Components sizing method
The anticipated requested power of the vehicle is decomposed to average and dynamic power according to Figure 7. As shown in this figure, the required instantaneous power can be divided into the average power supplied by the combustion engine/generator and the dynamic power provided by the high voltage battery. By the way, this point should be noted that the mentioned division is merely applicable for series hybrid configuration. The best combustion engine efficiency is related to the limited engine load and speeds. Therefore, the average power can be matched to the best combustion engine efficiency zone. Thus, fuel consumption can be improved via this decomposition. Meanwhile, the power fluctuations recognized by dynamic power are supplied by the high-voltage battery. The high-voltage battery is charged during positive dynamic powers and is discharged during negative ones. In other words, the high-voltage battery is implemented in the present configuration as the energy reservoir. As most of the required power is supplied by the combustion engine and electric generator directly, the conversion efficiencies of electric power from the electric generator to the battery and from the battery to the electric motor are bypassed. Therefore, total energy consumption is optimized in this configuration because AC/DC conversion efficiency would not waste energy. 32
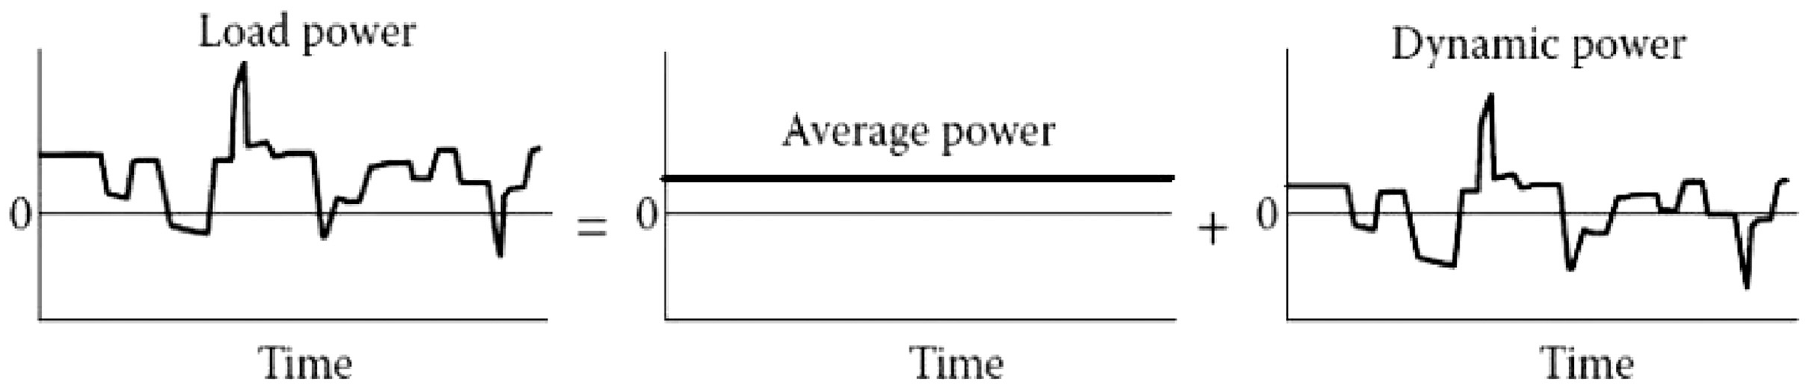
The requested power of the vehicle and its decomposition to average and dynamic power. 5
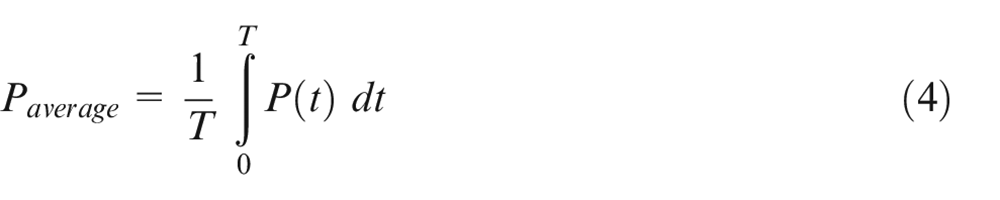
The combustion engine size is calculated by averaging the instantaneous requested power in the driving cycles as equation (4). P(t) is the instantaneous required power of the vehicle integrated from time 0 to T in this equation.
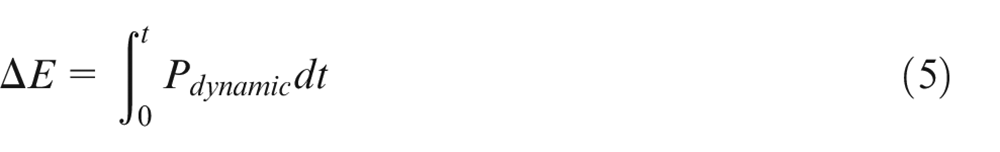
The instantaneous dynamic power integration is also calculated from the start of the driving cycle to each time, to determine the high-voltage battery size. This integration is shown in equation (5). The maximum amount of
Notably, the maximum requested power of the vehicle is assigned as the electric motor’s instantaneous power.
Results & discussion
In the present work, a thorough study has been accomplished to predict the combustion engine size, high voltage battery size, maximum and continuous required power of the electric motor in different driving conditions for a series hybrid electric vehicle. The components sizing is performed for all standard driving cycles, including New European Driving Cycle (NEDC), Worldwide harmonized Light-duty vehicles Test Cycle (WLTC), EPA Federal Test Procedure (FTP-75), Tehran driving cycle, 35 and Highway Fuel Economy Test (HWFET). Notably, a non-standard suburban driving route is also used to investigate all driving conditions comprehensively. This route is related to the connection road of two important Iranian megacities and is shown in Figure 8. This figure shows that this route is about 4 h of driving in 440 km. The average power, accumulative dynamic power, and instantaneous peak power in each driving cycle are recognized as the combustion engine power, 80% of battery size, and maximum required power of the electric motor, respectively. Most battery management systems limit battery usage to the extent of 20% of battery state of charge(SOC). Thus, the battery should have more energy capacity(1/0.8 of accumulative dynamic power) to absorb or release sufficient dynamic power without any conflict with the battery management system. 36 The present study focuses on the series HEV in which only the electric motor is connected to the wheels of the vehicle. Therefore, an e-motor has to have sufficient nominal power to be able to provide even the maximum instantaneous requested power. Due to the different calculated sizes for each component in different cycles, the maximum is assigned as the final size of the mentioned component.
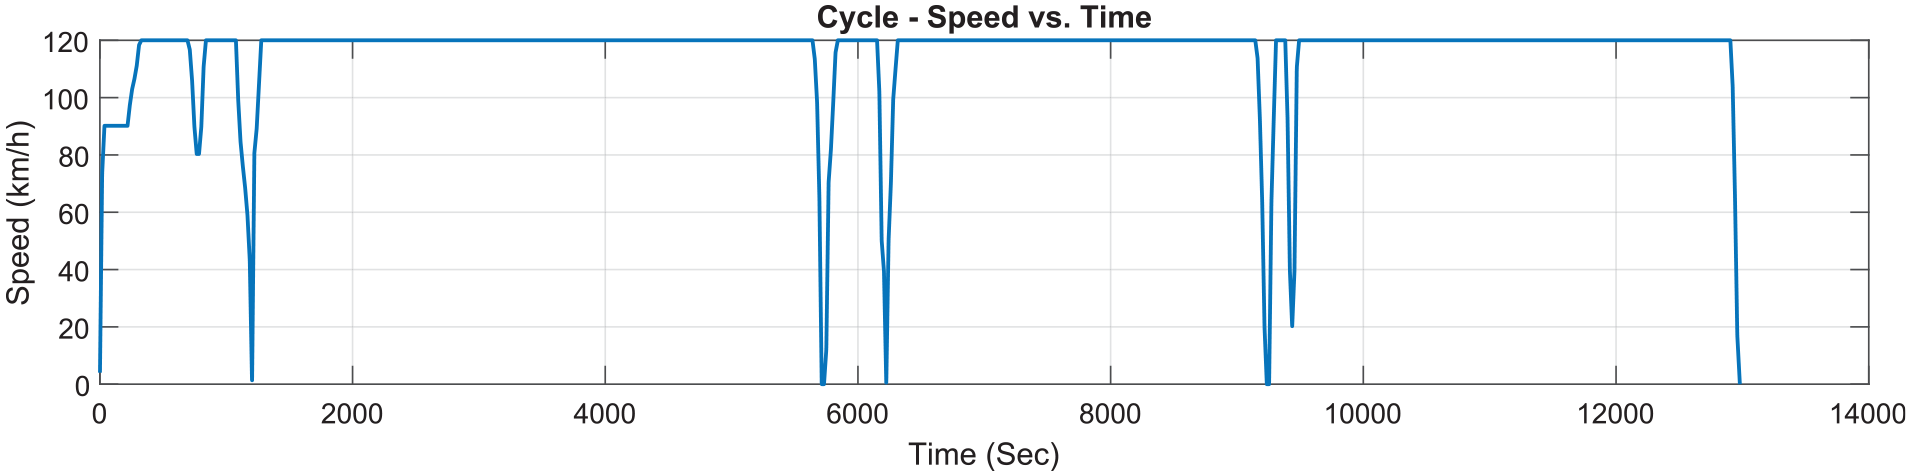
The demonstration of the speed-time relation of the non-standard driving route of Isfahan-Tehran.
The artificial neural network prediction is affected by the training data. The ANN can predict the vehicle output power very well when the input data is located within the training data range. To check the experimental data’s comprehensiveness, the electric motor’s working points in the experiments and standard driving cycles are illustrated in Figure 9. As seen in this figure, the experimental data appropriately covers the engine map. Notably, these two data clusters (experiments and standard cycles) coincide on the speed-torque map of the electric motor. This emphasizes that the predicted vehicle powers in the present study are reliable.
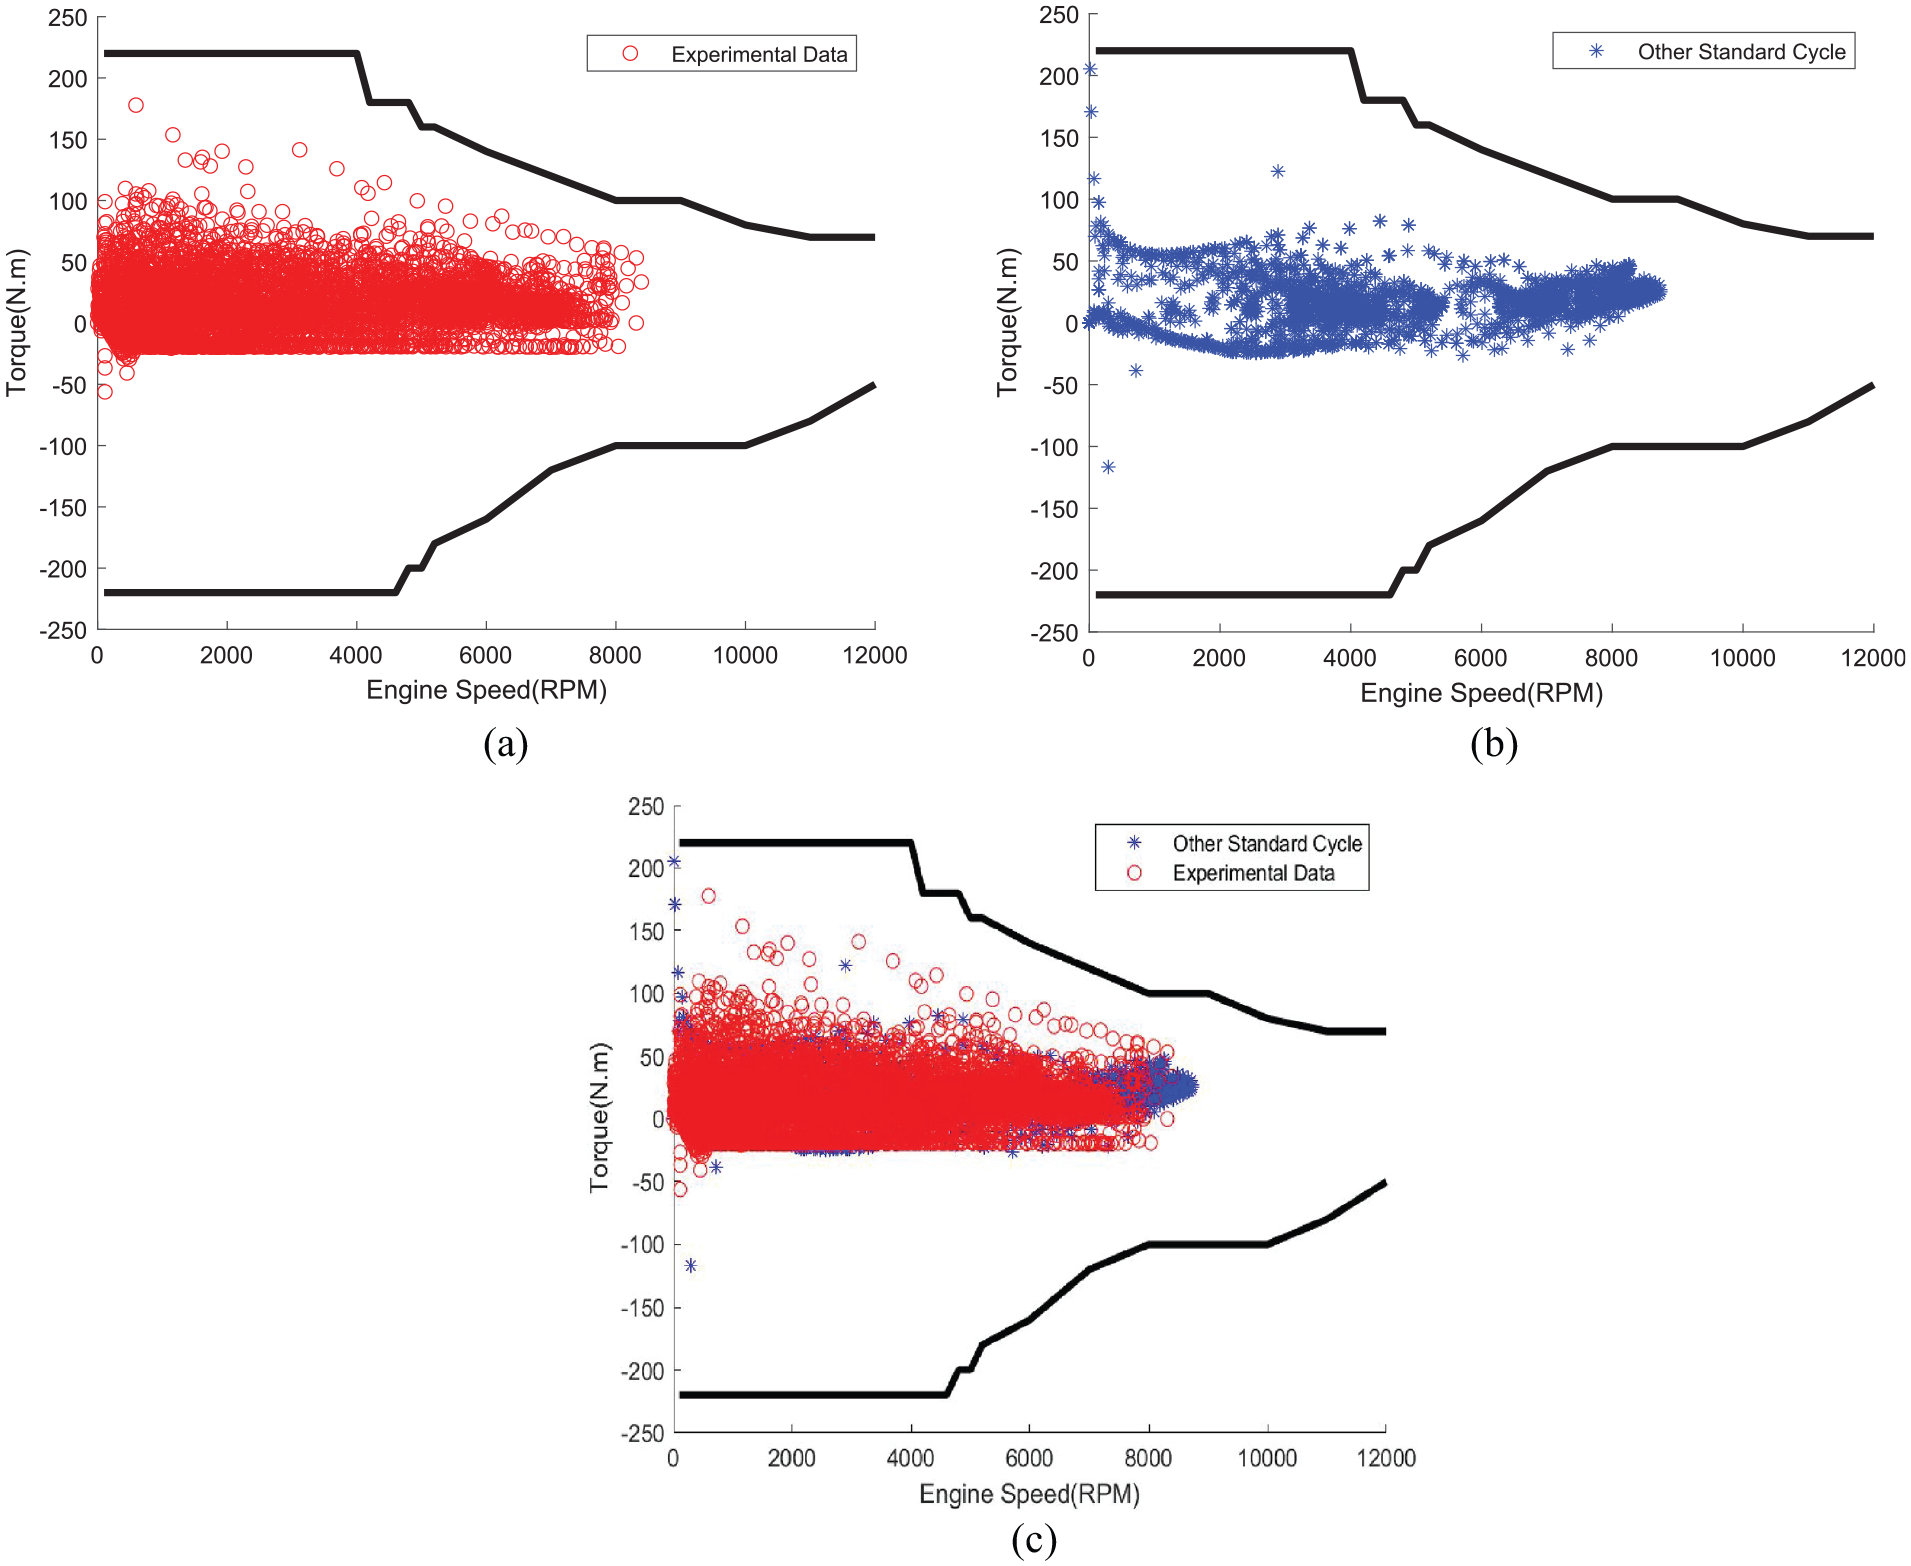
The working points of the electric motor in the Motor speed (RPM)-Torque (N.m) diagram for: (a) experimental and (b) standard cycles, and (c) combined plot.
The effects of temperature, sea-level altitude, and the structural conditions of the vehicle, such as inverter efficiency, battery efficiency, and coast-down coefficients, on the vehicle components sizes, are also investigated. In the following, the independent impact of each input parameter will be investigated originating from temperature. It is worth mentioning that the following data outcomes in each point are derived from eight times of running the ANN and then putting into the post-processing algorithms associated with calculating the ICE power, battery size, and e-motor power.
Temperature impact
The temperature variations affect the air density; consequently, air resistance and friction on the vehicle are changed. Figure 10 depicts the effect of temperature on the design values of a hypothetical series HEV having 1500 kg weight, 90% efficiency for its battery and inverter, and coast-down coefficients of f0 = 240.13, f1 = 0.5821, and f2 = 0.0241 while using the electric motor Brusa HSM1 at sea level.
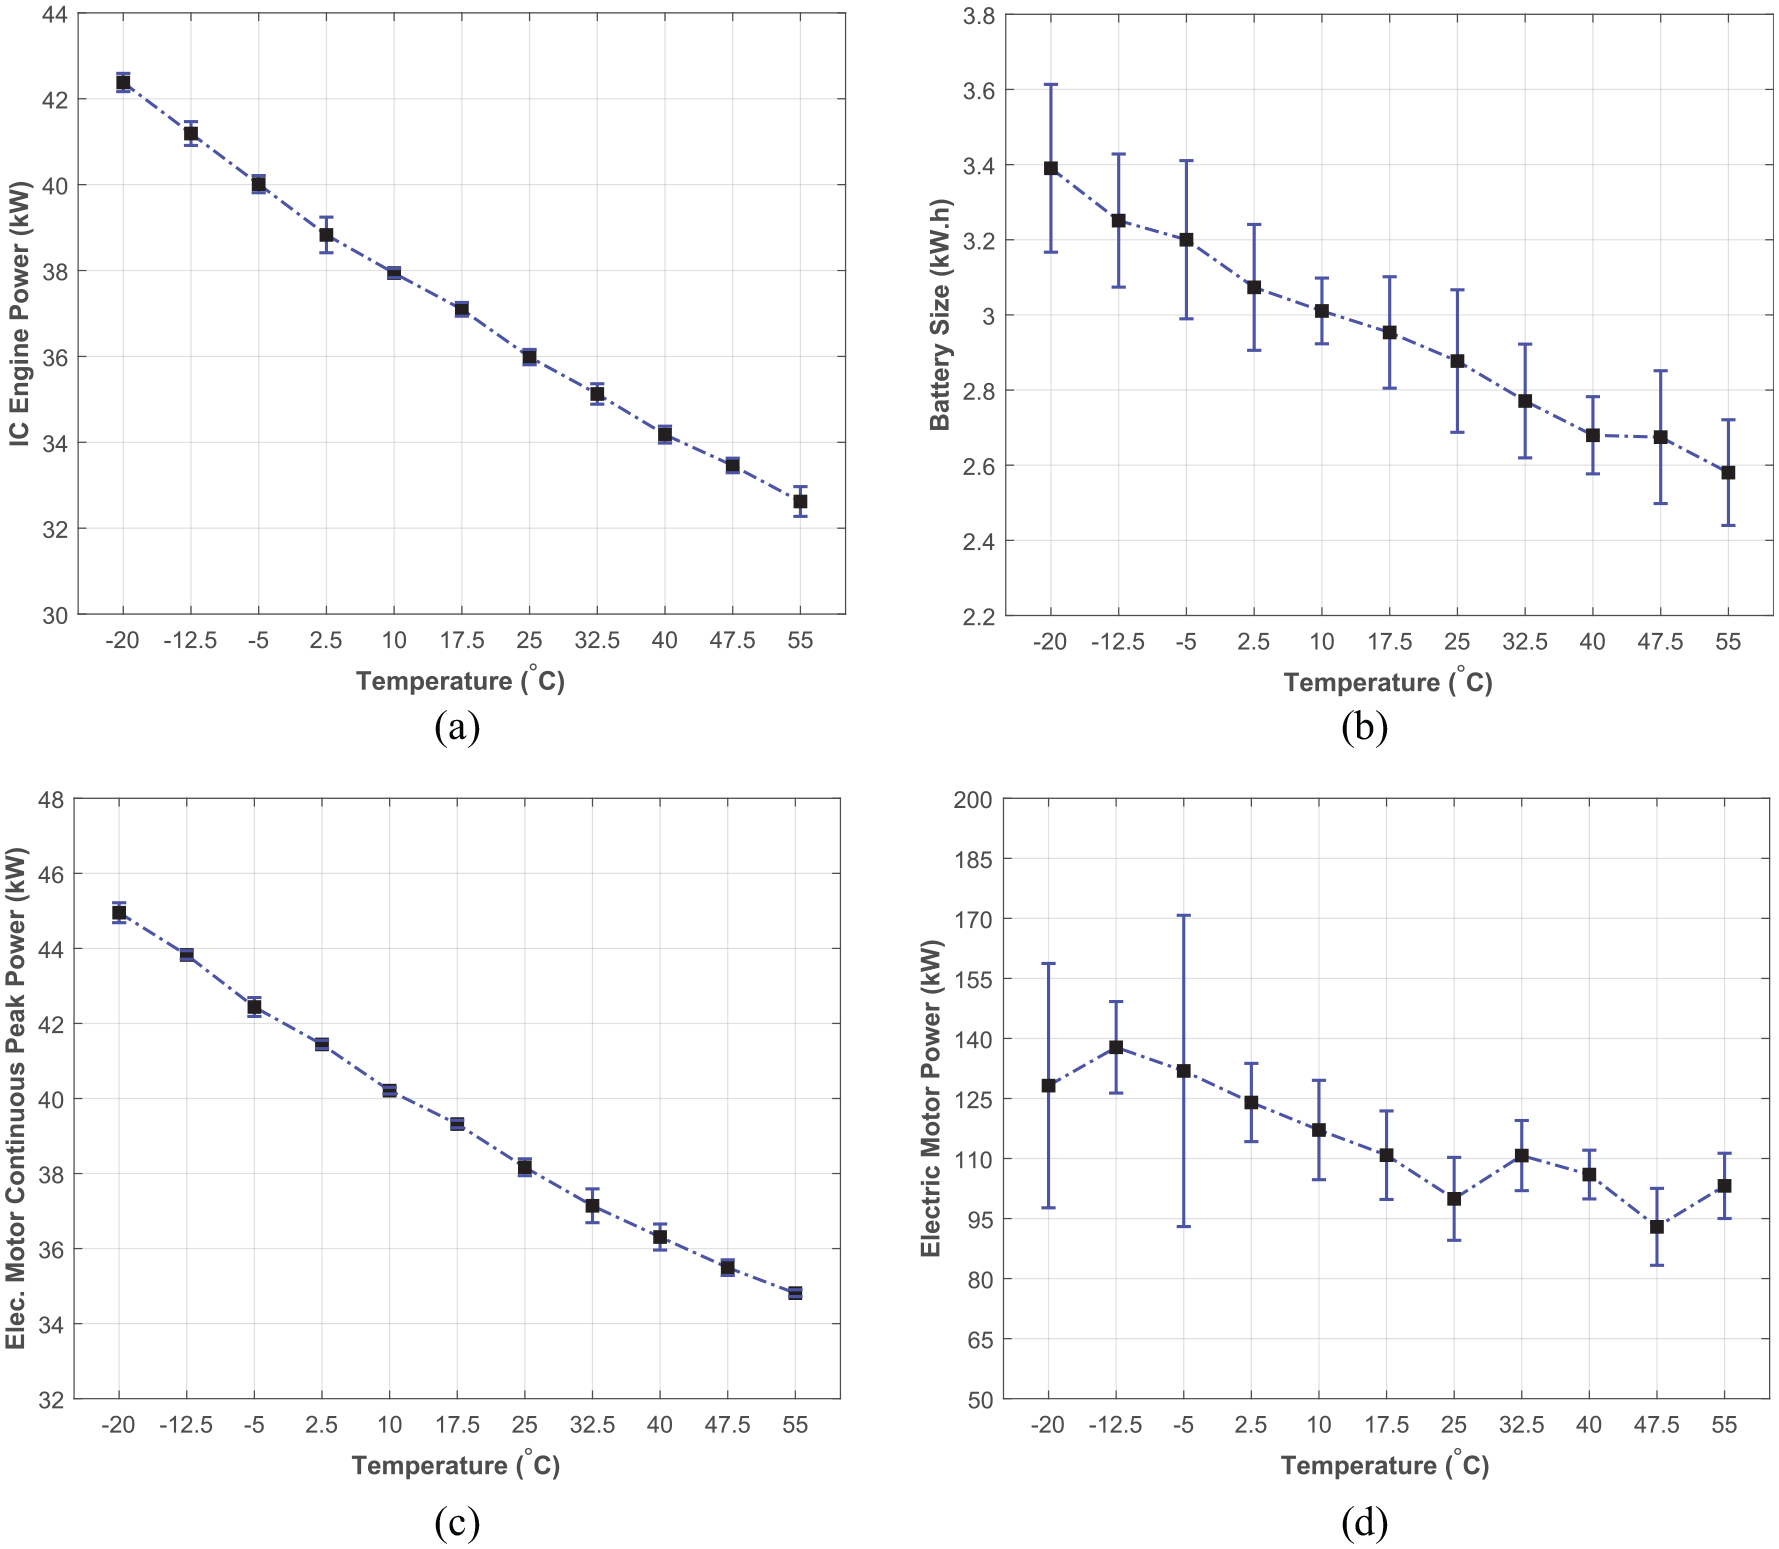
The impact of temperature on: (a) IC engine power, (b) high voltage battery size, (c) electric motor continuous peak power, and (d) electric motor maximum power.
As can be observed, combustion engine power, high voltage battery size, and continuous peak power of electric motor are strictly descending with the increase in air temperature and are laid between 32.62 and 42.38 kW, 2.58 and 3.39 kW/h, and 34.81and 44.95 kW, respectively. A fairly descending trend is also observed in electric motor power sitting between 92.93 and 137.79 kW. However, the plot fluctuations show that the temperature changes will not affect this parameter. As the air temperature increases, the air density decreases. Therefore, the air friction is decreased, and the required output power is changed. This leads to descending trend in the design components. Electric motor power is related to the maximum instantaneous required power of the vehicle; meanwhile, the continuous peak power is related to at least 10 s of continuous required power of the vehicle. Therefore, the electric motor power is assigned by rapid acceleration, and the suburban driving condition determines continuous peak power. In this way, the electric motor power is not highly affected by air density (due to its little effect on the rapid acceleration). In other words, the aerodynamic resistance is highlighted in high vehicle velocities and can be neglected in low-speed conditions.
Sea level altitude impact
Upon modeling the sea level altitude, the change of air density in terms of the altitude from the sea level is studied. The associated results are presented in Figure 11. The hypothetical series HEV has the exact specifications as that of in temperature impact section, put into the temperature of 15°C while the sea level altitude varies from 0 to 2000 m.
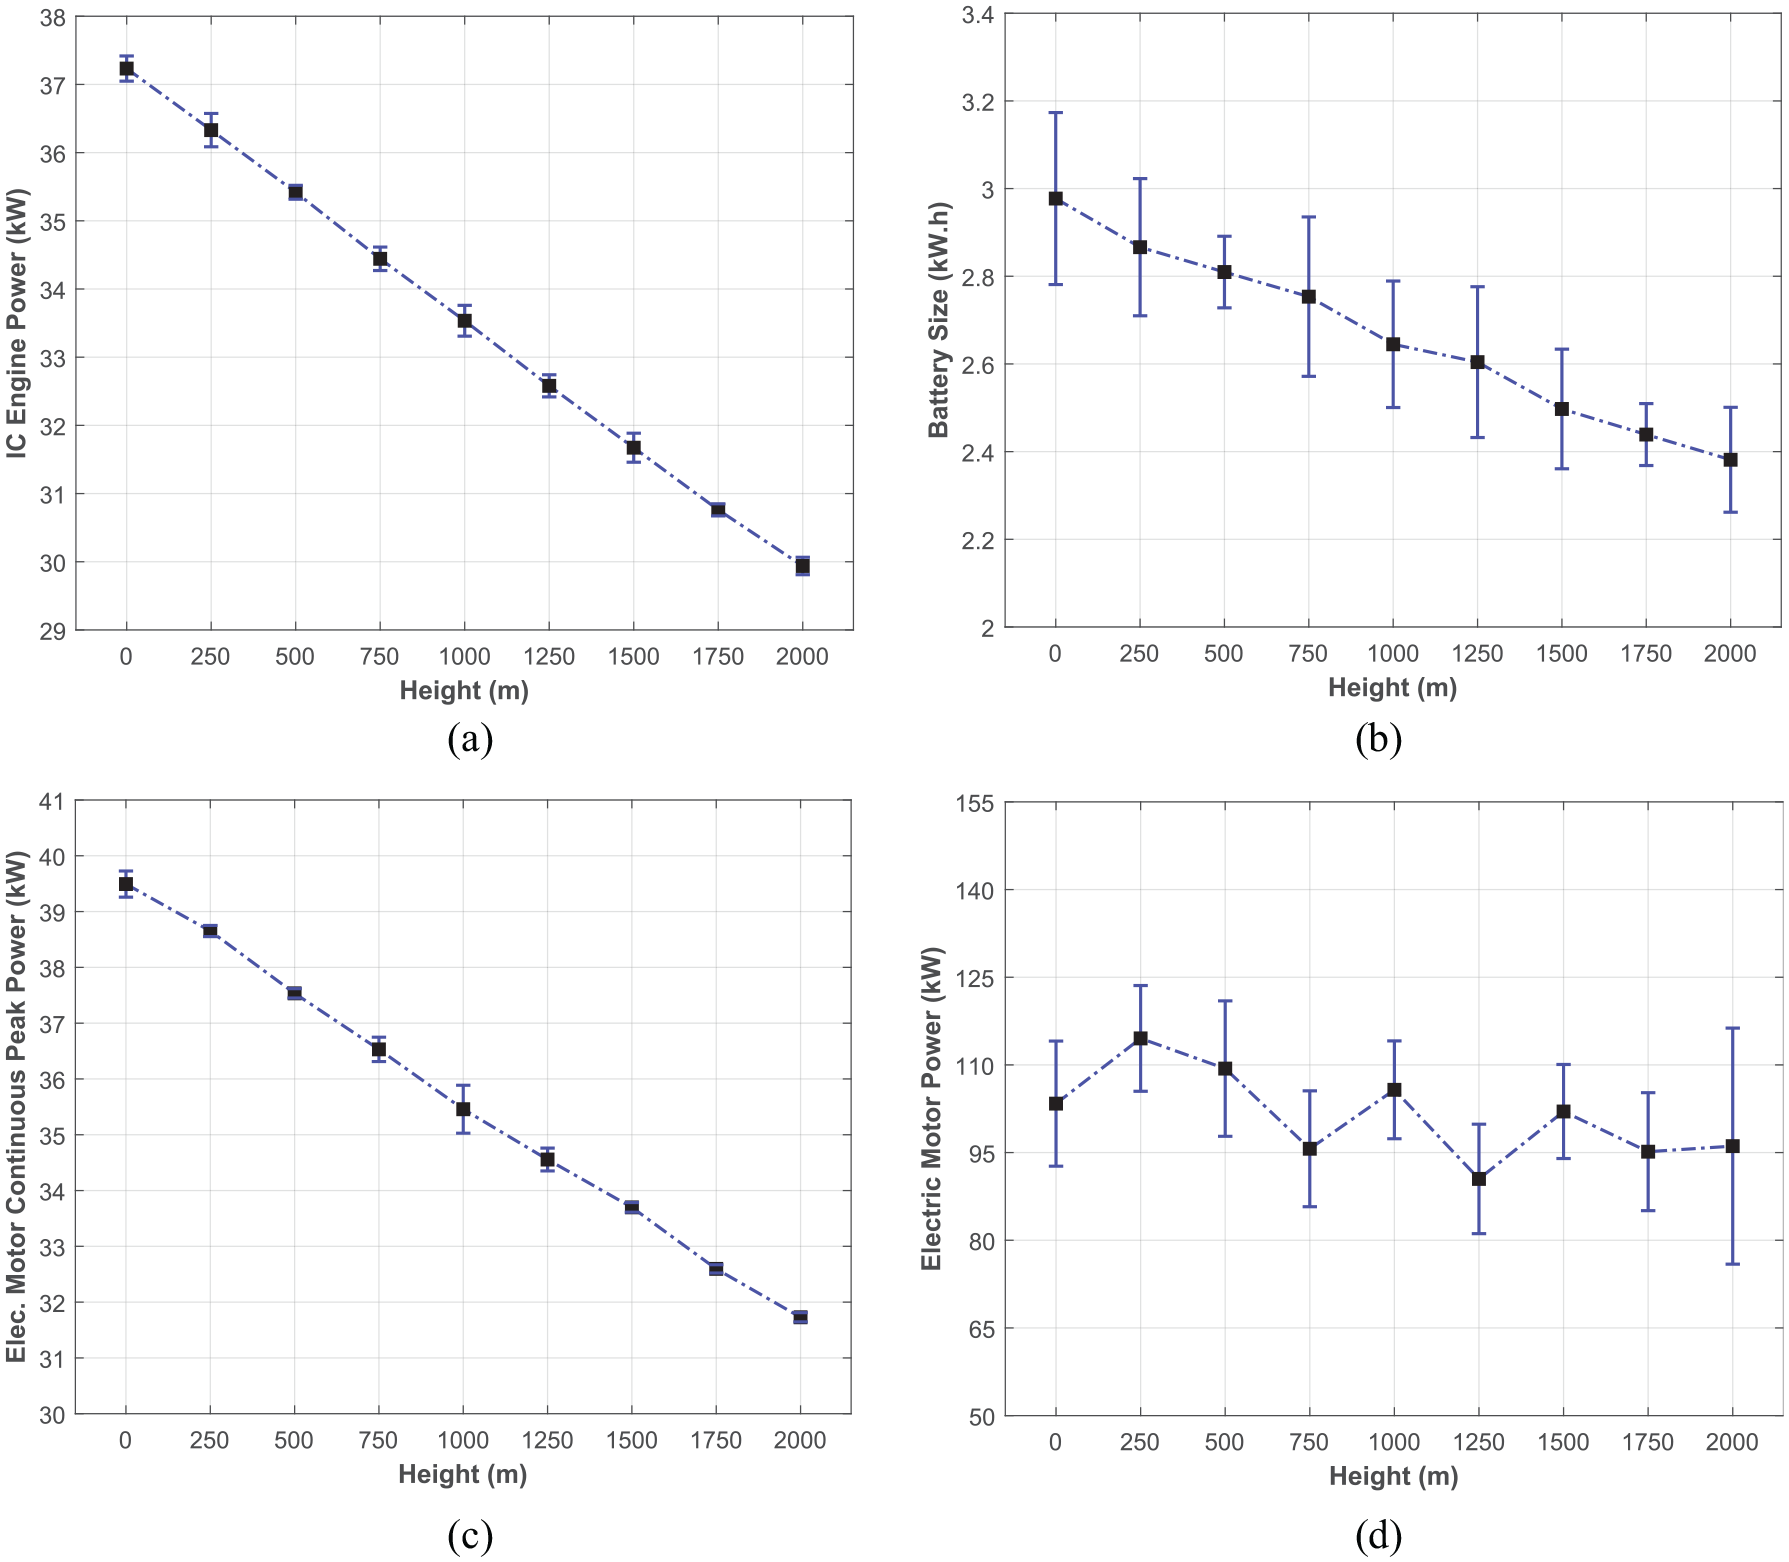
The impact of sea level altitude on: (a) IC engine power, (b) high voltage battery size, (c) electric motor continuous peak power, and (d) electric motor maximum power.
As shown in this figure, the descending trend in component sizing with respect to height is similar to the temperature variations. The combustion engine power lay between 29.94 and 37.23 kW, the high voltage battery size is between 2.38 and 2.98 kW/h, and the electric motor’s continuous peak power is between 31.73 and 39.49 kW with variations in altitude. Notably, the electric motor power does not change considerably with the altitude variations due to its low dependency on air density.
Inverter efficiency impact
Inverter efficiency is expected to impose effects merely on battery size due to the ineffectiveness of an electrical circuit. To examine the impact of this part, the same structural features as in previous sections are established. The vehicle weight of 1500 kg, the battery efficiency of 90%, sea-level static conditions, coast-down coefficients of the same as in temperature impact section, inverter efficiency varies from 70% to 95%, while using Brusa HSM1 as the electric motor is appointed. Figure 12 demonstrates the results. As expected, the inverter efficiency does not considerably affect combustion engine or electric motor sizes. The inverter converts direct current (DC) to alternating current (AC). Therefore, only the high voltage battery is affected by the inverter efficiency variations.
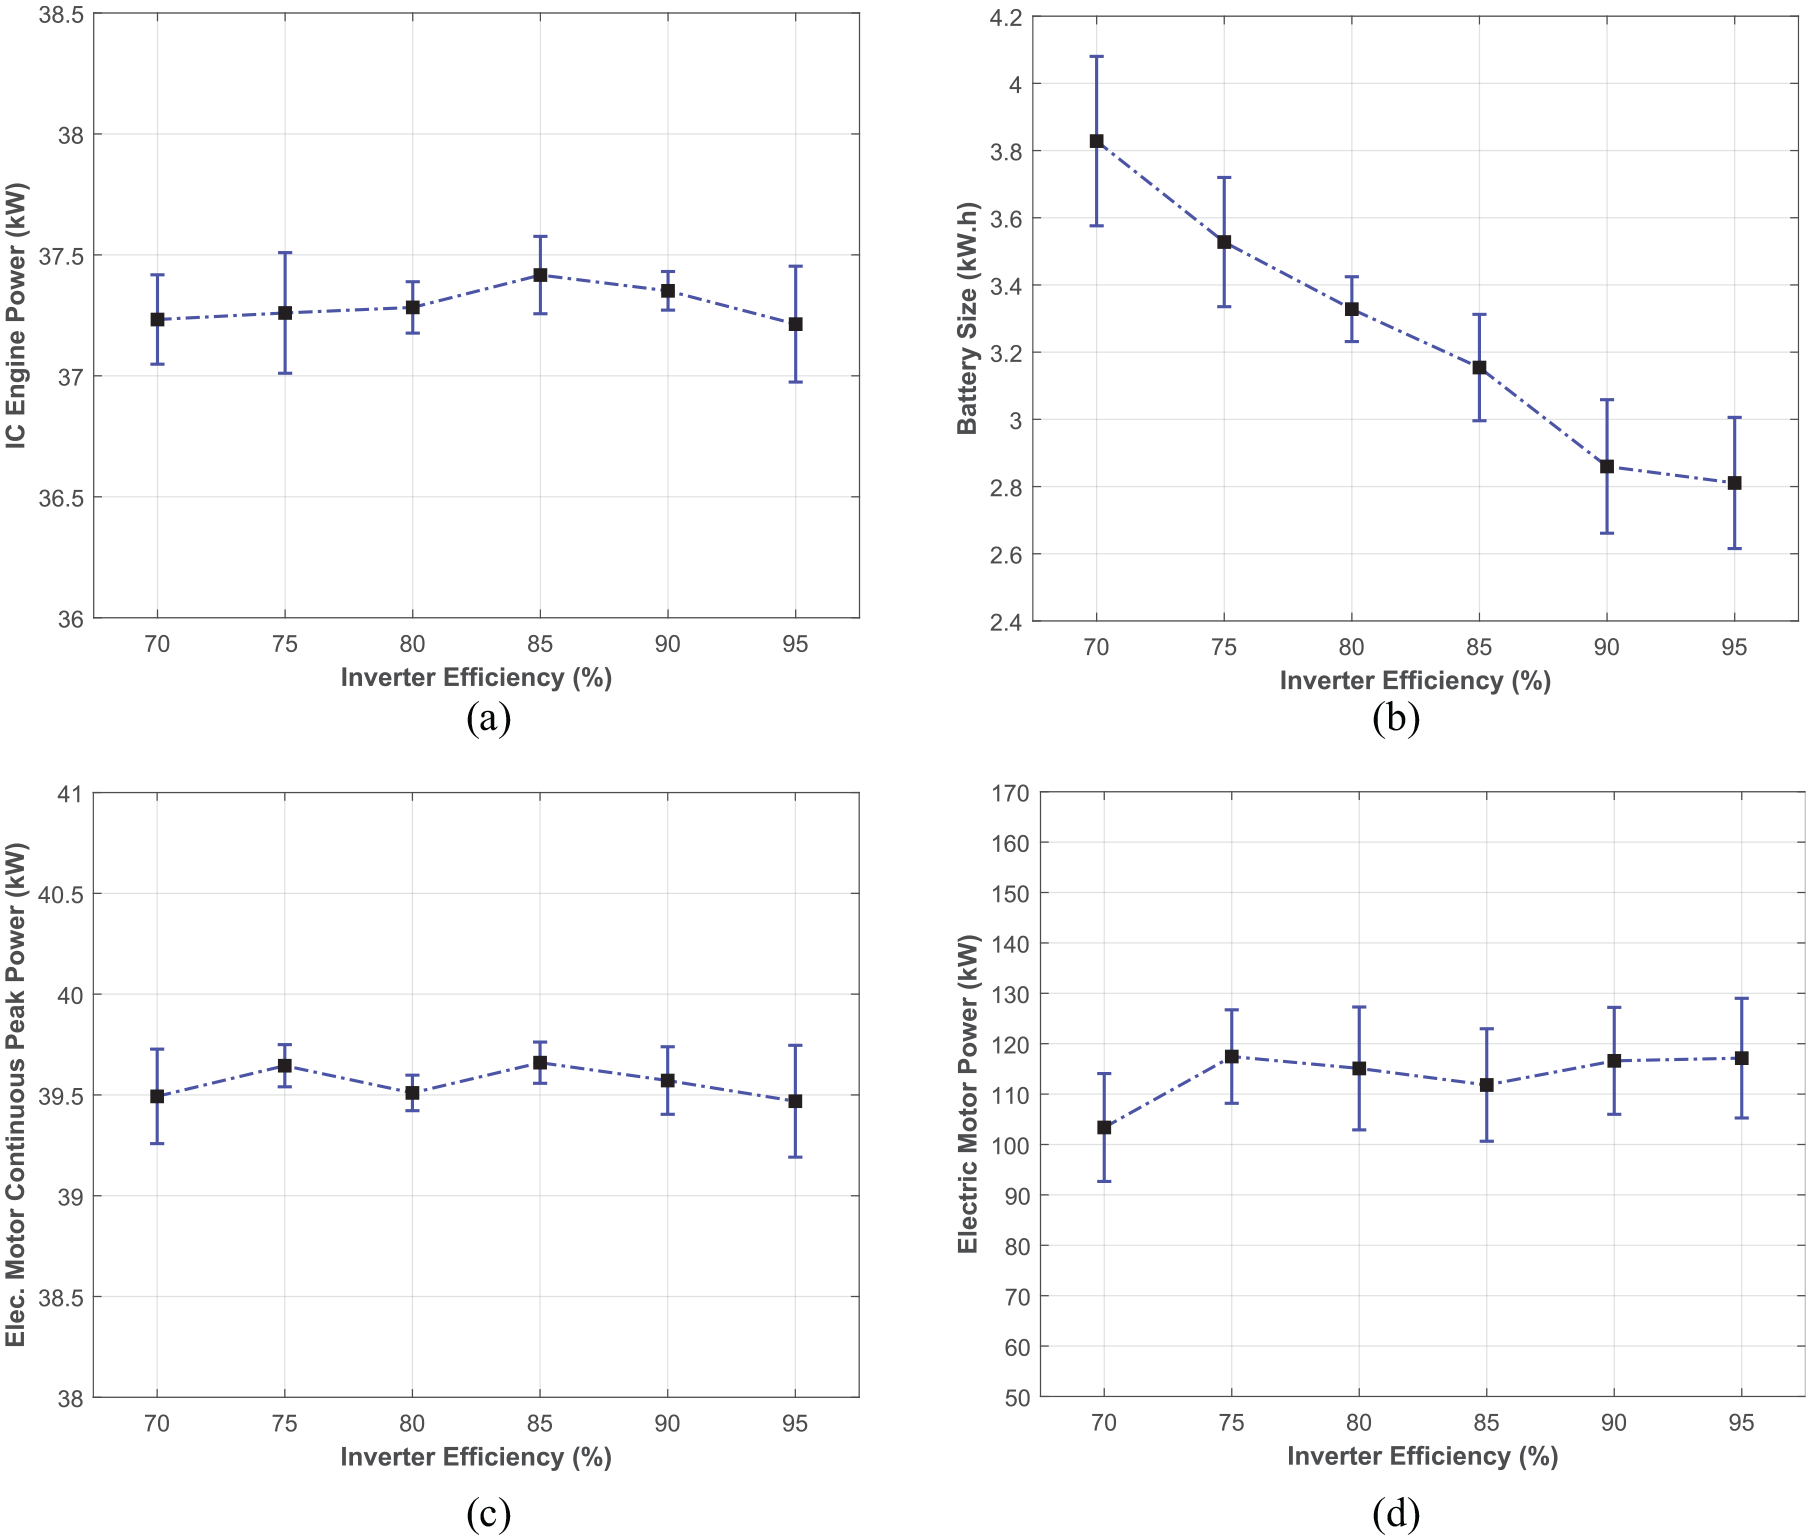
The impact of inverter efficiency on: (a) IC engine power, (b) high voltage battery size, (c) electric motor continuous peak power, and (d) electric motor maximum power.
IC engine power is moving within the very thin scope of 37.21 and 37.42 kW. Electric motor continuous peak power is also oscillating about a small neighborhood of 39.5 kW (39.47–39.66 kW); eventually, electric motor power covers a narrow range of 103.38–117.45 kW. These inert orientations imply that inverter efficiency is not a significant game-changer for the three mentioned components. Nevertheless, Figure 12(b) shows a transparent downfall from 3.83 to 2.81 kW/h for battery size in terms of inverter efficiency and gradually dims the need for a large battery.
Battery efficiency impact
Modeling the battery efficiency impact has been pretty analogous to that of inverter efficiency in terms of impact direction, which is very majorly on battery size. This input parameter is independently investigated by changing from 70% to 95% for a series HEV with the same features and ambient conditions as in inverter efficiency impact section except for inverter efficiency that is fixed at 90%. The results are shown in Figure 13.
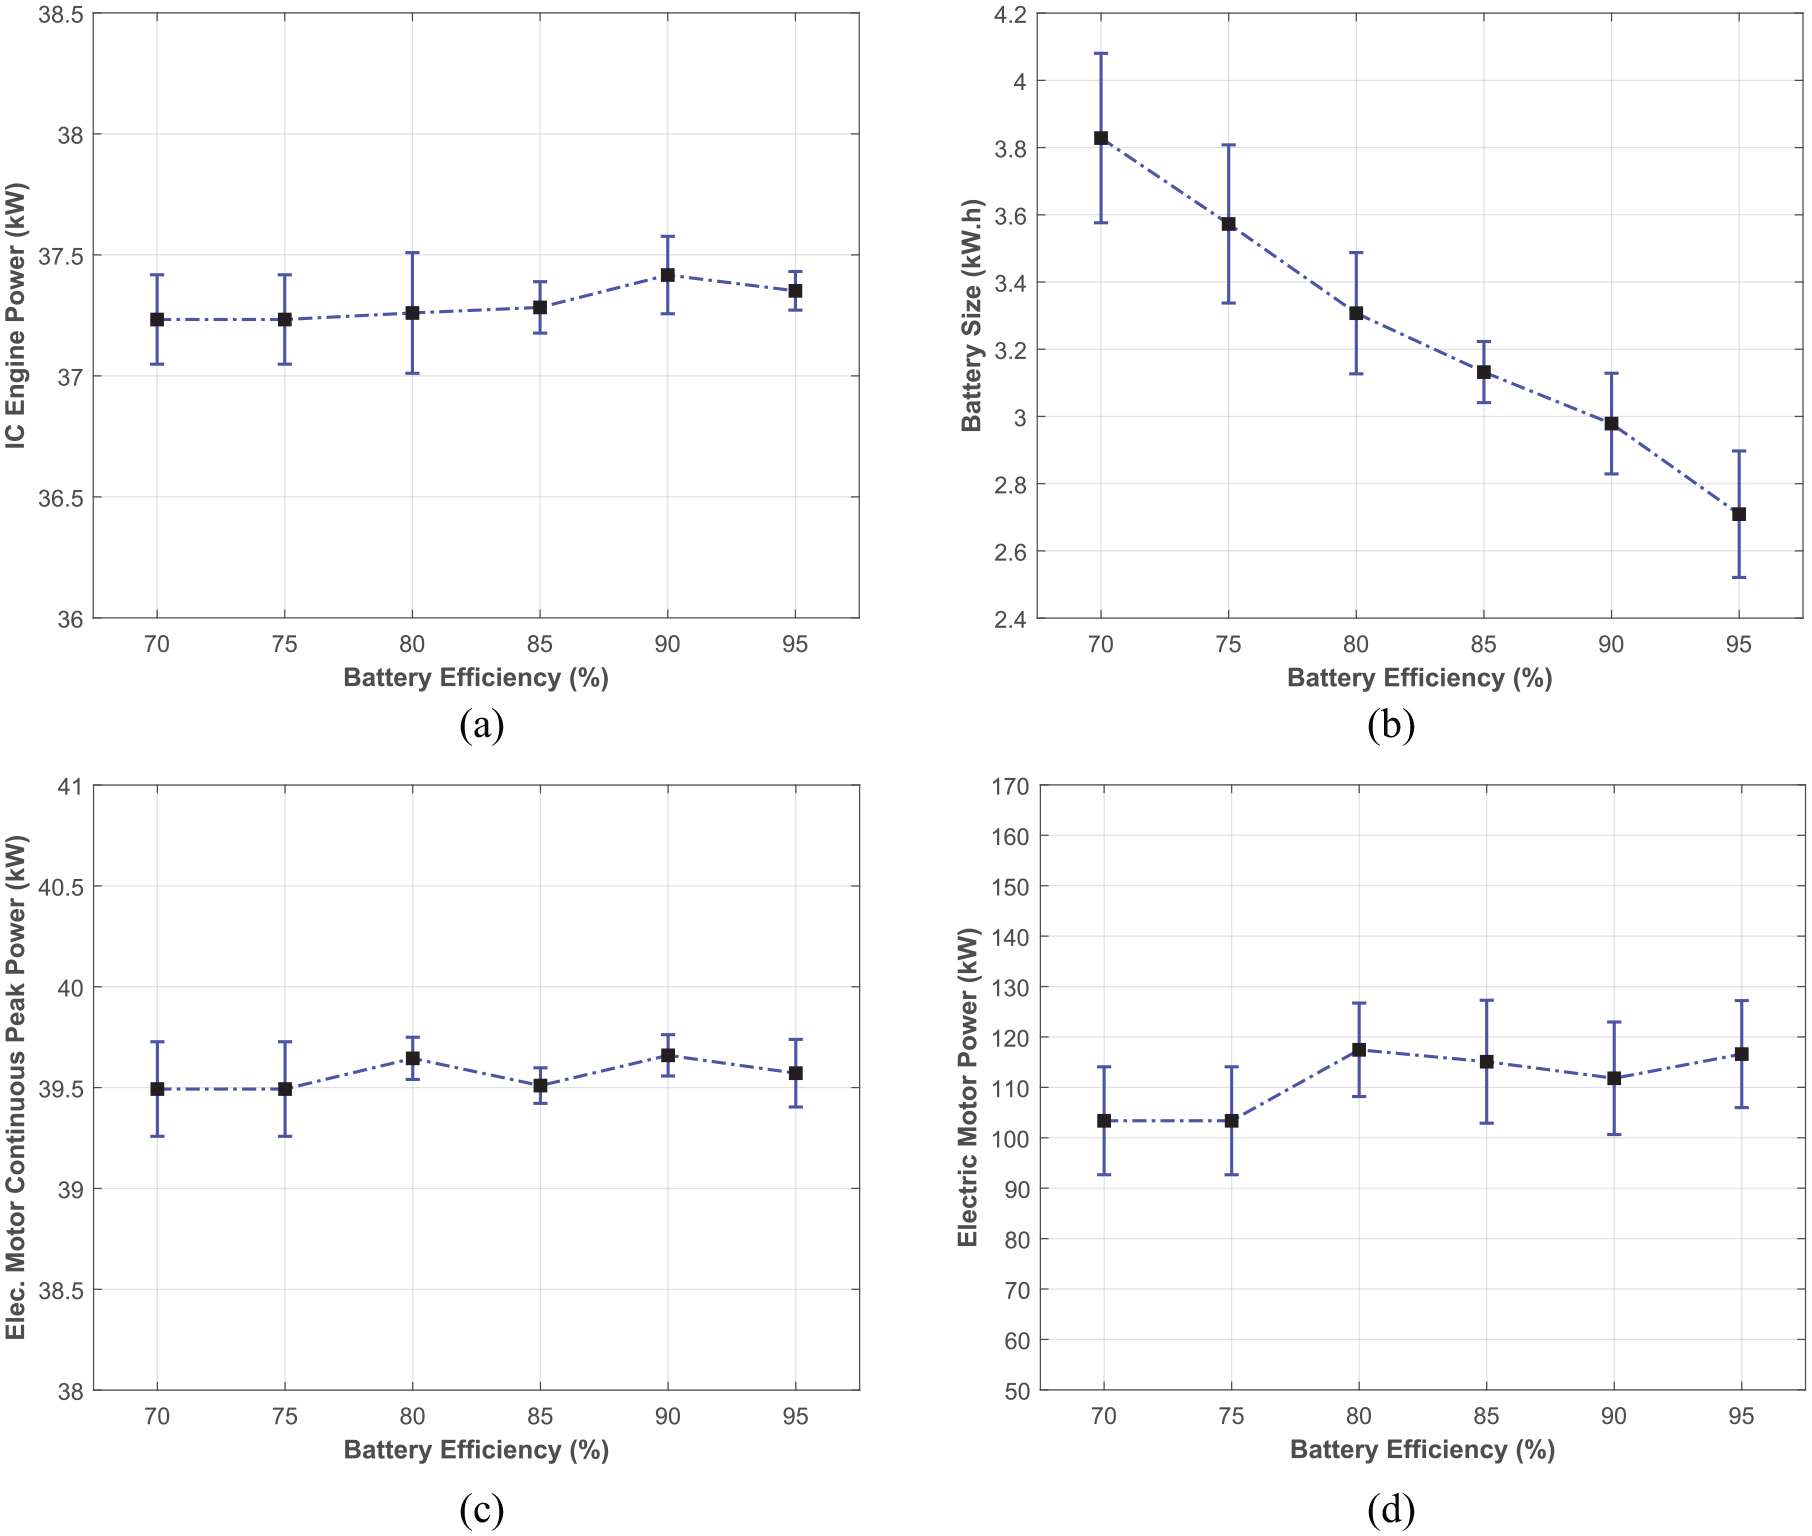
The impact of battery efficiency on: (a) IC engine power, (b) high voltage battery size, (c) electric motor continuous peak power, and (d) electric motor maximum power.
The effects of battery efficiency on the components can be perceived as following a pretty neutral orientation except for battery size. The IC engine power passes through the slender channel of 37.23–37.42 kW. Electric motor continuous peak power is also on the line of 39.5 kW (between 39.49 and 39.66 kW) with respect to battery efficiency, and electric motor power fluctuates between 103.38 and 117.45 kW. However, as could be foreseen, according to the Figure 13(b), the more the battery efficiency, the less the required battery size will be (decrease from 3.83 to 2.71 kW/h).
Coast-down coefficient (f2) impact
A vehicle’s road load parameters (rolling resistance and aerodynamic drag) are recognized by coast down coefficients. These coefficients are extracted by the experimental test of the vehicle in a no-slip condition at sea level. The vehicle is coasted at a 120 km/h speed to the zero speed in a neutral gear position, and its speed-time curve is extracted and fitted to the second-order polynomial function. The coast-down coefficients are the coefficients of the fitted function of
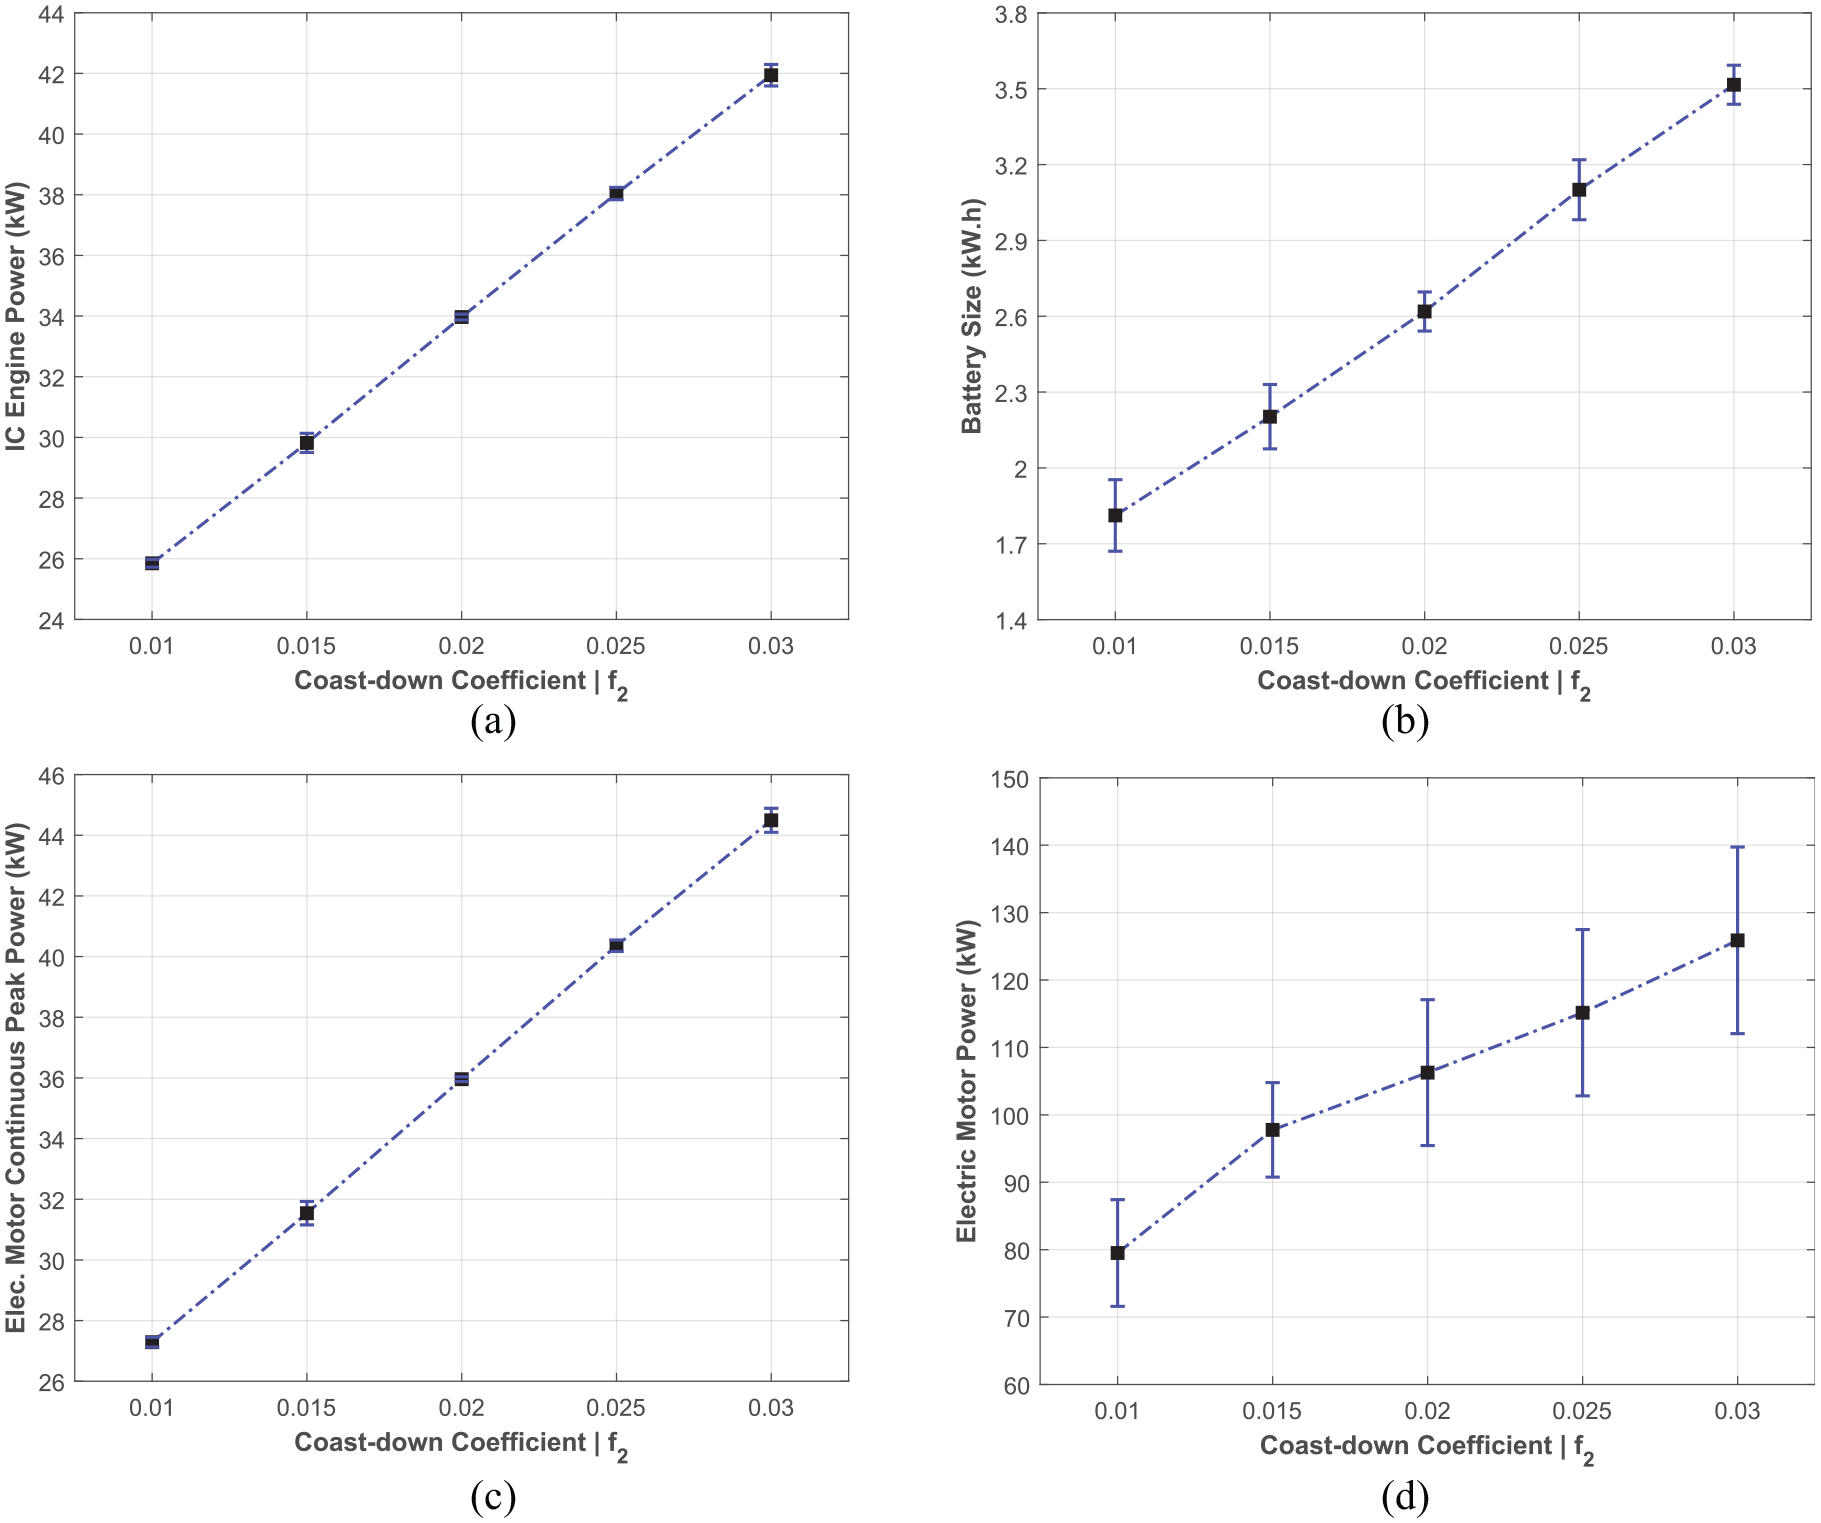
The impact of coast-down coefficient | f2 on: (a) IC engine power, (b) high voltage battery size, (c) electric motor continuous peak power, and (d) electric motor maximum power.
As previously mentioned, different driving cycles are investigated to evaluate the vehicle components sizing, and the maximum calculated size in different driving conditions is considered for the size of the specified component. In this section, the results of the cycle-wise investigation of boundary conditions on the components sizing are presented and shown in Figure 15. This figure shows the effect of temperature variation on the components sizing for three driving cycles, including FTP-75, WLTC class 3, and the Isfahan-Tehran route. Regardless of the results of the figure, basically in comparison to the WLTC, the FTP-75 is less demanding, and the NEDC is even less intense than the FTP-75 37 ; therefore, NEDC is not included in the cycle-wise comparison as even the more aggressive FTP-75 cycle has not been deterministic. While vehicle driving on the highway road requires more considerable steady power compared to the other standard cycles, the Isfahan-Tehran route should be certainly considered in a cycle-wise investigation to determine the combustion engine maximum power. The weight of 1500 kg, the inverter and battery efficiency of 90%, the coast-down coefficients of f0 = 240.13, f1 = 0.5821, and f2 = 0.0241, and sea-level ambient conditions with the electric motor of Brusa HSM1 is considered for the driving cycle investigation. The effect of temperature on IC engine power, battery size, and electric motor power for the triple-selected cycles is presented in this figure. As mentioned in the temperature impact section, the temperature rise affects the air density and reduces the air friction on the vehicle. Therefore, as observable in Figure 15, the trends are descending as the temperature rises, which signifies less need for power generation in IC engine, smaller battery, and electric motor. A notable point in this figure is related to the IC engine size that is determined by the suburban driving route. This is due to the constant high-speed driving during this route that leads to more considerable average power. The battery size and electric motor power are highly affected by the dynamic driving behavior. Therefore, WLTC determines the size of the mentioned components due to significant dynamic behavior. A similar trend can be seen for other independent variables in different driving conditions, and the Isfahan-Tehran route is determinative for combustion engine size, and WLTC is determinant for other components. Therefore, it can be concluded that the FTP-75 is not deterministic in components sizing of the series hybrid electric vehicle, and cycle-wise investigation can be summarized into the Isfahan-Tehran route and WLTC calculations.
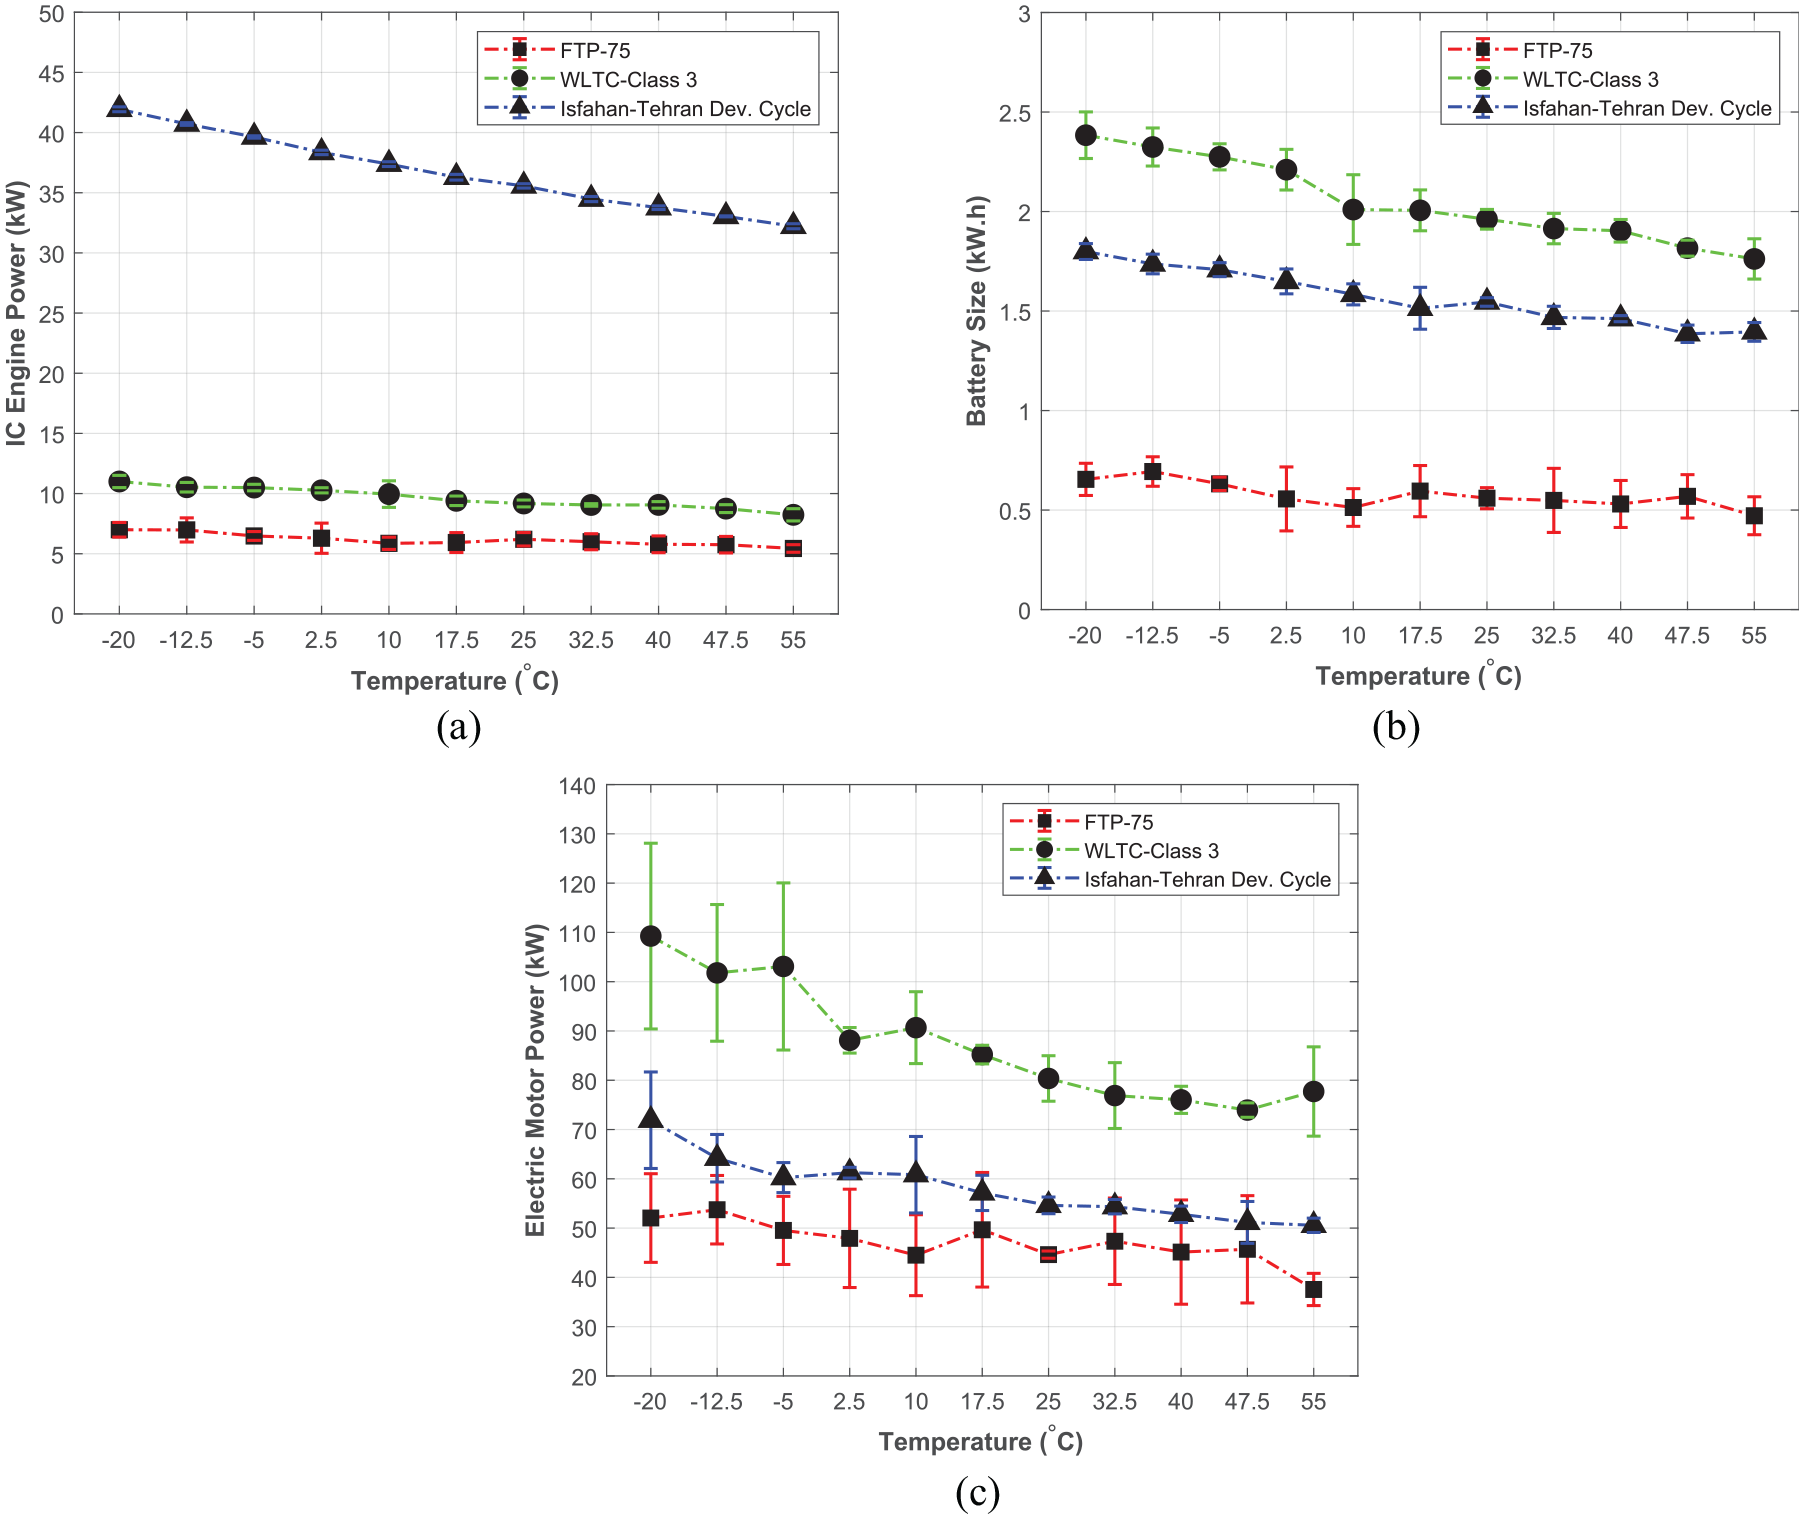
The impact of temperature on: (a) IC engine power, (b) high voltage battery size, and (c) electric motor maximum power for selected cycles.
Conclusions
This paper presents a new method for the components sizing of the series hybrid electric vehicle. In this method, the requested power is decomposed into dynamic and steady parts and is attributed to the high voltage battery and IC engine, respectively. Meanwhile, a predictive ANN tool is developed based on experimental data of two series prototype hybrid electric vehicles. This tool enables the authors to predict the instantaneous requested power, and the information is implemented to size the maximum instantaneous and continuous electric motor power, IC engine power, and high voltage battery size. The sensitivity analysis of the ambient conditions(including temperature and altitude), the inverter and high voltage battery efficiencies, and the coast-down coefficient variations are studied in the present study. The concluding remarks are as follows:
The maximum instantaneous power of the electric motor is affected by the rapid acceleration in low-speed conditions. Therefore, it is not highly affected by environmental conditions and vehicle aerodynamics.
The combustion engine’s maximum power is determined by the suburban driving route and is not affected by the standard driving conditions.
WLTC driving cycle is the most comprehensive driving cycle among the available driving cycles, and most of the components’ sizes are determined by this cycle except the combustion engine’s maximum power.
It can be concluded that the FTP-75 is not deterministic in components sizing of the series hybrid electric vehicle, and cycle-wise investigation can be summarized into the Isfahan-Tehran route and WLTC calculations.
The affection of battery and inverter efficiencies on every component’s size can be perceived as a pretty neutral orientation except for the battery size.
The coast-down coefficient is the only input parameter with an almost similar effect for the size of all components. This shows the importance of coast-down coefficient improvement for the optimized size of components.
Footnotes
Appendix
Declaration of conflicting interests
The author(s) declared no potential conflicts of interest with respect to the research, authorship, and/or publication of this article.
Funding
The author(s) received no financial support for the research, authorship, and/or publication of this article.