
Abstract
Knock-limited combustion of alcohol-gasoline fuel blends was studied in a direct-injection spark-ignition engine. Ethanol, isobutanol (2-methyl-1-propanol), and methylbutenol (2-methyl-3-buten-2-ol) were splash-blended with a blendstock for oxygenate blending (BOB) gasoline. Ethanol was blended in fractions of 10%, 20%, and 30% by volume (E10, E20, and E30). Isobutanol and methylbutenol were blended to match the oxygen weight percentage of the ethanol blends, resulting in blends of 16%, 32%, and 49% (I16, I32, and I49) isobutanol by volume and 18%, 37%, and 56% (M18, M37, and M56) methylbutenol by volume. Neat BOB and gasoline primary reference fuels (PRF) with octane numbers (ON) of 87 (PRF87) and 100 (PRF100) were included for reference. The engine was operated at fixed speed, equivalence ratio, and injection timing while knock-limited spark advance was located across a range of intake pressures. Low-level alcohol blends E10 and M18 had similar knocking behavior and appeared to be slightly more knock-resistant than I16. For mid-level blends, E20 showed further improvement over I32 while M37 showed noticeably better knock resistance, able to match the knock-resistance of PRF100 for loads above 1000 kPa gross indicated mean effective pressure (GIMEP). For high-level blends, the difference between E30 and I49 was similar to their mid-level counterparts. However, M56 showed significant improvement over E30 and I49 throughout the entire range of loads tested. M56 exceeded the knock-resistance of PRF100 for loads above 700 kPa GIMEP. The improved knock-resistance combined with the increased volumetric energy density of methylbutenol resulted in improved fuel consumption and indicated efficiency. The overall results of this study indicate that the order of knock-resistance of these three alcohols, for direct-injection operation with injection during the intake stroke, is isobutanol < ethanol < methylbutenol when compared on an equal oxygen weight basis.
Introduction
Ethanol (ETH) is the most widely used renewable gasoline additive in the United States. Ethanol–gasoline blends are available to purchase in concentrations up to 20% by volume for normal gasoline vehicles and up to 83% by volume for flex-fuel vehicles (volumetric range allowed for E85 is 51%–83% 1 ). Ethanol’s attractiveness as a fuel comes largely from its high research octane number (RON) of 109. 2 The addition of a renewable, high-RON fuel to gasoline improves its anti-knock properties while displacing traditional high carbon intensity fuel components. However, ethanol has some drawbacks which make it less desirable as a fuel, such as its 30% lower energy density than gasoline which leads to reduced fuel economy. It also readily absorbs water which can cause detrimental fuel effects and makes it difficult to transport by pipeline. Finally, it has a comparatively high heat of vaporization which can lead to changes in mixture preparation, especially in low-temperature or cold-start conditions.3,4
To address some of the drawbacks of ethanol as a fuel additive, interest has recently been directed toward alternative, higher carbon-number alcohols. Isobutanol (2-methyl-1-propanol, IBA) is a C4 alcohol which has seen recent use as a drop-in replacement for ethanol in concentrations up to 16% by volume in gasoline fuels. Isobutanol has 23% higher volumetric energy density than ethanol which brings it much closer to gasoline. Unlike ethanol, isobutanol is hydrophobic, reducing the potential for water contamination. It also has a similarly high RON of 105. 5
Recent work has investigated higher carbon number alcohols to displace or replace ethanol.6–9 In particular, 2-methyl-3-buten-2-ol (methybutenol, MBO) has been identified as a novel bio-fuel which can be made from the bacteria E. coli. 10 Methylbutenol is a C5 alcohol which has the potential to be a suitable replacement for ethanol and isobutanol. It has the highest volumetric energy density of the three alcohols. While its RON is slightly lower than ethanol and isobutanol, it is still relatively high compared to gasoline at close to 104.
The knock resistance of a gasoline fuel is one of the most important properties when considering its use in spark-ignition engines. Knock is the result of the spontaneous, uncontrolled, auto-ignition of the end-gas air-fuel mixture in spark-ignition engines. 11 It is one of the primary factors in limiting the ultimate efficiency and load range of spark-ignition engines.12–15 The ability to increase load and efficiency is especially important as engine manufacturers downsize engines as a means to meet CO2 emissions targets.15–17
As mentioned, previous work by the authors 18 has shown that without physical fuel property effects, for conditions where the fuel is prevaporized and premixed upstream of the intake port and the the fuel-air mixture is supplied to the engine at the same temperature, methylbutenol-gasoline blends have better knock-resistance when compared to similar oxygen weight percentage blends of ethanol or isobutanol with gasoline. The objective of this study is to determine the relative knock resistance of the fuel under direct-injection operating conditions. The results of the current direct-injection study are then used in conjunction with the previous premixed and prevaporized operation study results to elucidate the impact of physical fuel properties on the knock-limited performance of alcohol-gasoline blends for higher alcohols compared to ethanol. The results also provide the first spark-ignition direct-injection operation data for the promising biofuel methylbutenol when blended with gasoline.
Background
The knock-resistance of a fuel is typically characterized by its research octane number (RON) and its motor octane number (MON), parameters which are measured using standardized tests specified by ASTM International.19,20 The RON and MON tests for motor gasoline differ significantly in their test conditions. The RON test is performed at an engine speed of 600 revolutions per minute (RPM) and the air temperature upstream of fuel addition is maintained at 52°C. In contrast, for the MON test, the engine is operated at 900 RPM and the temperature of the air-fuel mixture is controlled to 149°C. The temperature of air-fuel mixture for the RON test is not controlled, resulting in the actual temperature of the air-fuel mixture varying due to evaporative cooling that occurs due to fuel vaporization. Researchers, such as Foong et al., 21 have shown that this change in temperature has a direct impact on RON test results.
Another metric, the octane index (OI), has been used to describe engine operating conditions in terms of the octane number of the PRF fuel which is also knock-limited at that condition. The octane index can also be written as a weighted combination of RON and MON:

where the sensitivity of the fuel,

which allows OI in equation (1) to be expressed as a function of the RON,
Not all of ethanol’s ability to resist auto-ignition is due to the “chemical octane” associated with its chemical kinetics. Studies have shown that the high heat of vaporization of ethanol contributes significantly to its anti-knock quality.14,22,23 For isobutanol, many studies have focused on the auto-ignition behavior of its neat form using either shock tubes or rapid compression machines (RCM).24–27 Due to ethanol’s widespread use there are far more auto-ignition and engine knock studies for ethanol-gasoline blends than for isobutanol-gasoline blends. Goldsborough et al. 28 compared the auto-ignition behavior of isobutanol-gasoline blends in a rapid compression machine and found that isobutanol addition reduced low-temperature reactivity and increased ignition delay times compared to the base gasoline. However, they found that the effect was not as strong compared to ethanol at similar volumetric blends. Similar RCM results were found by Michelbach and Tomlin 29 for isobutanol blended into gasoline as well as a gasoline-surrogate. Michelbach and Tomlin 30 also performed spark-ignition engine experiments with the same fuel blends and found that isobutanol addition resulted in delayed knock onset as well as reduced knock intensity. Ratcliff et al. 31 compared the knock resistance of an isobutanol-gasoline blend of 16% isobutanol by volume (I16) against a number of other oxygenate-gasoline blends in a single-cylinder direct-injection engine and found the knock-resistance of the I16 blend to be comparable to an ethanol-gasoline blend of 10% by volume (E10).
Experimental setup
Engine
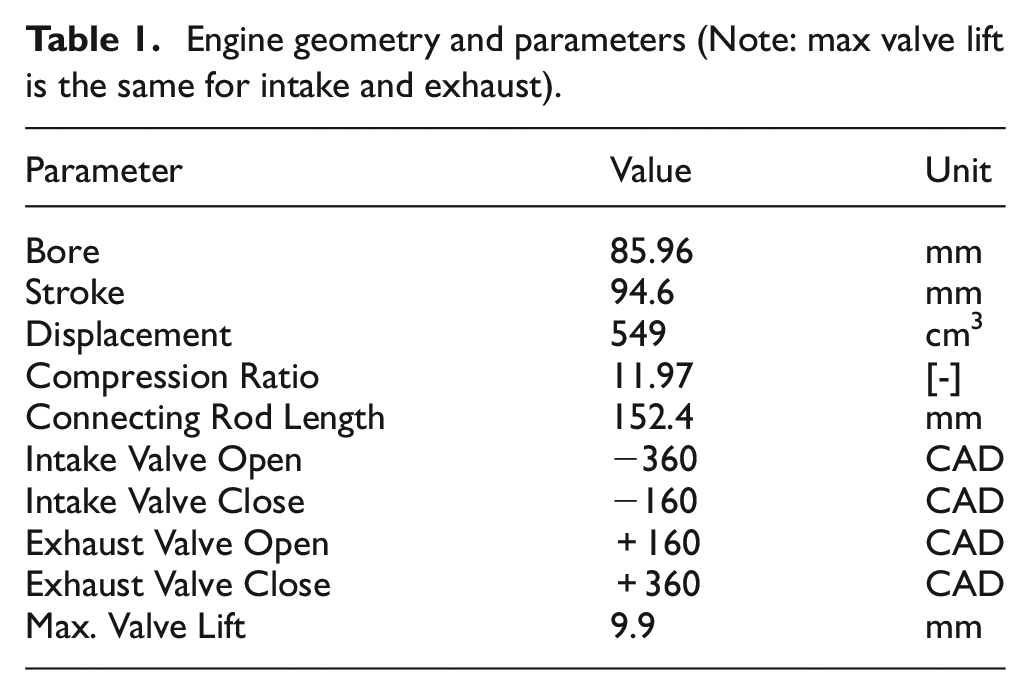
The single-cylinder engine used for the experiments is representative of a modern spark-ignition direct-injection engine. The cylinder head features a 4-valve pent-roof combustion chamber with a centrally-mounted spark plug and fuel injector. The cylinder head was also modified to allow optical access into the pent-roof area of the head. This access was not used for the current work and metal blanks were used instead of windows. The cylinder head modifications do limit the peak pressures for the engine to below 60 bar which limits the range of engine loads that could be tested in this work. Table 1 lists the geometric specifications for the engine. It should be noted that all engine timings are listed with 0 crank-angle degrees (CAD) referenced to top dead center (TDC) of the compression stroke; timings before TDC are negative and timings after TDC are positive.
Engine geometry and parameters (Note: max valve lift is the same for intake and exhaust).
In-cylinder pressure was measured using a high-speed piezo-electric pressure transducer (Kistler 6125C). An average of 100 engine cycles was used to monitor the desired engine operating condition, after which 1000 cycles of pressure data were collected for processing. A MATLAB post-processor was used to calculate cumulative heat release, heat release rate, and mass-averaged in-cylinder temperature.
Fuels
In this study, three alcohols were blended with a gasoline blendstock for oxygenate blending (BOB) to produce nine fuel blends. The BOB (Gage Products) has an anti-knock index (AKI), the average of the research and motor octane numbers, of 85. The alcohols used in this study were denatured ethanol, isobutanol, and methylbutenol (2-methyl-3-buten-2-ol). The methodology for designing the fuel blends was based around current U.S. federal regulations which match alcohol–gasoline blended fuels based on the oxygen content of equivalent ethanol–gasoline blends. Blends of 10%, 20%, and 30% by volume of ethanol with the BOB (E10, E20, and E30, respectively) were chosen to be the ethanol blends which would form the basis for comparison. To match the oxygen weight percentage of the ethanol blends, isobutanol was blended at 16%, 32%, and 49% by volume (I16, I32, and I49) and methylbutenol was blended at 18%, 37%, and 56% by volume (M18, M37, and M56). Neat BOB and primary reference fuels (PRF) with octane numbers of 87 (PRF87) and 100 (PRF100) were included to serve as reference points for comparison.
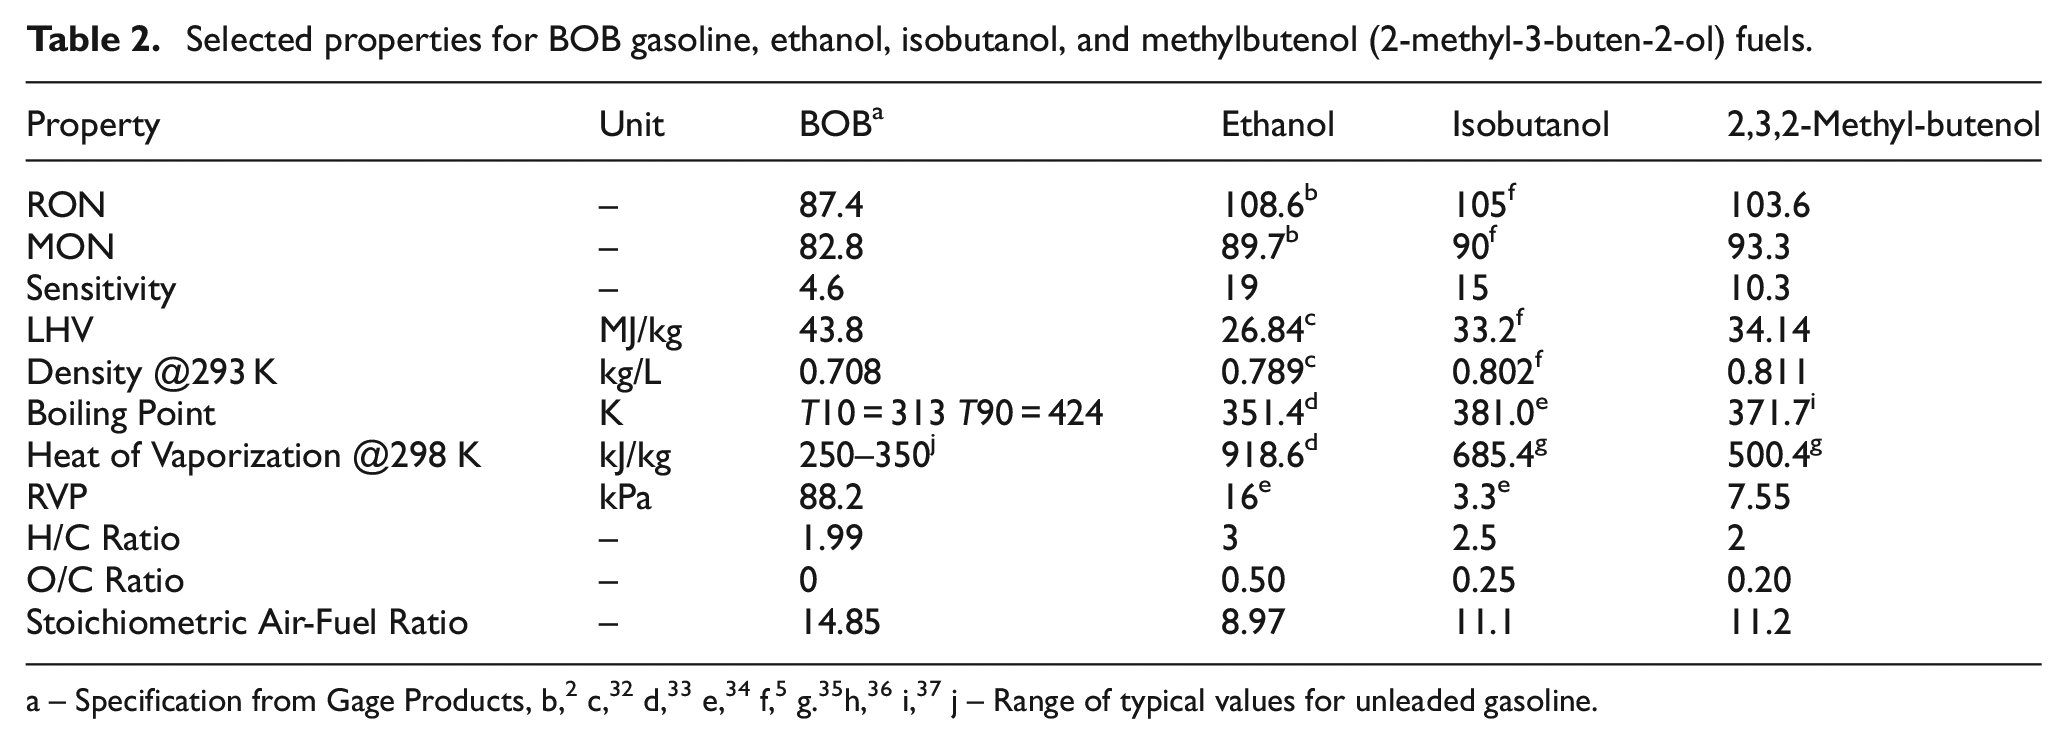
The neat BOB was included as a reference to ascertain the changes in knock resistance with alcohol addition. Primary reference fuels are a mixture of n-heptane and isooctane (both provided by Millipore Sigma, >99% purity) which are used in the octane number standards,19,20 where the PRF number corresponds to the volume percentage of isooctane in the mixture. Primary reference fuels with octane numbers of 87 and 100 were chosen as their octane numbers are similar to the research octane numbers of BOB and highest alcohol blends, respectively. Properties of the base fuels as well as fuel blends are shown in Tables 2 and 3.
Selected properties for BOB gasoline, ethanol, isobutanol, and methylbutenol (2-methyl-3-buten-2-ol) fuels.
Selected properties for alcohol fuel blends.
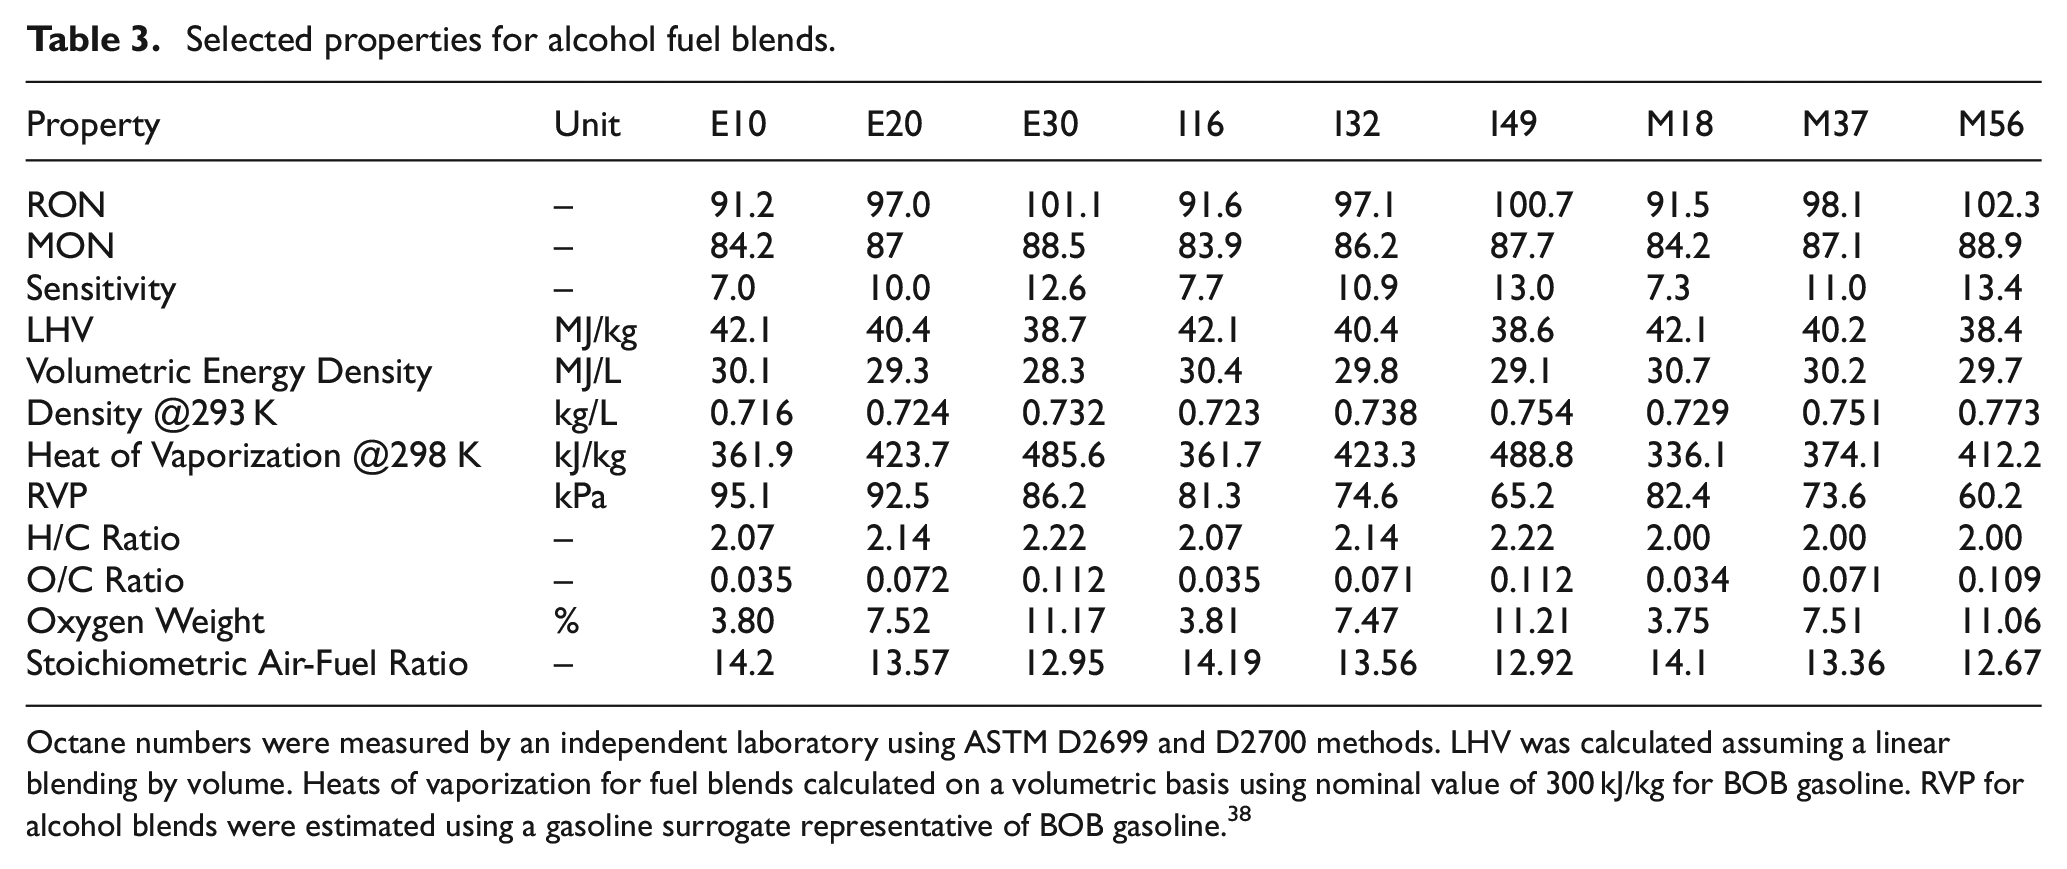
Octane numbers were measured by an independent laboratory using ASTM D2699 and D2700 methods. LHV was calculated assuming a linear blending by volume. Heats of vaporization for fuel blends calculated on a volumetric basis using nominal value of 300 kJ/kg for BOB gasoline. RVP for alcohol blends were estimated using a gasoline surrogate representative of BOB gasoline. 38
Engine operating conditions
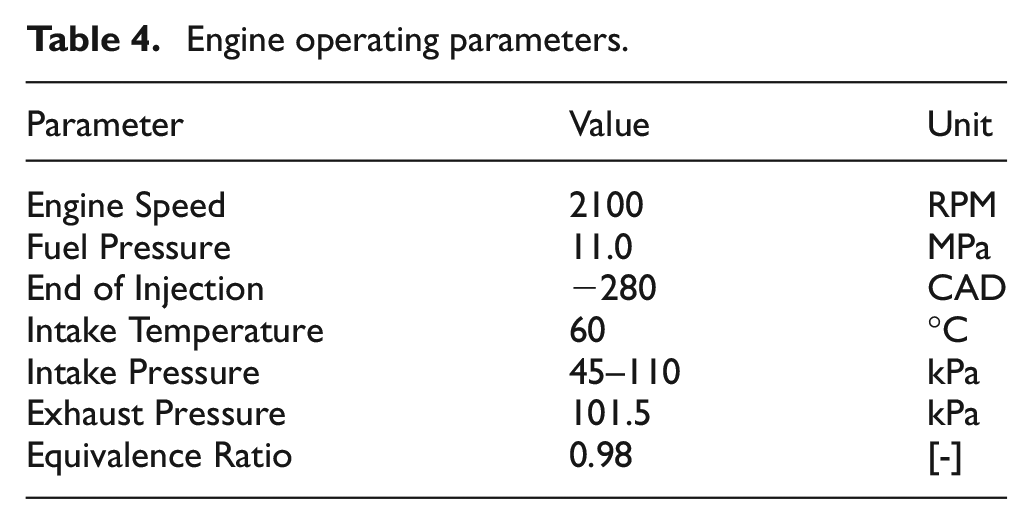
For all testing, the engine was operated at a constant engine speed of 2100 RPM and an equivalence ratio of 0.98. Fuel was injected at a constant fuel pressure of 11.0 MPa with an end of injection timing (EOI) fixed to −280 CAD. The chosen EOI timing of −280 CAD is representative of an early injection strategy for homogenous DI operation. The intake temperature was maintained at a constant value of 60°C. This temperature was selected to match previous premixed prevaporized (PMPV) knock-limited experiments performed with the same fuel blends. 18 Engine operating parameters are summarized in Table 4.
Engine operating parameters.
Measurements were performed for a range of engine loads by varying intake pressure and fueling while keeping engine speed and equivalence ratio constant. At each intake pressure, spark timing was advanced until a knock-limited condition was reached. To determine if a cycle was exhibiting knocking behavior, the maximum amplitude of pressure oscillations (MAPO) was chosen for the knock index (KI), details on this process are provided in. 18 To determine the location of knock-limited spark advance (KLSA), the operating conditions were set then the spark timing was slowly advanced. The knock-limited spark advance was considered to be reached when more than five cycles in a set of 100 exceeded a KI of 50 kPa. This limit was chosen to prevent damage to the engine due to excessive and/or stochastic, high-intensity knock. After the KLSA had been reached, 1000 cycles of pressure data were collected for later processing. The knock-limited GIMEP for all of the fuels at each intake pressure are listed in Table 5. Note that not all fuels were tested at all intake pressure conditions due to their knock-limited behavior.
Gross indicated mean effective pressures for tested fuels at nominal intake pressure conditions.
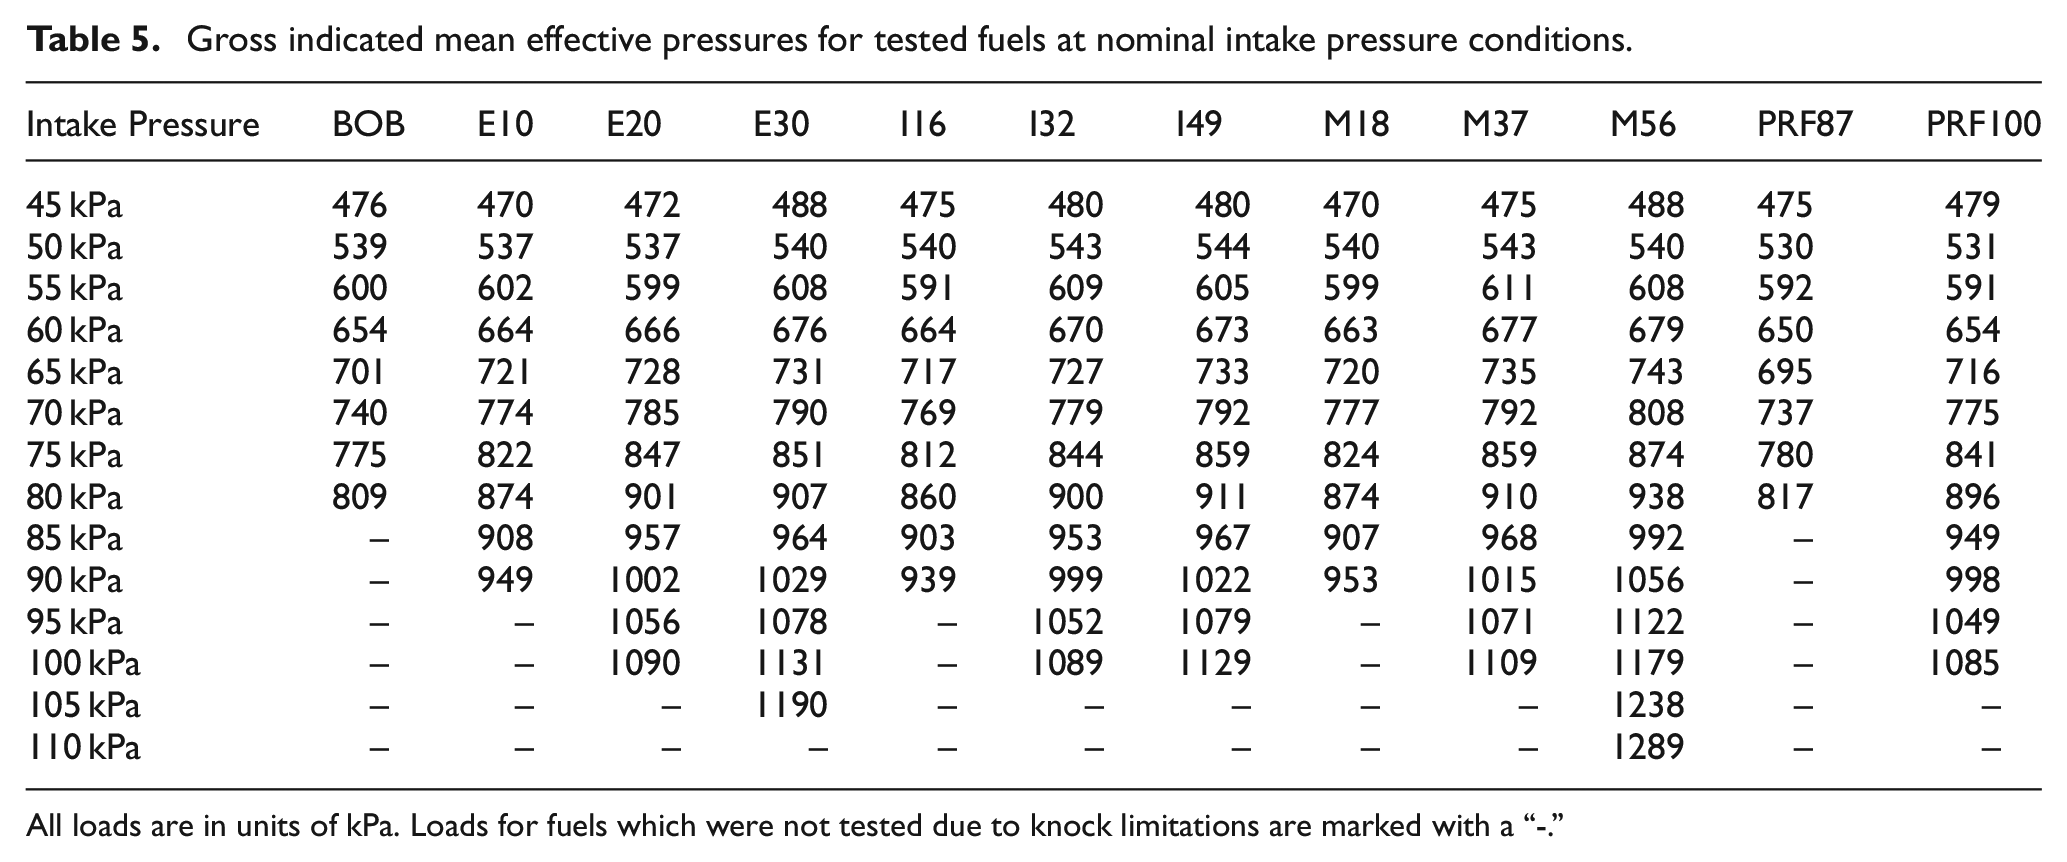
All loads are in units of kPa. Loads for fuels which were not tested due to knock limitations are marked with a “-.”
Several fuels were re-run over the course of these experiments on different days to determine the repeatability of the method. Figure 1 shows replicated runs for BOB (2 runs), E30 (2 runs), and M56 (2 runs). The results here mirror repeatability study results seen in previous PMPV knock experiments 18 and demonstrate the repeatability of locating the location of knock-limited CA50. The largest variation between days at a given load was less than ∼1 CAD.
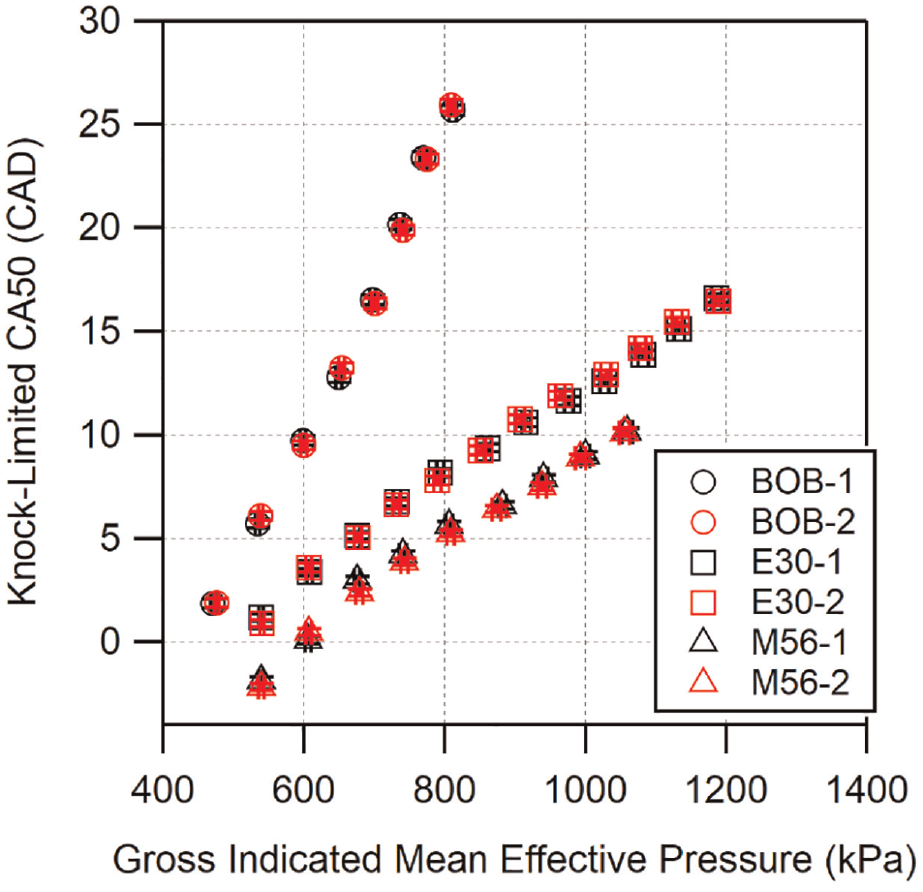
Repeated knock-limited CA50 results for selected fuels.
Results and discussion
Knock-limited combustion phasing
BOB and Primary Reference Fuels
Figure 2 shows the knock-limited CA50 results for the base gasoline and primary reference fuels. The dashed horizontal line in this and future knock-limited CA50 plots indicates the location of CA50 for maximum brake torque (MBT). Fuels that are more knock-resistant can be advanced to earlier combustion phasings (lower CA50 values). At low GIMEP all of the fuels can be advanced to CA50 times earlier than MBT, indicating that at these loads the performance of the fuels is not restricted by their knock-limit. The BOB appears to be more knock-limited than PRF87 for GIMEP < 700 kPa. Above 700 kPa, their knock-limited behavior is more similar, although a consistent difference in slope is observed at the highest loads, with PRF87 remaining less knock-limited. As expected, PRF100 is less knock-limited than either BOB or PRF87, only requiring later-than-MBT combustion phasing past GIMEP
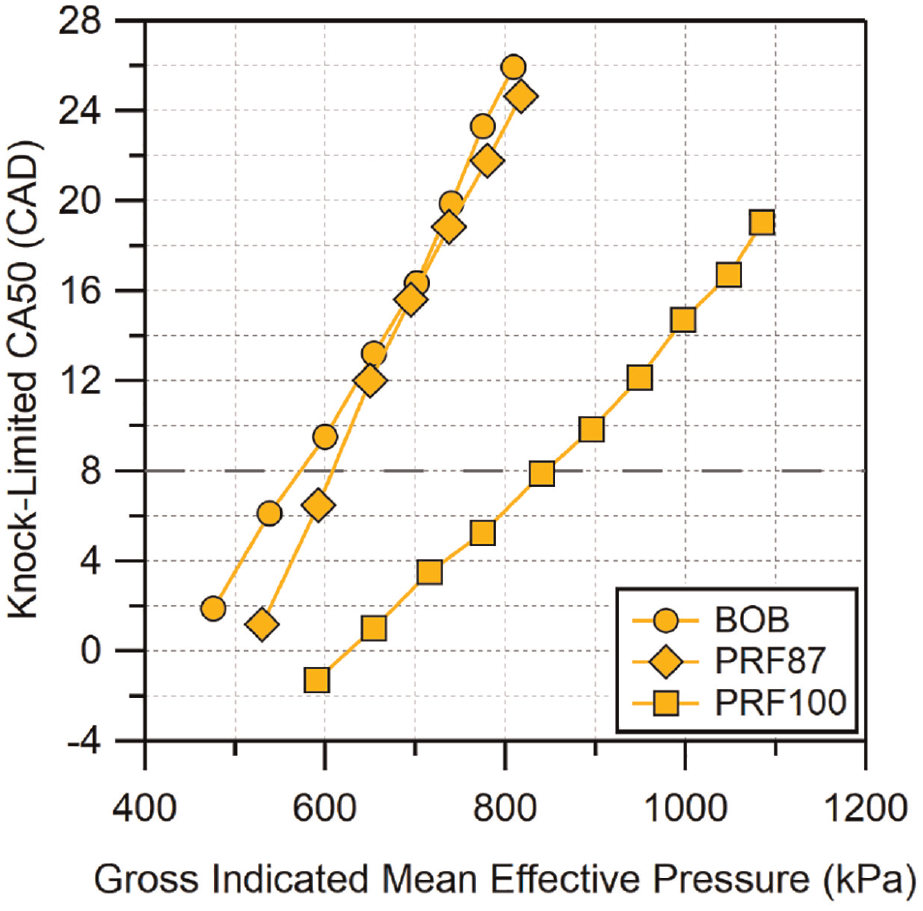
Knock-limited CA50 versus gross IMEP for the BOB fuel. Location of MBT CA50 is indicated by the dashed horizontal line. Uncertainty in CA50 is estimated to be
Ethanol Blends
Figure 3 shows the knock-limited CA50 versus GIMEP for the three ethanol blended fuels. The results for the BOB, PRF87, and PRF100 fuels are included in this and future figures for reference. The change in knock-resistance over the base gasoline with ethanol addition is immediately apparent. E10 shows improved knock-limited combustion phasing across the entire load range and the improvement increases with load. Increasing the ethanol fraction from 20% to 30% results in a slightly smaller improvement in knock-resistance than when increasing ethanol content from 10% to 20%. Combustion phasing can be advanced across the entire load range as the ethanol volume is increased. At the highest loads, E20 comes close to matching the knock resistance of PRF100 and may meet or exceed that for PRF100 at loads greater than 1100 kPa GIMEP. E30 significantly exceeds the knock-limited phasing of PRF100 above GIMEP
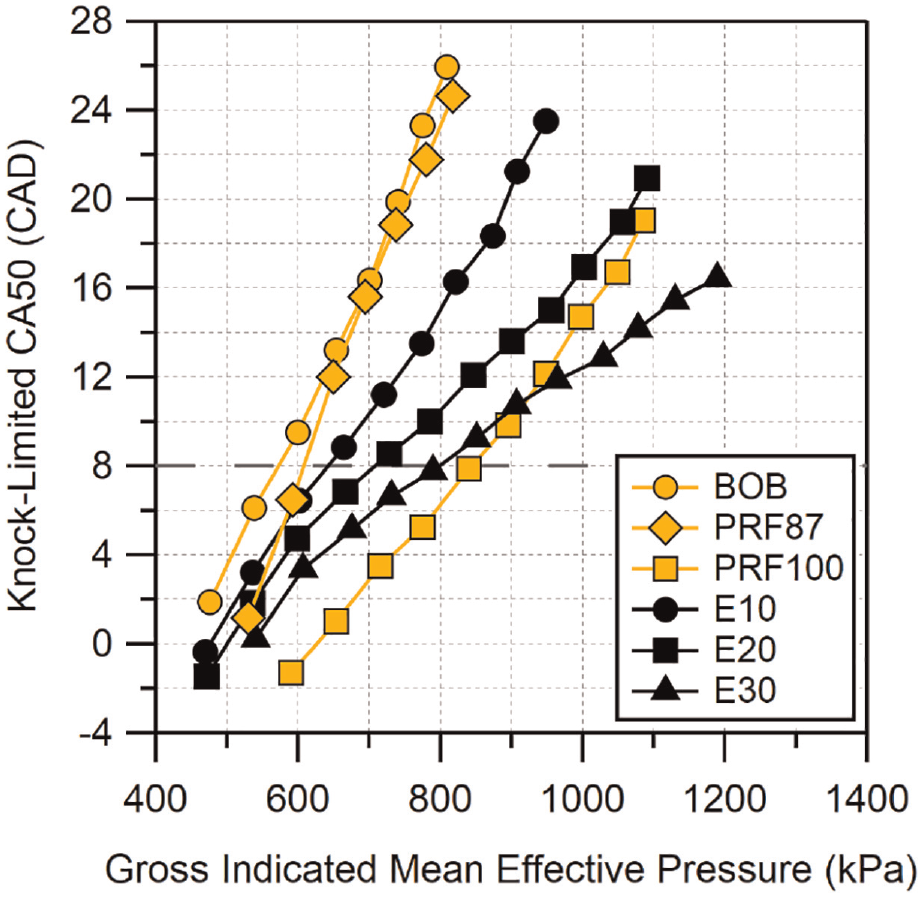
Knock-limited CA50 versus gross IMEP for ethanol blends. BOB and PRF included for reference. Location of MBT CA50 is indicated by the dashed horizontal line. Uncertainty in CA50 is estimated to be
Isobutanol Blends
Knock-limited CA50 results for isobutanol fuel blends are shown in Figure 4. Similar to ethanol, there is a significant increase in knock resistance for the lowest blend level compared to the base gasoline, especially at higher loads. An additional similar improvement is seen when the blend percentage is increased to 32%. However, the highest blend of isobutanol shows a more modest improvement in performance over the mid-level blend when compared to the ethanol results. Its performance is worse than E30 at higher loads though it is still able to exceed PRF100 for GIMEPs
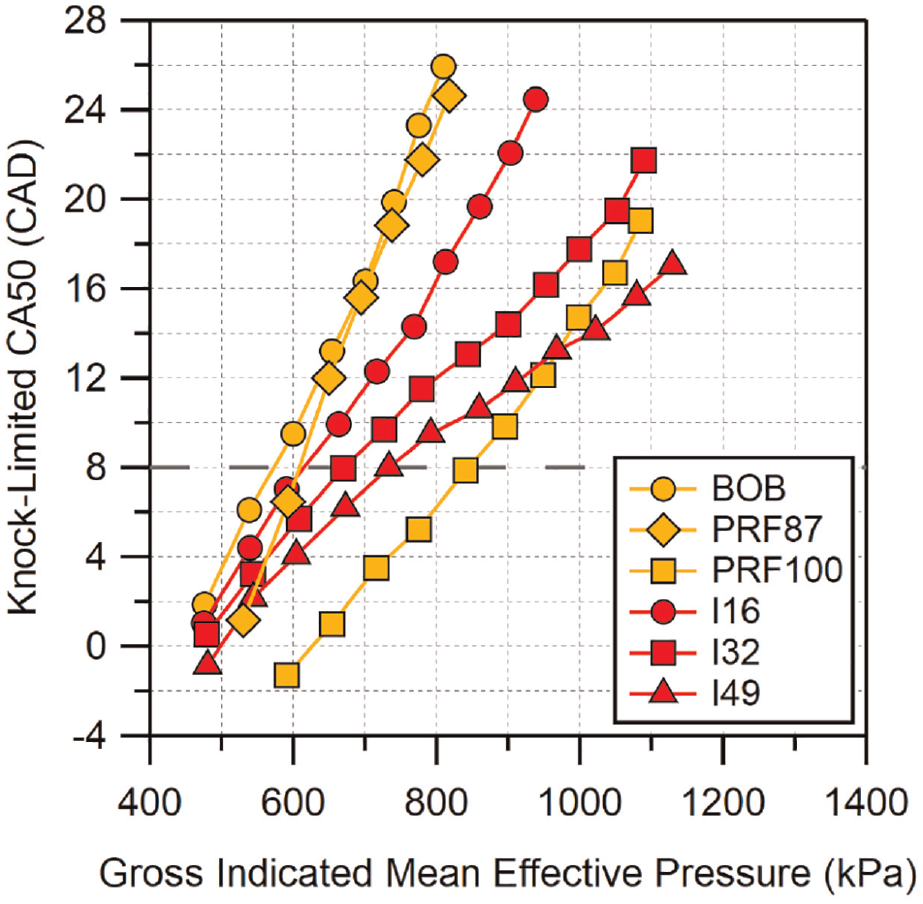
Knock-limited CA50 versus gross IMEP for isobutanol blends. Location of MBT CA50 is indicated by the dashed horizontal line. Uncertainty in CA50 is estimated to be
Methylbutenol Blends
Methylbutenol blends are shown in Figure 5. The lowest blend, M18, has similar performance to E10 and I16. However, once the blend is increased to 37%, the knock-limited CA50 advances more than the mid-blends of ethanol and isobutanol. In fact, M37 is able to match and slightly exceed the performance of PRF100 at the highest loads in spite of having a lower RON. Neither E20 nor I32 were able to reach this level of knock-resistance at the higher loads tested. At the highest blend level, the knock resistance again increased significantly, approximately equal to the difference between M18 and M37. This differentiates methylbutenol from ethanol and isobutanol as the latter two saw diminishing improvements from one blend to the next. The knock resistance of the M56 blend was the highest of all of the fuel blends tested and M56 was able to reach the highest loads with the minimum amount of combustion phasing retard. M56 was also able to match and exceed PRF100 from GIMEP
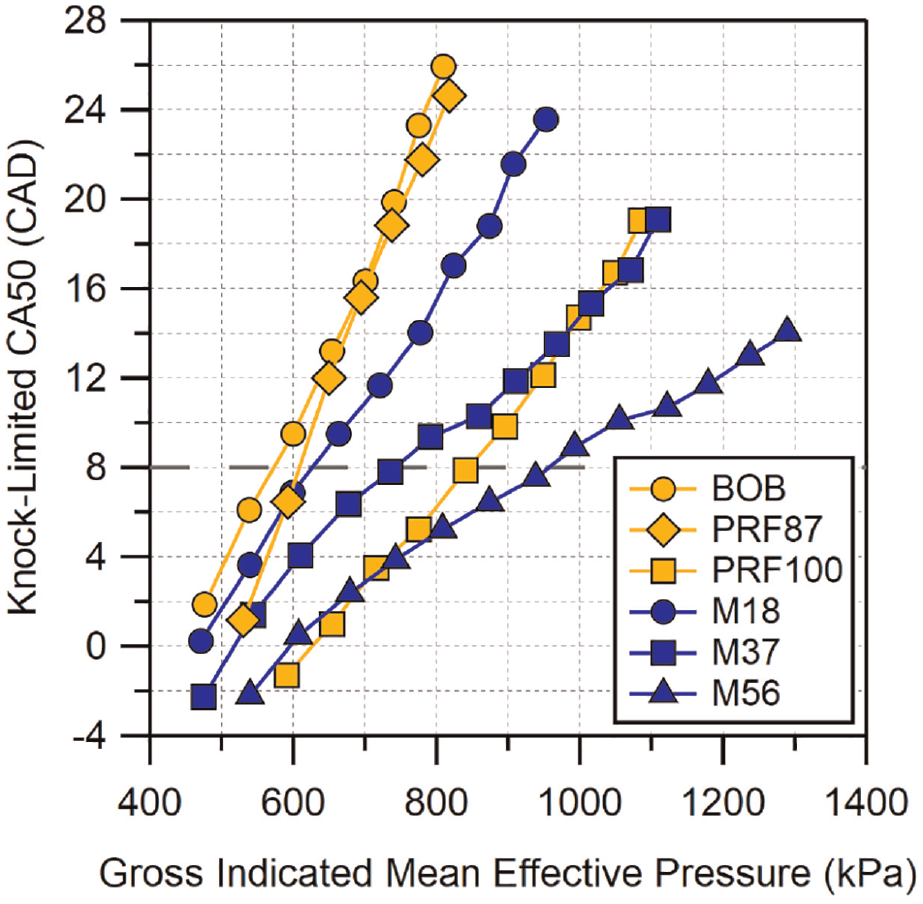
Knock-limited CA50 versus gross IMEP for methylbutenol blends. Location of MBT CA50 is indicated by the dashed horizontal line. Uncertainty in CA50 is estimated to be
Comparisons Based on Blend Level
To better visualize the differences between fuel blends of similar oxygen content, the knock-limited CA50 results are shown in Figure 6 arranged by blend level. Again, neat BOB, PRF87, and PRF100 are included for reference. At the lowest blend level, all of the fuels appear to behave similarly, with E10 and M18 performing marginally better than I16. The similar behavior is not surprising given the properties of these blends do not differ significantly. The comparable performance of E10 and I16 seen here is similar to the results seen by Sluder et al. 39 which compared knock-limited combustion of ethanol- and isobutanol-gasoline blends at concentrations similar to those used here.
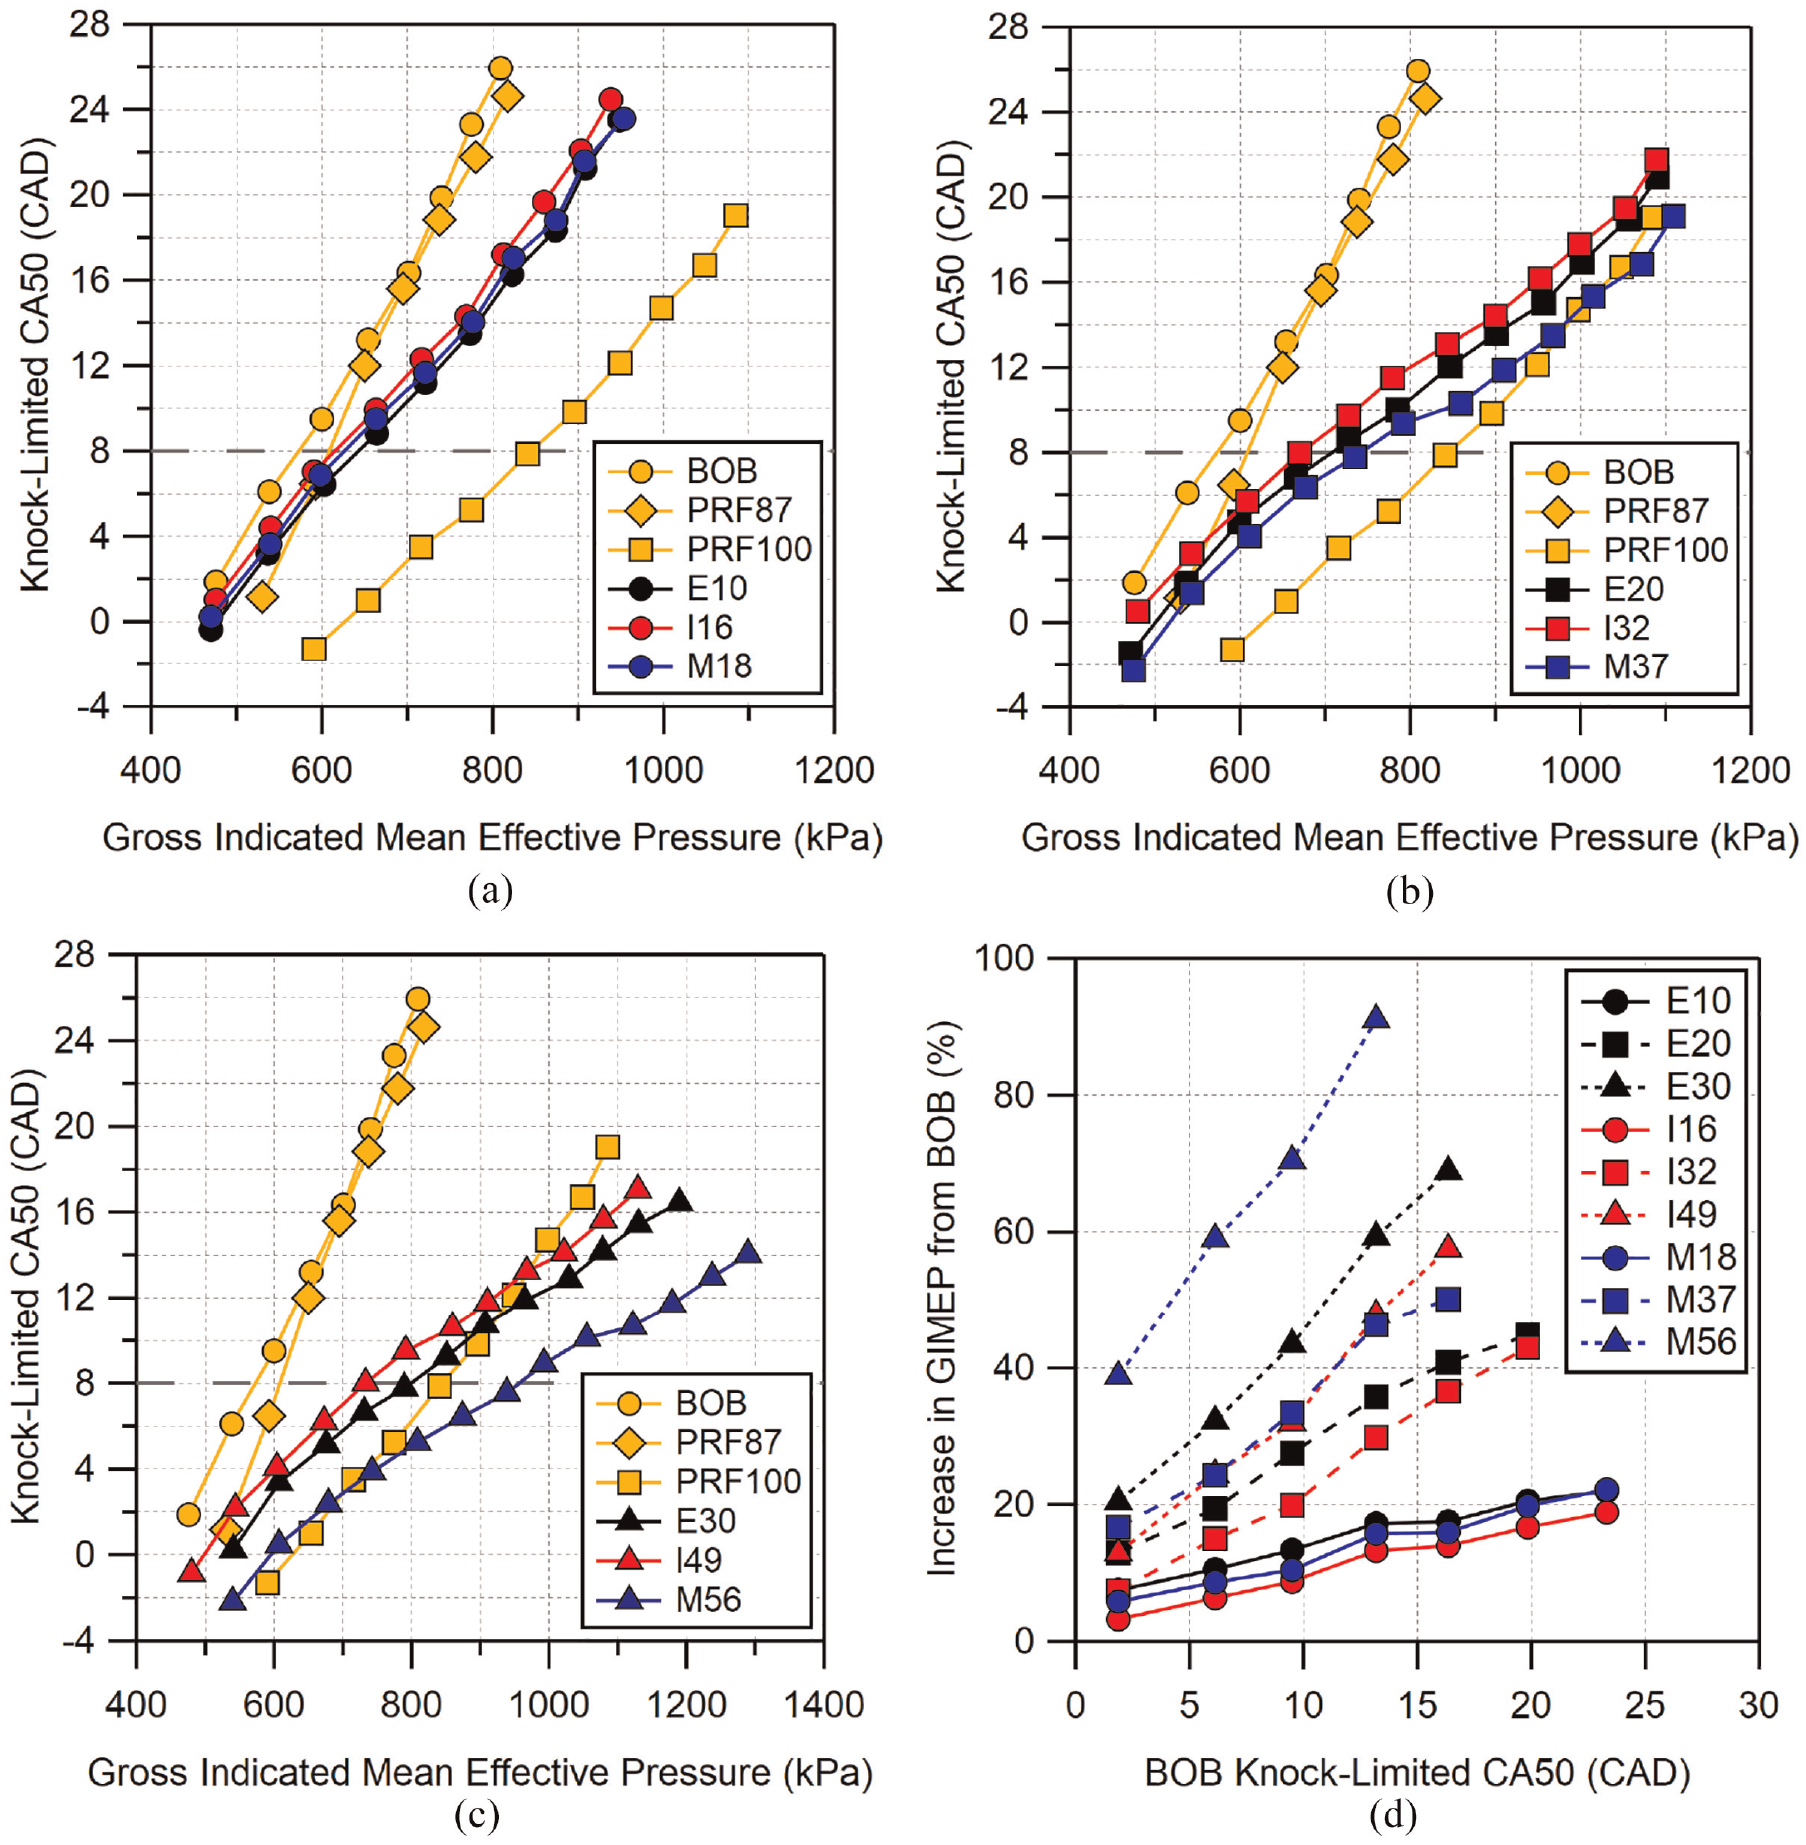
Knock-limited CA50 for all fuels organized by blend level: (a) low-level blends, (b) mid-level blends, and (c) high-level blends. Location of MBT CA50 is indicated by the dashed horizontal line. Improvement from BOB to alcohol blends are shown in (d). Uncertainty in CA50 is estimated to be
As the blend level increases, the difference in knock-limited performance between methylbutenol and the other two alcohol blends also increases. At the mid-blend level, E20 has a marginally better performance than I32. Similarly, M37 has slightly better knock-limited performance compared to E20 at loads below GIMEP = 800 kPa. Above 800 kPa, the knock-limited CA50 of M37 is seen to have a wider margin over E20 up to the highest load tested.
At the highest blend level, E30 has slightly better performance than I49 across the entire load range, the difference between the two remaining approximately constant with knock-limited CA50 with E20 advanced by 1–2 CAD relative to I49. M56 is able to operate at a more advanced combustion phasing compared to both E30 and I49, and is able to be advanced ∼3° further than E30 for loads with GIMEP < 1100 kPa. Above 1100 kPa, the difference between M56 and E30 increases to over 4°.
Figure 6(d) illustrates the improvement in load relative to the BOB for each alcohol blend expressed as a percentage increase compared to the knock-limited load of the neat BOB. The knock-limited GIMEP for each BOB CA50 point was calculated using interpolation from the results for each fuel blend. All of the low-level alcohol blends show similar knock-limited behavior so the increases in load over the BOB are also similar, reaching a 20% increase over BOB for the data shown here. As the alcohol blend levels increase, the differences between the alcohols also increases. For mid-level blends, E20 increases its performance over I32, while M37 is similarly increased over E20. At high-level blends, this trend continues for E30 and I49 while M56 shows significantly improved performance, achieving greater than 90% improvement over BOB in the range in which data were available for interpolation. As the alcohol blend level increases, the slope of the improvement in GIMEP also increases. It can also be seen that the slopes of M37 and M56 appear to be greater than those of their counterparts. It is interesting to note that M37 shows improvement nearly identical to I49, a higher blend level, up to a CA50 of approximately 13 CAD. This corresponds to a load of approximately 950 kPa GIMEP.
Effects of fuel physical properties
Previous work has been performed with these fuel blends to study their relative knock-resistance under similar conditions in the same engine in 8 using the premixed prevaporized combustion mode. 40 In those PMPV experiments, fuel was injected upstream of the engine and completely vaporized while the temperature of the air-fuel mixture was maintained at 60°C. In contrast, for the current experiments only the inlet air supplied to the engine was maintained at 60°C. Thus, the fuel injection and mixture preparation process are expected to affect the results. Testing the same fuels in both premixed and direct-injection combustion allows for the evaluation of each fuel’s “chemical octane” determined from premixed combustion experiments as well as the effect of each fuel’s physical properties, evaluated based on the differences between the PMPV and direct-injection results.
Figure 7 shows the direct-injection knock-limited CA50 results from this work along with the PMPV results from the previous work. Results are shown organized by fuel blend with neat BOB included in all plots. Changes in knock-limited behavior from one fuel’s PMPV result to another fuel’s PMPV results (dashed lines) can be considered improvements in knock resistance due to “chemical octane,” that is, the knock-resistance due solely to the fuel’s auto-ignition kinetics. Changes from a fuel’s PMPV result (dashed line) to its corresponding DI result (solid line) represent the improvement due to the fuel’s physical properties, namely the effect of evaporative cooling during the injection process. It is important to note that, while the evaporative cooling is the primary driver, the change in knock-resistance for a fuel is also dependent on how its kinetics are altered as a result of the change in temperature, that is, the sensitivity of the fuel. Fuels which are more sensitive to the change in temperature will see larger improvement in knock-resistance. Using a similar interpolation analysis as was used for Figure 6(d), the improvement in knock-limited performance, as indicated by the knock-limited CA50, for each fuel when switching from PMPV to DI operation is also shown in Figure 7(d).
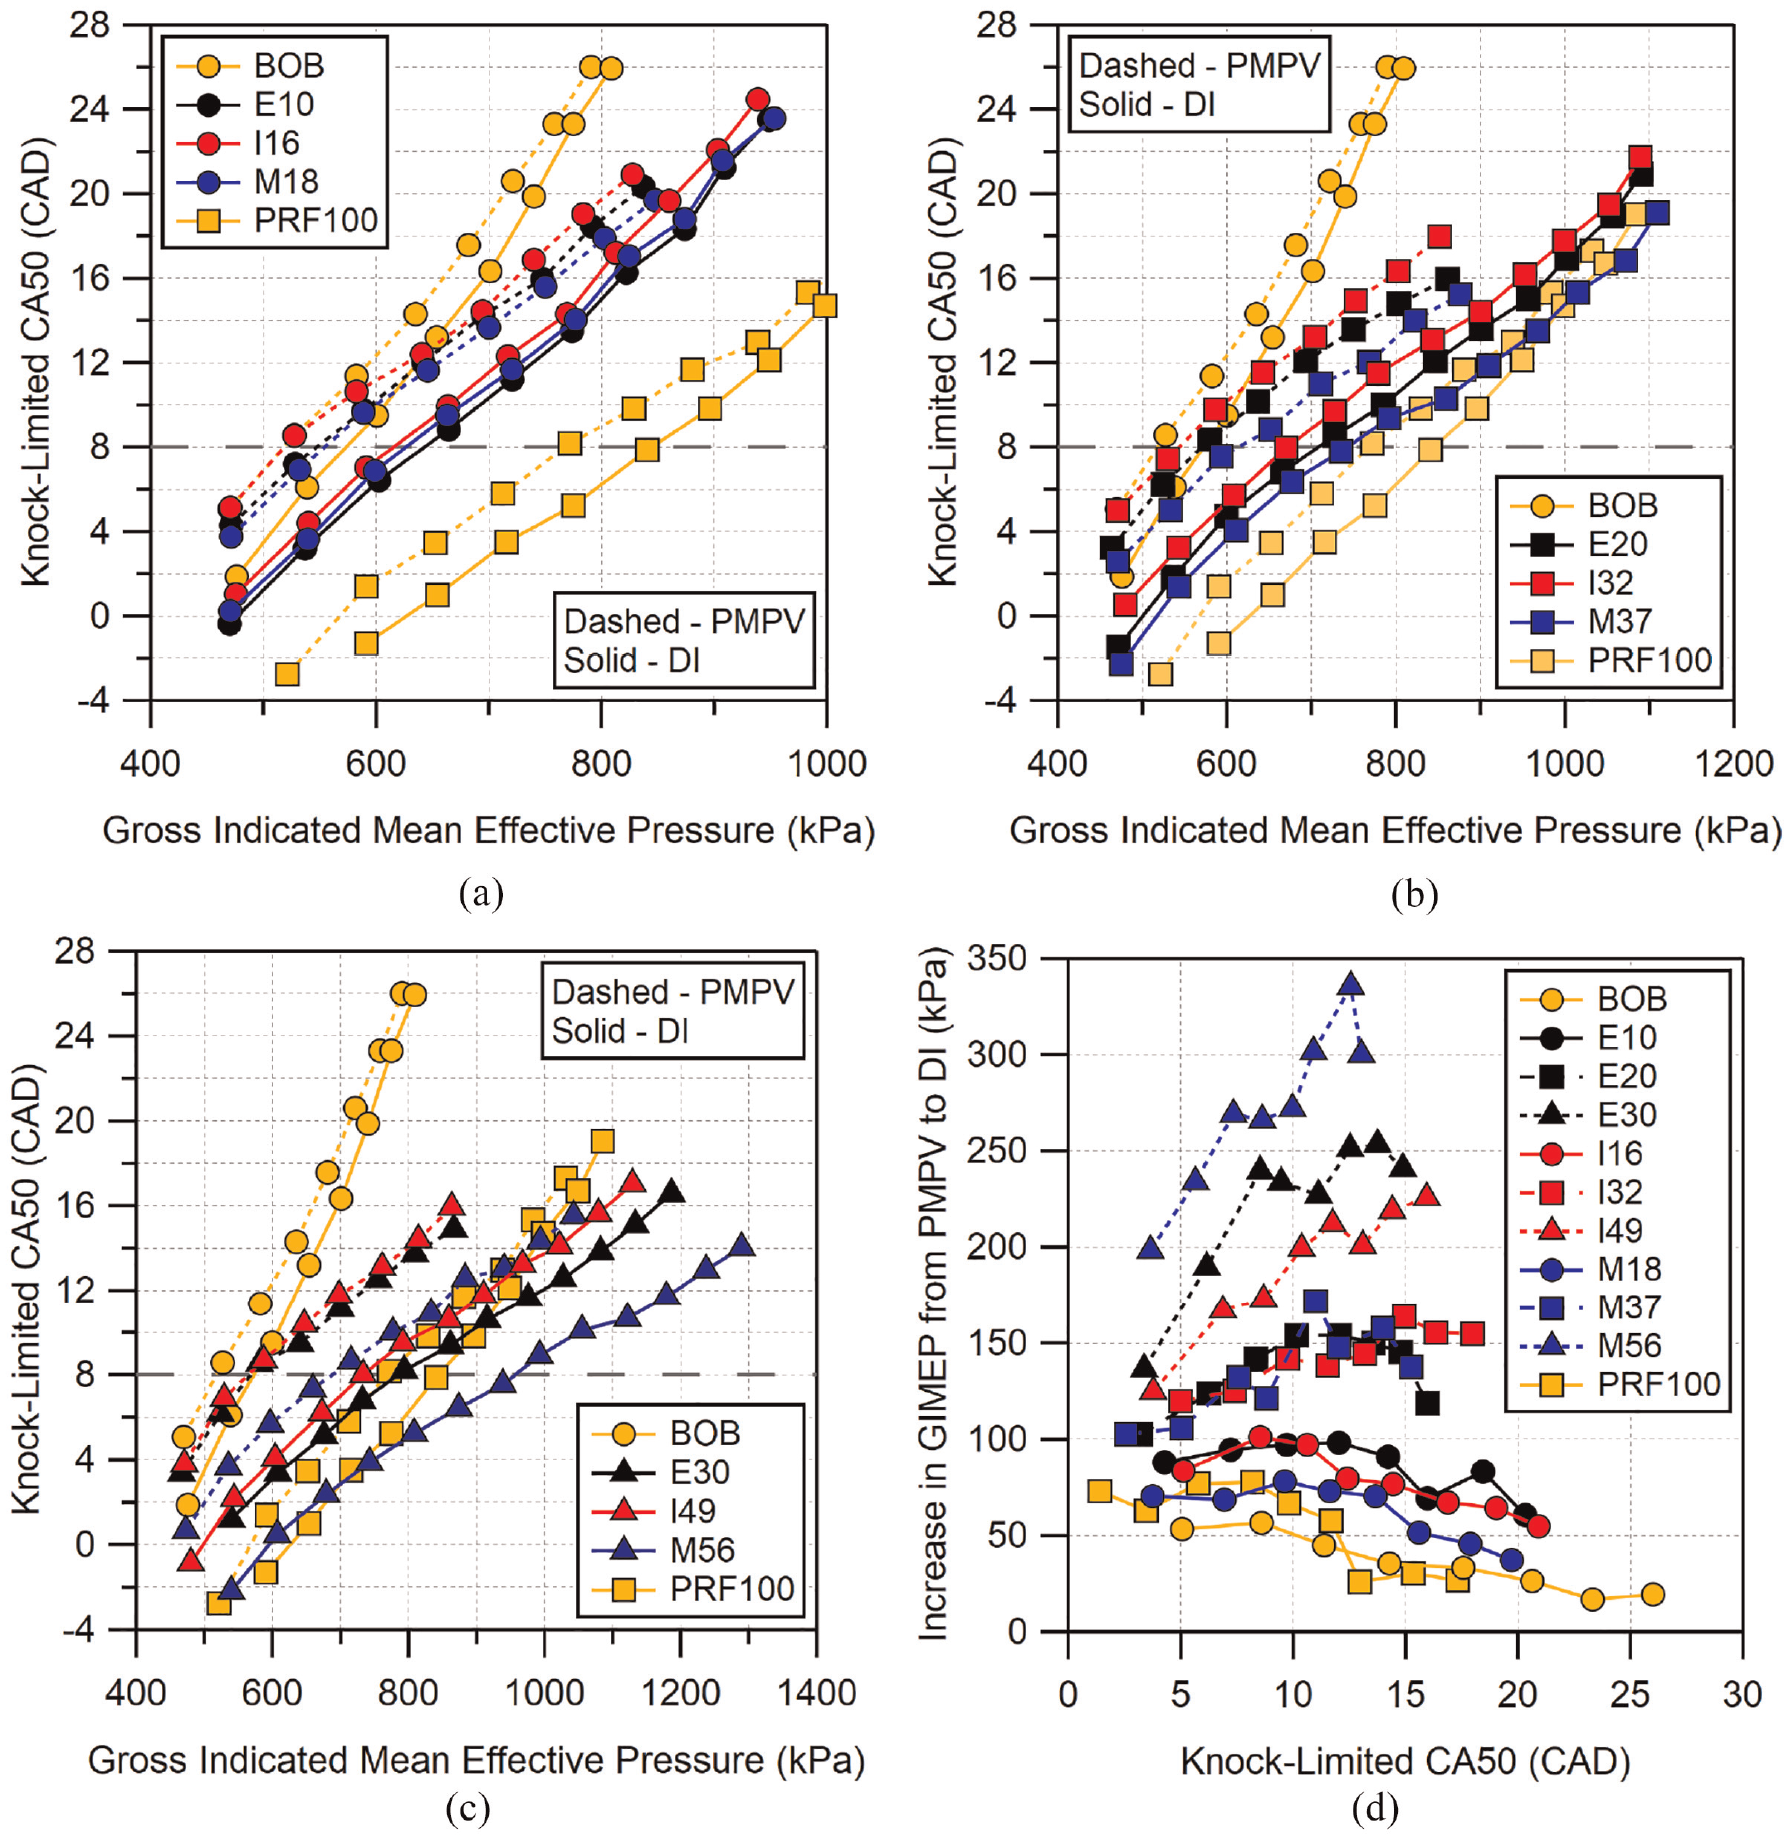
Comparison of knock-limited CA50 under premixed (dashed lines) and direct-injected (solid lines) combustion modes for all fuels organized by blend level: (a) low-level blends, (b) mid-level blends, and (c) high-level blends. Location of MBT CA50 is indicated by the dashed horizontal line. Gain in knock-limited GIMEP from PMPV to DI for all fuels is shown in (d). Uncertainty in CA50 is estimated to be
Gasoline has been shown to provide a noticeable evaporative cooling effect when directly injected in-cylinder,23,41,42 leading to the improvement in knock-limited CA50 seen in Figure 7. However, it can also be seen that the BOB gasoline has the least amount of improvement in knock-limited CA50 when comparing completely premixed prevaporized (PMPV) operation to DI operation. PRF100 shows similar improvements in GIMEP as the BOB with slightly increased improvement at earlier CA50. The low-level alcohol blends of ethanol and isobutanol show a similar level of improvement when going from PMPV to DI operation. It is notable that M18 shows a slightly lower improvement here relative to the other two alcohols, this is likely due to the lower heat of vaporization for M18 relative to E10 and I16 seen in Table 3. On average, the improvement of the low-level blends is approximately 50–75% more than that seen for the BOB gasoline.
For mid-level blends, all three alcohols show similar improvement from PMPV to DI. The improvement here is approximately 50% more than that seen for the low-level blends. Here the methylbutenol improvement is greater than that of ethanol and isobutanol when increasing from the low-level blend to mid-level blend. Unlike the mid-level blends, at the highest blend level there is a significant difference between the three alcohols. At low loads, E30 and I49 show similar improvements in knock resistance. However, as load increases, E30 shows a larger increase in knock-limited GIMEP when going from PMPV to DI operation. The increase in performance from PMPV to DI for E30 and I49 is approximately 30% and 60% greater on average than the improvements seen by the mid-level blends of each fuel, respectively. Conversely, M56 shows a peak improvement of over 120% and average of nearly 90% over M37. Neither E30 or I49 are able to achieve similar levels of improvement in knock-limited GIMEP.
The majority of the improvement in knock-limit with direct-injection operation over premixed prevaporized operation is expected to come from the evaporative cooling offered by the direct-injection process. A number of studies have looked at the effect of charge cooling on octane number and knock for ethanol–gasoline blends.14,21,23,43 Neat ethanol has a significantly higher, approximately three times, heat of vaporization than the BOB gasoline. Likewise, while lower than ethanol, the heats of vaporization of neat isobutanol and methylbutenol are still nearly twice that of the gasoline. The heats of vaporization for all of the fuel blends were calculated using a volumetric linear blending rule using an assumed value of 300 kJ/kg for the BOB gasoline. The resulting values are shown in Figure 8(a) on a kJ/kg air basis for stoichiometric mixtures as well as normalized to BOB in 8b.
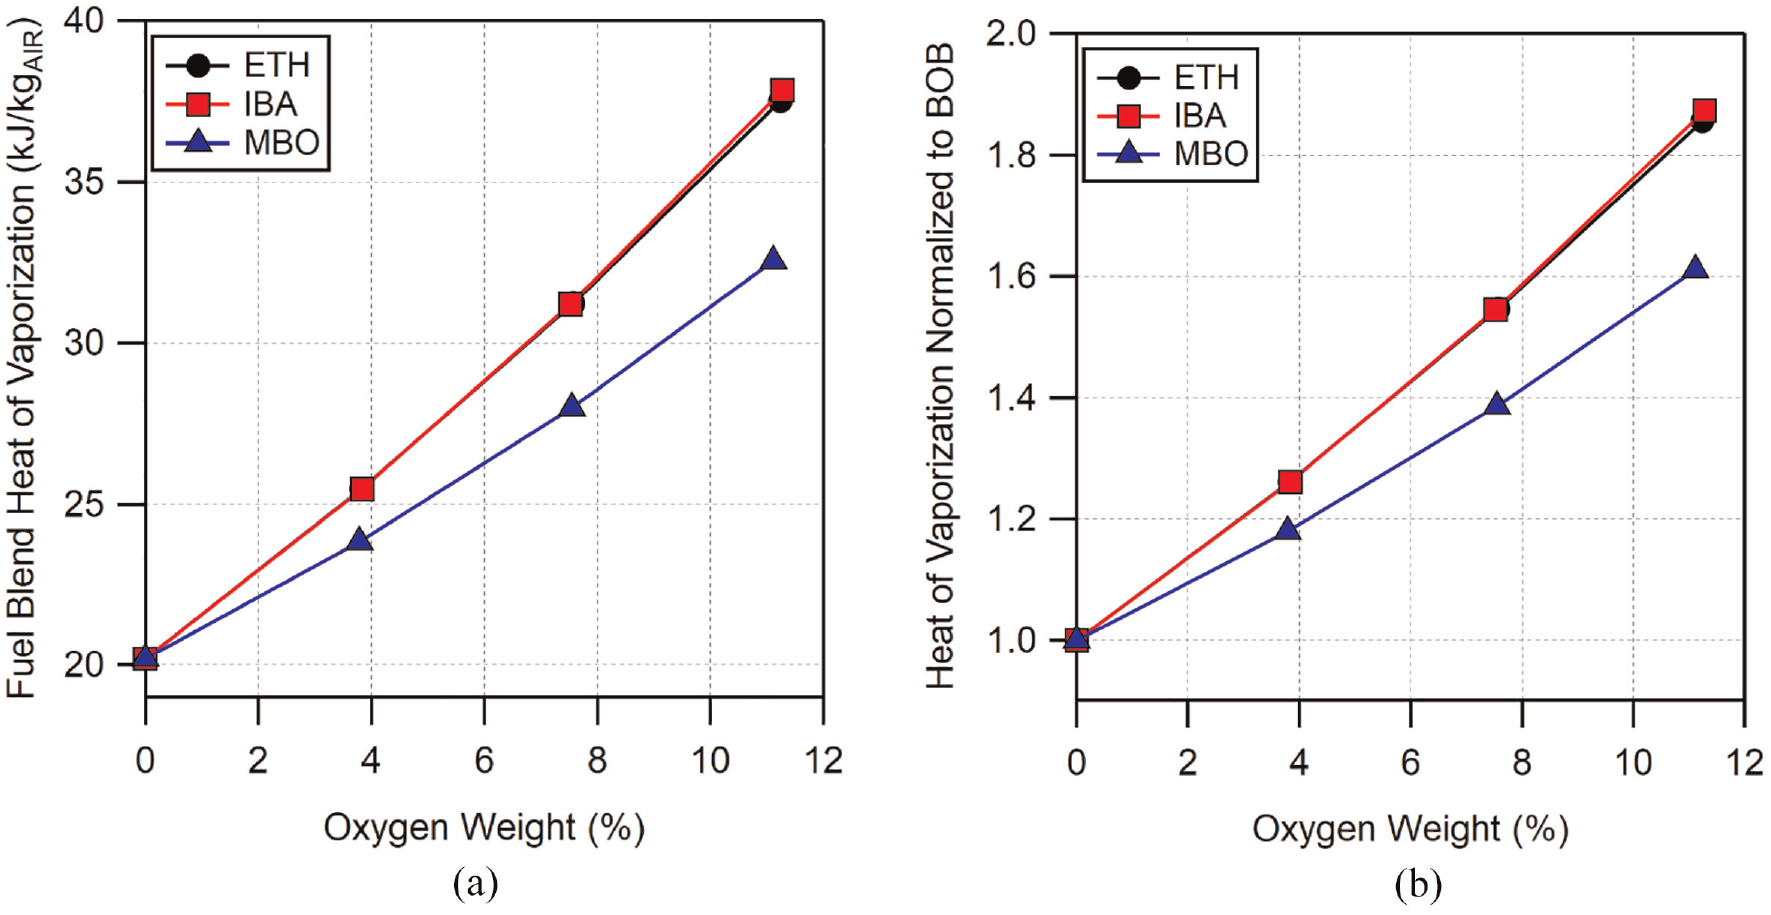
Estimated heats of vaporization for (a) all fuel blends per kg of air in a stoichiometric mixture and (b) heats of vaporization normalized to BOB gasoline. Heat of vaporization of BOB gasoline was assumed to be 300 kJ/kg.
The overall trends shown in Figure 8 are in-line with expectations based on the heats of vaporization for the neat fuels. Moreover, the change in the heat of vaporization of the BOB gasoline from ethanol addition agrees with other reports in the literature.14,43 For any given blend level, ethanol and isobutanol blends have the highest heat of vaporization. The lower HOV of isobutanol compared to ethanol is balanced by the increase in volume leading to similar end values. Methylbutenol blends, on the other hand, have consistently lower HOV. At the highest blend levels, E30 and I49 have nearly 1.9 times the heat of vaporization of the BOB while methylbutenol is just over 1.6 times. The high heat of vaporization of E30 could help to explain its significant improvement in knock-limited performance. Isobutanol blends have similar heats of vaporization to ethanol blends; however, its matched heat of vaporization may not be enough to make up for its reduced chemical knock-resistance compared to ethanol. Conversely, M56, which has the largest performance increase, has the lowest heat of vaporization of the three alcohols. In Figure 7 it can be seen that the difference in knock resistance between ethanol and methylbutenol blends appears to be constant between PMPV and DI operation. This would seem to indicate that the improvement in the knock-limit of methylbutenol over ethanol is mostly due to differences in “chemical octane” and less due to differences in evaporative cooling.
To estimate the evaporative cooling effect for these fuel blends, the bulk cylinder temperature was calculated at the time of intake valve closing (IVC, −160 CAD) and at −40 CAD. The timing for the fuel injection ends at −280 CAD during the intake stroke which is characteristic for early-injection, homogeneous engine operation. The early injection timing allows for much of the evaporation to occur before IVC at −160 CAD. The amount of fuel evaporation, and evaporative cooling effect, would be impacted if the fuel were injected after IVC. Since the end of injection time (EOI) is fixed, as load increases, the increase in fuel injection duration causes the time of start of injection (SOI) to become further advanced, effectively increasing the time for mixing and evaporation. The temperatures at IVC and at −40 CAD are shown for all fuels and conditions in Figure 9(a) and (b) for DI operation and Figure 9(c) and (d) for PMPV operation, all plotted against GIMEP.
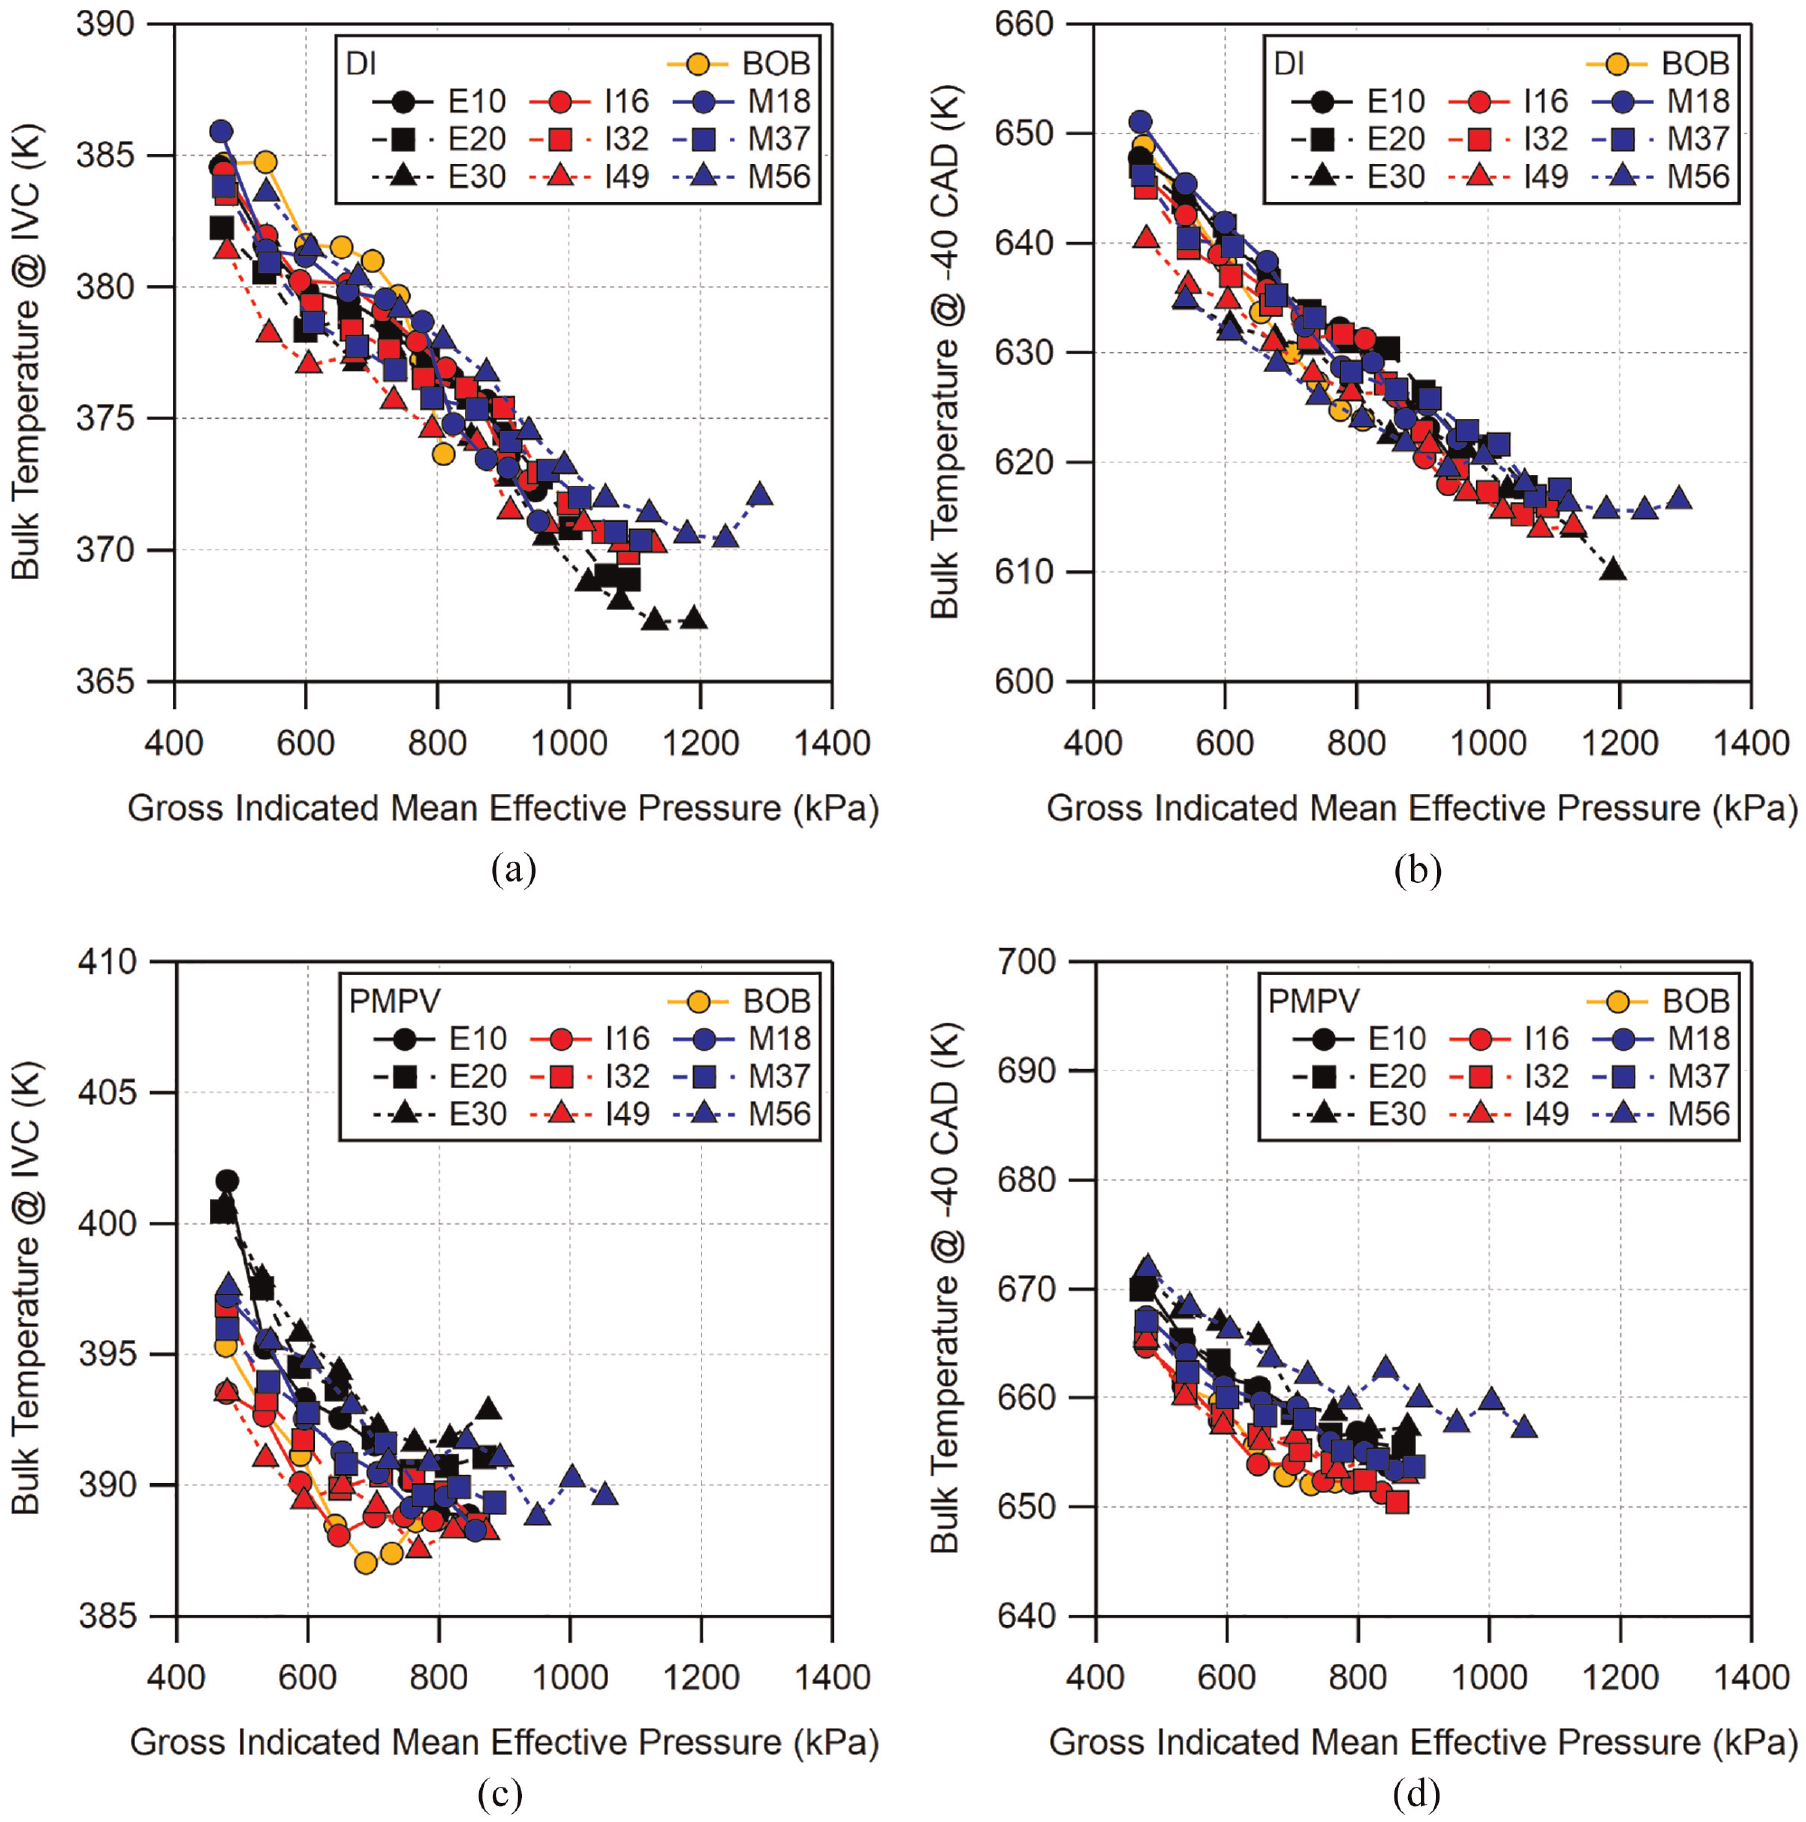
Calculated bulk temperature at time of (a) (c) intake valve closing (−160 CAD) and (b) (d) −40 CAD for all fuel blends under (a) (b) direct-injection and (c) (d) premixed prevaporized operation.
Comparing the calculated temperatures for both engine operating modes at IVC can help identify changes in mixture preparation due to direct-injection immediately following the injection process. Here, all of the fuels are shown to have similar temperatures at IVC for a given load and injection mode, and all follow a similar trend of decreasing temperature with increasing load. The IVC temperature for the DI cases are, on average, ∼13 K below that of the PMPV cases due to evaporative cooling. The decrease in IVC temperature with load appears to be similar for both PMPV and DI. This is likely the result of diminishing exhaust residual fraction as intake pressure is increased. The IVC temperatures in the PMPV cases appear to reach a minimum as the load approaches the maximum at ∼800 kPa GIMEP. Interestingly, the DI cases appear to also show a similar behavior near 800 kPa GIMEP before continuing to decrease, though not as pronounced. This behavior could indicate the point at which heat transfer from in-cylinder surfaces begins to exceed the decrease in residuals resulting in a net heating effect. For DI conditions, only E30 and M56 appear to reach this condition at their maximum loads.
At −40 CAD, the range of calculated bulk temperatures increases to span approximately 10 K across all of the fuels at the lowest air flow rate and reduces as the air flow is increased. PMPV conditions have a similar range of temperatures as DI but the temperatures are elevated approximately 25 K. The average difference between the PMPV and DI temperatures has increased to ∼25 K from the ∼13 K seen at IVC, indicating a smaller compressive temperature increase for DI than PMPV. Similar to the IVC temperature results, all fuels follow the same general behavior with no obvious trend between the different fuels.
The temperature data shown in Figure 9 are generally grouped together and, on average, the PMPV temperatures were higher than the DI temperatures. To more closely examine the effect of each fuel when changing operation from PMPV to DI, the change in temperature for each fuel is shown in Figure 10 at both IVC and −40 CAD. At IVC, the BOB and I16 show the lowest change in temperature. E20 and E30 (and M56 at higher loads) appear to exhibit the greatest temperature change, while the rest of the fuels fall together in between. The uncertainty for the difference in IVC temperature is approximately 3 K. The temperature deltas seen in Figure 10(a) generally fall within each other’s uncertainty from one fuel to the next. However, the overall range exceeds the uncertainty, indicating that the differences may be significant. At −40 CAD, larger differences can be seen. Compared to IVC, I16 now has the smallest difference in temperature from PMPV to DI. However, the temperature difference for the BOB has increased and is now grouped with the majority of the fuels. E30 and M56 show the most significant change in temperature across the load range. Uncertainty for the −40 CAD temperature deltas is approximately 7 K. All of the fuels, excluding E30 and M56, are all within each other’s uncertainty making it difficult to identify trends among these fuels with high confidence. E30 and M56, on the other hand, are sufficiently far from the group that the difference in temperature delta seen for these two is likely significant.
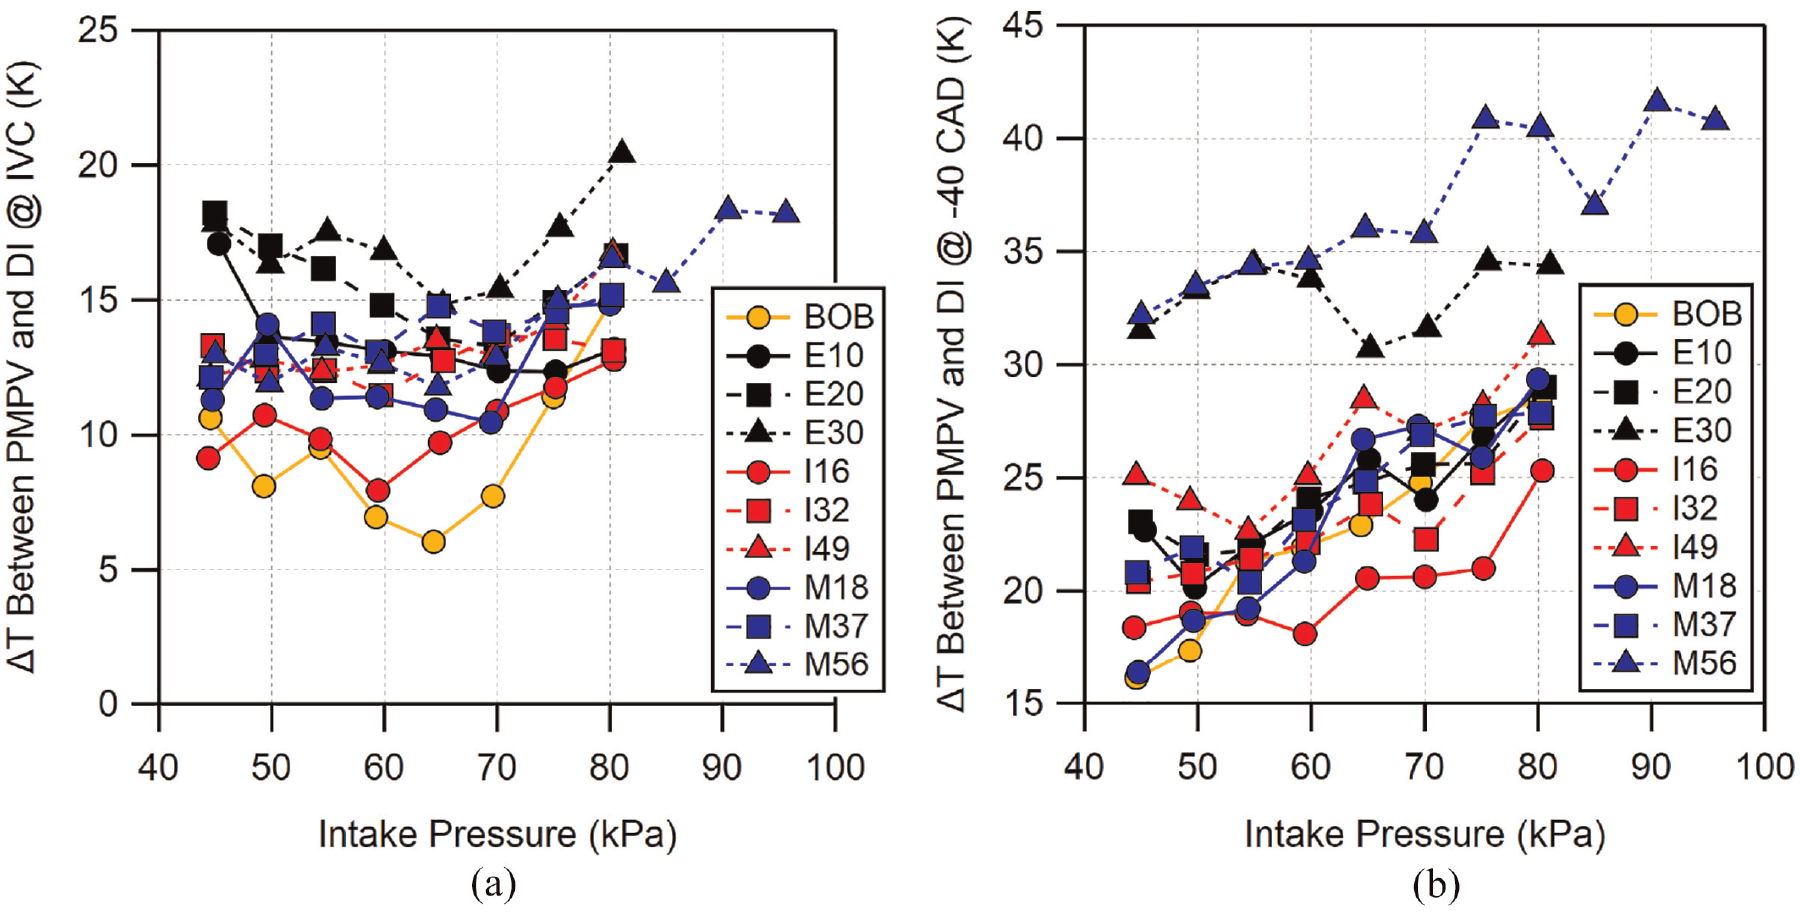
Difference in temperature between PMPV and DI operation at (a) intake valve closing (−160 CAD) and (b) −40 CAD. The uncertainty is approximately 3 K for IVC temperature delta and approximately 7 K for temperature delta at −40 CAD. Error bars have been omitted for clarity.
The temperature differences seen at −40 CAD agree with the improvements in knock-limited operation shown in Figure 7. The BOB, low-, and mid-level blends all have similar change in temperature from PMPV to DI and have similar improvements in knock-limited behavior. Differences in knock-limit for these fuels can be attributed to their different sensitivities. Fuels with higher sensitivity will more greatly benefit from the change in temperature. E30 and M56 have the greatest temperature change and also show the greatest improvement in knock-limited load from PMPV to DI. I49 does not have as great of a temperature change compared to E30 or M56, though it is at the upper end of the middle group of fuels. Its high sensitivity likely allows it to still have the third highest load improvement as shown in Figure 7(d). It is interesting to note I16′s similar temperature change to the BOB at IVC and its lower temperature change at −40 CAD, although the significance is difficult to know given the uncertainty that exists in these estimates.
Octane index and K
Previously, it was shown that M37 displayed a knock-limited CA50 which matched PRF100 despite M37 having a lower RON. This could be indicative of
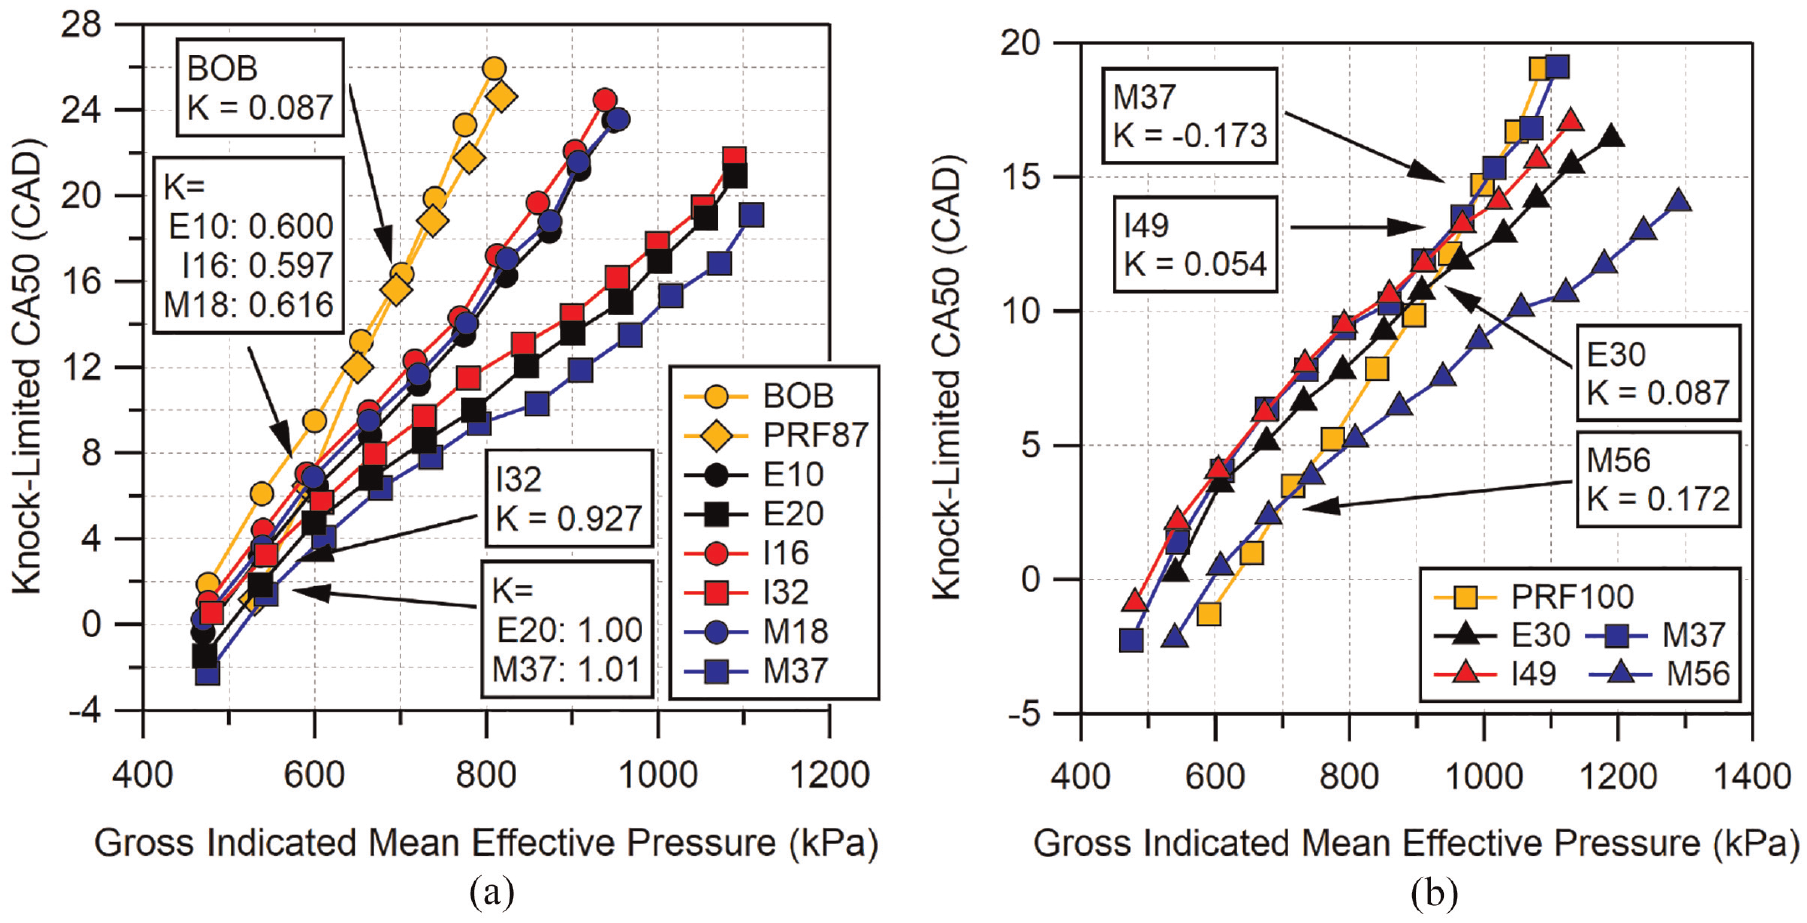
K-values for fuels at: (a)
With the exception of the BOB gasoline, fuels which cross PRF87 in Figure 11(a) do so at the lower end of their tested loads. All of the low-level alcohol blends cross PRF87 at loads between 580 and 600 kPa GIMEP. At these points,
The
Four fuels were able to cross the knock-limited CA50 curve of PRF100. These were M37, E30, I49, and M56. M37, E30, and I49 reached the
The
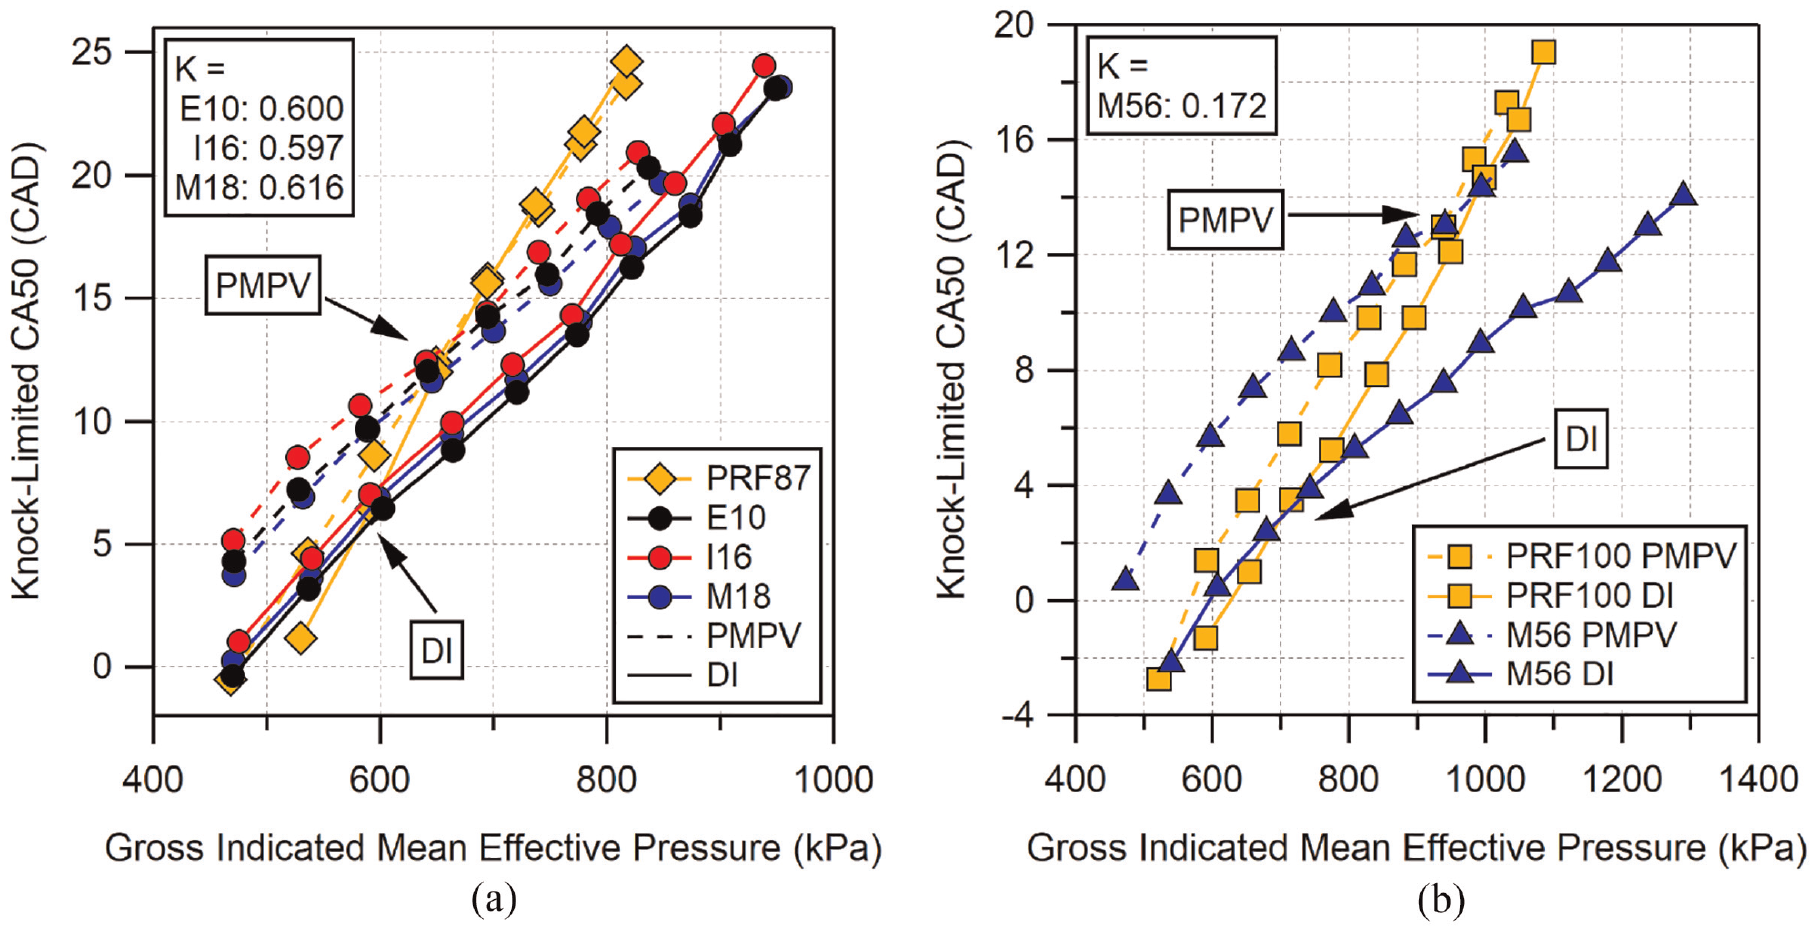
Comparison of similar
Looking at M56 in Figure 12(b),
For modern direct-injected engines,
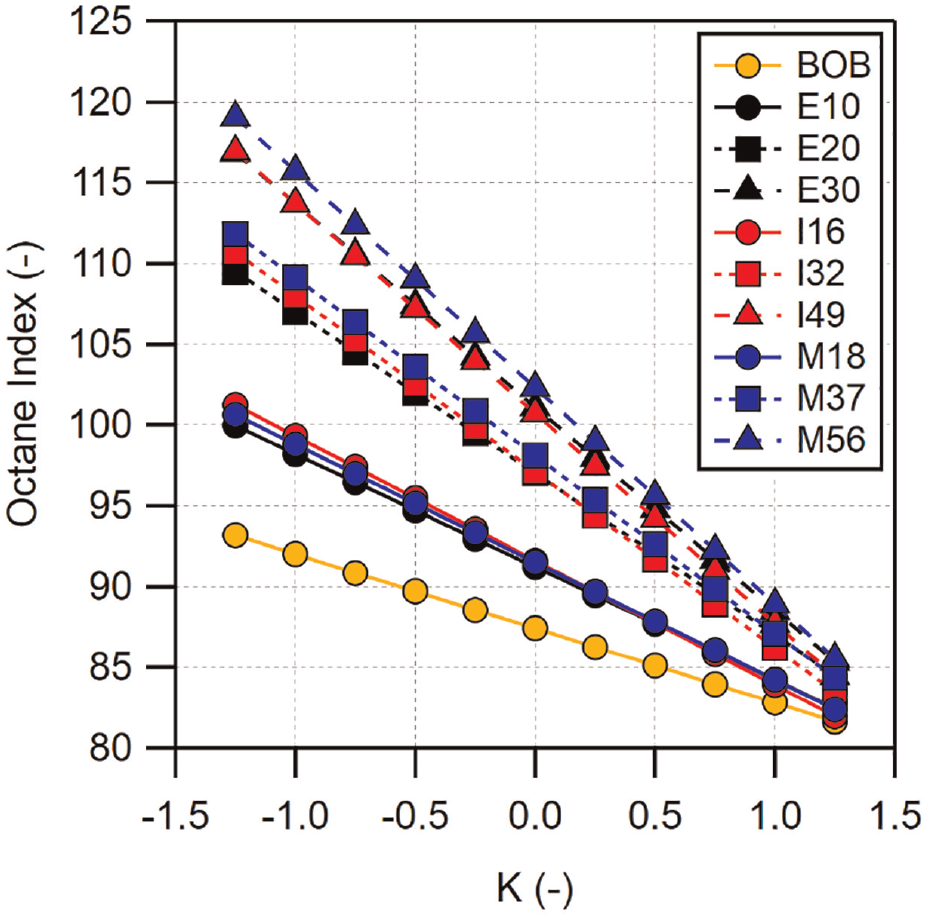
Expected values of octane index for a given
Pre-spark heat release
Previous studies in the literature have shown that low-temperature heat release (LTHR) can occur in spark-ignition engines before the spark has initiated the main high-temperature heat release.47–49 This has come to be known as pre-spark heat release (PSHR). In the previously referenced PMPV experiments, it was noted that most of the fuels displayed some level of pre-spark heat release. To examine the effect of direct-injection on the pre-spark heat release, the heat release near spark time was examined. The fuels which exhibited the most PSHR were the BOB and PRF87. The heat release plots for all of the conditions for these two fuels are shown in Figure 14. In the figure, the heat release rate is scaled by the total fuel energy, the crank angle timing is aligned by the location of CA10, and the location of spark timing is indicated by markers.
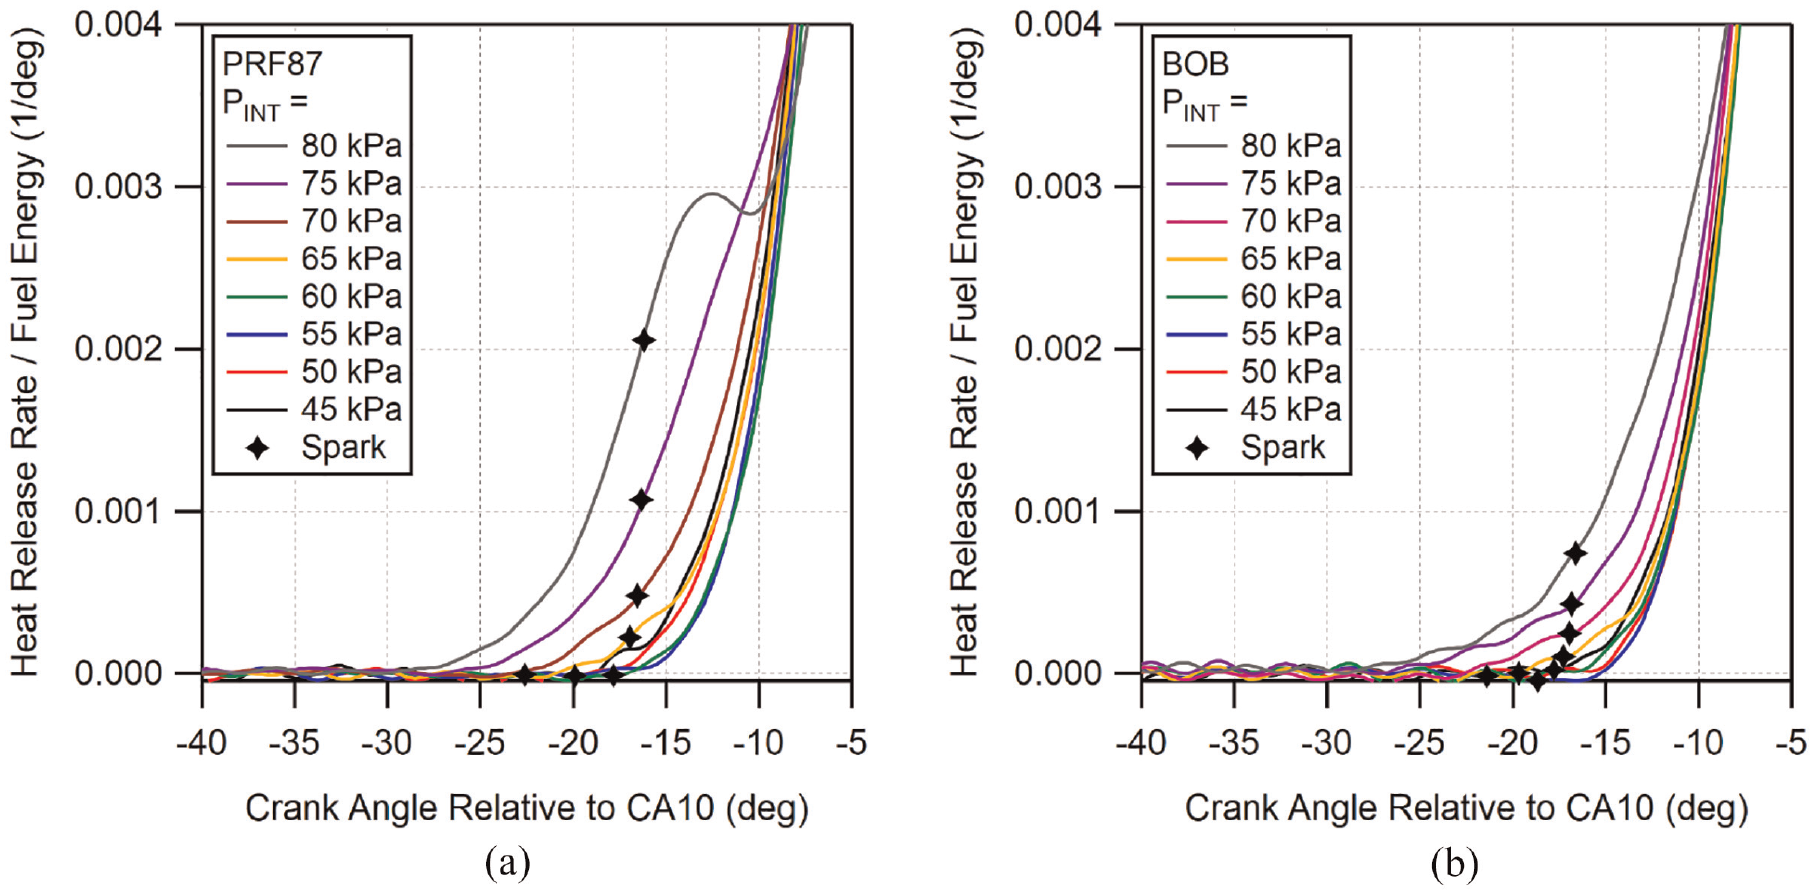
Early heat release rate plots for: (a) PRF87 and (b) BOB at all DI conditions. Crank angle time is aligned by CA10 and heat release rate is scaled by fuel energy. Locations of spark timing are indicated with markers.
As can be seen in both figures, the pre-spark heat release for each fuel is non-existent for low loads and begins to increase incrementally as the intake pressure exceeds 65 kPa. PRF87 shows significantly stronger PSHR compared to the BOB for all conditions where PSHR is visible, with PRF87 also displaying an inflection point in the heat release rate after spark at the highest tested intake pressure case. To compare the PSHR behavior of these fuels between PMPV and DI operation, the 80 kPa cases for both fueling methods and both PRF87 and the BOB are shown in Figure 15. Plotted in the figure are both the scaled heat release rate as well as the normalized cumulative heat release.
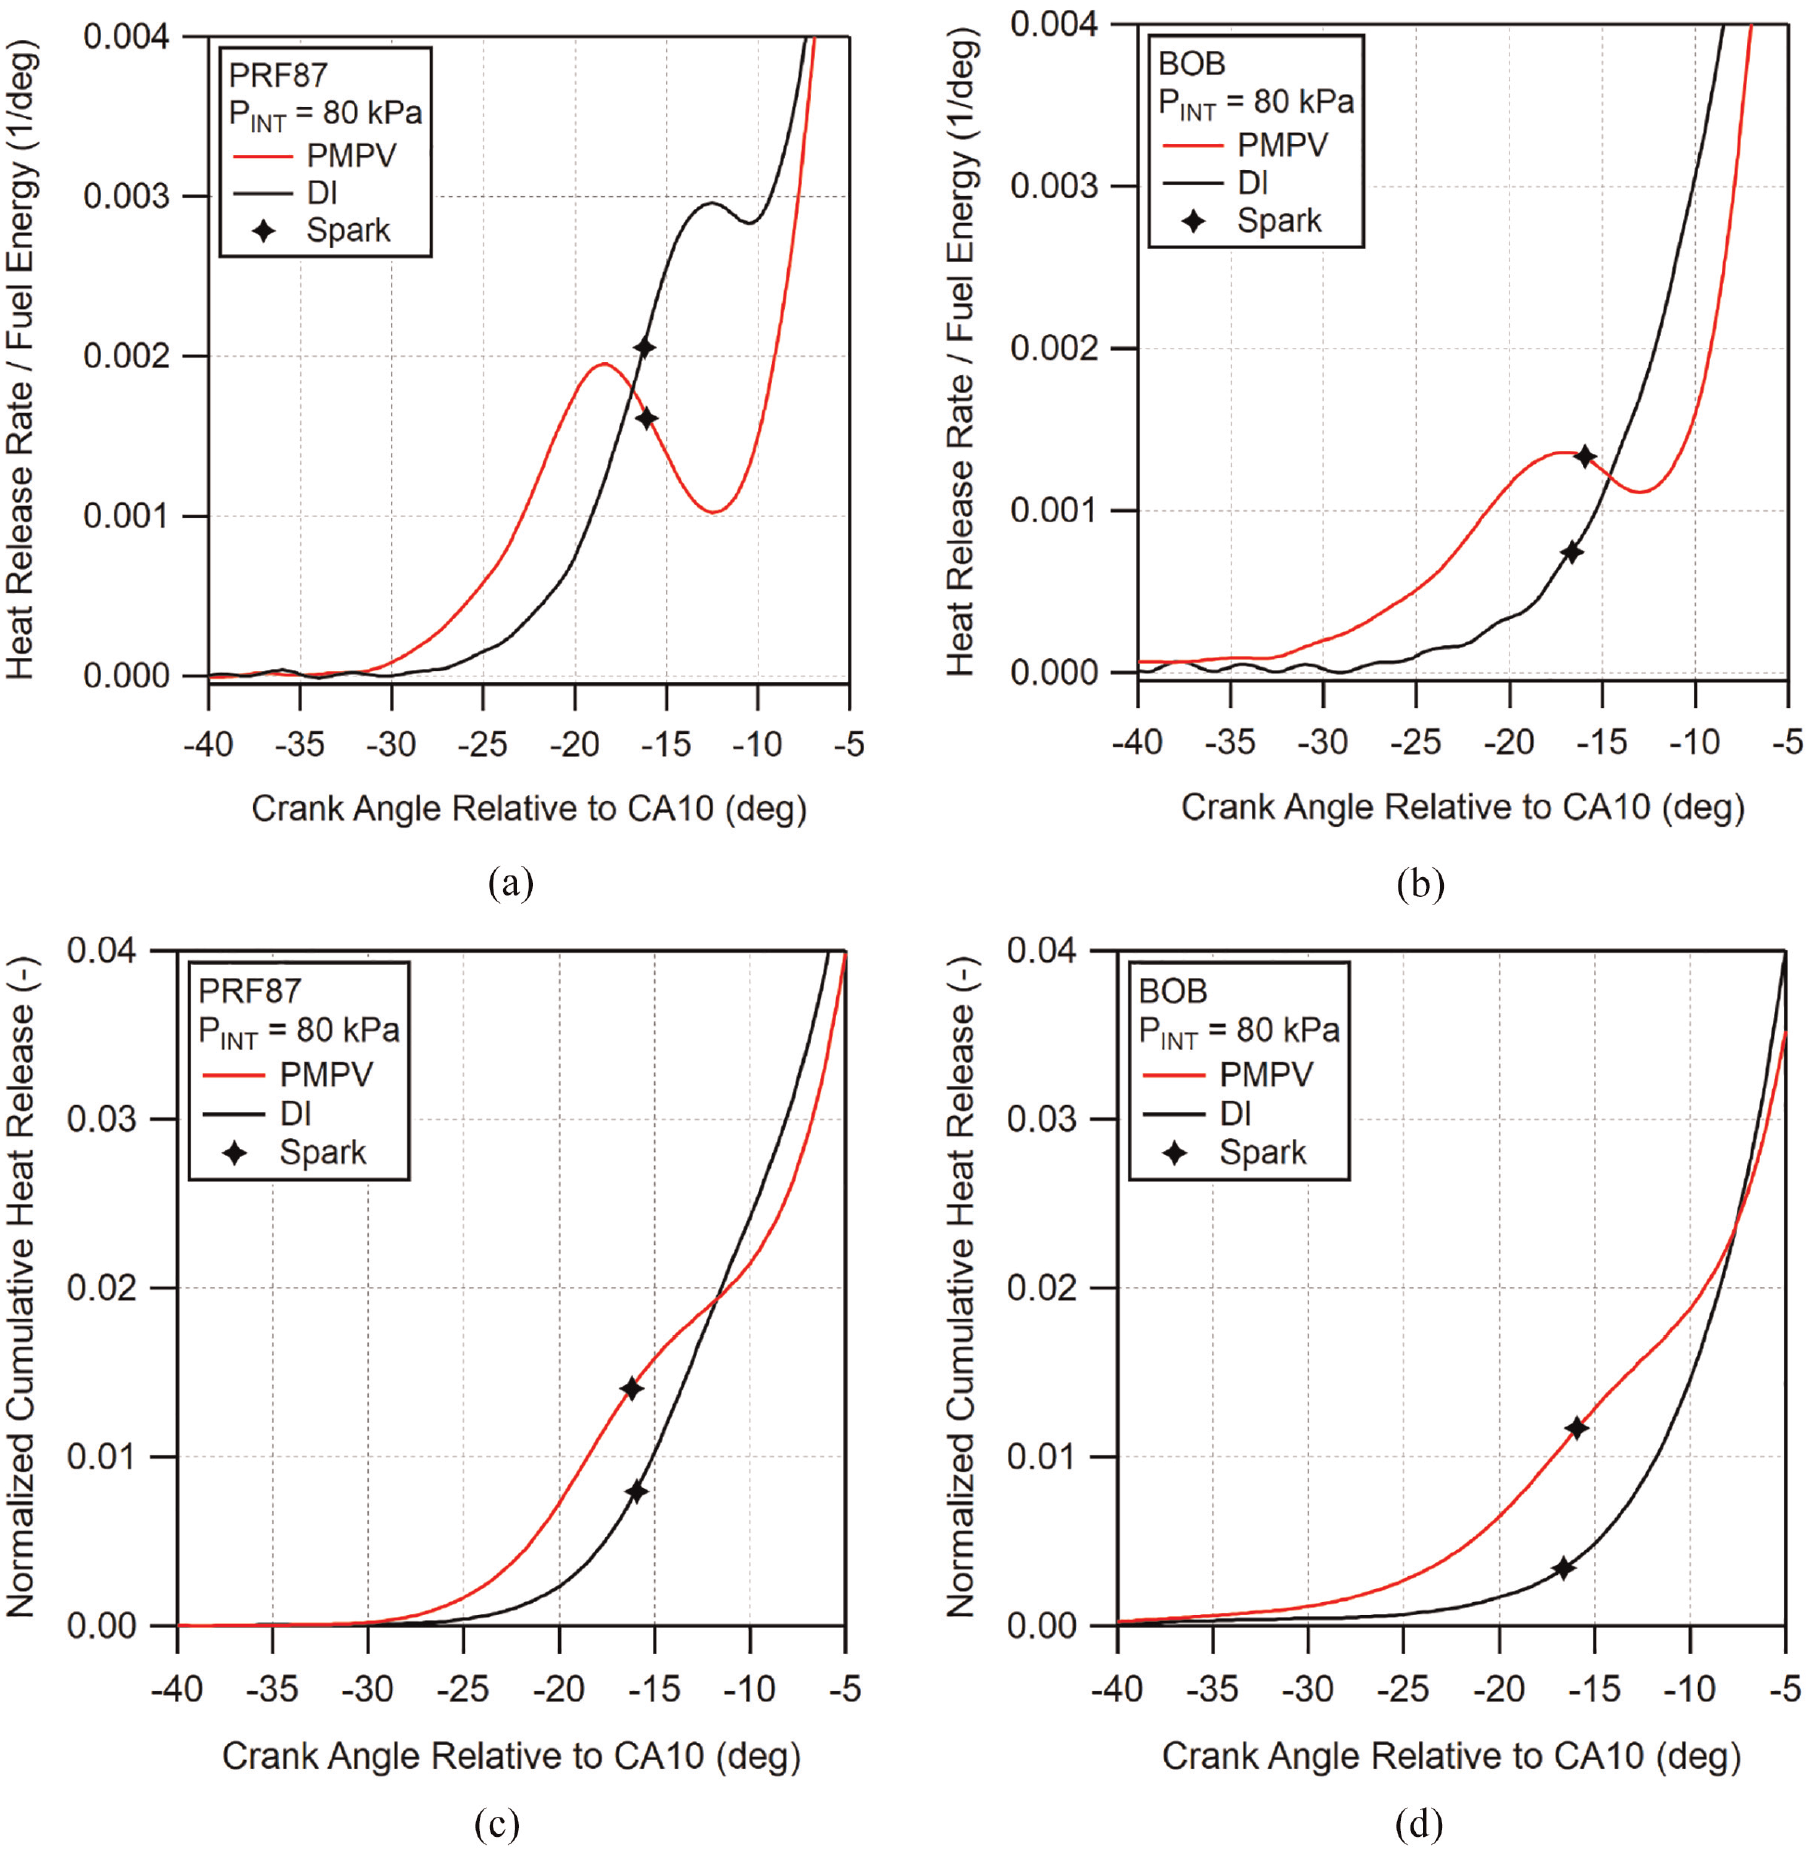
(a) (b) Early heat release rate and (c) (d) normalized cumulative heat release plots for (a) (c) PRF87 and (b) (d) BOB comparing PMPV and DI operation at the 80 kPa intake pressure condition. Crank angle time is aligned by CA10 and heat release rate is scaled by fuel energy. Locations of spark timing are indicated with markers.
For both fuels, it can be seen that under premixed operation, the pre-spark heat release begins earlier and increases more rapidly than under DI operation. This results in greater initial cumulative heat release for the PMPV cases. The cumulative heat release for the DI cases do not catch up until the cumulative heat release reaches roughly 2% which occurs at approximately 5° and 8° after spark for PRF87 and BOB, respectively.
As was just shown, direct-injection reduced the amount of pre-spark heat release when compared to PMPV operation for both the BOB gasoline and PRF87. To examine the effect of alcohol addition on the pre-spark heat release of the direct-injected BOB, similar heat release plots are shown in Figure 16 for intake pressure conditions of 80, 90, 100, 105, and 110 kPa. Note that not all fuels are represented at all of the conditions due to their knock-limited behavior. In the figure, it is clear that the addition of all three alcohols significantly reduces the pre-spark heat release which was seen for the BOB gasoline. The lowest alcohol blends display noticeable but reduced PSHR up to 90 kPa intake pressure, their highest pressure condition. In comparison, at this pressure, mid-level blends display further reduced PSHR and high-level alcohol blends show none. At 100 kPa intake pressure, mid-level blends are increased relative to the 90 kPa condition and E30 and I49 are reduced relative to their mid-level blends. Conversely, M56 shows no sign of PSHR at this pressure. At the highest pressures, shown in Figure 16(d), M56 continues to display no evidence of PSHR. Ethanol addition has been shown to reduce the amount of low temperature heat release in other studies50,51 and that observation is mirrored here. However, comparatively, M56 appears to reduce PSHR beyond that of E30 for the loads tested here.
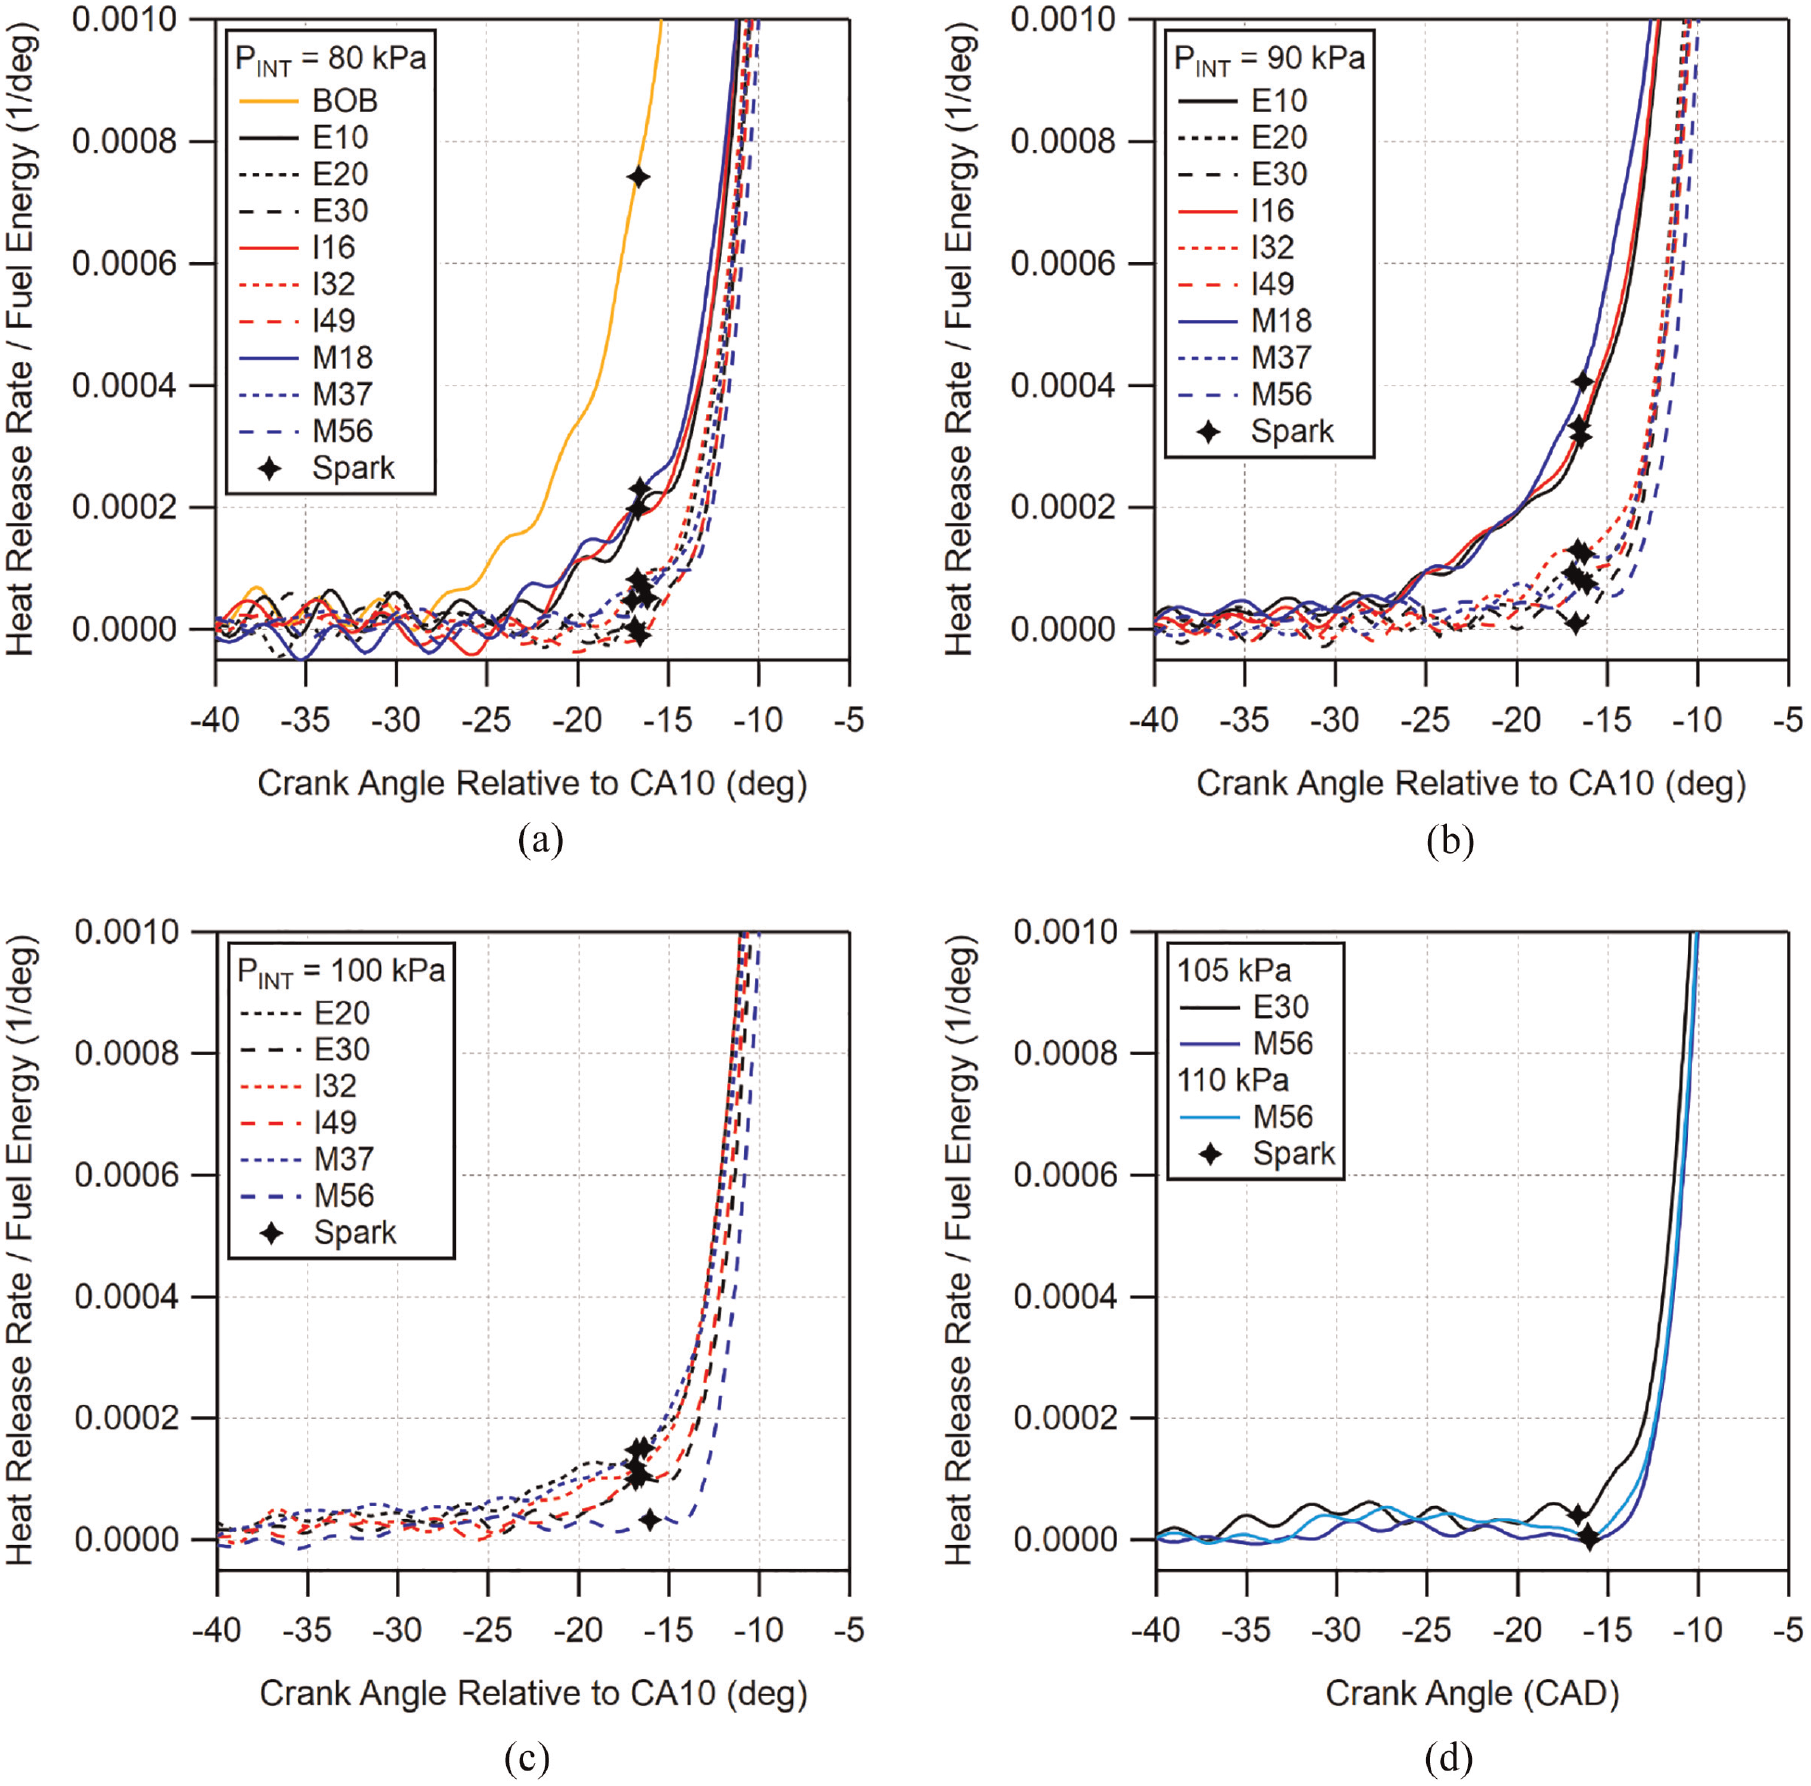
Early heat release rate plots for intake pressure conditions of: (a) 80, (b) 90, (c) 100 kPa, and (d) 105 and 110 kPa. Crank angle time is aligned by CA10 and heat release rate is scaled by fuel energy. Locations of spark timing are indicated with markers.
Combustion variability and duration
The coefficient of variation (COV) of GIMEP for all of the fuels is shown in Figure 17 plotted against knock-limited load. Load points which are advanced beyond MBT have been omitted as their COVs are greater than the minimum which occurs at MBT timing. In general, low- and mid-level blends have similar COVs for a given load. It is important to point out that, due to knock-limited CA50 being associated with different loads depending on the fuel blend, the comparison should be primarily limited to fuels with similar load and combustion phasing. For low- and mid-level blends, as has been seen in Figure 6 and can be seen in Figure 17, their conditions are somewhat similar. However, the combustion phasing of M56 for a given load is significantly more advanced than E30 and I49 and may be the least comparable as a result. For the low-level blends, all three alcohols have a similar range of COV compared to the BOB due to their similar knock-limited load range. For mid-level blends, all three fuels have similar COVs. However, M37 appears to be slightly better than the I32 for higher loads, likely due to its ability to operate at more advanced combustion phasings. E20 is in between the two, bettering I32 at lower loads but matching it at higher loads. For high-level blends, E30 and I49 have similar COVs due to their similar knock-limited load and phasing. M56, on the other hand, has lower COVs, compared to E30 and I49, all of which are at higher loads. In general, the trend in COV is driven by the knock resistance of each fuel. Fuels which are more knock resistant are able to operate at more advanced combustion phasing which leads to more optimal spark timing and lower COV. Fuels with similar knock-limited behavior will operate at similar loads and combustion phasings, leading to similar variations in GIMEP. This indicates that the fuels have minimal to no impact on COV when the operation is not knock-limited and MBT phasing can be used.
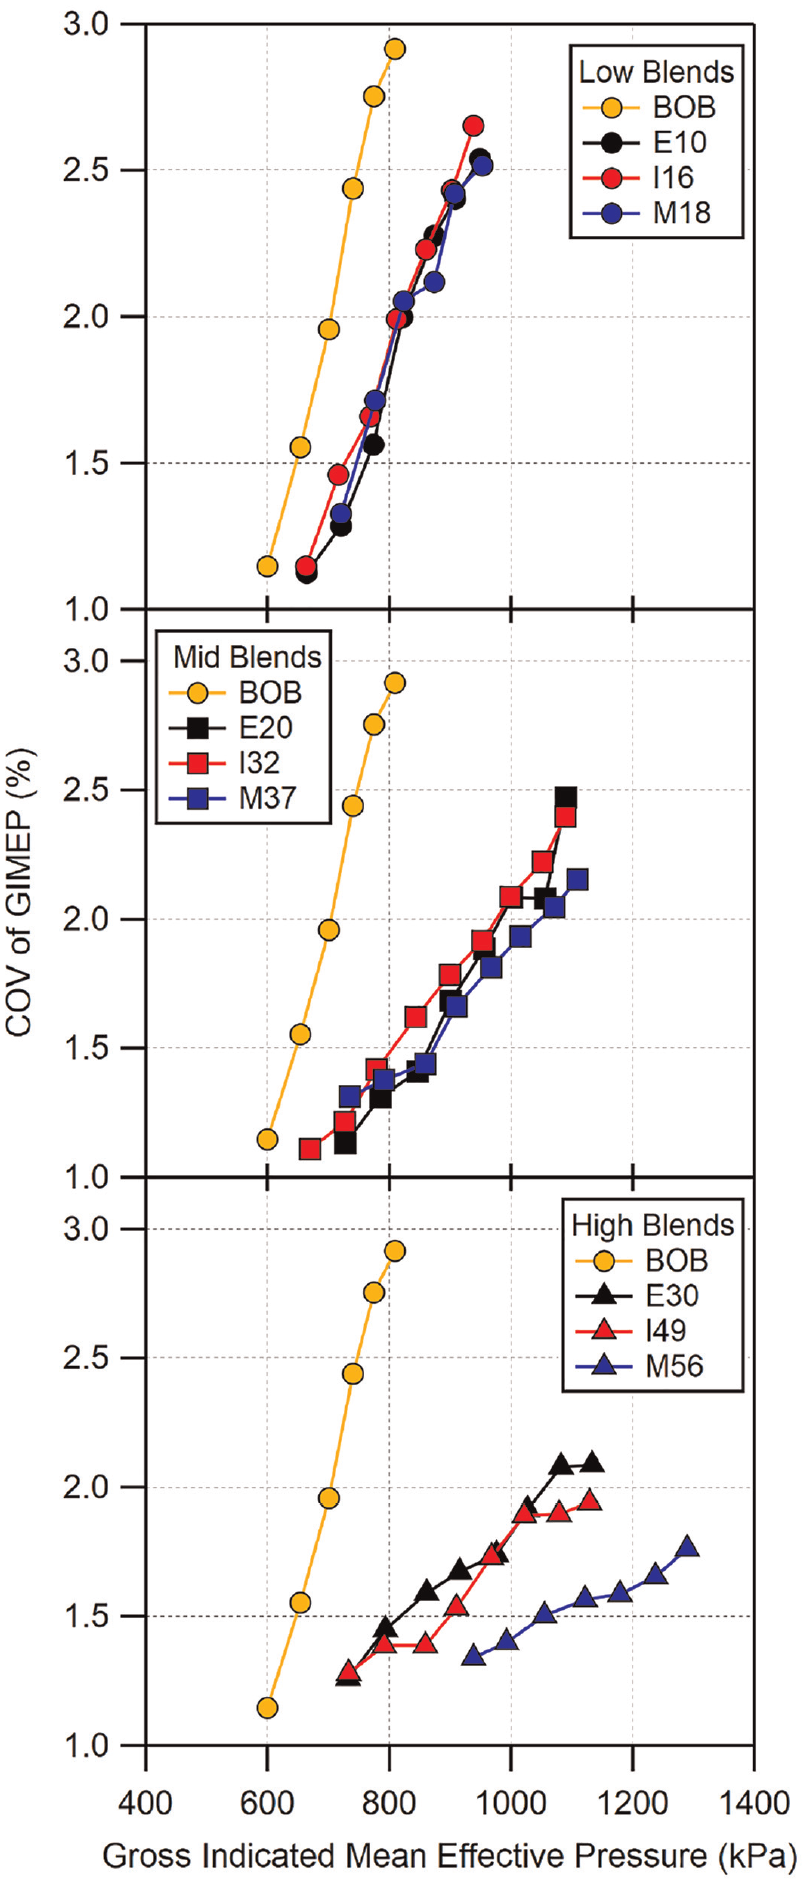
Coefficient of variation of GIMEP for all fuels shown as a function of GIMEP. Load points at which combustion phasing was advanced beyond MBT have been omitted. The magnitude of uncertainty is approximately equal to the size of the markers. Error bars have been omitted for clarity.
The flame kernel development time (flame-development angle) is shown in Figure 18(a) compared against gross indicated mean effective pressure. Here, flame kernel development time is defined as the time from spark to 10% heat release (CA10). Just as in the COV results previously shown, it should be noted that comparisons should be primarily limited to low- and mid-level blends, as their conditions are the most similar. For the low-level alcohol blends, the flame development time is similar across the range of tested loads. The BOB appears to be slightly faster at higher loads; however, all are still within the uncertainty bounds of one another.
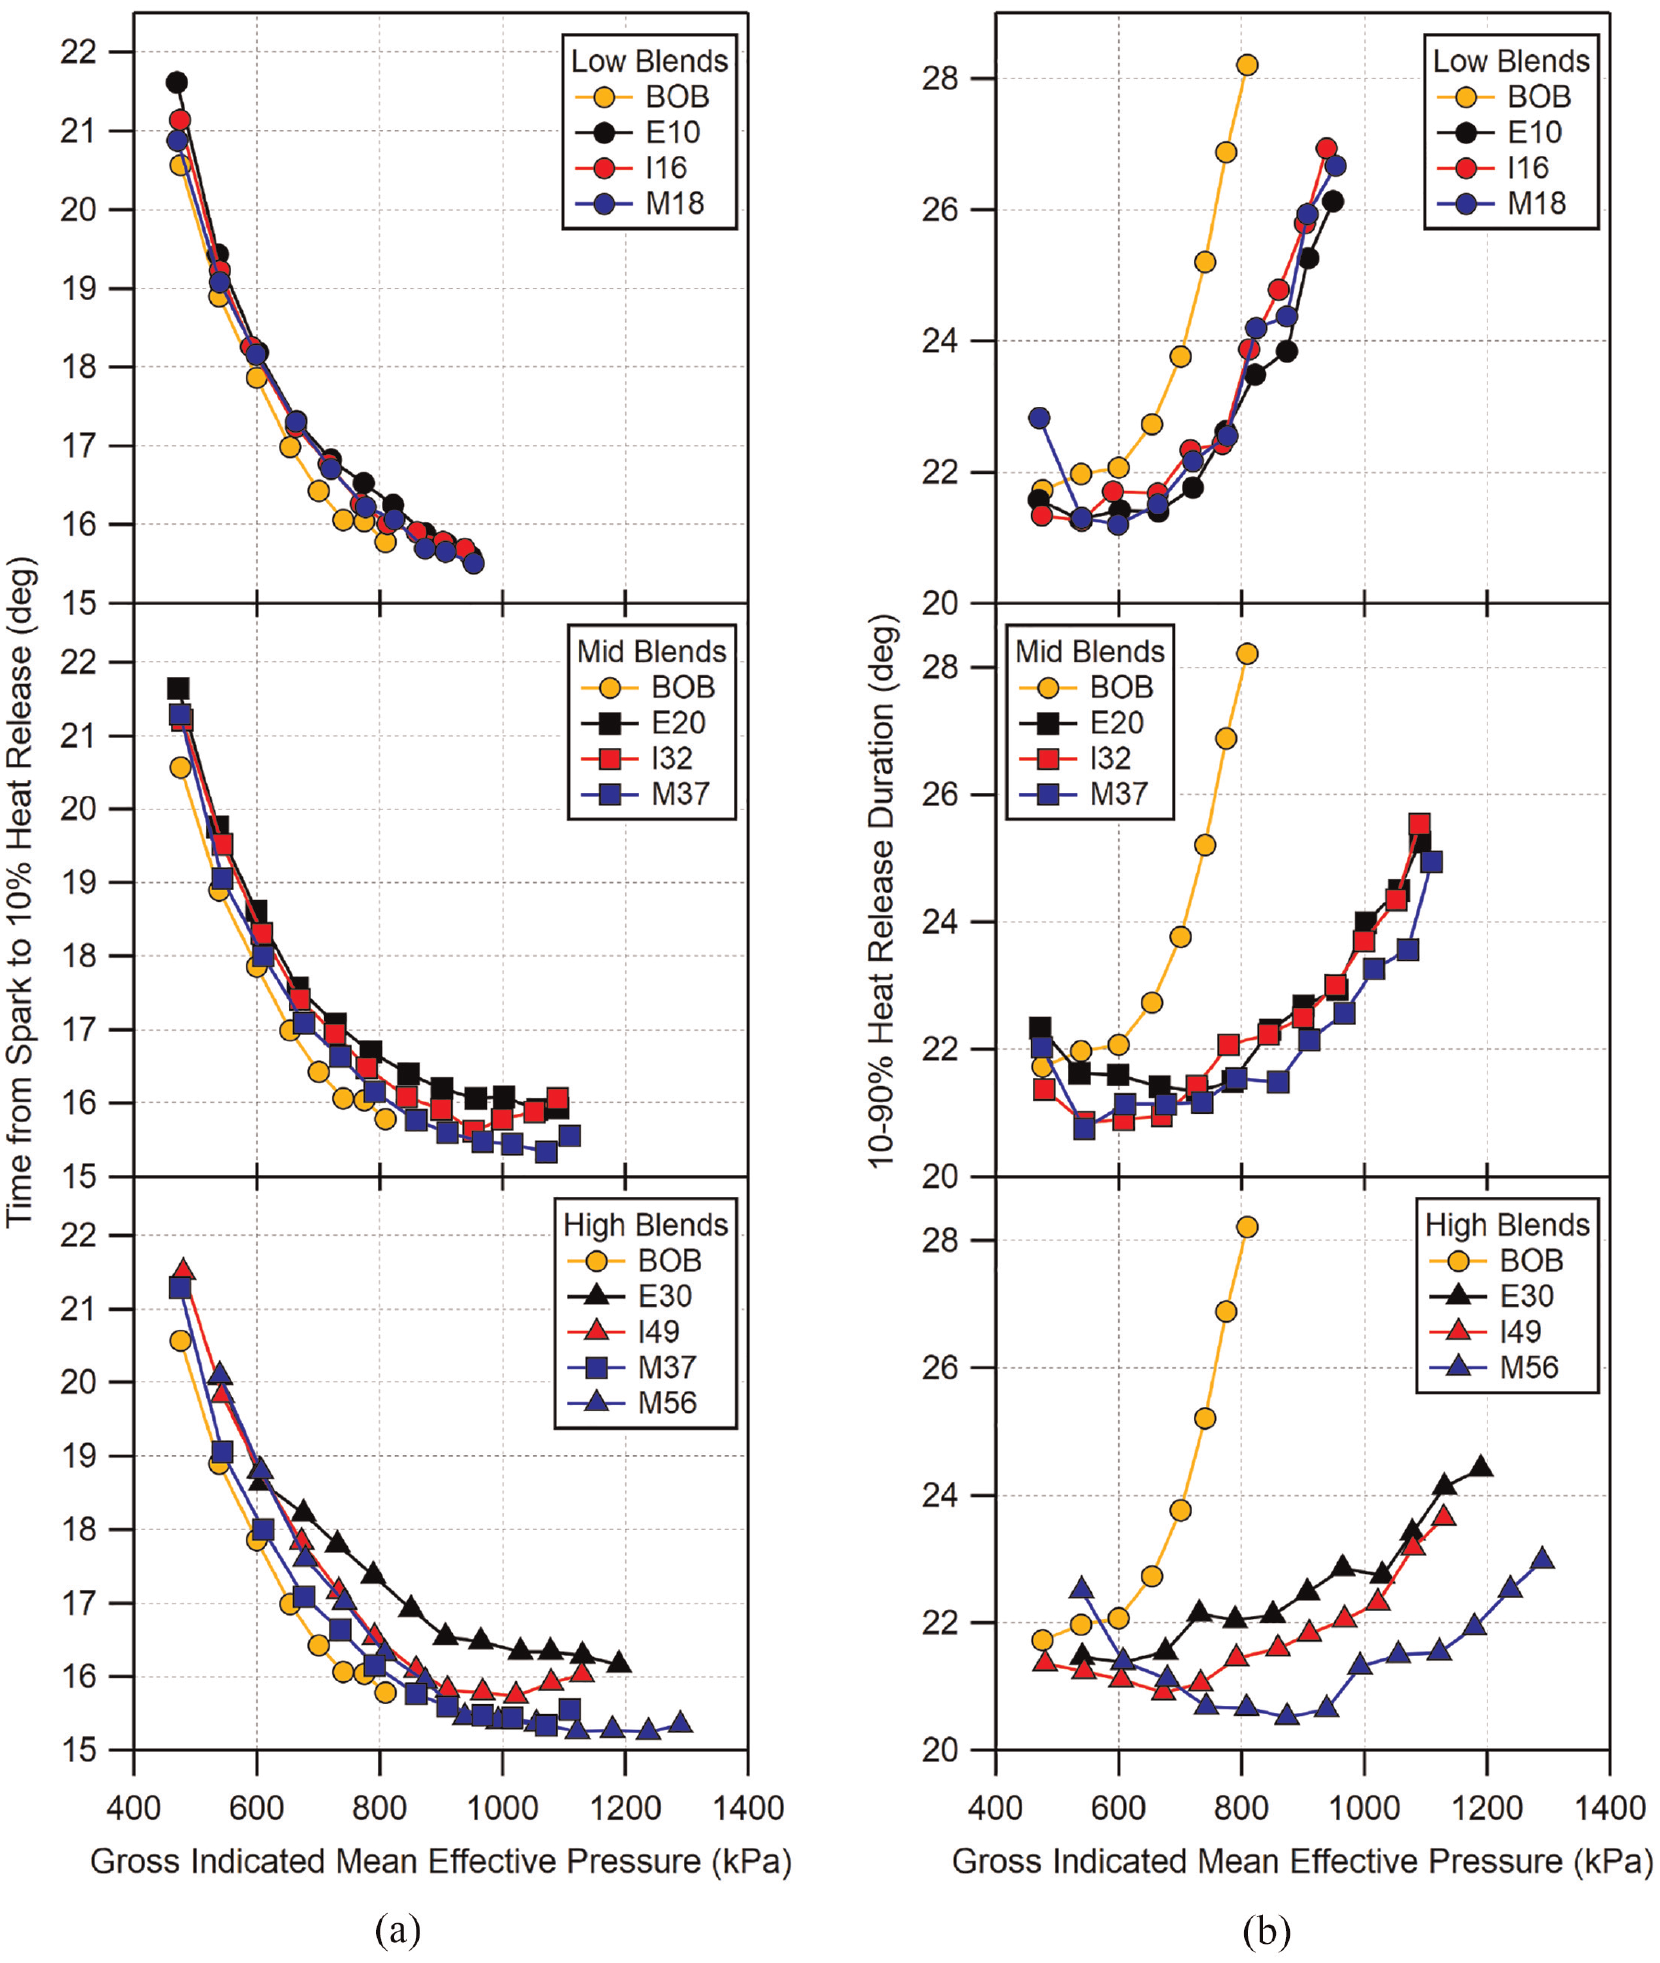
(a) Flame kernel development time measured from time of spark to 10% heat release and (b) combustion duration measured from 10% to 90% heat release (CA10–CA90) as a function of GIMEP. Uncertainty in flame development time is approximately
For mid-level blends, the fuels show similar times at low loads. As load increases, the development times of I32 and M37 begin to reduce compared to E20, with M37 having the most reduced flame development time at higher loads. For the highest blend level fuels, more significant differences in flame development times are seen. At the lowest loads, up to 600 kPa GIMEP, all three blends have nearly identical flame development times. At 600 kPa, E30 begins to slow relative to I49 and M56 which continue to have similar times up to GIMEP near 850 kPa. Above 800 kPa, I49 begins to slow while M56 maintains a nearly constant time up to its highest load. With respect to I49 and M56, this is an interesting result as the flame development times are very similar despite an average difference in spark timing of ∼3° and greater difference in knock-limited CA50 between the two across the load range. The demarcation at 800 kPa GIMEP corresponds with the increasing difference seen in the knock-limited CA50 results. It is also interesting to note that ethanol blends appear to have slower flame development time compared to the other two alcohols. This is most apparent in the high-level blends, but is seen to a lesser extent with the lower fuel blends as well. This result seems counter-intuitive due to the increased time, as other studies have shown that ethanol addition to gasoline results in a decrease in flame kernel development times. 52
The overall combustion duration, described by the crank angle duration between 10 and 90% heat release (CA10-CA90), is shown in Figure 18(b). Similar to the flame kernel development time results, the low- and mid-level blends show nearly the same behavior with all of the combustion duration results falling within the uncertainty from one fuel to the next. Only at the high-level alcohol blends is there a significant difference for M56 compared to E30 and I49. The difference seen with the high-level blends are also likely due to the advanced combustion phasing of M56 relative to the other fuels.
The flame kernel development process has been shown to be laminar in nature. 11 Turner et al. 53 reported ethanol addition resulted in shorter flame kernel development times, attributing the observation to ethanol’s higher flame speed. Since ethanol and isobutanol have been shown to have increased laminar flame speeds compared to gasoline,54,55 the expectation is that the flame kernel development time for alcohol blends would be reduced compared to the base gasoline due to the increase in flame speed. However, the trend which is seen is that increased displacement of gasoline in the fuel leads to slower flame development times. Aleiferis et al. 56 compared neat gasoline to an 85% ethanol volumetric blend with gasoline (E85) and found that the ethanol blend showed slightly slower flame growth time. They attributed the result to the flame speed of their tested gasoline being faster than that of ethanol, leading to a decrease when blended. This result could explain the difference seen between the low-level blends and the BOB. However, the differences in in-cylinder temperatures between these conditions should still be considered as small differences in temperature are expected to affect the flame speed. It was also noted in that work by Aleiferis et al. that the flame kernel of each fuel took noticeably different spatial paths from the point of flame initiation. Similar results were also found by Aleiferis et al. 57 with neat gasoline, ethanol, and 1-butanol. This was attributed to different levels of evaporation and mixing experienced by the different fuels impacting their interaction with the in-cylinder flow field. These are also factors which could affect the results seen here.
Due to the differences in load and combustion phasing between the high-level blends, it is difficult to make a good comparison between the three. However, looking at the knock-limited CA50 data in Figure 11(b), the data for E30, I49, and M37 have similar load and CA50 for much of the tested load range and would make a more representative comparison for flame development time. To compare the combustion duration of these three, M37 has been included with the high-level blend data in Figure 18(a). As can be seen in the figure, M37 has shorter flame development times compared to E30 and I49 for the entire tested load range. There is no available data on laminar flame speed for methylbutenol. However, if the assumption of the BOB having a higher laminar flame speed is maintained, the trends shown here would suggest that the flame speed for methylbutenol is equal to or greater than that of ethanol, given the decreased flame kernel development time of M37 despite increased volumetric displacement of gasoline compared to E30. Conversely, the overall combustion duration is not influenced as much by laminar flame speed as it is by other factors such as turbulence, in-cylinder motion, and heat transfer, all of which can have an effect on the progression of combustion after the flame kernel initiation period has passed.
Low-temperature and pre-spark heat release, as seen in the previous section, has also been shown to affect flame kernel development time. For example, Szybist and Splitter 51 showed that PSHR had the effect of shortening the flame kernel development time compared to conditions where PSHR was not present. Bulk gas heat release as a result of PSHR would reduce the time needed for flame-propagated heat release to reach CA10. In the case of this study, PSHR only occurs for the lowest blend level fuels and only at the highest load conditions. This, combined with the unmatched load and combustion phasing between fuels, makes it difficult to identify any effects of the PSHR on flame kernel development time.
Fuel consumption and thermal efficiency
The reduced lower heating values of the alcohols compared to gasoline result in the fuel blends having reduced lower heating values and volumetric energy content. Since the alcohol-gasoline blends are matched to the same oxygen weight percentage for each blend level, the resultant lower heating values are actually quite similar. However, the increased densities of isobutanol and methylbutenol result in their volumetric energy densities being greater than that of ethanol blends. These differences in lower heating value and volumetric energy density on an oxygen weight basis can be seen plotted in Figure 19.
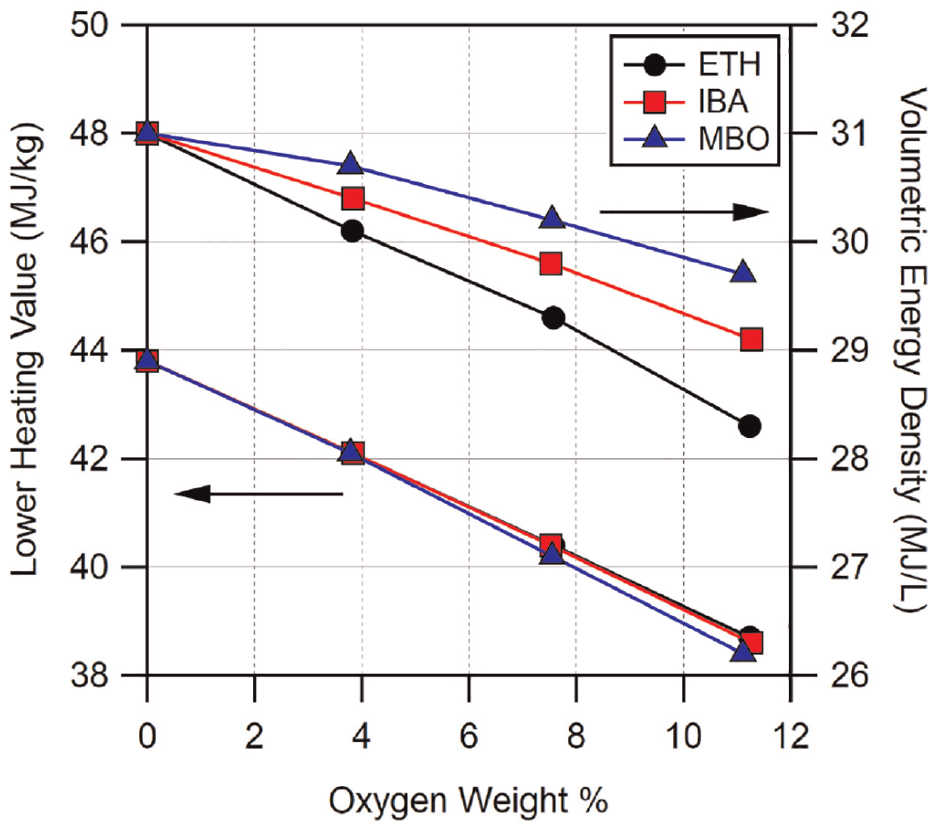
Lower heating values and volumetric energy densities for fuel blends of BOB and alcohols.
The indicated specific fuel consumption (ISFC) for all of the fuels is plotted in Figure 20 grouped by blend level. Note that for loads which the combustion phasing was advanced beyond MBT, the MBT load was used to determine the ISFC. Fuels which have similar oxygen weight percentage generally have similar ISFC values and follow similar trends until knock-limited loads are reached. The BOB and PRF fuels have the highest energy density which results in those fuels having the lowest minimum ISFC. The ISFC for the BOB and PRF87 begin to increase earliest due to their limited knock-resistance. Conversely, PRF100 is able to reach a minimum ISFC near 900 kPa GIMEP due to its significantly better knock-resistance.
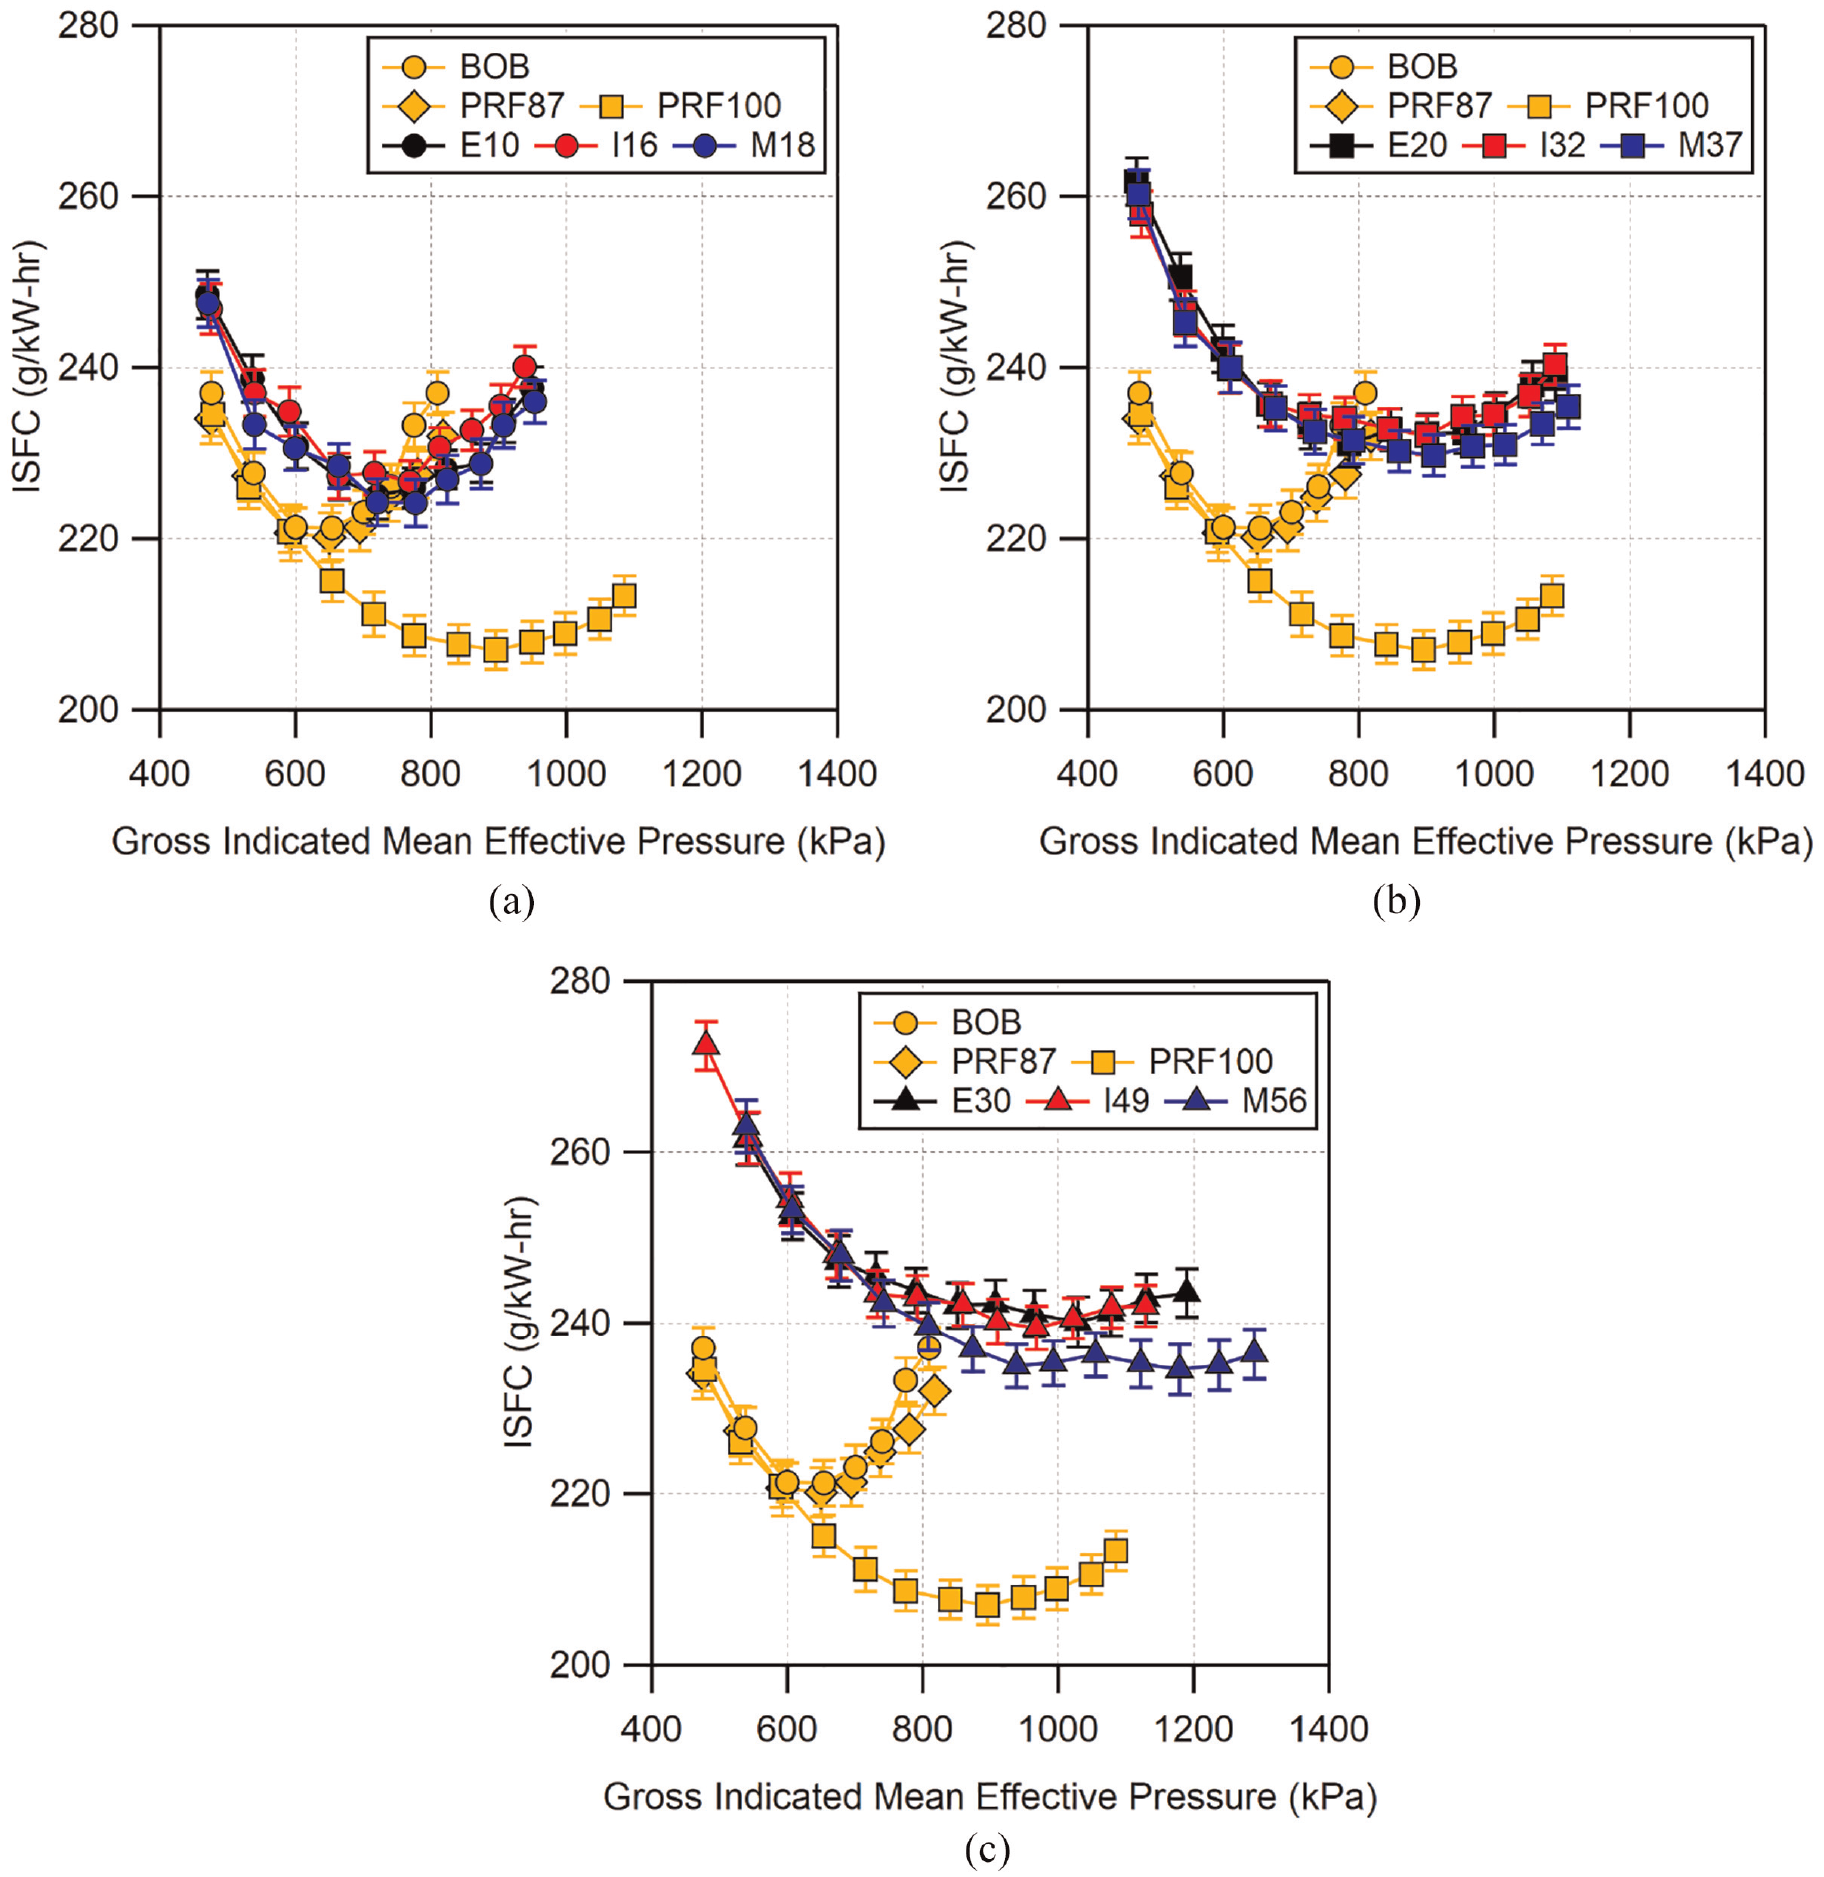
Comparison of knock-limited indicated specific fuel consumption as a function of knock-limited load for: (a) low-level, (b) mid-level, and (c) high-level alcohol blends. For conditions where the combustion phasing was advanced far beyond MBT, the MBT load was used for the ISFC calculation.
All of the fuels follow the same trend of decreasing ISFC until their knock-limit requires significant combustion phasing retard. Low- and mid-level blends require more spark retard at higher loads which results in increases in ISFC similar to the BOB and PRF87. ISFC of high-level blends does not increase as much above the minimum at higher loads for the load ranges tested here due to their improved knock resistance. Instead, the ISFC of these fuels become more constant at higher loads, with only small increases in ISFC for the highest loads. At the highest oxygen weight percentage, E30 and I49 are similar across the entire load range whereas M56 shows improved ISFC for loads greater than 700 kPa GIMEP. For their respective blend levels, M37 and M56 display the greatest ability to maintain low ISFC at high loads due to their increased knock-resistance.
The ISFC data from Figure 20 were converted to volumetric ISFC and are shown in Figure 21. As can be seen in the figure, despite similar mass ISFC results for similar alcohol blend level, volumetric ISFC show more visible differences due to the densities of the fuel blends. The first detail which is immediately apparent is that the BOB and the PRF fuels no longer have significantly lower ISFC compared to the alcohol blends. For the low-level blends, all of the fuels have similar ISFC compared to the BOB and the PRFs at lower loads. At higher loads, the alcohols fall in between PRF100 and the BOB and PRF87. The volumetric ISFC of M18 is slightly lower here compared to E10 and I16.
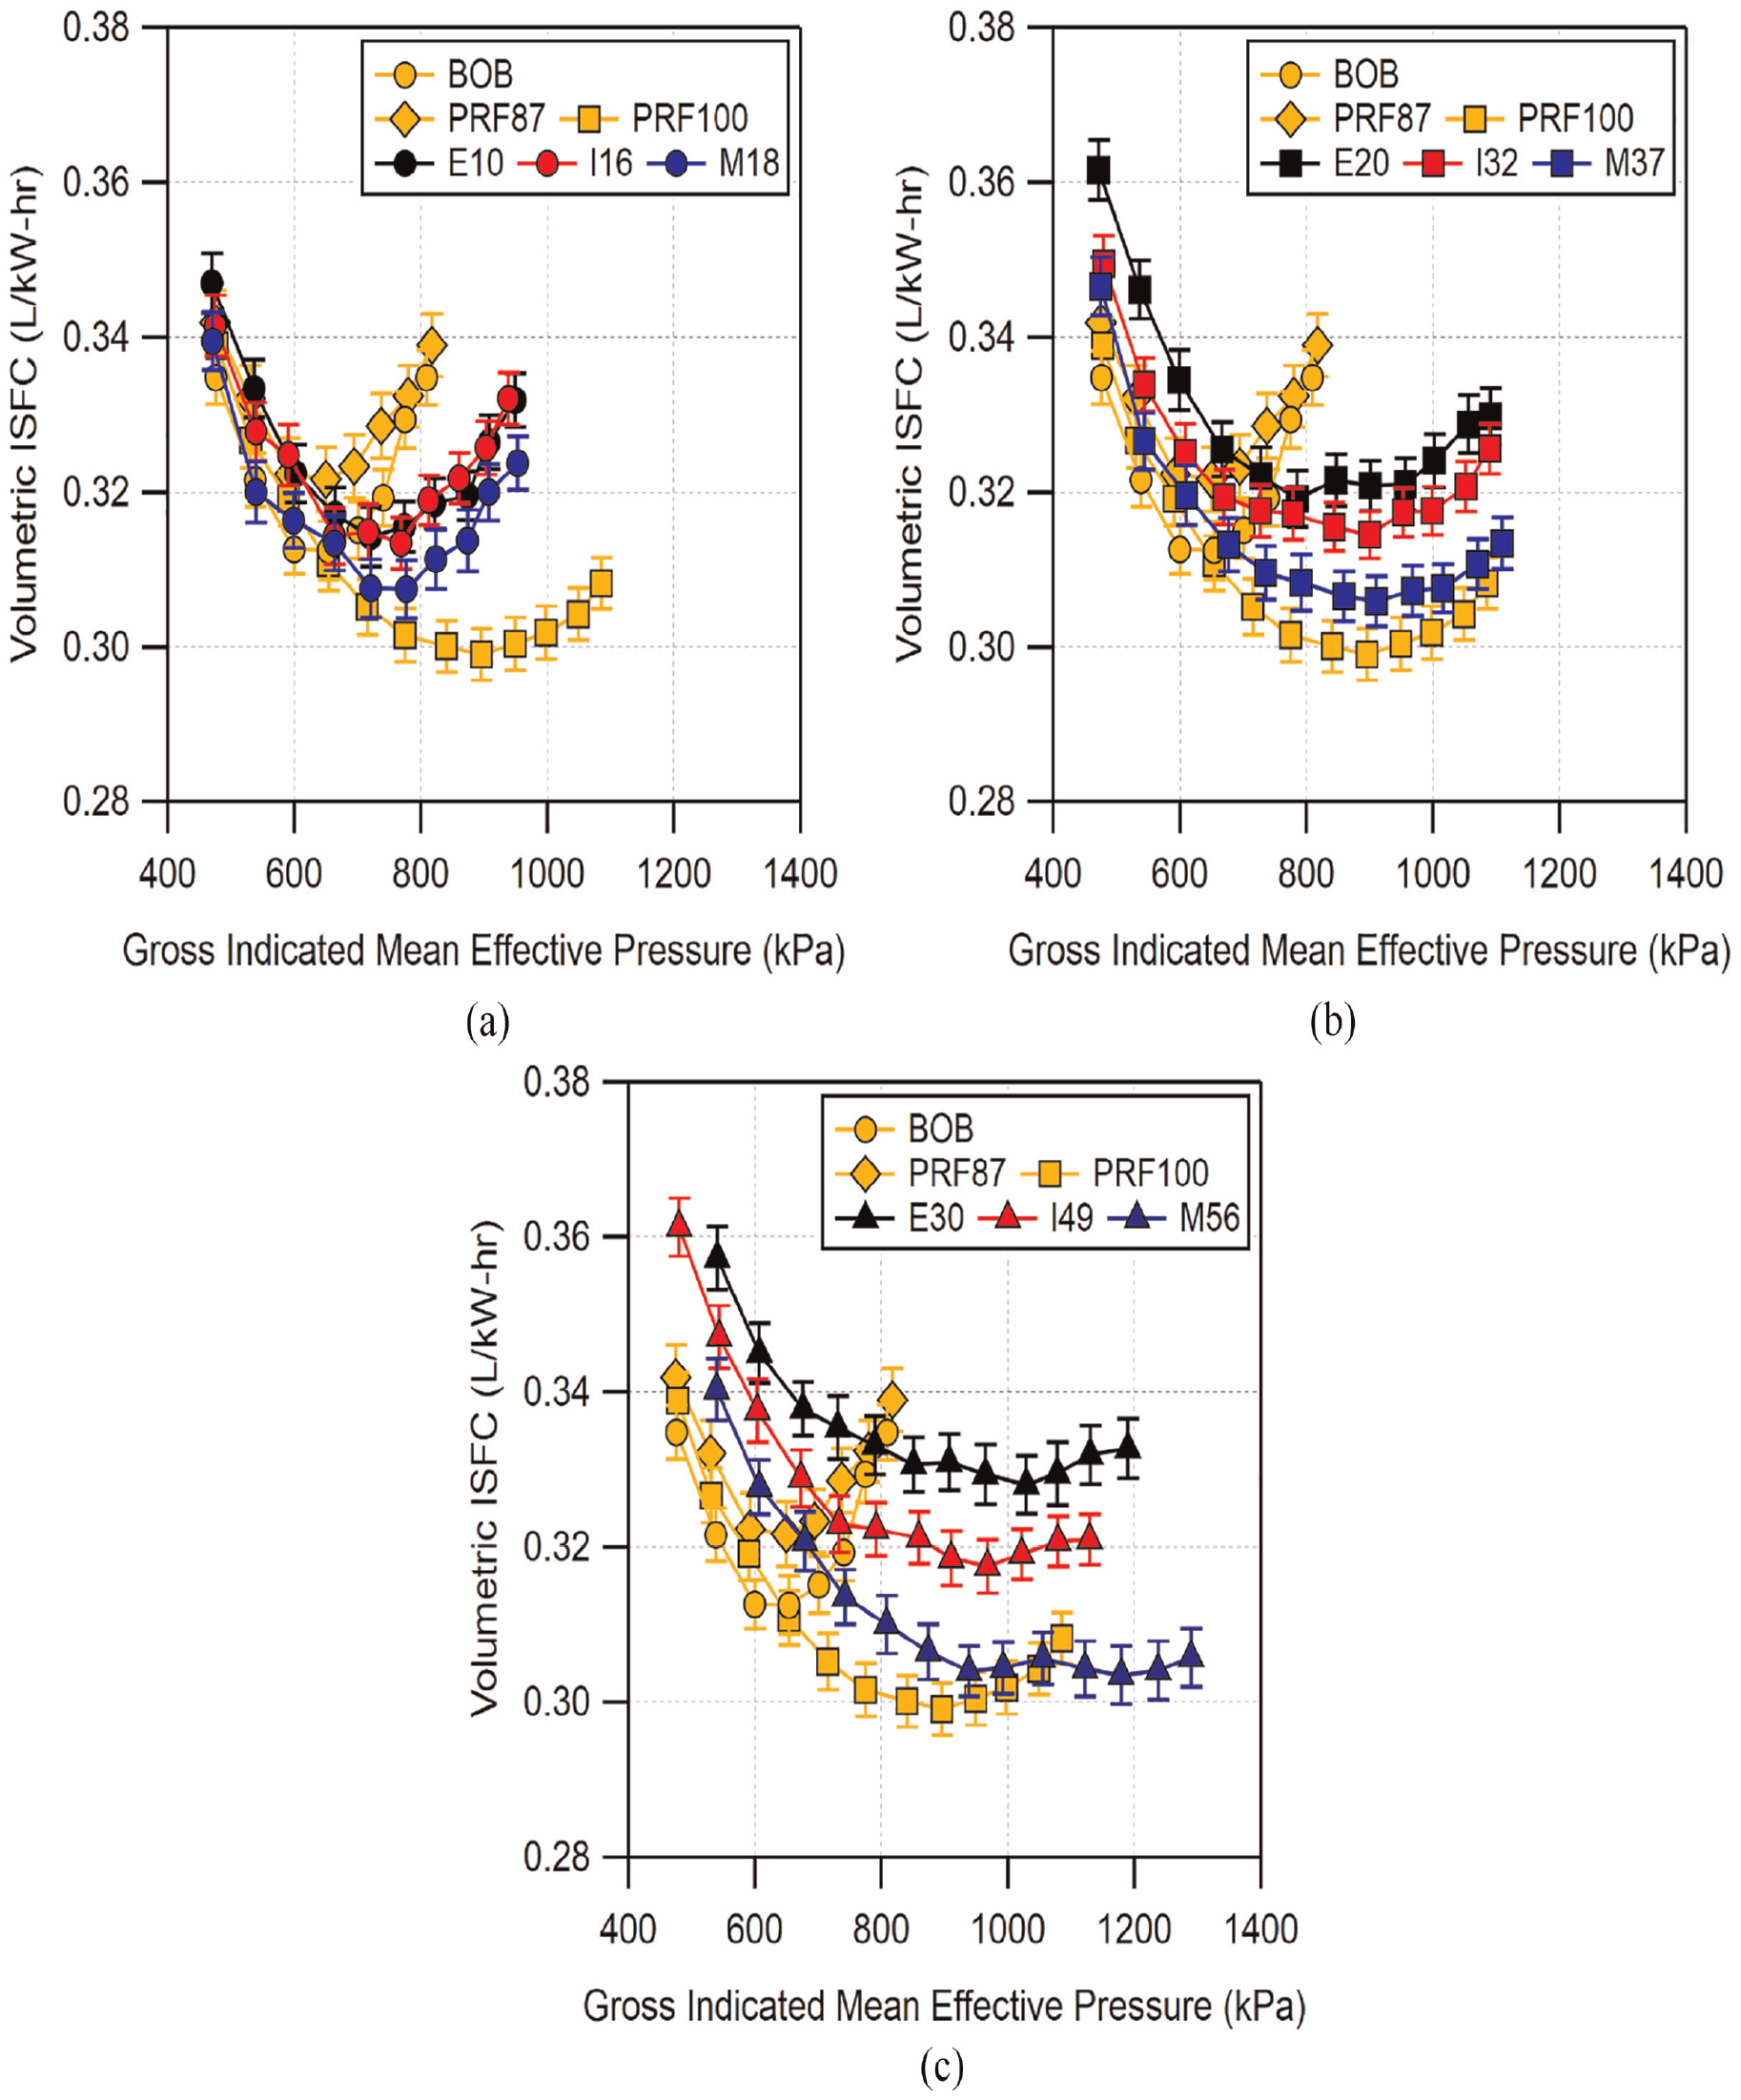
Comparison of knock-limited volumetric indicated specific fuel consumption as a function of knock-limited load for: (a) low-level, (b) mid-level, and (c) high-level alcohol blends. For conditions where the combustion phasing was advanced far beyond MBT, the MBT load was used for the ISFC calculation.
For mid-level blends, the volumetric ISFC shows increased differentiation. Similar to M18, M37 shows reduced fuel consumption compared to E20 and I32. E20 has the highest fuel consumption of these fuel blends and I32 falls in between. It is interesting to note that the ISFC of M37 comes close to matching PRF100 across the load range and both follow a similar trend. For high-level blends, the ISFC of the fuels is spread further apart. The order of ISFCs is the same as the mid-level blends, with the order of greatest to least ISFC being E30 > I49 > M56. Unlike M37, M56 does not trend as closely to PRF100. However, M56 is able to show reduced fuel consumption compared to PRF100 at GIMEP above ∼1100 kPa.
Similar results are seen in the gross indicated efficiency (
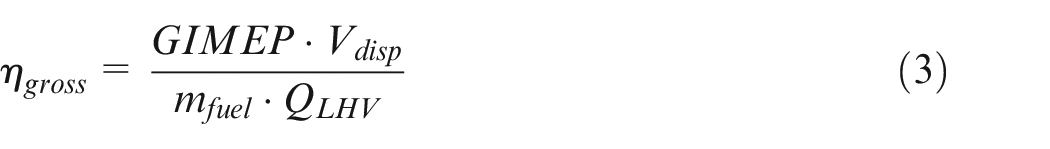
where
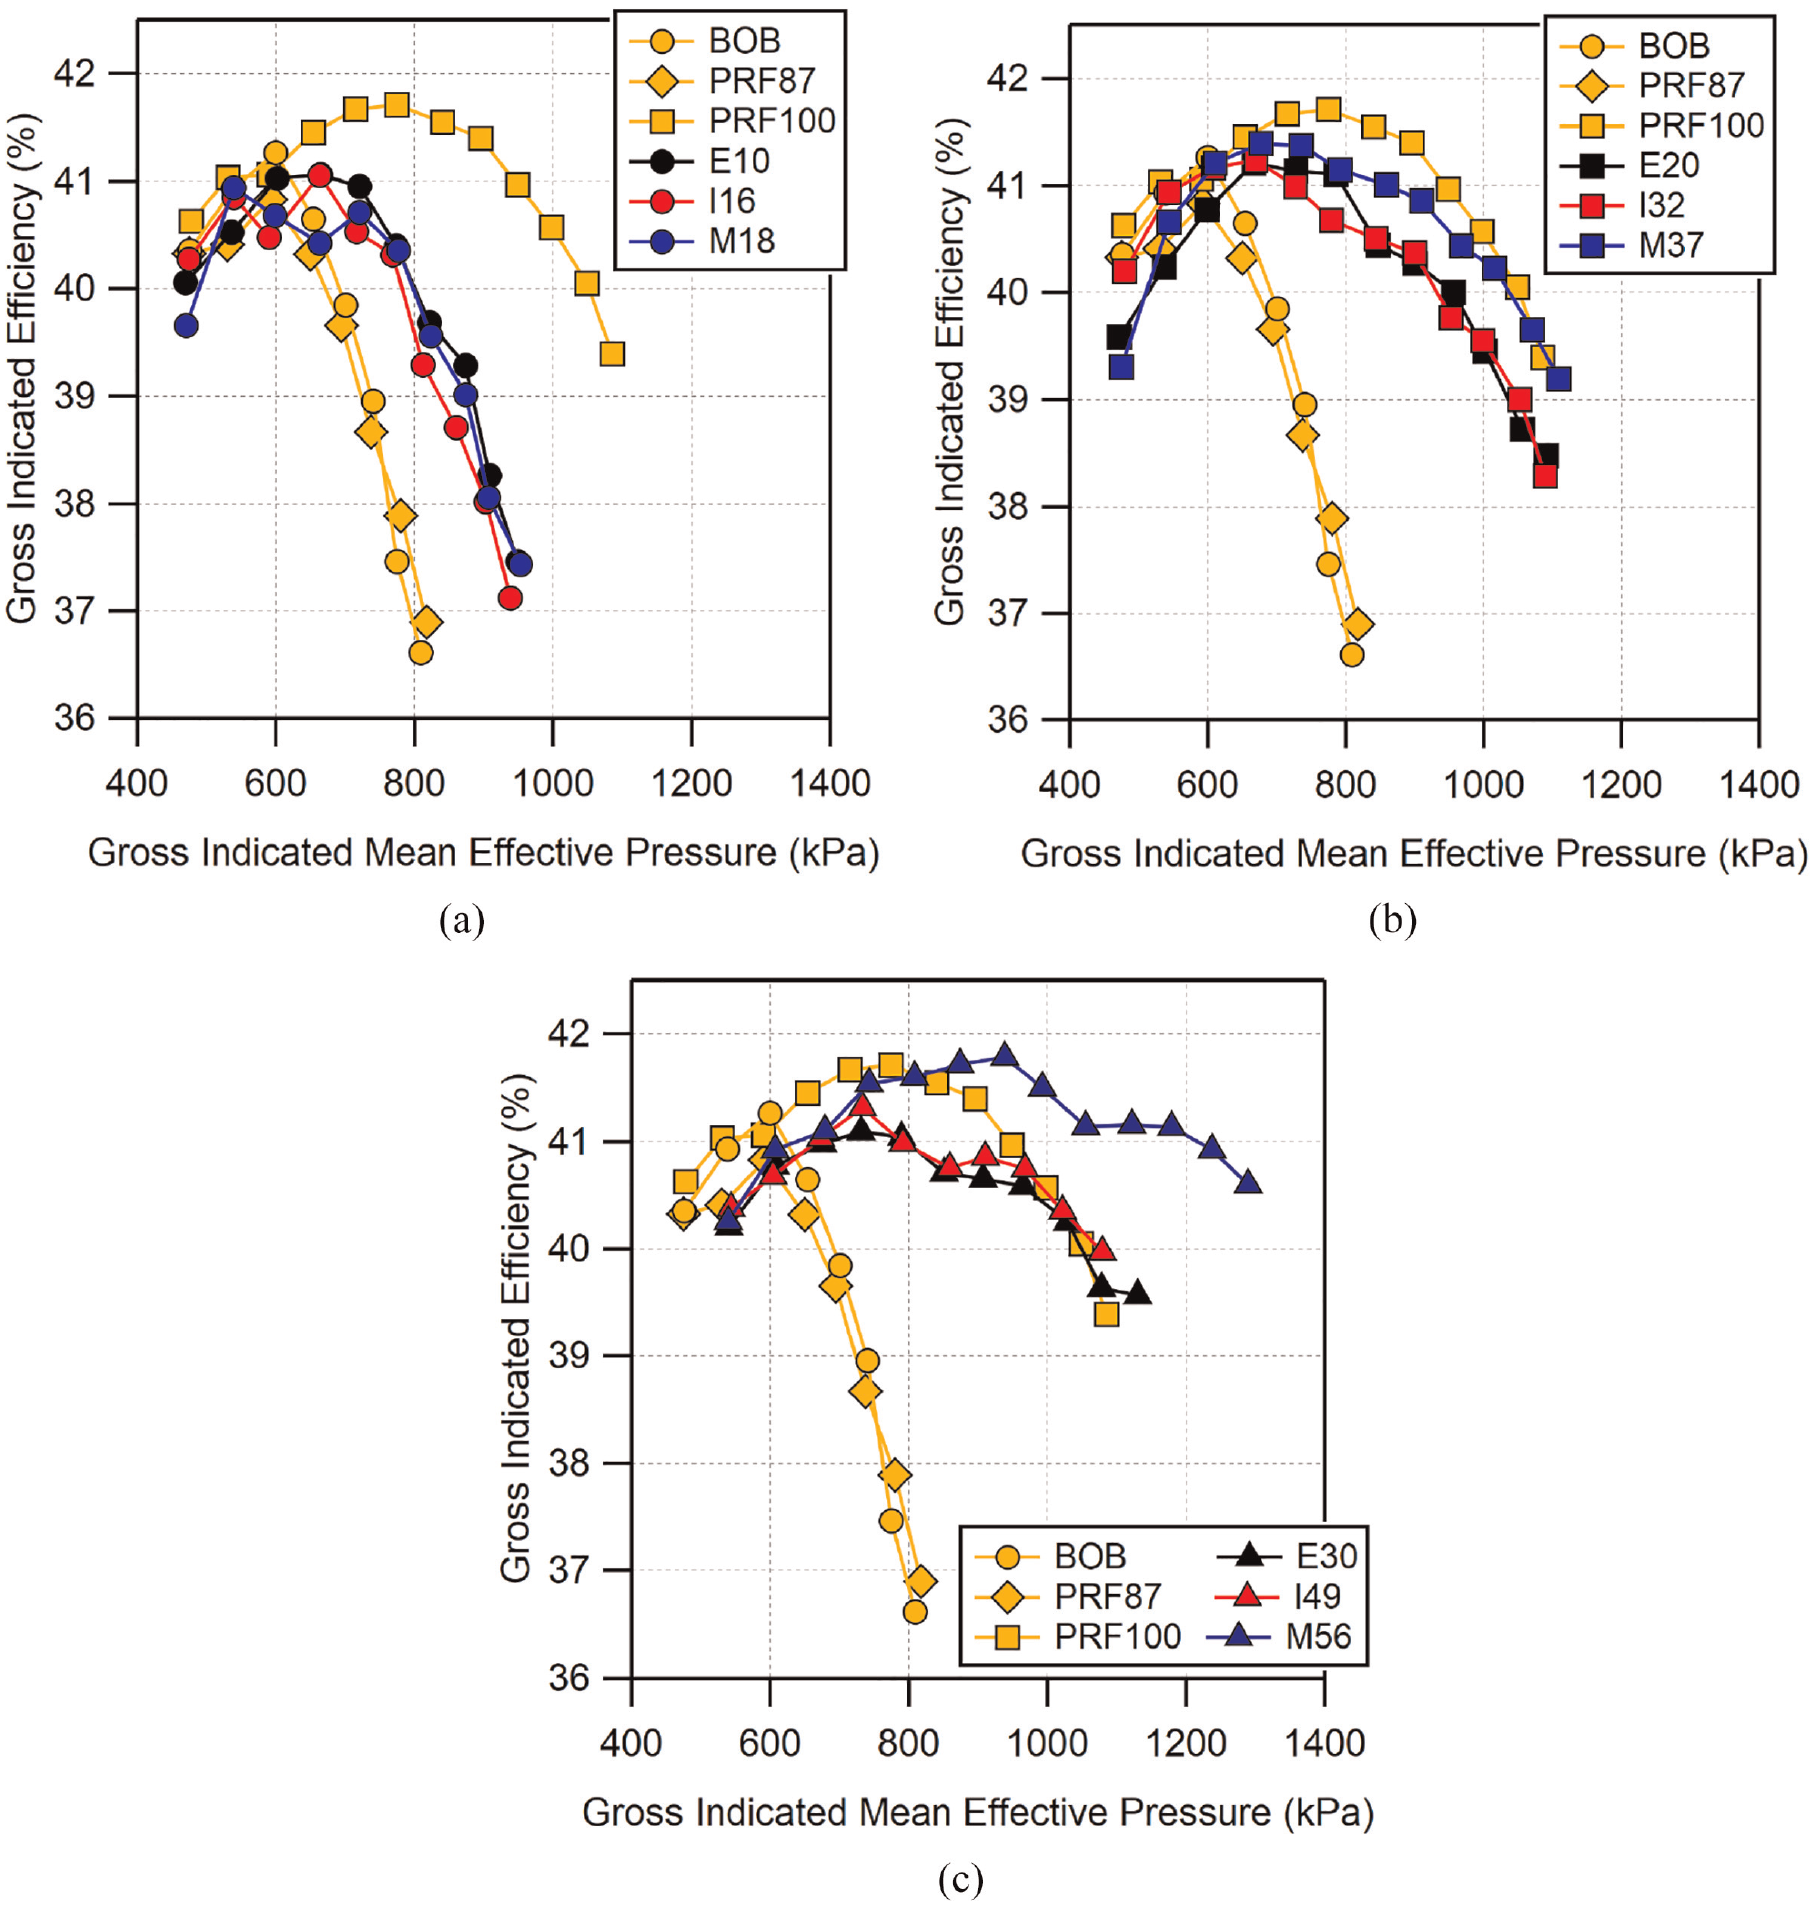
Gross indicated efficiency as a function of knock-limited load for: (a) low-level, (b) mid-level, and (c) high-level alcohol fuel blends. Efficiency was calculated using equation (3) with knock-limited parameters. Magnitude of uncertainty in gross indicated efficiency is approximately
The BOB and PRF87 have similar efficiency curves due to their similar knock resistance. Both reach their peak near 600 kPa GIMEP and quickly fall off. Conversely, PRF100 has a higher peak efficiency which reaches a maximum at a higher load and falls off more slowly. The low-level alcohol blends provide only a modest improvement over the BOB gasoline, reaching similar peak efficiencies and falling off at a similar rate at slightly higher loads. The mid-level blends show similar efficiencies to the other fuels at lower loads but quickly exceed the BOB, reaching peak efficiencies close to that of PRF100. All of mid-level blends are able to maintain higher efficiency at higher loads compared to the low-level blends. Here we can see that M37 appears to be able to match the efficiency of PRF100 at the highest loads whereas E20 and I32 are potentially slightly beneath PRF100 and decreasing at a similar rate.
The highest blends show similar efficiencies as the other fuels at low loads with E30, I49, and M56 all having nearly identical efficiencies until GIMEP
Conclusions
The knocking behavior of blends of ethanol, isobutanol, and 2-methyl-3-buten-2-ol with a BOB gasoline were investigated in a spark-ignition direct-injection engine. Ethanol was blended in fractions of 10%, 20%, and 30% (E10, E20, E30) by volume. Isobutanol and methylbutenol were blended to match the oxygen weight percentages of the ethanol blends, yielding blends of 16%, 32%, and 49% (I16, I32, I49) and 18%, 37%, and 56% (M18, M37, M56) by volume for isobutanol and methylbutenol, respectively. The conclusions of this study are summarized below.
The knock resistance of ethanol and isobutanol were found to be similar when compared on an oxygen weight basis, with ethanol having slightly better performance. Methylbutenol was similar to the other two alcohols at the lowest oxygen weight percentage blend level. However, mid- and high-level blends of methylbutenol were observed to have significantly improved knock resistance.
The knock results from this work were compared to previous premixed combustion experiments with the same fuels and same engine. The comparison showed that ethanol and isobutanol exhibited similar improvement in knock resistance with the change to direct-injection while the higher two blends of methylbutenol again showed greater improvement.
The highest-level blends of E30 and M56 were shown to have the most reduction in calculated bulk temperature from PMPV to DI operation. The higher sensitivity of M56 likely allows it to take better advantage of the temperature change relative to E30, resulting in its increased knock-limited load.
It was found that the
PRF87 and the BOB gasoline displayed noticeable pre-spark heat release which occurred at the highest loads tested. All of the alcohols were able to reduce the level of PSHR with increasing alcohol content. However, M56 appeared to have the greatest reduction in PSHR, displaying no noticeable PSHR at the highest load tested.
Combustion variability was similar for fuels with similar oxygen weight percentage. Flame kernel development time appeared to reduce for the higher two methylbutenol blends indicating potentially increased laminar flame speeds, though overall combustion durations were similar for similar blend levels.
Fuel consumption, as measured by ISFC, was similar for similar blend levels due to their approximately matched lower heating values. Most fuels showed clearly increasing ISFC trends at higher loads. Conversely, M56, because of its increased knock-resistance, was able to extend its minimum ISFC up to the highest loads tested without displaying the same increase as the other fuels for the range of loads tested here. A similar trend was seen in the gross indicated efficiency, where M56 was able to maintain higher efficiencies at high loads while the other fuel blends dropped off.
Overall, methylbutenol blended into gasoline has shown that it matches and can exceed the knock-resistance of ethanol- and isobutanol-gasoline blends when compared on an equal oxygen weight basis. Methylbutenol has also been shown to have similar or greater ability to reduce PM formation compared to ethanol and isobutanol. 8 The improved knock-resistance coupled with improved fuel consumption, equal/greater efficiency, and reduced PM compared to the two currently used oxygenates should warrant further investigation into the use of methylbutenol as a fuel additive.
Supplemental Material
sj-pdf-1-jer-10.1177_14680874231187016 – Supplemental material for Knock-limited combustion of ethanol-, isobutanol-, and 2-methyl-3-buten-2-ol-gasoline blends in a direct-injected spark-ignition engine
Supplemental material, sj-pdf-1-jer-10.1177_14680874231187016 for Knock-limited combustion of ethanol-, isobutanol-, and 2-methyl-3-buten-2-ol-gasoline blends in a direct-injected spark-ignition engine by Stephen Sakai and David Rothamer in International Journal of Engine Research
Footnotes
Declaration of conflicting interests
The author(s) declared no potential conflicts of interest with respect to the research, authorship, and/or publication of this article.
Funding
The author(s) disclosed receipt of the following financial support for the research, authorship, and/or publication of this article: This material is based upon work supported by the Great Lakes Bioenergy Research Center, U.S. Department of Energy, Office of Science, Office of Biological and Environmental Research under Award Number DE-SC0018409.
Supplemental material
Supplemental material for this article is available online.
References
Supplementary Material
Please find the following supplemental material available below.
For Open Access articles published under a Creative Commons License, all supplemental material carries the same license as the article it is associated with.
For non-Open Access articles published, all supplemental material carries a non-exclusive license, and permission requests for re-use of supplemental material or any part of supplemental material shall be sent directly to the copyright owner as specified in the copyright notice associated with the article.