
Abstract
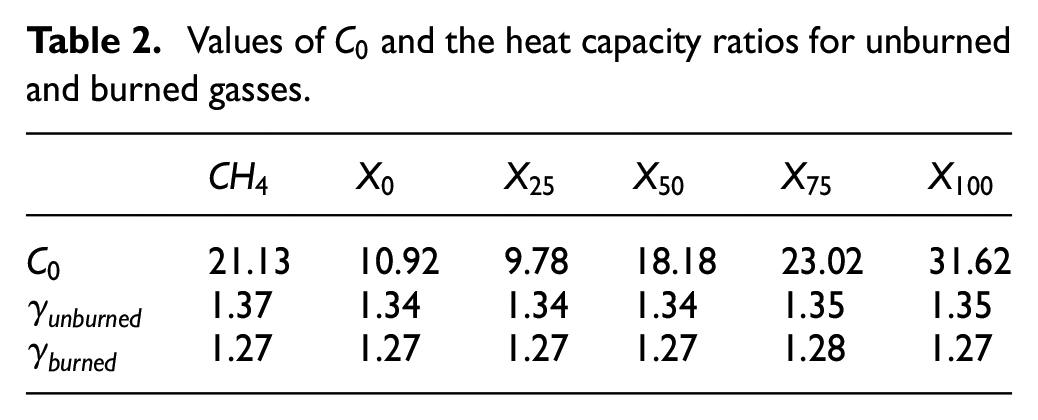
Combustion and emissions characteristics of a spark-ignition engine using direct injection of ethanol blended with ammonia and also pure ammonia were investigated in this study. The experiments were conducted using five different fuel compositions of ethanol/ammonia (C2H5OH/NH3): 100/0, 75/25, 50/50, 25/75, and 0/100. Two strategies of injection were conducted to reach homogenous or stratified conditions with three different intake pressures, 0.5, 1.0, and 1.5 bar corresponding to 2.8, 7.9, and 12 bar of IMEP. The performances and the pollutants emissions are compared as a function of fuel compositions at identical IMEP. High stability is observed for all blends and even for pure ammonia. However, operating conditions are more restrictive for pure ammonia: the injection must be executed during the intake phase to be in a fully premixed mode to guarantee engine stability. Delaying the injection time for pure ammonia is not possible and requires the split of injections with 50% of the ammonia amount injected during the intake. The thermal efficiency is improved by adding 25% of NH3 in ethanol but NOx emissions increase. The stratified strategy for blends improves the combustion durations and the addition of ammonia decreases the NOx emission compared to the homogeneous strategy. On the contrary, CO emissions roughly increase for blends. The presence of NH3 in the fuel composition clearly influences the change of formation of NOx and CO between both strategies.
Introduction
Climate change has been one of the greatest challenges in the last decades and is unfortunately still an ongoing concern. Consequently, Europe has decided on a drastic reduction of greenhouse gases emission by 55% in 2030 compared to 1990. 1 To take up this challenge, the share of renewable energy must reach at least 32% and the use of low-carbon fuels and biofuels is necessary. Biofuels are highlighted as alternative energy sources and bio-ethanol is the most attractive one. 2 It can be produced from a wide variety of sources such as starch, sugarcane, lignocellulosic material derived from agricultural waste, and algae 3 reducing its CO2 footprint.
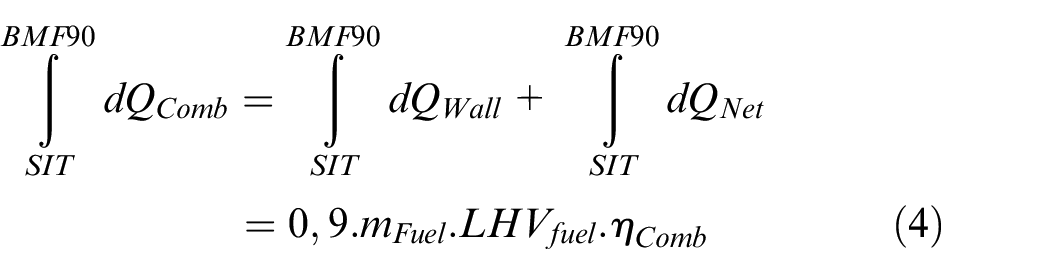
To limit fossil fuel consumption, the first step of transition has been to blend current fuel as gasoline with bio-fuel. Bio-ethanol blended with gasoline provides positive effects such as increasing engine efficiency 4 and decreasing dramatically CO and HC emissions. 5 Elfasakhany 6 explored the ternary blended fuels of bio-ethanol, bio-acetone, and gasoline and the results showed a reduction of CO, CO2, and Total unburnt HydroCarbons (THC) emissions directly on a tailpipe for the ternary blend compared to ethanol/gasoline and acetone/gasoline. However, in the future decades, fossil fuels will be not available: the oil reserves will run out by 2066. 7
To mitigate climate challenges, switching to carbon-free fuels such as hydrogen and ammonia are highlighted to be interesting solutions to decarbonizing energy, transport, and industrial sectors, especially by considering their production from water electrolysis with green electricity. Hydrogen is an attractive energy carrier 8 but its storage and transport issues, its low ignition energy, and very wide flammability range are the main drawbacks to safety. 9 Ammonia, containing 17.8% by weight of hydrogen, can be stored in the liquid phase at approximately 9 bar at 20°C or −34°C at ambient pressure. Its high auto-ignition temperature and research octane number (RON = 130), narrow flammability range, and low laminar flame speed 10 make its combustion difficult. Consequently, ammonia needs to be boosted, that is, its reactivity could be improved by adding a supplementary fuel, that is, a promoter. Several studies have addressed the potential of ammonia as fuel in internal combustion engines, mainly blended with another fuel to promote ignition/combustion properties, as reviewed in Mounaïm-Rousselle and Brequigny, 11 and Dimitriou and Javaid. 12 Kurien and Mittal 13 also reviewed the use of ammonia as an alternate fuel in dual-fuel compression ignition engines. This study demonstrates the effectiveness of ammonia combustion using the dual-fuel approach with secondary fuels like diesel, dimethyl ether, kerosene, and hydrogen. Direct injection of ammonia/dimethyl ether in a compression-ignition engine is feasible14,15 nevertheless, high cycle-to-cycle variation is observed when the blend content is up to 60% of NH3. The ignition delay becomes longer and limits the engine load conditions due to its high autoignition temperature and low flame speed. Relative high CO and HC emissions are observed and dedicated exhaust after-treatment is required. The use of ammonia in compression ignition engines is limited by its properties, and mainly by its high autoignition temperature, one of the key parameters of these engines. Nonetheless, in these difficult ignition conditions, the help of a spark can be useful as stated in.16,17
The spark-ignition engine has the advantage to optimize combustion by controlling the ignition time. However, fewer studies focused on spark ignition than on compression ignition engines with ammonia. Recently, Lhuillier et al. 10 confirmed that ammonia/hydrogen is a suitable fuel for current spark-ignition engines with indirect injection and without any design modifications. Mounaïm-Rousselle et al. 18 explored the possibility to fill a diesel engine with ammonia/H2 blend, by adding a spark plug for different intake pressures, engine speed, and compression ratios up to 17. They concluded that the use of diesel combustion chamber is beneficial for NH3 combustion due to the increase in the compression ratio but also the internal flow field. A numerical work, 19 studied the ternary blend of gasoline, ethanol, and ammonia for a spark-ignition engine with port injection and highlighted an increase of the power engine up to 1.4% for 10% of ammonia content but the CO and HC emissions increase also. The experimental study of Haputhanthri et al. 20 focused on the same ternary blend in a spark-ignition engine with direct injection. The blend of gasoline, ethanol 20%, and ammonia 12.9% by volume was identified as the optimum blend in terms of engine power showing the positive impact of ammonia. The preliminary analysis of this work evaluated the solubility of ammonia in gasoline/ethanol with a vapor-liquid equilibrium cell. The solubility of ammonia in pure gasoline is limited but the addition of ethanol helps to improve the solubility. This improvement is due to the polarities of ethanol and ammonia molecules 21 providing a total solubility between ammonia in ethanol proved in these studies22,23 while gasoline molecules are not polarized. The direct injection used in Haputhanthri et al. 20 has the advantage to inject the liquid blend directly from the tank into the internal combustion chamber. Furthermore, the total solubility of ammonia in ethanol in liquid phase and their high difference of vapor pressures 24 will generate an effervescent atomization when the pressure is below the saturation pressure of ammonia during a direct injection improving the fuel vaporization. 25 Moreover, the time of direct injection can be advanced to obtain a homogenous air/fuel mixture or on the contrary, a stratified/heterogeneous mixture by delaying the time of injection; these strategies will influence the performance and the pollutants emissions. The previous studies highlight the feasibility to store a stable homogeneous blend of ammonia and ethanol in the liquid phase providing an efficient way of storing the fuel energy by a unit of volume. Consequently, the direct injection of the liquid fuel into the combustion chamber seems to be the easier solution of injection. The potential of ammonia as a future carbon-free fuel blend to bio-ethanol as an alternative fuel to fossil fuel in a spark-ignition engine needs to be evaluated. This study aims to provide the first data on the performances and pollutants emissions of ethanol blended with ammonia using direct injection.
Experimental set-up
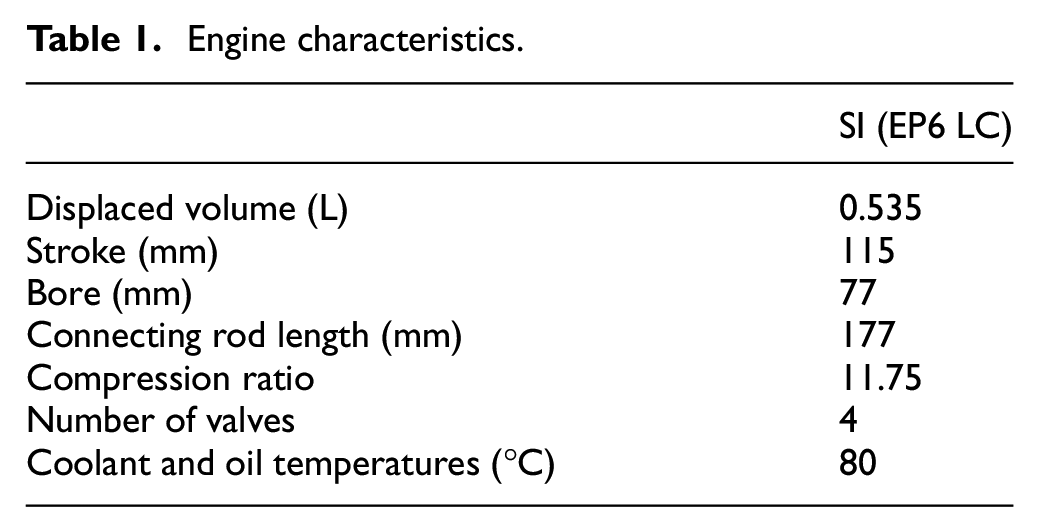
The engine experiments were conducted in a single-cylinder long-stroke spark-ignition engine (based on PSA-EP6) with a flat piston and a pent-roof chamber. The engine specifications are indicated in Table 1, and more information can be found in. 17 The engine is driven by an electric motor maintained at 1000 RPM. The main shaft is equipped with a Kubler optical encoder for angular position monitoring with a 0.1 Crank Angle Degree (CAD) resolution. The Intake valve closure is −180 CAD bTDC and the exhaust valve opening is 150 CAD aTDC. A water-cooled AVL piezoelectric pressure transducer with a 0.1 CAD resolution provides in-cylinder pressure measurements. Its measuring range is 0–25 MPa. Engine intake and exhaust temperature and pressure are monitored using type K thermocouples and piezo-resistive absolute pressure transducers. The absolute cylinder pressure is obtained by equalizing the in-cylinder pressure and the mean absolute intake pressure (Pin), 20 CAD in the middle of the intake stroke.
Engine characteristics.
The spark plug used is the original one with a coil charging time set to 2 ms (∼80 mJ). Air gaseous flows, preheated to the intake temperature were measured and controlled using Brooks thermal mass flowmeters with ±0.7% accuracy. The ethanol is blended with ammonia beforehand with a mixture set up and then stored in a tank. The liquid fuel is pressured with helium at 120 bar and injected with a current gasoline direct Bosch injector (7 holes of 365 μm diameter) located at the central position. A scheme of the experimental setup is shown in Figure 1. The mass injected is deduced with the time of injection controlled and the mass flow rates for each blend previously estimated in a constant vessel.
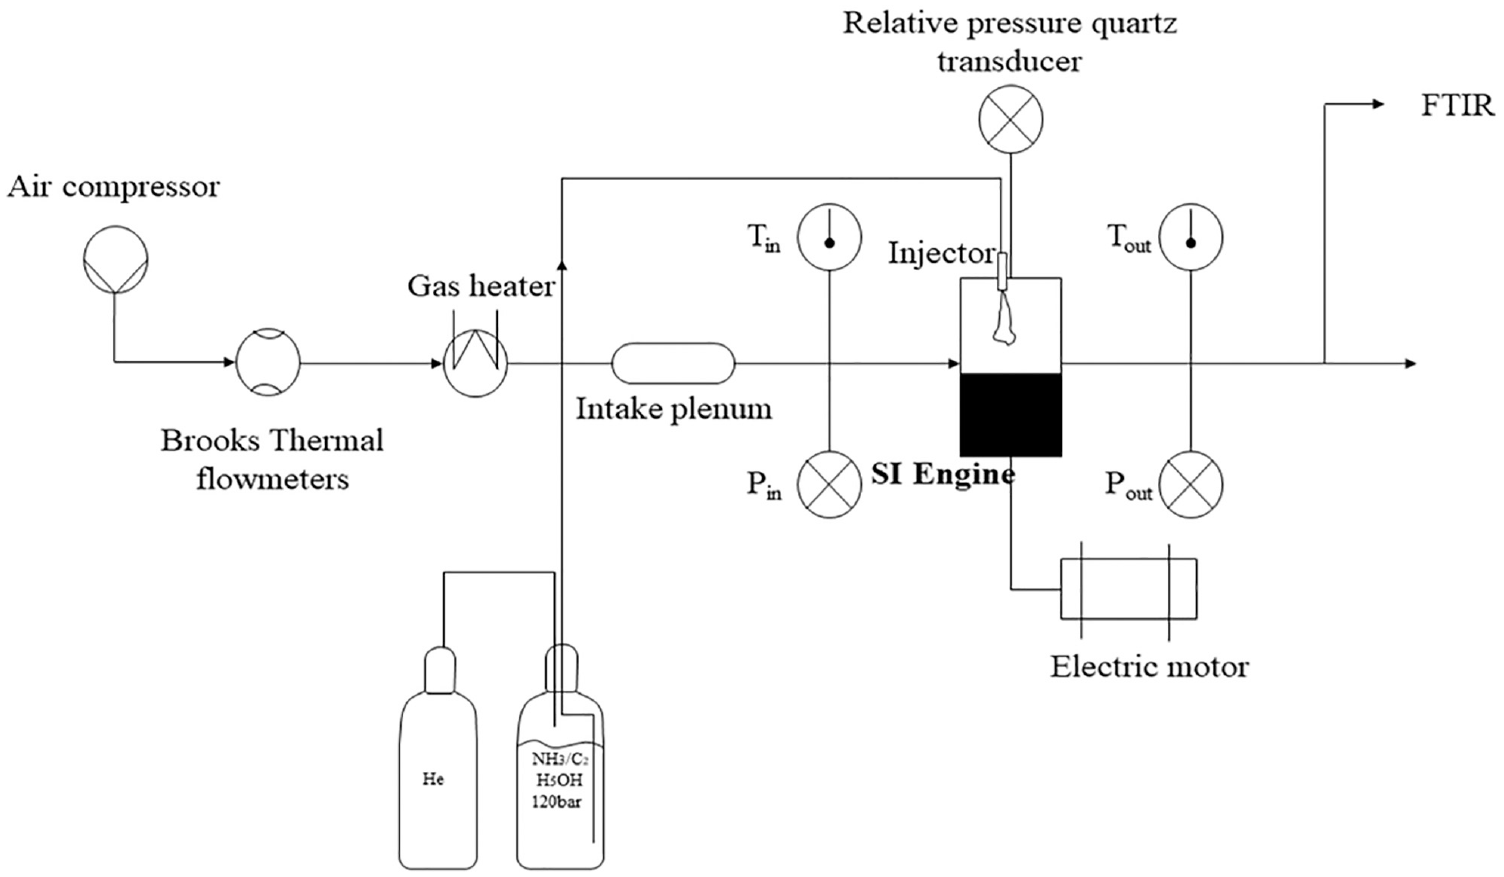
Experimental set-up.
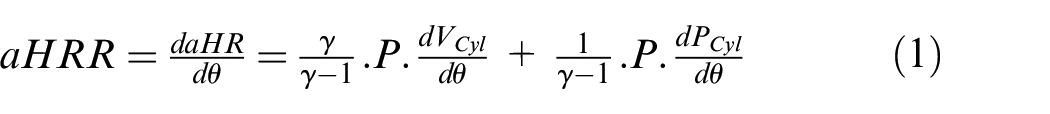
The apparent Heat Release Rate (aHRR) was computed from pressure trace post-processing with the first law of thermodynamics, as follows:
where
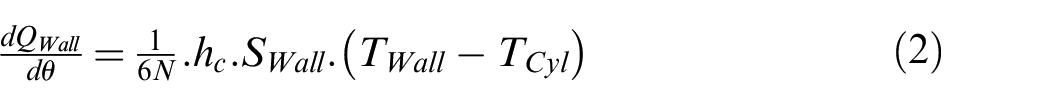
Where N is the engine speed,
Values of
with
The different phases of combustion propagation were determined by estimating different characteristic timings, named BMFXX, which are the Crank Angle degrees corresponding to XX% of the burnt mass fraction.
The wet exhaust gases were analyzed using a Gasmet Fourier Transform Infrared (FTIR) spectrometer to assess H2O, CO2, NO, CO, THC, and NH3 concentrations. The FTIR did not make it possible to measure thresholds <50 ppm of N2O for the present spectra optimization: no higher detection was noted.
Operating conditions
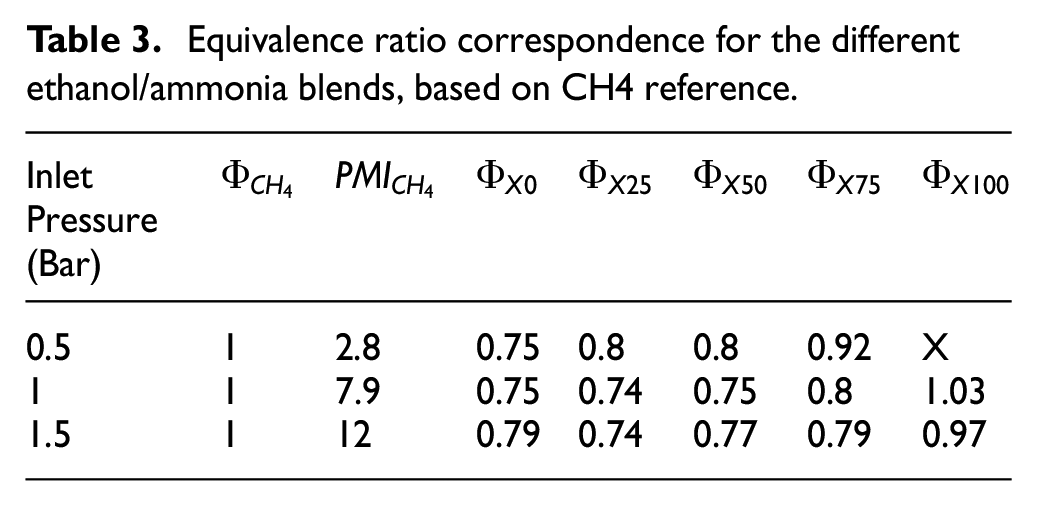
The performances and the pollutants emissions are compared as a function of the different fuel compositions at constant IMEP. Each operating condition is selected with optimum Start Ignition Time (SIT) and a fuel mass injected to obtain the target IMEP with a minimum Coefficient of Variation (COV) defined as the standard deviation of IMEP on the mean IMEP. These targets IMEP were obtained with the methane (CH4) conditions (reference case) for the three intake pressures, as indicated in Table 3. Two strategies for the fuel injection were explored: the homogenous condition which corresponds to a fuel injection timing (Start of Injection – SOI) at 175 CAD before Top Dead Center (bTDC) and the stratified condition to a SOI of 90 CAD bTDC. Table 4 sums up the experimental conditions.
Equivalence ratio correspondence for the different ethanol/ammonia blends, based on CH4 reference.
Experimental conditions for both injection strategies.
From pure ethanol to pure ammonia, the different fuel compositions follow the complete combustion reaction described:

By considering 1 mole of
The thermal and combustion efficiencies are defined as:


With
Kinetics modeling
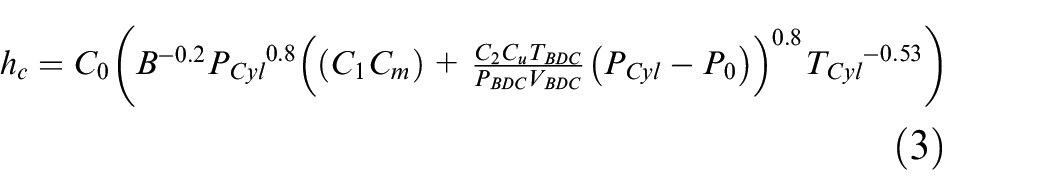
Two-zones spark-ignition engine model in Chemkin Pro – Ansys was used to simulate the experimental conditions in order to help the analysis. The experimental BMF10, BMF50, BMF90, and SIT are the input data to fit the Wiebe function for the built-in OD simulation. This function describes the mass transfer between the two zones. For this simulation, the mixture was only assumed homogenous, even if the experiments are not in fully premixed conditions. The heat losses are calculated in the simulation by the implementation of the heat transfer coefficient
Results and discussions
The results presented correspond to the intake pressure set at 1 bar (IMEP = 7.9 bar) for the two strategies homogenous and stratified to limit the number of figures.
Homogeneous results
The homogenous strategy corresponds to a SOI at 175 CAD bTDC to ensure a premixed mixture before ignition. The methane reference points are added to the figures. In the case of pure ammonia, the injection was set earlier at 340 CAD bTDC due to the combustion instabilities.
Performances
The Lower Heating Value (LHV) of the fuel, plotted in Figure 2(a), decreases slowly up to 50% of NH3 in the blend and few changes of the mass injected are needed to maintain the constant energy input. However, for a higher ammonia ratio, the LHV decreases strongly due to the high difference between LHV of ethanol and ammonia, that is, a ratio of 3.9. Compensation by more fuel is necessary to increase the fuel energy and target the same IMEP. Figure 2(b) shows the pressure traces as a function of the crank angle for the different fuel compositions. The maximum pressure is in the same order of magnitude for all, reaching around 12 CAD after TDC (aTDC). The small differences are due to the same target of IMEP. The COV, in Figure 2(c), highlights good engine stability, less than 1.5% for pure ethanol, and blends and lower than 5%, for pure ammonia. The heat release rate is plotted as a function of the crank angle, in Figure 2(d): the maximum decreases as a function of the ammonia content increase and the combustion duration increases. Thirty CAD is necessary to release almost all the heat for pure ethanol. But for pure ammonia, the maximum is 40% less than for pure ethanol, and a double combustion duration can be noticed. This longer combustion duration is also visible in the burned mass fraction in Figure 2(e). This can be explained by the difference in combustion duration between ethanol and ammonia.
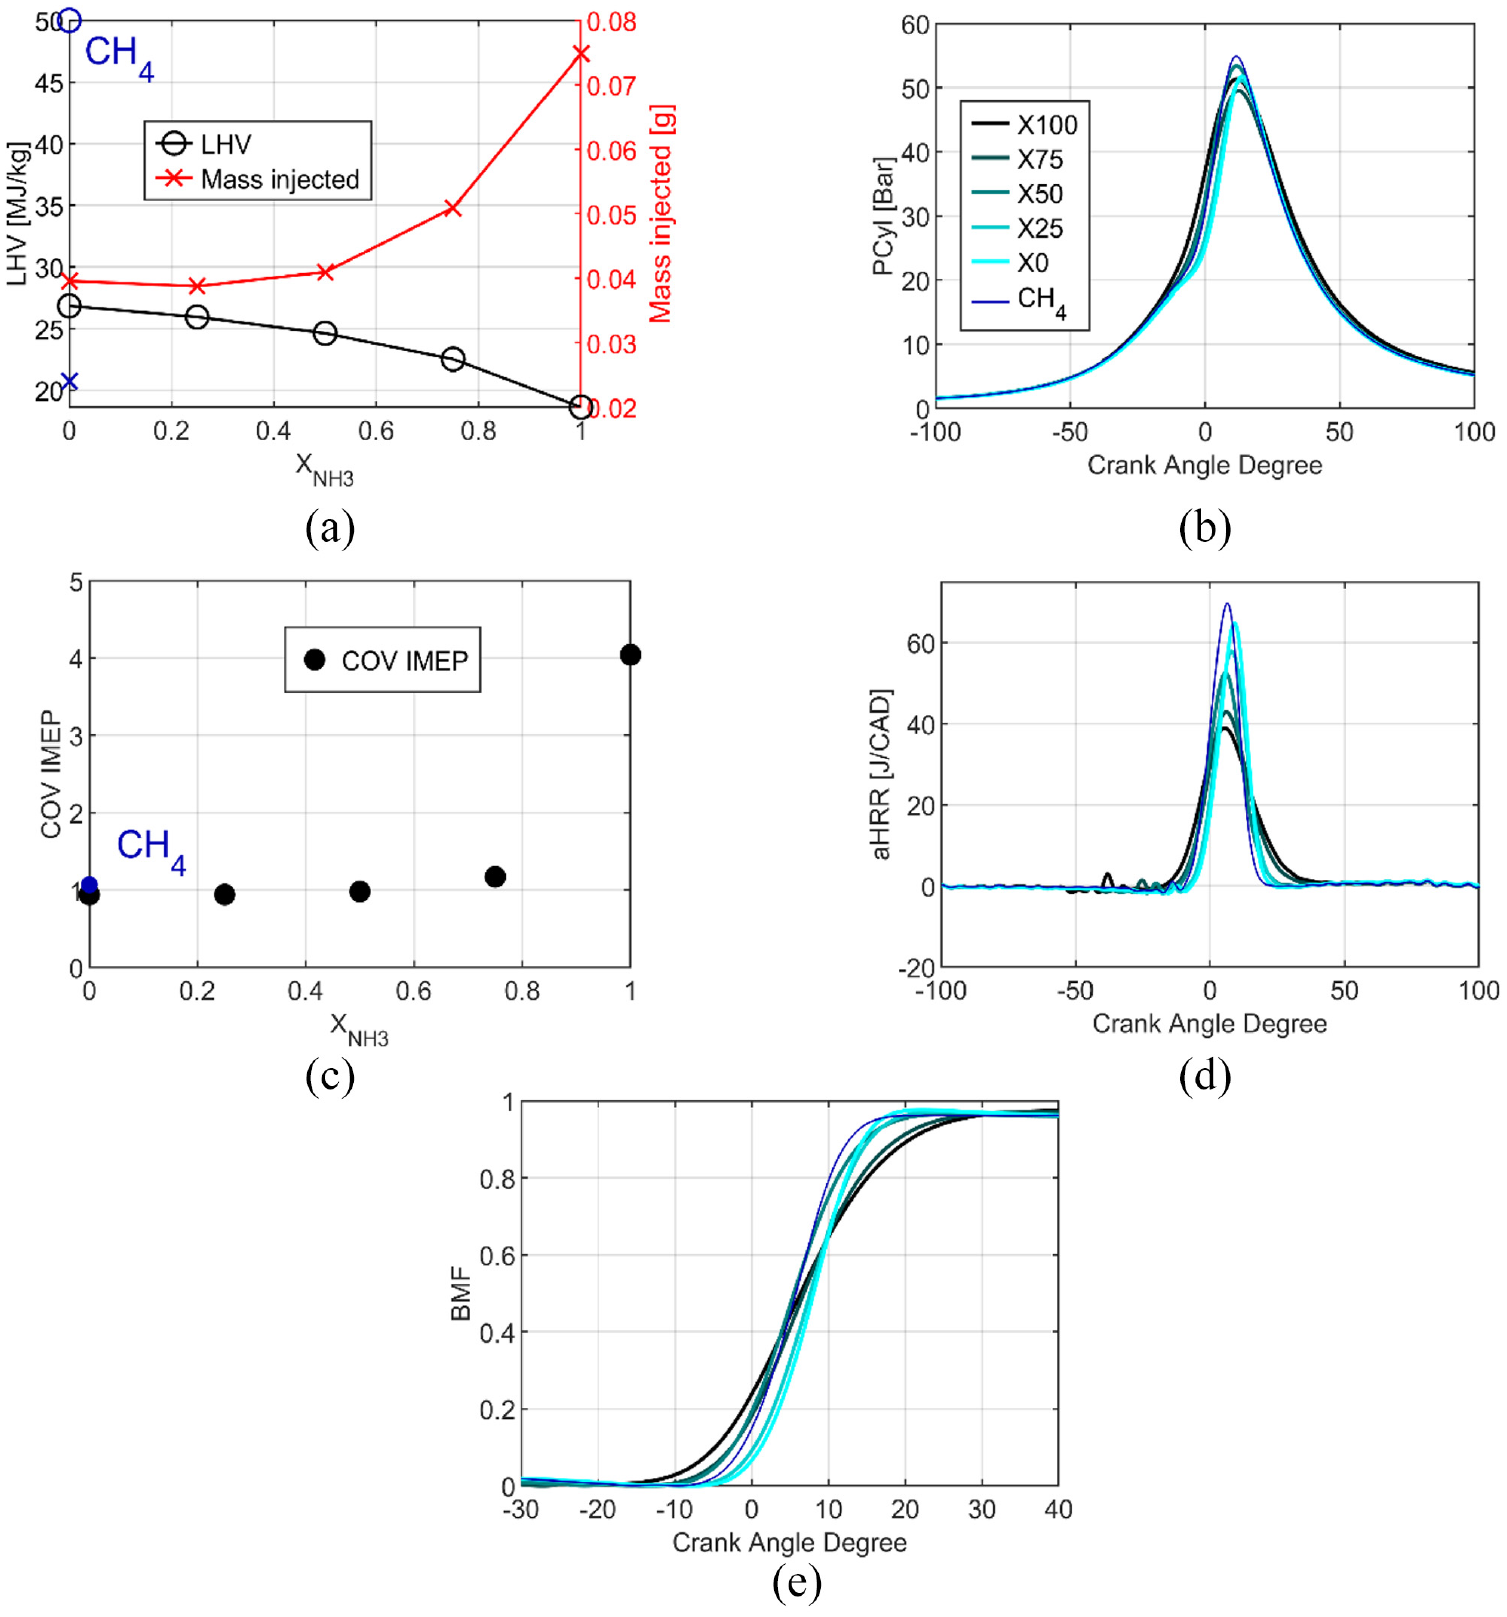
Combustion specificities as a function of the Ethanol/Ammonia blend, LHV at stoichiometric ratio (a), in-cylinder pressure (b), cycle by cycle stability (c), apparent heat release rate (d) and burned mass fraction (e) at 1 bar of intake pressure and homogeneous injection strategy.
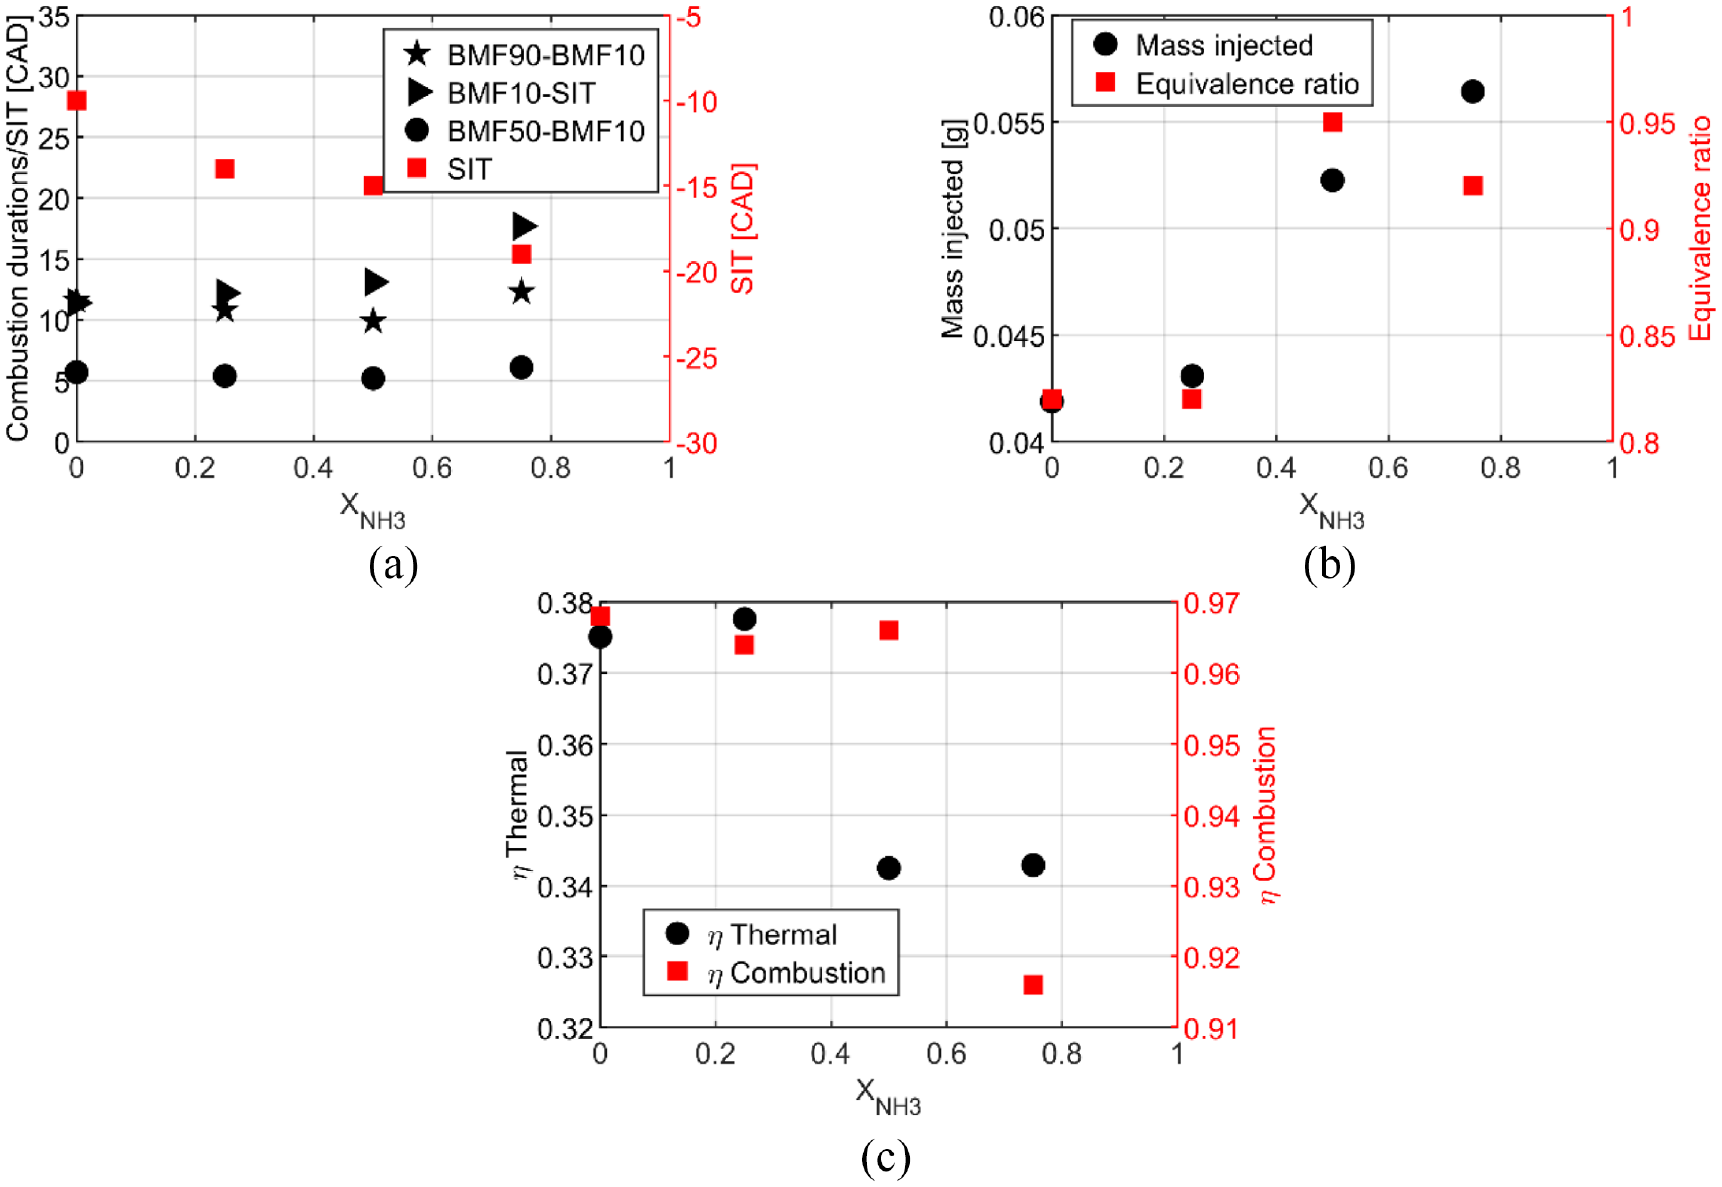
Figure 3(a) shows the characteristic durations as BMF90-BMF10, the combustion duration, BMF10-SIT, the flame kernel development, and BMF50-BMF10, the self-sustained flame propagation phase and a non-linear increase with ammonia content is observed and even more for the kernel development and the total duration.
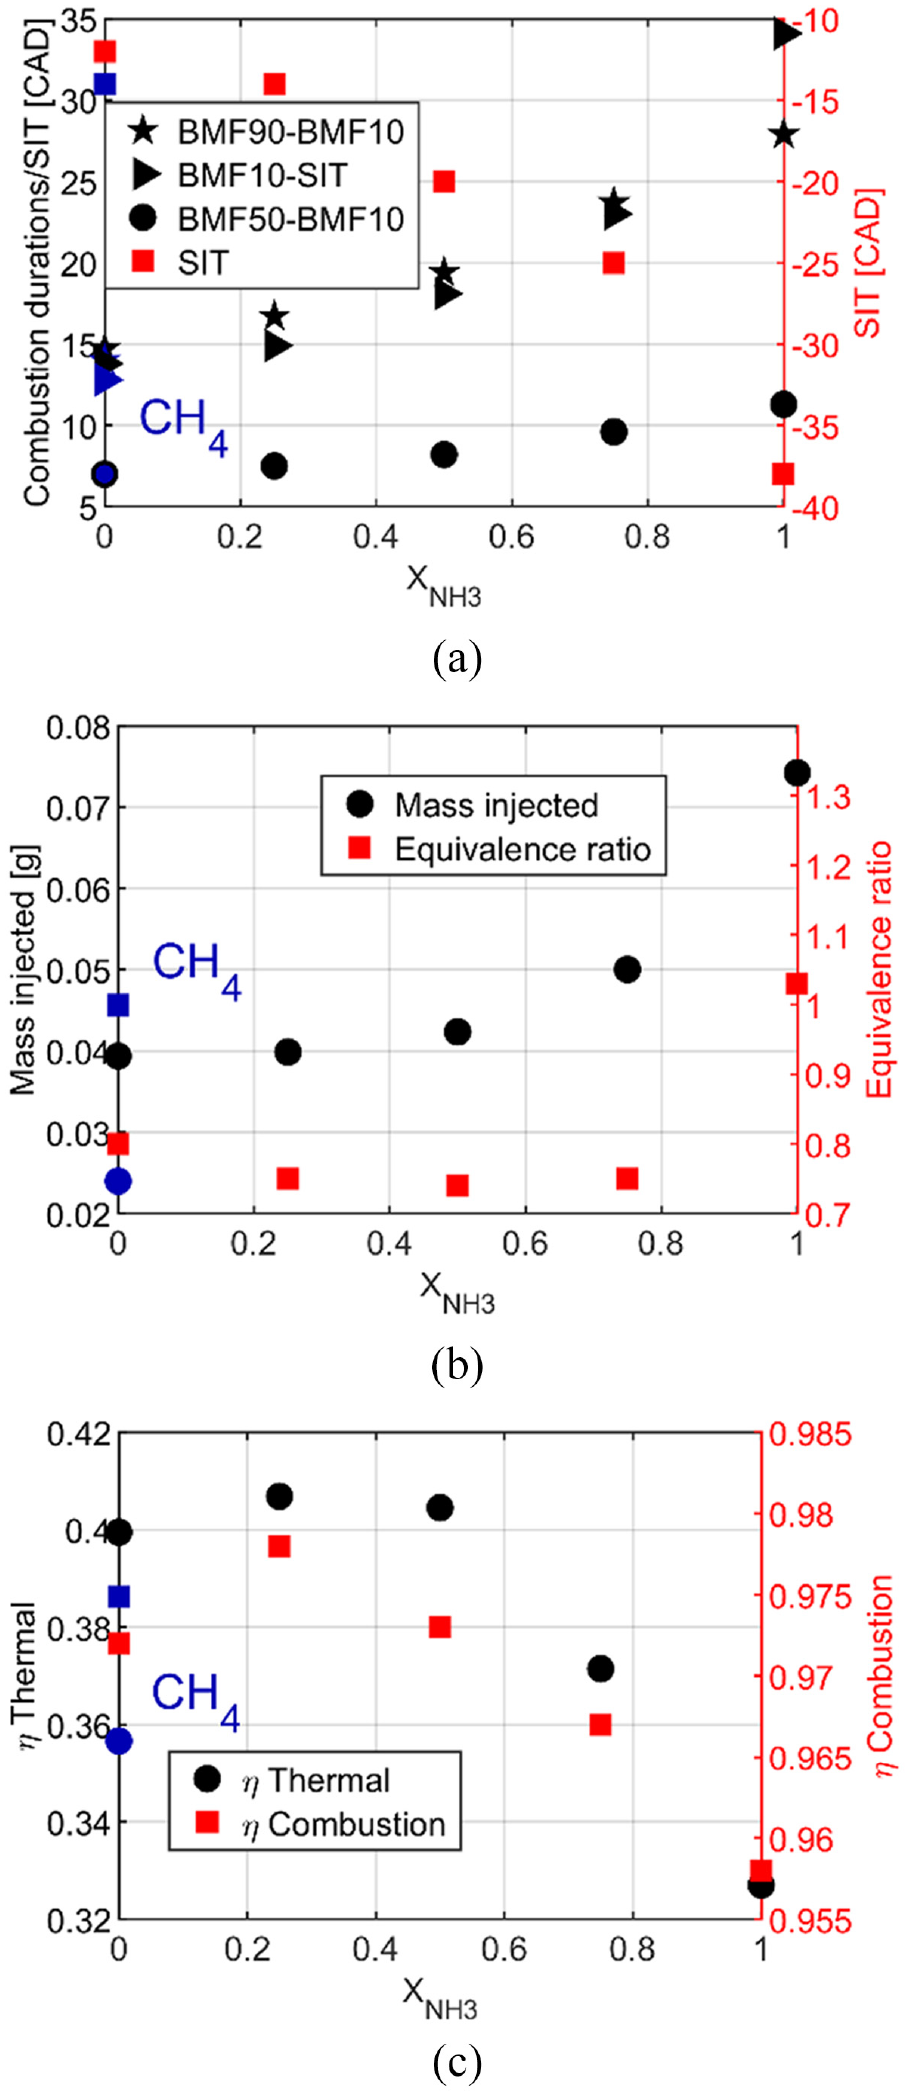
Characteristic of different combustion durations (a), fuel consumption and global equivalence ratio (b), and thermal and combustion efficiencies (c) for all fuel compositions at 1 bar of intake pressure and homogeneous condition.
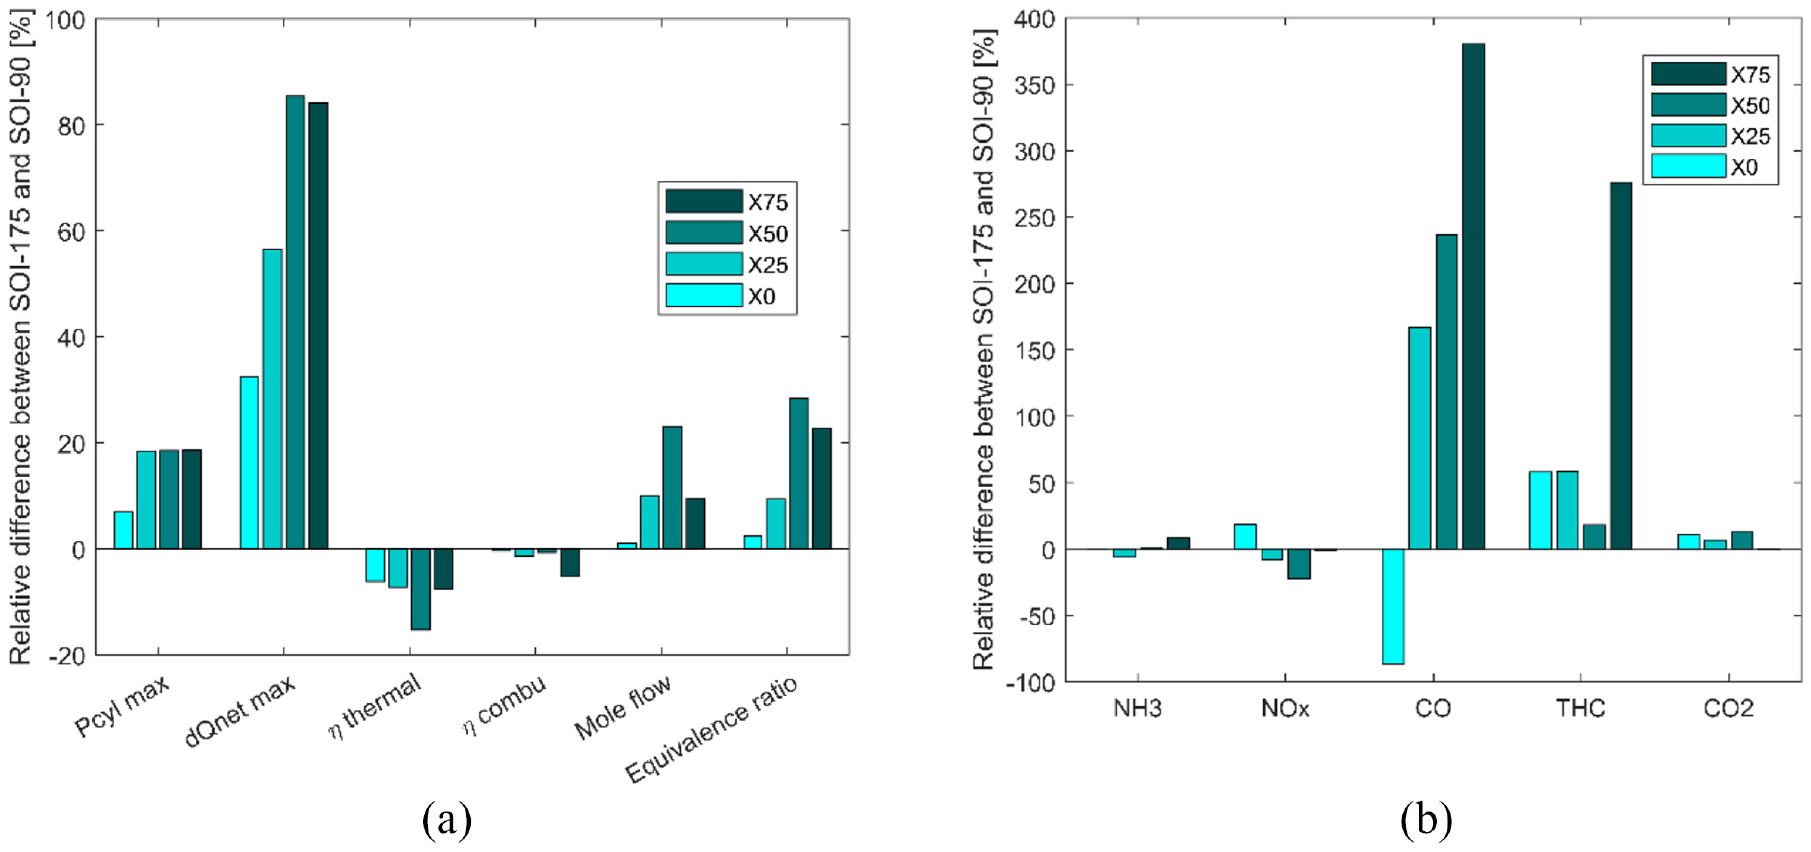
The change of combustion durations with the ammonia content increases mainly due to the decrease of laminar flame speed with ammonia content, −41% and −86% from pure ethanol to X50 and pure ammonia respectively, at ignition conditions, with CEU mechanism, Figure 4.
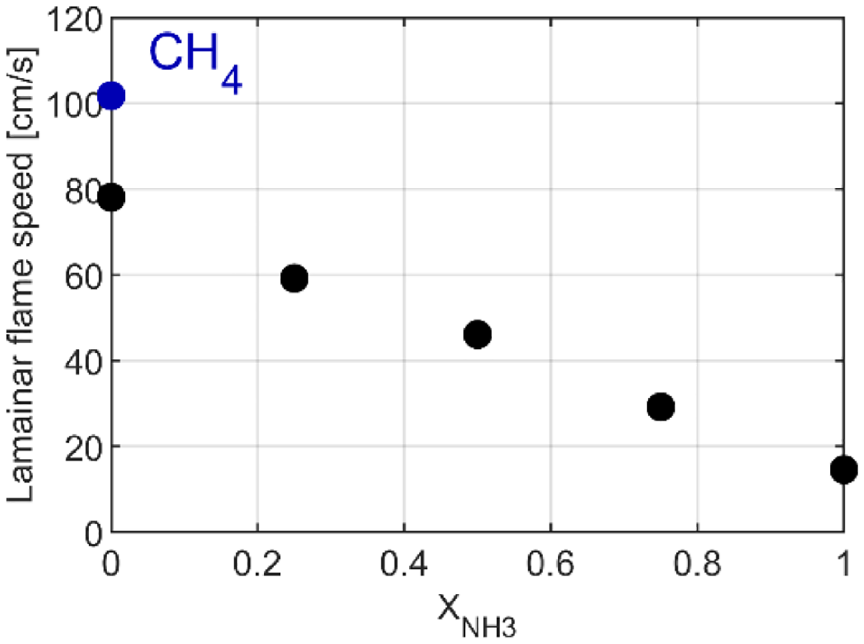
Laminar flame speed for all fuel compositions at ignition conditions, predicted by CEU mechanism at 1 bar of intake pressure and homogeneous conditions.
Due to these characteristics of combustion durations, the start of ignition should be advanced by increasing the ammonia content to have the optimal IMEP with minimum fuel consumption. The fuel consumption is shown Figure 3(b) and increases with the ammonia content to counterbalance the decrease of the LHV, Figure 2(a), and the combustion efficiency, Figure 3(c). The combustion efficiency is maximum for X25 and then decreases with ammonia increase to reach a minimum at 0.958. The thermal efficiency, Figure 3(c), has the same behavior as the combustion efficiency and up to 40.5% for X25, providing good performances and a positive effect of ammonia by considering ethanol as the main fuel. It has to be underlined that the global equivalence ratio, Figure 3(b), is lean for pure ethanol and blends but at the stoichiometry for pure ammonia. It can be explained by the injection strategy at 340 CAD bTDC that decreases the intake airflow and consequently increases the global equivalence ratio.
Pollutant emissions
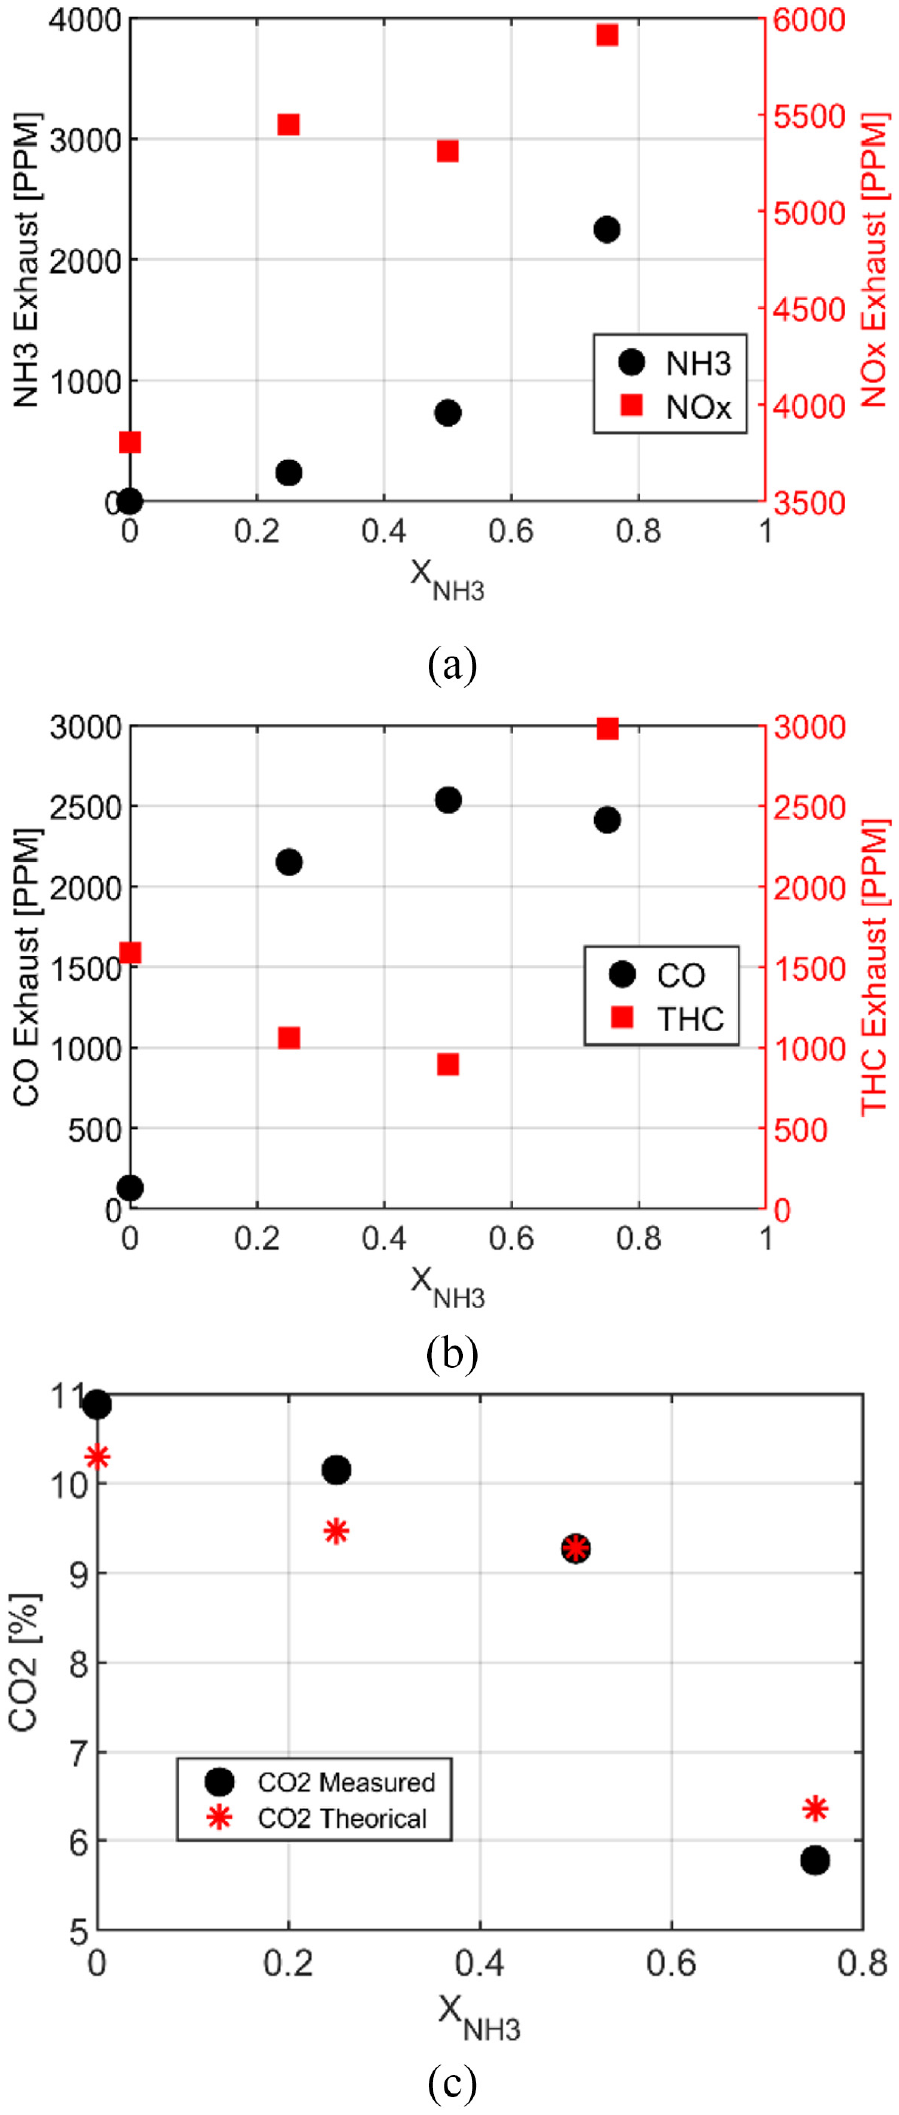
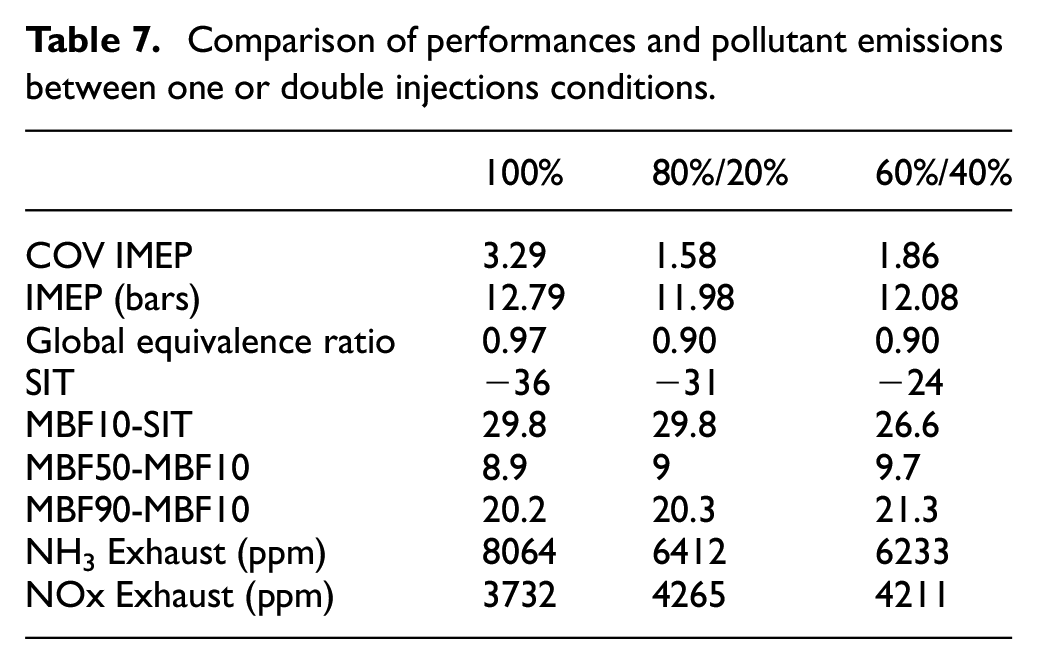
NH3 exhaust, Figure 5(a), increases as a function of the ammonia content, and furthermore pure ammonia reaches the highest value due to the high equivalence ratio. In terms of NOx, the behavior is completely non-linear with a maximum value 4 times higher than in the case of pure ethanol and obtained for X50. The lean equivalence ratio of blends and ethanol are favorable conditions for NOx formation and the addition of nitrogen from ammonia increases the NOx formation. The same trend was observed for methane/ammonia27,28 with a maximal NO emission for a 50/50 blend. NOx emissions for pure ammonia are lower by 12% than for pure ethanol, mainly due to an equivalence ratio a bit higher than the stoichiometry. Some details about reaction paths are provided in the following. The Total unburnt HC (THC) emissions evolution, Figure 5(b), are not linear with the amount of ammonia, always lower for the blends than for pure ethanol with a minimum for X25, and zero THC for pure ammonia as expected. CO emission decreases with the decrease of carbon content in the fuel composition. However, in Figure 5(c), CO emissions as a function of the load (i.e. intake pressures) highlight the non-linear dependence on ammonia content with a maximum for X25. Niki 29 confirmed that CO emissions for blends of diesel and ammonia increase with the NH3 intake flow rate in a diesel engine. Moreover, Ryu et al. 14 showed a rise in CO emissions for a blend of 60%NH3/40% DME. As not expected, adding free carbon fuel could not reduce carbon emissions and as a function of the conditions could have a reverse effect. Figure 5(d) compares CO2 emissions measured and CO2 resulting from the combustion reaction described in equation (5), the trend is very similar for both. To reduce by a factor 2 the CO2 emissions, adding 80% of NH3 is necessary.
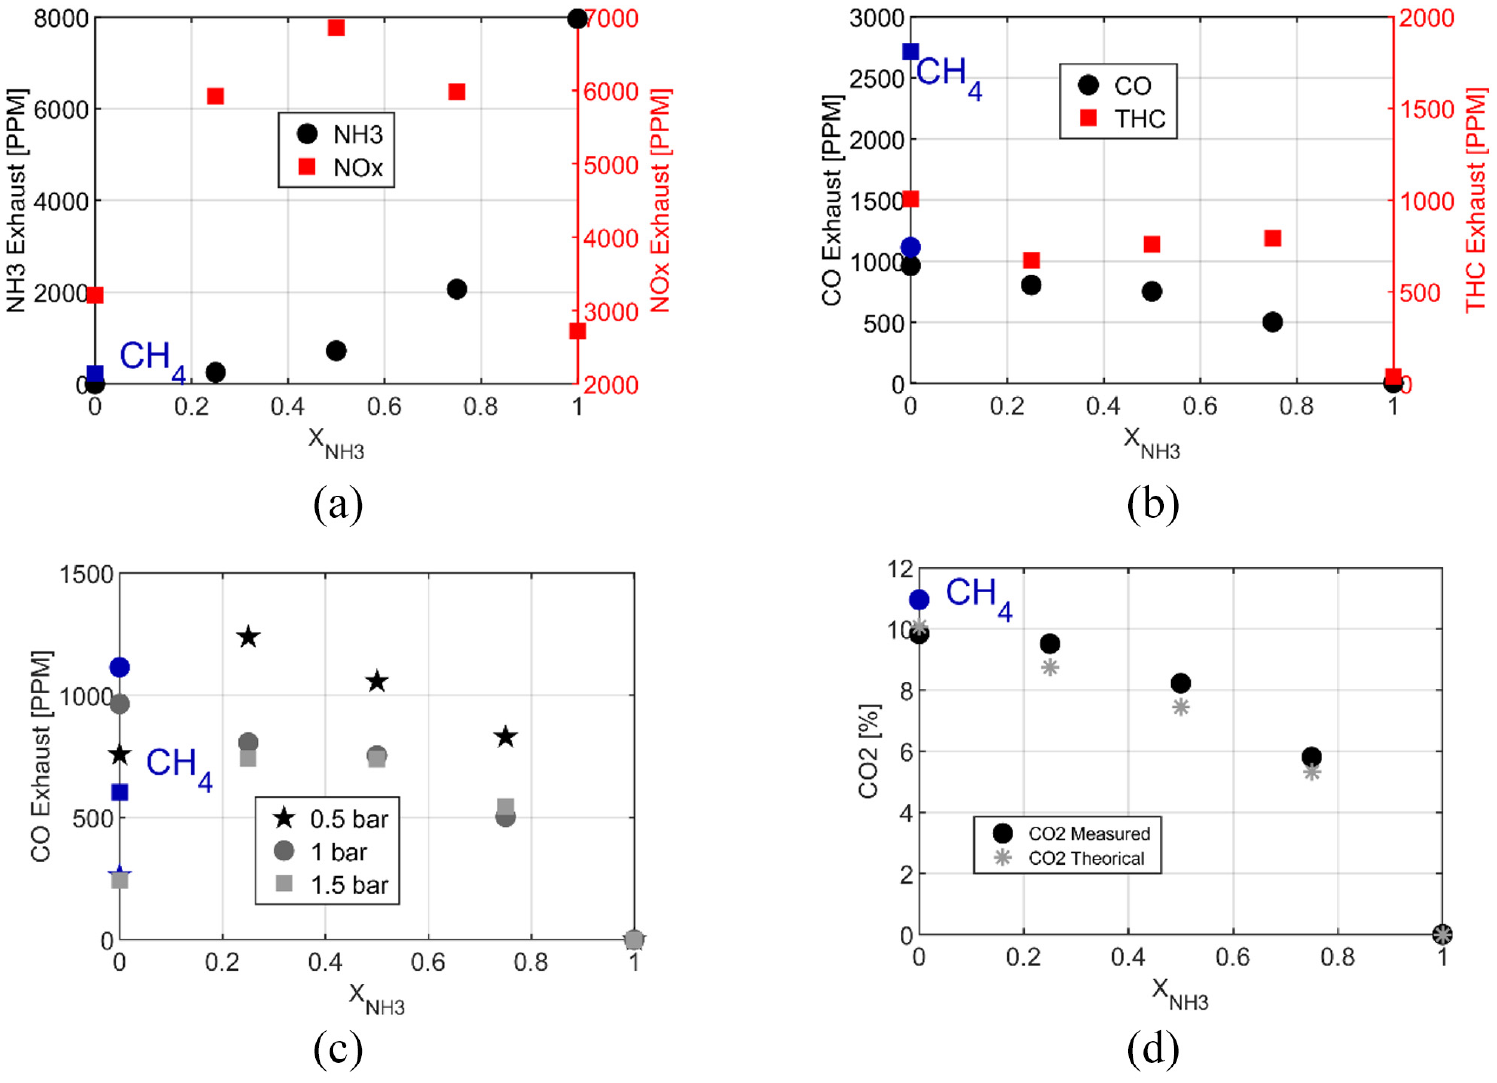
Pollutant emissions as a function of the ethanol/ammonia blends: NH3 and NOx (a), CO and THC (b) at 1 bar of intake pressure, CO (c) at 0.5,1 and 1.5 of intake pressure and CO2 (d) at 1 bar of intake pressure under homogeneous condition.
The results of the simulations are shown in Figure 6 for the same previous conditions. The simulated pressure, Figure 6(a), is overestimated by around 10 bar (up to 20 bar for pure ethanol) compared to the experimental results. Due to the inaccurate estimate of the wall heat losses, the estimated in-cylinder temperature reaches 2517K for pure ethanol (X0), as can be seen in Figure 6(b) while only 2122K, for X75. The highest CO and NO mole fractions are obtained for pure ethanol (X0), as can be seen in Figure 6(c). Then, the peaks of CO and NO mole fractions inside the cylinder decrease with ammonia addition, as opposed to the experimental values measured at the exhaust that does not present any trend. But CO is estimated as being totally post-oxidized due also to the high in-cylinder temperature Moreover, the maximum of NO productions seems to be linked to the maximal CO one, as highlighted in Figure 6(d), for the blends, and pure ethanol. The relation between the CO and NO production can provide additional information to understand the similarities of the experimental trend of NO and CO as a function of ammonia content, Figure 5(a) and (c).
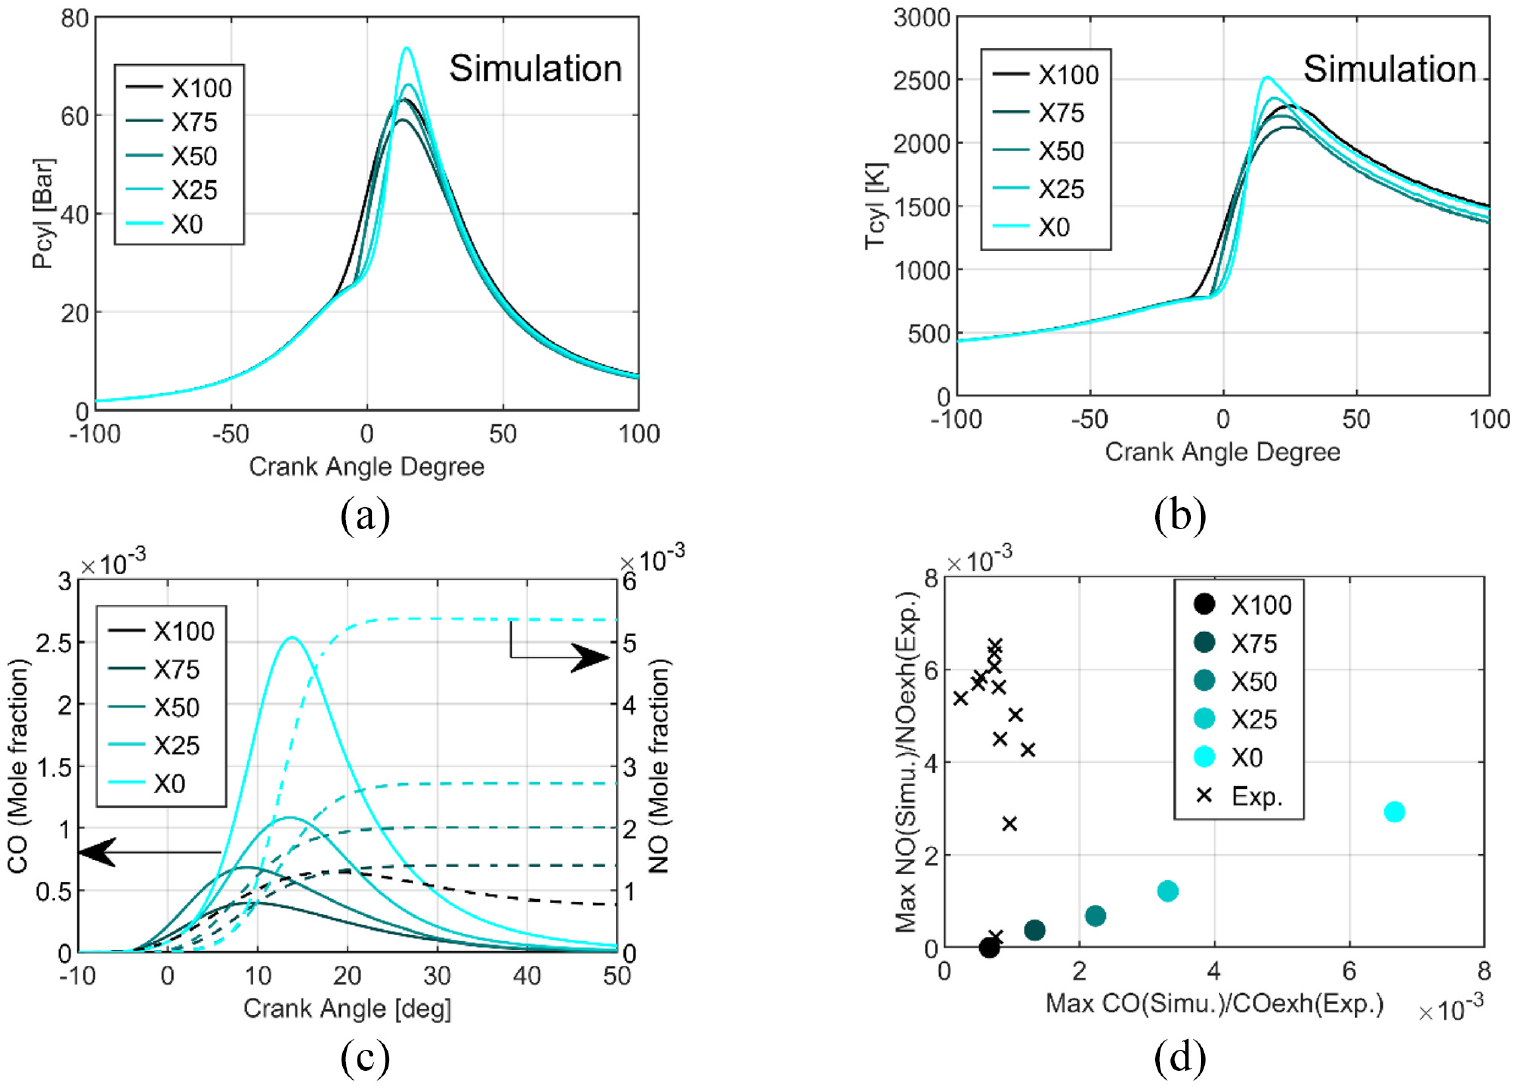
Results from OD kinetics simulations for all fuel compositions: in-cylinder pressure (a), in-cylinder temperature (b), CO (continuous line) and NO (dashed line) mole fraction evolutions (c) and the relationship between maximum of CO and NO mole fractions compared to the experimental data at the exhaust (d) at 1 bar of intake pressure.
The kinetics simulations complete the analysis to better understand pollutant formation. The 10 reactions that most influenced the production of NO were selected. Their rates of production were integrated during the total duration of the simulation and compared to the integrated global rate of production of NO. Figure 7 illustrates the influence of the different pathways on NO production and three major pathways are identified.
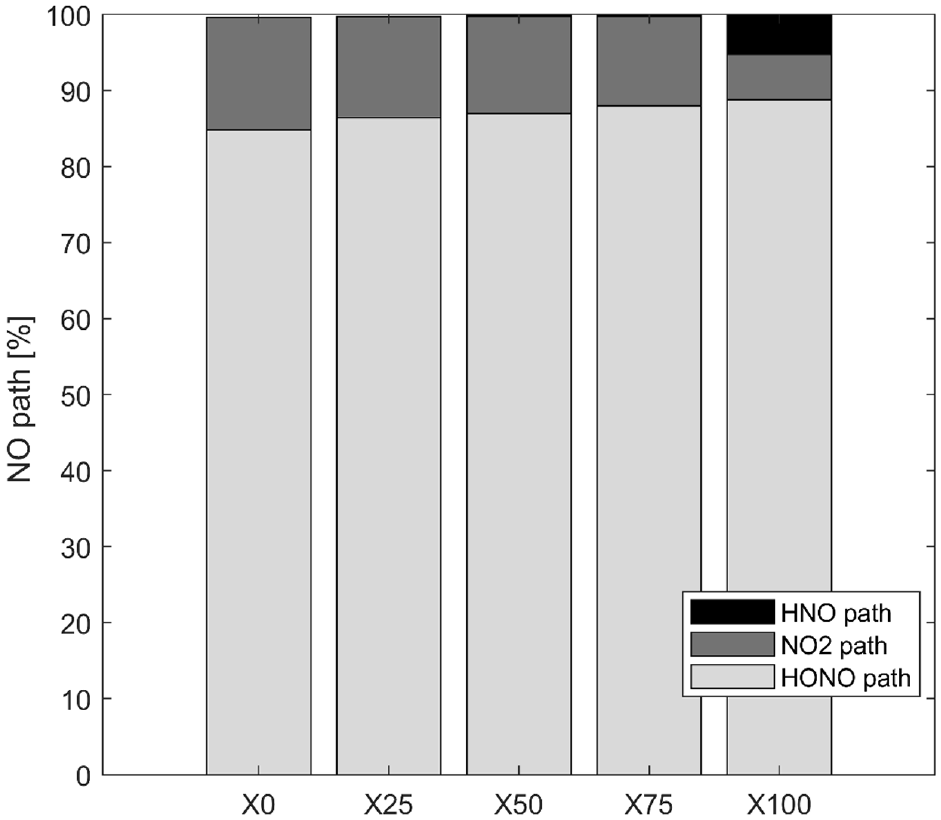
Percentages of the different pathways of NO production at 1 bar of inlet pressure for all fuel compositions with ethanol at 1 bar of intake pressure and homogeneous condition.
The thermal path is not identified in the NO formation, but Figure 7 indicates about 85% of the NO is formed via the HONO path following this reaction (reverse path):

This reaction occurs above 1060K and its importance increases with the ammonia fraction. Another path via the NO2 path is important for fuel composition with ethanol, 12%−15% of the NO production, while it is 8% for pure ammonia. The reaction of the NO2 path becomes important at 1060K and follows:

The HNO path is in the minority for pure ethanol and blends while for pure ammonia this HNO path is not neglected as shown also in Chiong et al. 30 and contributes to 5% of the production following these reactions:


The R6 contributes to 95% of the NO formation from this kinetic mechanism. The sudden change of NO2 to HNO reaction path for blends to pure ammonia is remarkable. This difference can be explained by the high equivalence ratio for pure ammonia (ER = 1.03) compare to the other fuel composition (ER∼0.75) influencing strongly the reaction paths.
HNO and HONO are also produced in fuel composition with carbon by following these reactions:


These reactions are mainly produced in burnt gases and can be one of the ways to understand the non-linearity dependence of NO and CO on the amount of NH3. Adding a small quantity of NH3 as X25 increases the quantity of NH pool while the CO2 decreases weakly and consequently HNO and CO productions increase. Then, HNO reacts to give NO via HNO or HONO path.
The trends as a function of the amount of ammonia are identical to the other intake pressures. Figure 8 compares the results for 1 and 1.5 bar relative to 0.5 bar by relative difference calculated as:
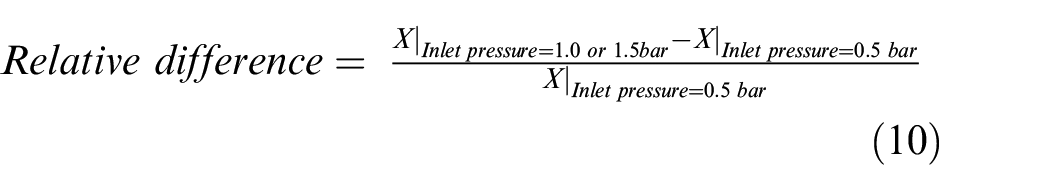
The relative differences as a function of the load (intake pressure) on the performances (a) and pollutants (b) for the X50 and homogeneous strategy.
Figure 8(a) shows the relative difference for the efficiencies and the equivalence ratio in the case of X50. Rising the inlet pressure increases the thermal efficiency increases up to 28% and 24% for 1 bar and 1.5 bar respectively providing better results at 1 bar. The combustion efficiency increases up to 0.7% and 1.2% respectively as the equivalence ratio becomes leaner by increasing the intake pressure. In terms of pollutants, unburnt NH3 emissions decrease mainly due to the increase in combustion efficiency and in oxygen content (i.e. leaner mixture). On the contrary, NOx emissions increase with the effect of intake pressure while CO and THC decrease.
Focus on pure ammonia performance
Supplementary data for pure ammonia was done to minimize the fuel consumption as a function of the intake pressure, the conditions are detailed in Table 5. The change in injection duration provides an increase of ER from 0.89 to 1.13. It was not possible to burn ammonia only for lower injection duration under homogeneous conditions.
Extended conditions for pure ammonia.
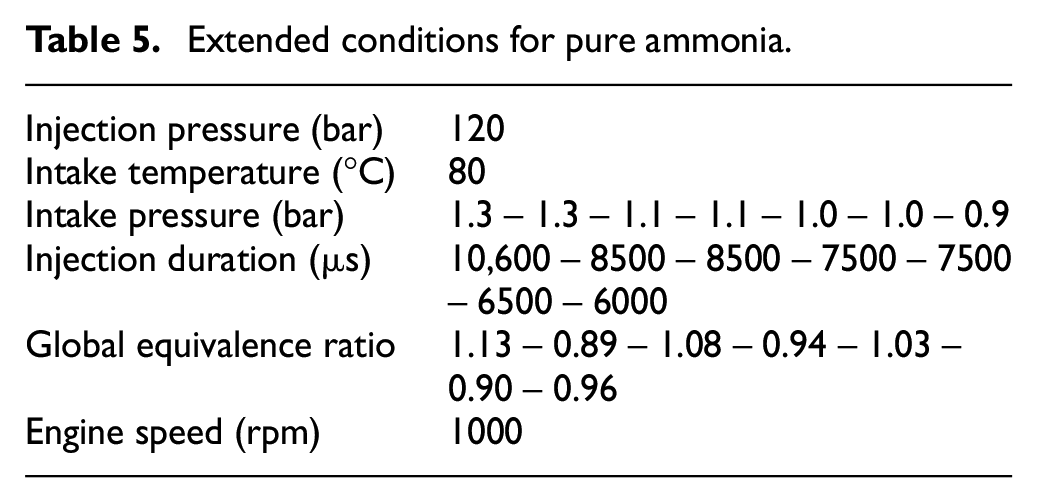
Figure 9 focuses on these additional conditions for pure ammonia in a fully premixed strategy with injection at 340 CAD bTDC. The low COV, Figure 9(a), shows very high stability of combustion for pure ammonia and even better in rich conditions (ER = 1.13), and the thermal efficiency for pure ammonia was observed at about 0.33 for all extended conditions. As expected, unburnt NH3 emissions are relatively important but constant as a function of the equivalence ratio. NOx emissions can decrease until 1500 ppm for the highest IMEP, obtained for the richest mixture. The aHRR in Figure 9(c) shows an increase with equivalence ratio when in Figure 9(b), NOx decrease. Figure 9(d) shows the burned mass fraction evolution, where the total duration is reduced by increasing the equivalence ratio until rich mixture (ER = 1.08 and 1.13). These data prove the feasibility of direct liquid injection of ammonia even if a deeper study should be done to fully understand and characterize the performances and pollutant formations.
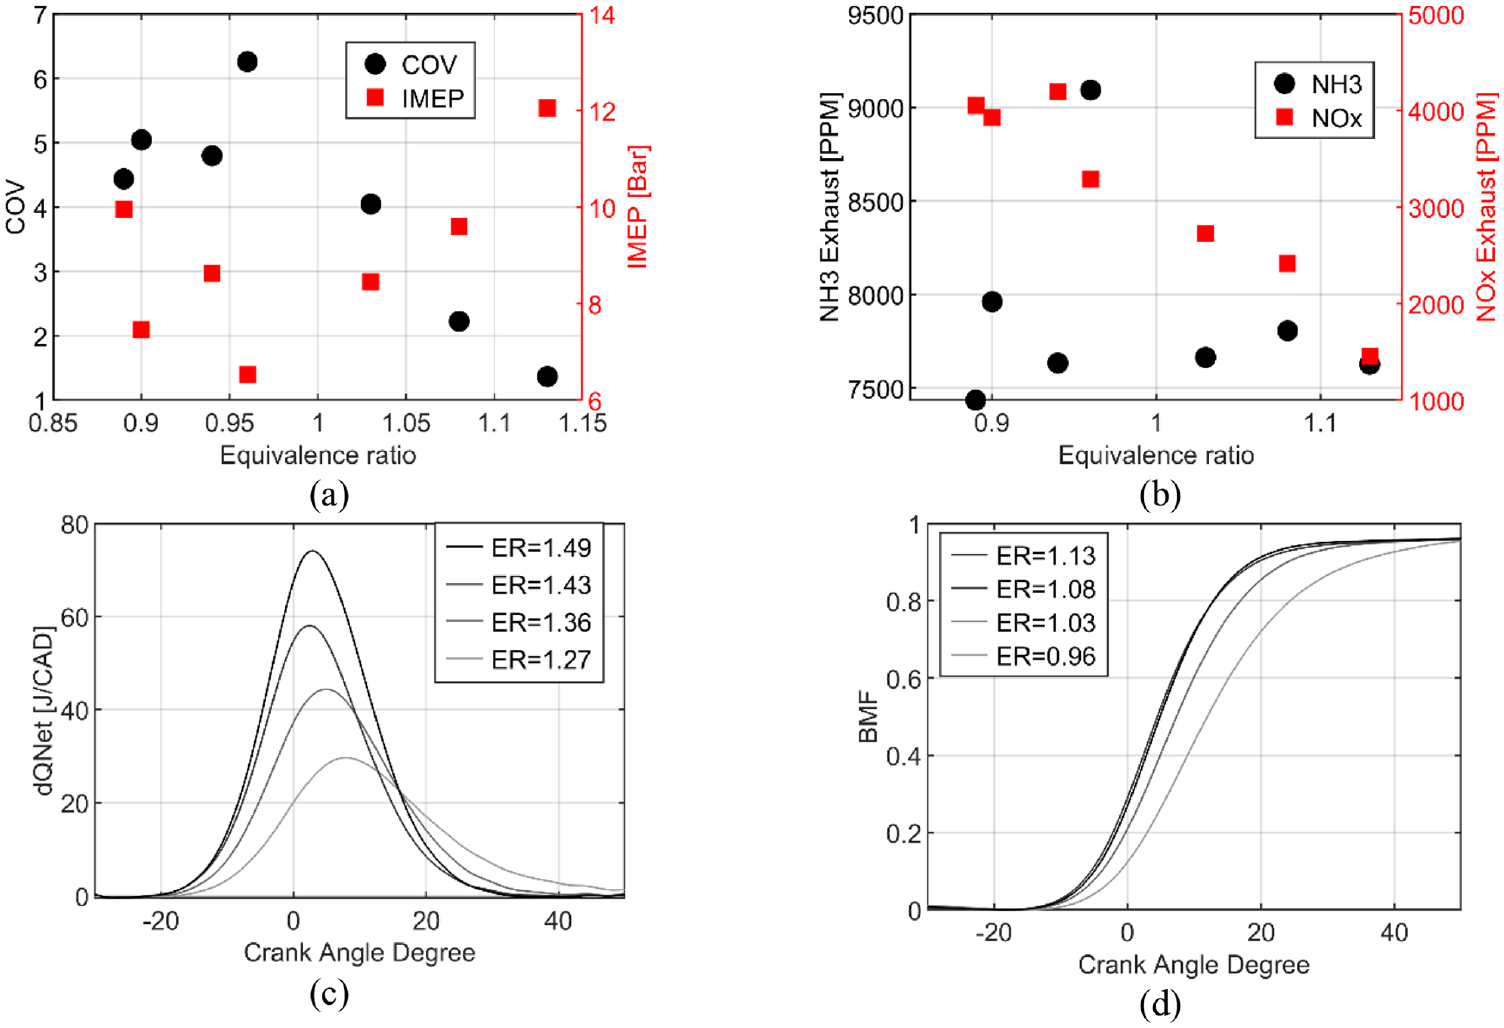
IMEP and COV (a) and unburnt NH3 and NOx emissions (b) and aHRR (c) and burned mass fraction (d) for extended conditions with pure ammonia at homogeneous conditions.
Stratified results
A second strategy was explored to evaluate the impact of the injection time on the measured performance and the pollutant emissions. The liquid fuel was kept injected at SOI 90 CAD bTDC; nevertheless, this strategy was not adapted to pure ammonia.
Performances
Figure 10(a), shows the in-cylinder pressure for the different fuel compositions, the maximal pressure is obtained for X75, and the minimal one for pure ethanol. The heat release rate, Figure 10(b), is not sorted with the ammonia content, nevertheless, it is higher with a shorter duration for the stratified strategy than the homogeneous one. The higher heat release rate can be explained by the increase in fuel consumption and consequently by the equivalence ratio, consequently, the fuel energy as indicated in Figure 11(a). The fuel consumption is higher while the IMEP is identical (Figure 12(a)). The burned mass fractions are similar for the different fuel compositions except for pure ethanol, shifted from 3.7 CAD. Under the conditions, the engine keeps very good stability with COV of less than 1.5% (Figure 10(d)).
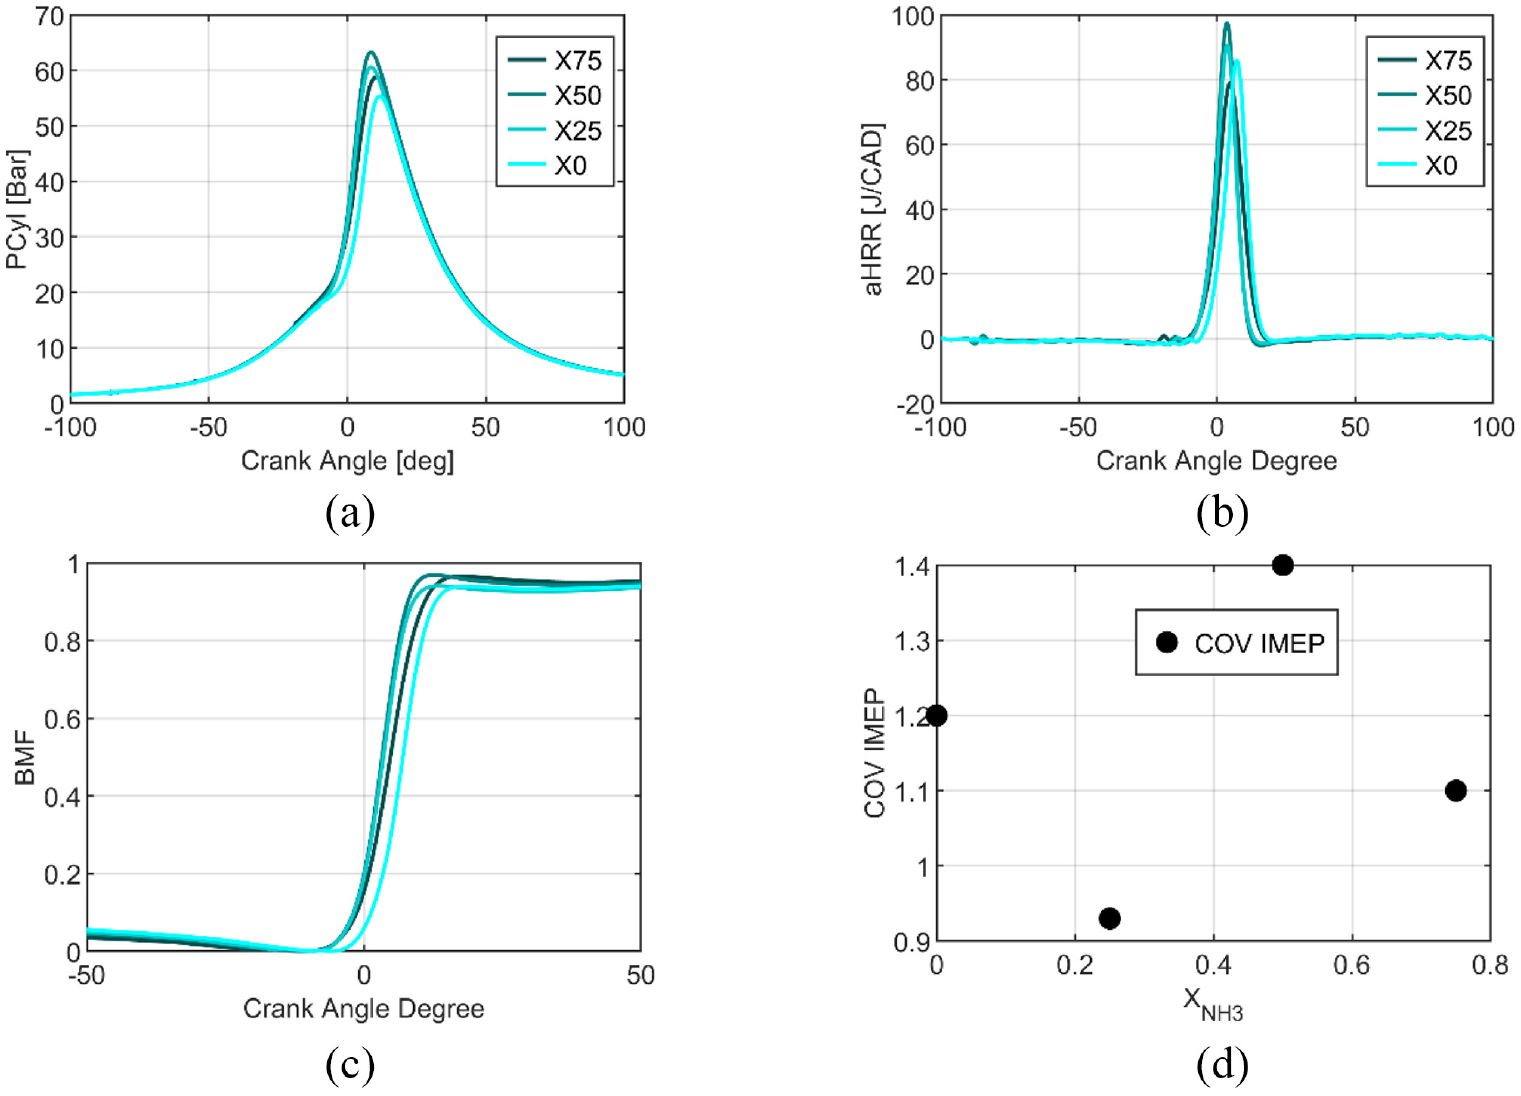
Global characteristics of performances for pure ethanol and blends, in-cylinder pressure (a), heat release rate (b), burned mass fraction (c), and stability (d) at 1b of intake pressure for stratified conditions.
Comparison of performances (a) and pollutant emissions (b) between the homogeneous and stratified strategies for all fuel blends.
Characteristic timings of combustion (a), fuel consumption and equivalence ratio (b), and efficiencies (c) for pure ethanol and blends at atmospheric intake pressure for stratified condition.
Figure 12(b) focuses on the characteristic durations of combustion: BMF50- BMF10 and BMF90-BMF10 are almost similar for all the fuel blends and lower than the homogeneous strategy. However, BMF10-SIT, the first stage of combustion, increases with ammonia content increase but is two times lower than for the homogeneous strategy. The stratified strategy accelerates the combustion and the SIT is less advanced, 20 bTDC versus 25 CAD bTDC for X75 with homogeneous conditions. However, the thermal and combustion efficiencies decrease (Figures 11(a) and 12(c)). The maximal thermal efficiency obtained is for X25 as in the homogeneous conditions.
Pollutant emissions
In terms of pollutants emissions, all trends as a function of ammonia content are similar to the homogeneous strategy (Figure 13). Figure 11(b) indicates a decrease of unburnt NH3 emissions for X25 compared to the homogeneous strategy while for X50 and X75, NH3 exhaust increases. NOx and CO emissions, Figure 11(b) have an interesting trend versus ammonia addition. NOx increases for pure ethanol with this injection strategy but decreases with the ammonia addition. On the contrary, CO emissions decrease for pure ethanol but roughly increase for blends compared to the homogeneous strategy. The presence of NH3 in the fuel composition clearly influences the change of formation of NOx and CO between both strategies. The difference in THC emissions increases between both strategies and strongly for X75. The CO2 emissions are also higher for this one.
Pollutant emissions of NH3 and NOx (a), CO and THC (b), and CO2 (c) for pure ethanol and blends at atmospheric intake pressure for stratified condition.
Pure ammonia injection
Injection of pure liquid ammonia at 90 CAD bTDC was not feasible, nevertheless, splitting the injection was tested. The ratio between the first and second injections, 50%/50% was not possible (instabilities, misfiring), at least more than 50% must be injected during the first injection under homogeneous conditions. Two conditions were done with constant fuel injection, 102 mg/cycle, the first injection of 80% and 60% of the load at 340 CAD bTDC with a second one 20% and 40% of the load at 90 CAD bTDC the Table 6 shows the operating conditions.
Extended conditions for the split injection.
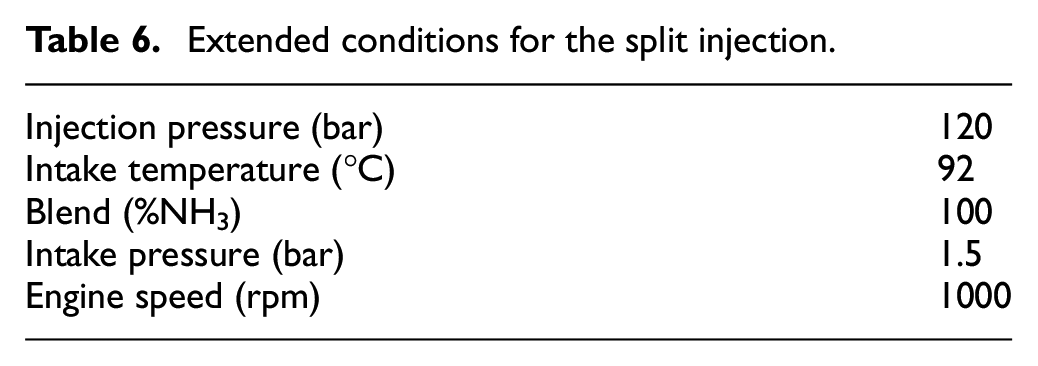
Table 7 compares the fully premixed to the split injection conditions. The COV is low showing high stability and further for the split injection with slightly lower IMEP. However, the thermal and combustion efficiencies are constant, 0.35 and 0.96 respectively for all extended conditions. The equivalence ratio decreases due to the diminution of fuel injected during the intake phase increasing the airflow for the split injection conditions while the fuel mass injected remains constant. The SIT was delayed to maximize the IMEP with the split injection strategy. Regarding the combustion durations, they are identical except for the flame kernel development duration: for the condition 60/40, the flame kernel speed is certainly enhanced by the enrichment of the local mixture around the spark plug due to the more important second injection amount. In terms of pollutants emissions, NH3 emissions decrease while a slight increase in NOx.
Comparison of performances and pollutant emissions between one or double injections conditions.
The in-cylinder pressure and the heat release rate evolutions for the three conditions of injection (Figure 14) indicated that the combustion is delayed with a maximal pressure decrease with the increase of fuel injected during the second injection due to the combustion phasing later in the cycle. However, the heat release rate increases by 3% and 5% with the double injection 80/20 and 60/40 respectively compared to single injection.
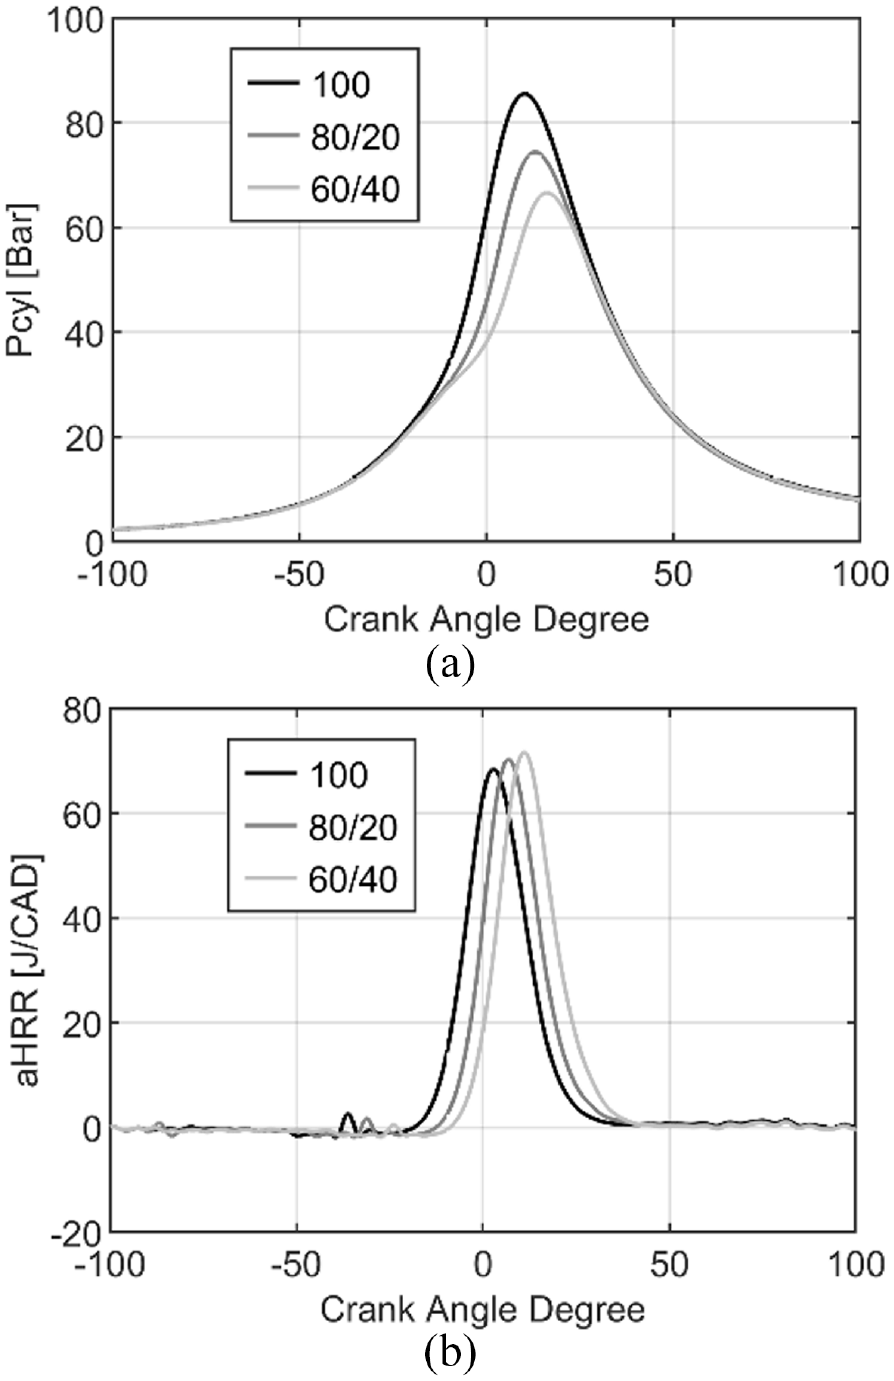
Evolution of In-cylinder pressure (a) and aHRR (b) for pure ammonia with single or double injections.
Conclusions
This study provides the first information about ethanol blended with ammonia and pure ammonia using a single-cylinder spark-ignition engine with direct injection. Two strategies of injection were investigated, homogeneous and stratified one at different intake pressures. The performances and the pollutants emissions were compared as a function of the fuel compositions and the injection strategies. Due to the low LHV of ammonia compared to ethanol, an increase in fuel consumption is needed to reach the same load. Adding 25% of ammonia into ethanol has a positive effect on thermal and combustion efficiencies. However, NOx and CO emissions are higher for blends than pure fuels (ammonia and ethanol respectively) and are potentially correlated by these reactions: NH + CO2 <=> HNO + CO, HCO + NO<=> HNO + CO, and HNO + NO2 <=> HONO + NO as shown through Chemkin simulations. The major path of NO production is the HONO path and then, the NO2 decomposition or HNO path for blends, and pure NH3 respectively.
The stratified strategy boosts the combustion development by decreasing the characteristic timings but with an increase of the fuel consumption and a decrease of thermal and combustion efficiencies. A drastic increase of CO and HC emissions with a little one for CO2 emissions are observed. Strong decrease of NOx emissions is obtained in comparison to the homogeneous strategy without evident impact on ammonia emissions. Therefore, despite of this last advantage, the homogeneous strategy seems more adapted for these operating conditions. However, the need of a post-treatment for NOx emissions with SCR device as an example and a reduction of NH3 emissions at the exhaust are still required. Last, N2O emissions must be tracked carefully due to its high greenhouse effect.
The use of direct liquid injection for pure ammonia is more restrictive and only early injection to obtain homogeneous conditions is feasible. For stratified conditions, only splitting injection strategy with more than 50% of the fuel is injected in homogeneous mode provided engine stability. It is clearly shown from this present study that ethanol/ammonia blends and also pure ammonia can be accurate fuels for standard direct injection spark-ignition engines with both current thermal and combustion efficiencies and very good engine stabilities.
Supplemental Material
sj-docx-1-jer-10.1177_14680874231170661 – Supplemental material for Performances and pollutant emissions of spark ignition engine using direct injection for blends of ethanol/ammonia and pure ammonia
Supplemental material, sj-docx-1-jer-10.1177_14680874231170661 for Performances and pollutant emissions of spark ignition engine using direct injection for blends of ethanol/ammonia and pure ammonia by Ronan Pelé, Pierre Brequigny, Jérôme Bellettre and Christine Mounaïm-Rousselle in International Journal of Engine Research
Supplemental Material
sj-xlsx-2-jer-10.1177_14680874231170661 – Supplemental material for Performances and pollutant emissions of spark ignition engine using direct injection for blends of ethanol/ammonia and pure ammonia
Supplemental material, sj-xlsx-2-jer-10.1177_14680874231170661 for Performances and pollutant emissions of spark ignition engine using direct injection for blends of ethanol/ammonia and pure ammonia by Ronan Pelé, Pierre Brequigny, Jérôme Bellettre and Christine Mounaïm-Rousselle in International Journal of Engine Research
Footnotes
Declaration of conflicting interests
The author(s) declared no potential conflicts of interest with respect to the research, authorship, and/or publication of this article.
Funding
The author(s) disclosed receipt of the following financial support for the research, authorship, and/or publication of this article: This work was supported by the French Government’s “Investissement d’Avenir” program: “Laboratoire d’Excellence CAPRYSSES” (Grant No ANR-11- LABX-0006-01).
Supplemental material
Supplemental material for this article is available online.
References
Supplementary Material
Please find the following supplemental material available below.
For Open Access articles published under a Creative Commons License, all supplemental material carries the same license as the article it is associated with.
For non-Open Access articles published, all supplemental material carries a non-exclusive license, and permission requests for re-use of supplemental material or any part of supplemental material shall be sent directly to the copyright owner as specified in the copyright notice associated with the article.