
Abstract
Models used to predict the instantaneous injected fuel mass are of varied interest in automotive applications, including for providing inputs to CFD calculations or for engine control. While multiple injection strategies are now commonly used in diesel engines, the overall approach may be susceptible to injection fusion, which is defined as two successive injections that are partly or totally coupled due to the short time interval between each event. In this work, a new model to predict the instantaneous mass flow rate from a diesel injector is proposed based on the analytical solution of a first-order linear dynamic system exposed to an impulsion. Experiments are also conducted to quantify the main injection characteristics of a solenoid indirect-action injector under different injection pressures, backpressures and injection durations, representing a total of 33 different conditions. From these results, a model is proposed and validated against experimental data using a single injection strategy. Then, the model is enhanced to predict split injection with and without injection fusion. Successful comparisons are realized between the model and the experiment. The model is then used to successfully simulate a piezoelectric injector experiencing different levels of fusion available in the literature so as to illustrate the universality of the proposed approach.
Keywords
Introduction
The injection strategy, and more specifically, the instantaneous fuel mass flow rate and the total mass injected, are among the most important parameters in research pertaining to engine performance and emission. To extract these values, the literature presents various approaches that differ in complexity. The most complex among these involve three-dimensional computational fluid dynamics, and are used by the likes of Chouak et al., 1 who modeled needle displacement using CFD. The 1D model, based on detailed information on the injector geometry and components, represents another approach, where the dynamic response and interaction of the phenomena taking place within the injector are considered using dedicated software2,3 or by solving a set of Equations.4,5 Simpler approaches emphasize the end results based on proper equations and correlations. In the latter category, the goal is generally to obtain the rate of injection (ROI), which becomes a useful input to a fuel spray CFD model or to thermodynamic engine performance prediction models. Moreover, depending on its complexity, an instantaneous mass flow rate model could be integrated into the electronic control unit of the engine to predict injected fuel mass as part of the control strategy. In some formulations, the model uses the common rail fuel pressure as an input or can be adapted to model direct gasoline injection with little modifications, as in the model proposed by Payri et al. 6 As the main purpose of this work is to propose a new 0D model of the ROI capable of predicting split injection, recent works pertaining to predictive ROI models are presented in what follows.
A 1D numerical model that considers the solenoid winding of the solenoid as well as the different fuel passages and chambers within the injector was proposed by Ferrari et al. 7 The model has been used to study rate-shaping injection strategies and their effect on the injected mass. Kim et al. 2 also used a similar model to study the effect of fuel viscosity and density under low temperature condition on the rate of injection. They reported that increases in fuel viscosity delayed the start of injection and resulted in lower ROI and injection durations. A similar approach was used to isolate the impact of biodiesel properties on the ROI of a multiple injection strategy, demonstrating that increasing the bulk modulus may decrease the mass injected of the post injection. 3
Perini et al. 8 proposed an ROI model based on an iterative solution procedure to obtain a specific total injected mass. Armed with minimal knowledge of the injector configuration, the model generates the necessary input to feed a fuel spray CFD calculation. They divided the injection process into four phases: (1) needle transient lift, (2) full needle lift with hydraulic transient flow and (3) full needle lift with near steady-state flow and maximum fuel flow velocity. Finally, there was (4) the needle closing phase. Each phase had its own velocity equation and the model was validated against experimental results for single injections of different durations and different injection pressures while double injection strategies having long time intervals between injection (DT) were also successfully modeled.
Another approach to modeling ROI is presented in Payri et al. 6 to estimate the injected fuel mass of single and multiple injection strategies using rail pressure signals. The purpose of the model is to carry out a real-time estimation of the total fuel injected during engine testing. The model is based on the segmentation of the shapes of the main and pilot injection profiles into a simpler form in a bid to find representative mathematical expressions. For example, second-order Bezier functions are used to curve the corner of the trapezoid representing the main injection event. Overall, the model is able to predict within 8% the total mass injected for a pilot injection strategy, illustrating the ability of this approach to represent the ROI.
Soriano et al. 9 pursued a similar approach by assimilating the ROI profile into a triangle. Their approach consists in determining the ROI using a similar slope with a positive value on the ascent side of the ROI and a negative value on the descent side. Moreover, the slope is a function of the difference between the injection pressure (Pinj) and the backpressure (Pback). Double injection was modeled with enough DT allowing separation between each injection and thus preventing injection fusion.
Because multiple injection strategies are often used in diesel engines, it may therefore be possible to have partial or total merging between two successive injections in some of the approaches. This is because the time interval between the electrical command of the two distinct injection events is too short and is responsible for hydraulic instability, and thus leads to excessive fuel mass being injected. 10 Injection fusion may also result from changes in the injector’s behavior over its lifespan. In this context, for example, Payri et al. 11 conducted an experimental study on the aging process of an injector using multiple injection strategies. They observed that the ROI was lower and the injection duration longer after aging, resulting in an altered injected mass that could lead to injection fusion over short dwell times. Complex injector modeling efforts have shown that there is a time interval limit between injections that leads to fusion, which depends on the first injection needle closure delay and the needle opening delay of the next injection. 10 During engine injection calibration, injection fusion strategies can be used to offer flexibility in the rate of injection implementation. 12 In the presence of fusion, an injection strategy can be beneficial for the soot-NOx tradeoff at medium engine speeds and loads 12 or for NOx-brake-specific fuel consumption (BSFC) tradeoffs. 13 Recent experiments by d’Ambrosio et al. with a diesel engine have shown that at medium loads, a very short DT decreases combustion noise and offers lower BSFC than other advanced injection strategies, such as boot injection. 14
Considering the importance of pollutant emission and that fusion injection may be beneficial to diesel engine fuel consumption, the objective of this work is to propose a simple model that allows predicting the ROI for single and double injection with and without the presence of fusion. Proposing a simple ROI model is of interest because it can be easily implemented to predict CFD calculation inputs8,15 or to predict, at the ECU, the injected fuel mass using the injection pressure. 16
The paper first presents the experimental setup and injection conditions. Then, experimental results are analyzed, followed by the model description. A comparison between the model and experimental results is presented, and then a comparison between the model and experimental data available in the literature is made to illustrate the versatility of the proposed model. Finally, the main findings are highlighted.
Experimental setup
An in-house Bosch tube method apparatus was used to characterize the instantaneous mass flow rate of the injector, similar to Kim et al.
2
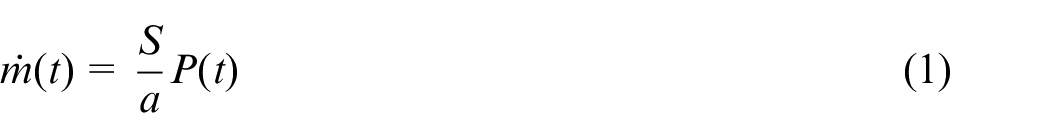
The method involves injecting fuel at one end of a long tube filled with pressurized fuel. The theoretical foundation of this method is based on the conservation of mass and momentum across a pressure wave of amplitude
Near the injector location, a piezoresistive pressure sensor (Kistler 6061) and a charge amplifier (Kistler 5010a) record the pressure wave appearance due to the injection. At the other tube extremity, a valve allows controlling the reflected pressure wave intensity that will be detected by the amplified pressure sensor. The temperature and static pressure of the diesel fuel are also measured. The instantaneous injection mass flow rate can be calculated if the tube area and the speed of sound of the fuel are known. The latter is extracted from the time interval between the emitted and the reflected pressure wave detected by the pressure sensor and the tube length.
The experiments were conducted using a common rail injection system with a solenoid indirect action Delphi injector. The injector possesses 5–140 μm diameter orifices, and can be operated with a maximum injection pressure of 160 MPa. The common rail was fed with pressurized diesel fuel using an air driven liquid pump (Haskel DSHF-300), while the fuel pressure and temperature were measured using a piezoresistive high-pressure sensor (Kistler 4067) located in the injector feeding pipe. The injector command was generated using an injector module (NI-9751) connected to a CompactRio chassis (CRIO-9074). The chassis also includes a 16-bit acquisition card (NI-9222) that enabled acquiring the signals of the different sensors at a 250 kHz sample rate.
Data post-treatment was performed using Matlab, in which the inherent noise of this experimental approach 19 is filtered. The filtering of the raw pressure signal is followed by a second means- centered window filter over five values. Other approaches have been tested, including using a Butterworth second-order filter, but they offer no marked difference in terms of the injected fuel mass, while being computationally expensive. Overall, the method used herein is similar to that of Bowers and Foster, 20 who used a means-centered window filter using nine values. An uncertainty analysis of the instantaneous mass flow rate was conducted on the experimental setup following the methodology presented in ISO 21 , Abernethy et al., 22 and Le 23 This statistical method is applied to equation (1) and is based on the cumulative impact of the instrument chain reported uncertainties. An uncertainty equal to 2.8% was found for an instantaneous mass flow rate of 12 g/s when considering a 95% confidence interval. The time average of the shot-to-shot standard deviation is within 2% of the steady state mass flow rate, and its instantaneous value is maximum at the start of the second injection.
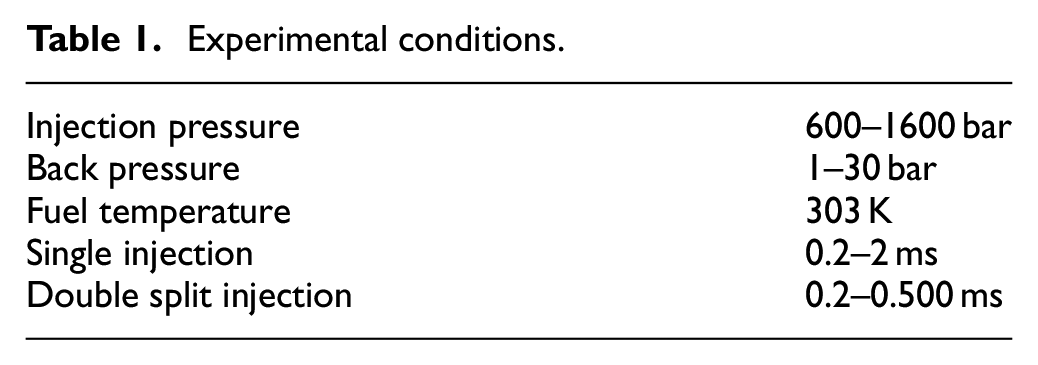
Different injection pressures and backpressures were used in combination with single short- and long duration injections, as well as split double injection strategies, characterized by two equal energization time (ET) injections. Both the injection duration and the pressures involved during the experiments are presented in Table 1. Overall, 33 experimental conditions were explored and were repeated 10 times, and the average values are presented in the table.
Experimental conditions.
Results
Experimental results
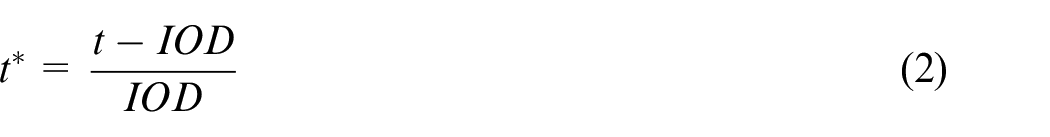
To facilitate the analysis of the results, an adimensional time (
Single injection
Effect of injection pressure
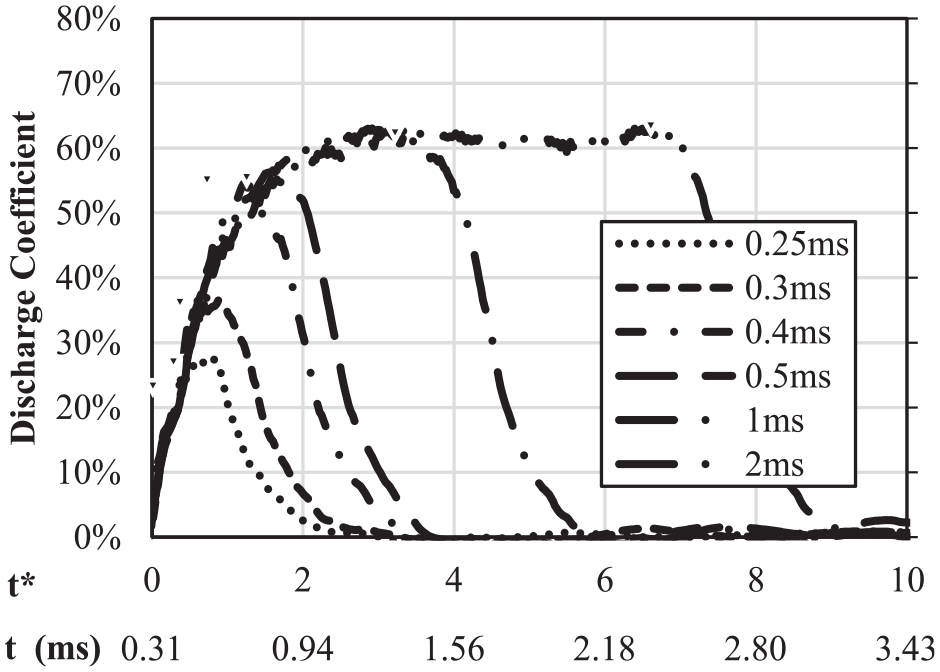
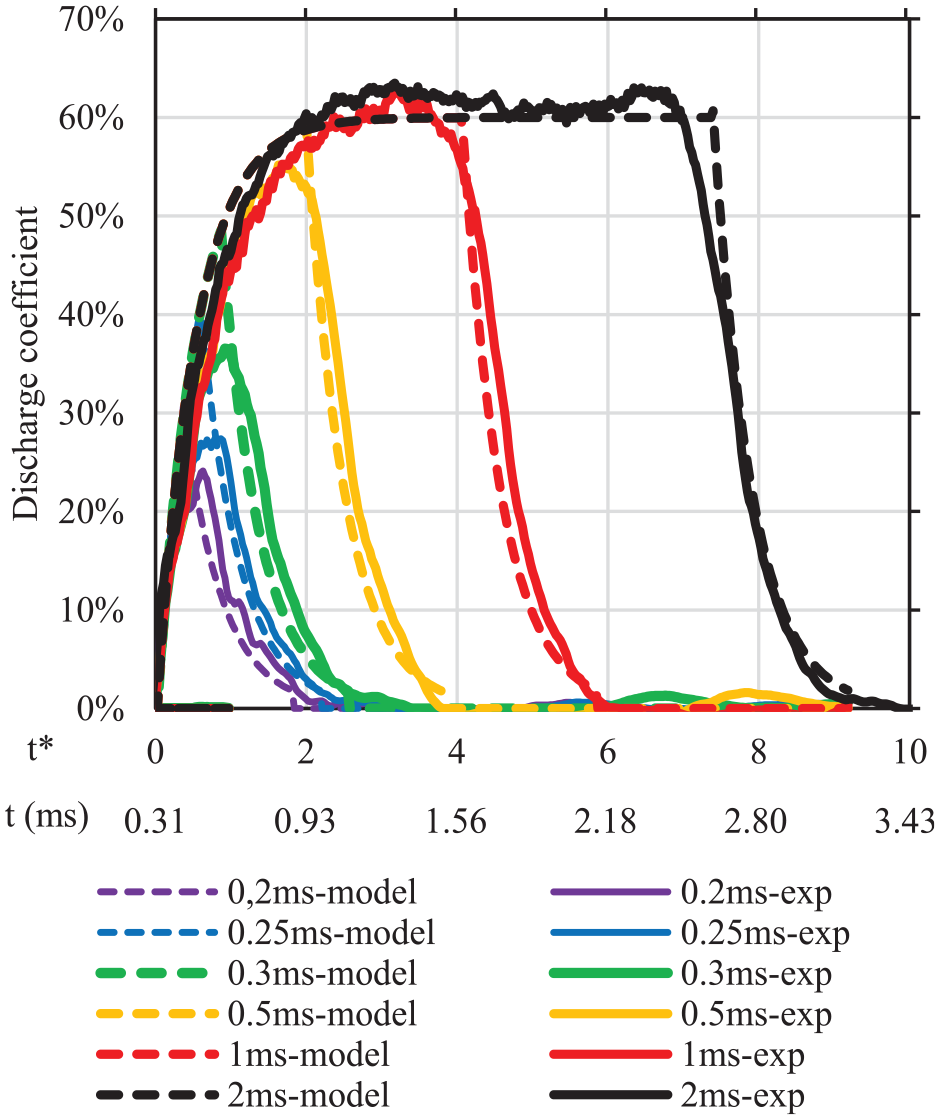
Figure 1 presents the effect of Pinj on the discharge coefficient (Cd) of the injector, for different injector energizing times (ET1) of single injections. It is observed that Cd is similar to the value reported by Arcoumanis et al.
24
and shows that the injection pressure does not significantly impact Cd during a transient mass flow rate increase. Moreover, the opening (not shown) and closing delays are of the same order of magnitude as the ones reported by Catania et al.
10
. However, the use of equation (2) for the adimensional time leads to the effective injection duration to increase as the Pinj increases while the injector opening and closing delays decrease and increase, respectively. This observation is in concordance with the modeling results of Ferrari et al.
12
Moreover, the experimental results show that the injector closing delay increases as the injection duration increases – until a long injection duration (above 2 ms) is reached. This behavior is linked to the fact that when the injection duration is long enough for the needle lift to reach its maximum value, the closing delay has reached its final value.
12
Finally, the experimental results indicate that Pinj hardly impacts the Cd modulus during injector closing using the same adimensional time scale
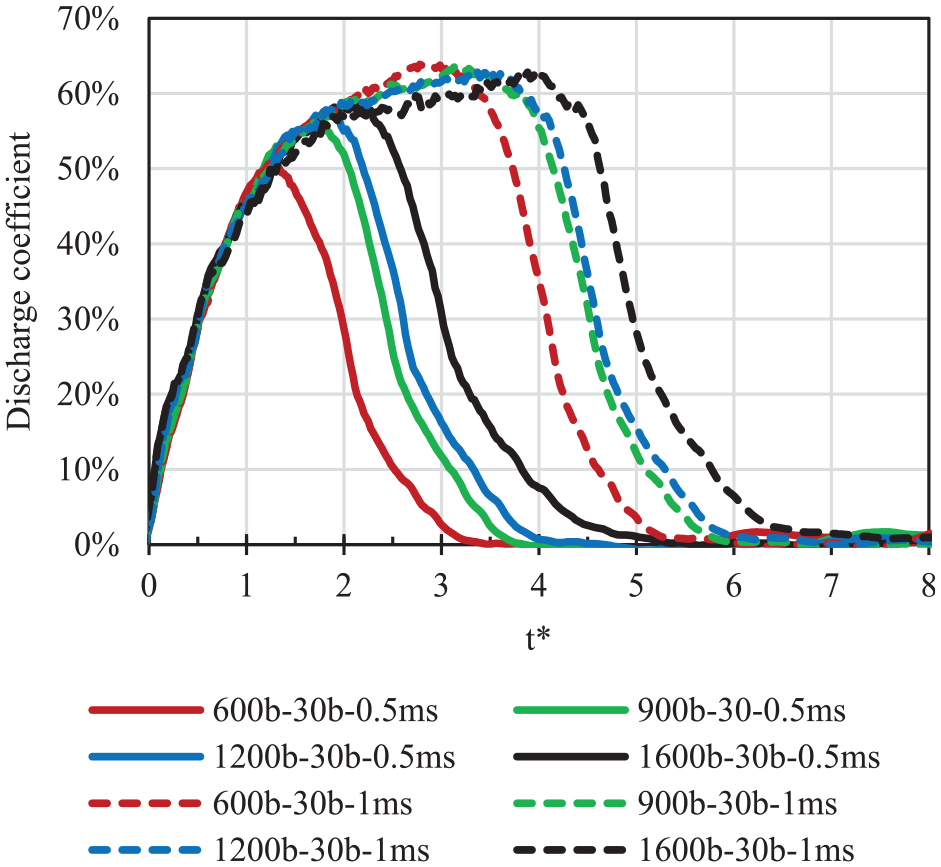
Experimental discharge coefficients of single injection for different Pinj and ET1 and a Pback of 30 bar as a function of adimensional time. Legend for each experimental condition is Pinj–Pback-ET1.
Effect of injection duration
Figure 2 presents Cd of different ET, with the small triangle identifying the start of the flow rate reduction phase, which approximately corresponds to the junction point between the experimental curves and the end of the electrical injection command. It is observed that for ET shorter than 1 ms, the steady-state regime is not attained and that the injection process is achieved under transient needle displacements. Figure 2 also illustrates that the initial increase of Cd with time is independent of the ET duration as all curves are superimposed.
Discharge coefficients of single injections for different ET1. Test conditions: Pinj of 900 bar and Pback of 15 bar.
Double injection
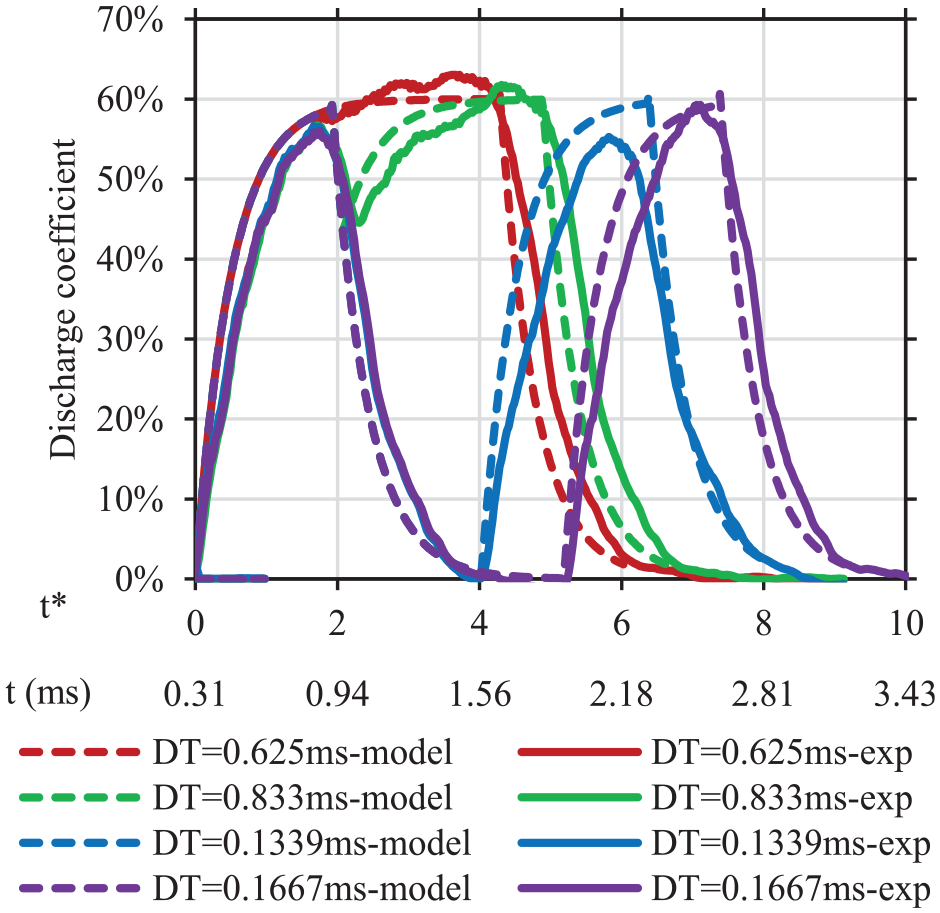
We now look into double injection in a bid to characterize the impact of the time interval between the beginning of two successive injections (DT), which is defined that way to be consistent with the model to be presented in a later section. Figure 3 presents the experimental results obtained with a split injection of 0.2 ms, with DT varying from 0.2 to 2.5 ms. Contrary to Ferrari and Mittica, 12 who defined a fusion of injection when there is an interaction between two successive injections, three coupling modes are defined herein, which will be helpful in the definition of the model in the next section. The first mode represents a fusion between two successive injections, as can be observed for DT shorter than 0.3 ms. The fusion means that both ETs generate a Cd profile having a single maximum value, similarly to the case with a DT of 0.2 ms. The second coupling mode is a partial fusion, and is defined by a Cd having two maximums without a zero-mass flow rate between them, such that the end of the first injection cannot be distinguished from the beginning of the second injection, as in the case of a DT of 0.417 ms in Figure 3. Finally, a third mode is identified in Figure 3, and is defined for cases where Cd returns to zero between both injections, but for which the second injection reaches a higher Cd than the first, such as in the case of DTs of 1.25 and 1.339 ms. Tests were also performed with a split injection having an ET of 0.5 ms, as illustrated in Figure 4. It can be seen that the first two fusion modes identified above are observable and that a DT of 1.339 ms is necessary to differentiate between the presence and the absence of fusion. Moreover, due to the longer duration of each injection, the Cd, in the presence of fusion (see DT of 0.625 ms), reaches the nominal value associated with a single long injection duration.
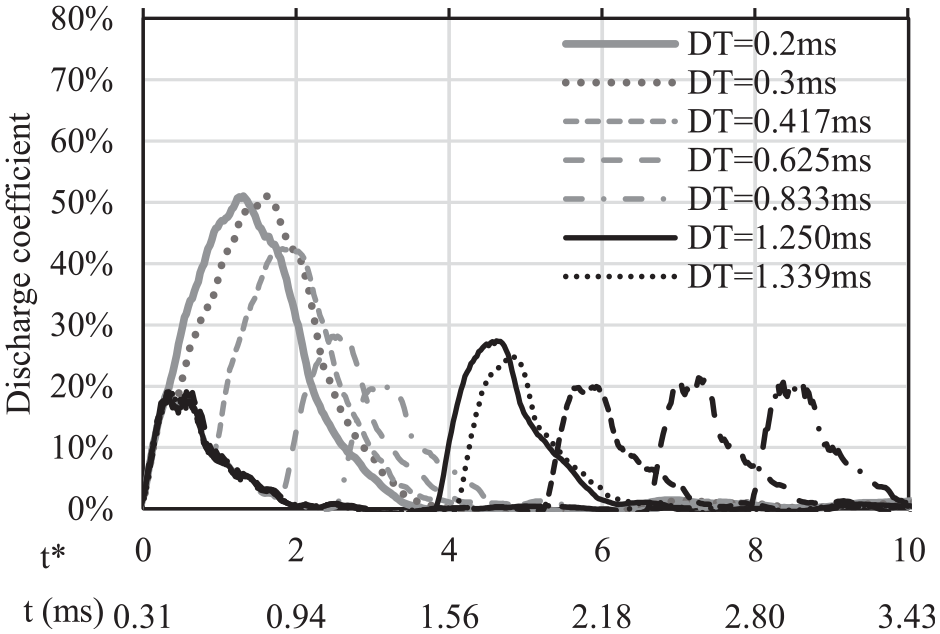
Discharge coefficients of double split injection (ET of 0.2 ms) for different DT. Test conditions: Pinj of 900 bar and Pback of 30 bar.
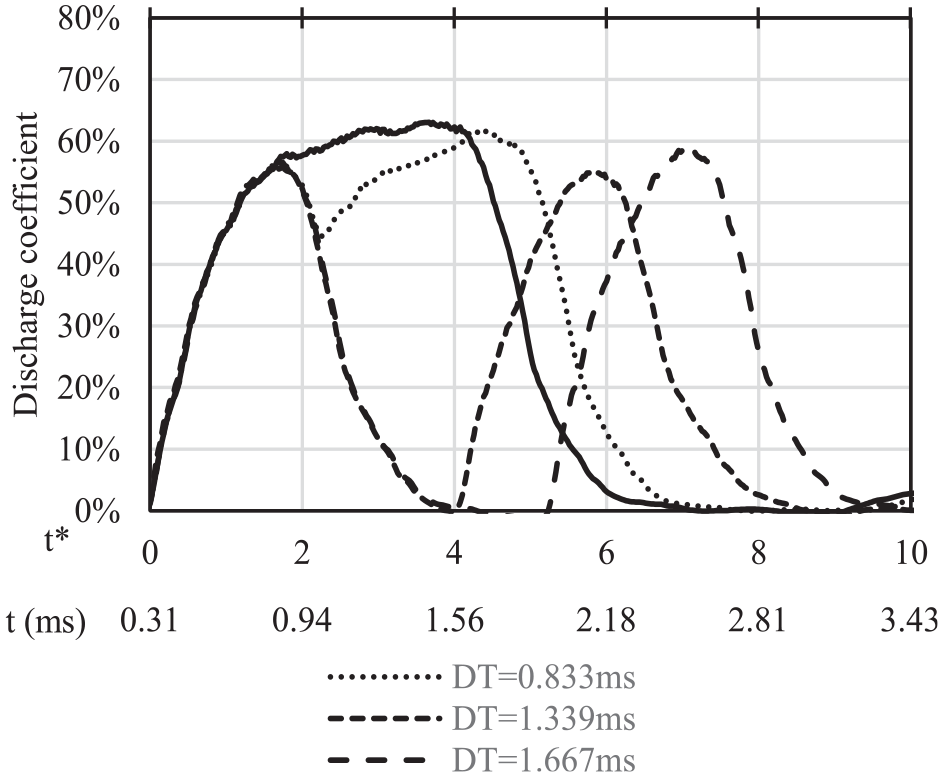
Discharge coefficients of double split injections (ET of 0.5 ms) for different DT. Test conditions: Pinj of 900 bar and Pback of 30 bar.
To illustrate the impact of the fusion, the relative injected mass is calculated as the ratio of the mass injected during the split injection to the one from a single injection. Hence, a split injection comprised of two 0.2 ms injections should have a relative mass of 200% of a single injection of 0.2 ms in the absence of fusion or interaction between both injections. Results are presented in Figure 5 as a function of DT/ET1. First, it is observed that the shortest injection (0.2 ms) studied herein is much more sensitive with respect to the relative injected mass since the needle’s transient displacement plays a major role during the injection process as the nominal mass flow rate is not reached, contrary to a split injection, which consists of two successive 0.5 ms injections. Second, the first injection is statistically equivalent to a single injection of the same duration if DT/ET1 is equal to or >2 due to the difficulty of determining the injected mass associated with the first and second injections under DT/ET1 <2. Third, the fusion between injections is maximum at around a DT/ET1 of 1.5 and can generate an increased relative mass of more than five times the equivalent of a single injection. An increase in injected mass has also been reported experimentally by Ferrari and Mittica 12 and Herfatmanesh. 26
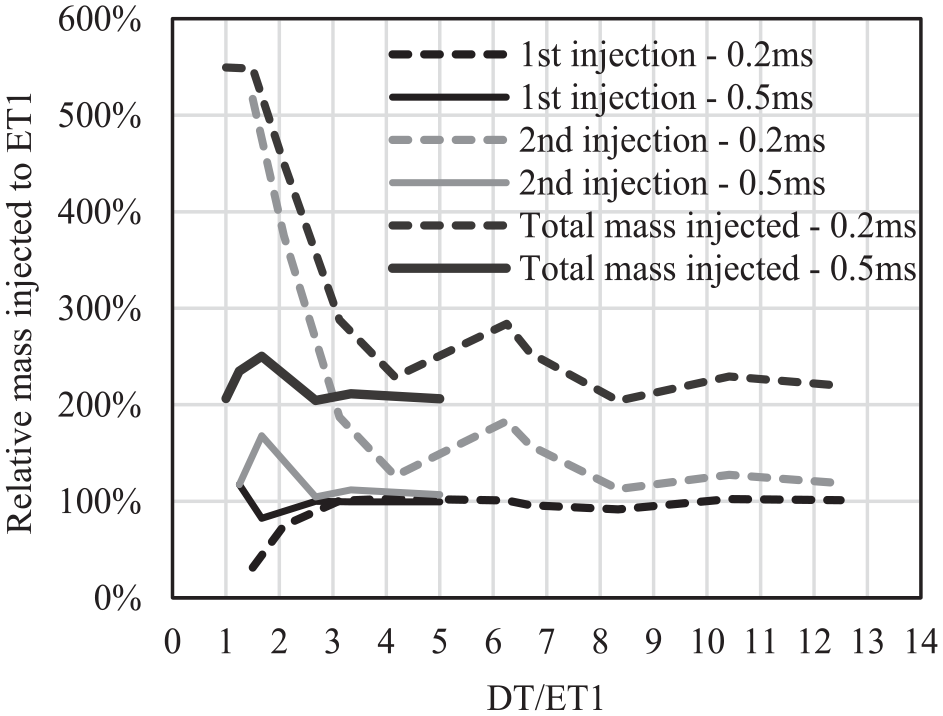
Relative total mass injected for double split injection with respect to a single injection having the same ET. Test conditions: Pinj of 900 bar and Pback of 30 bar.
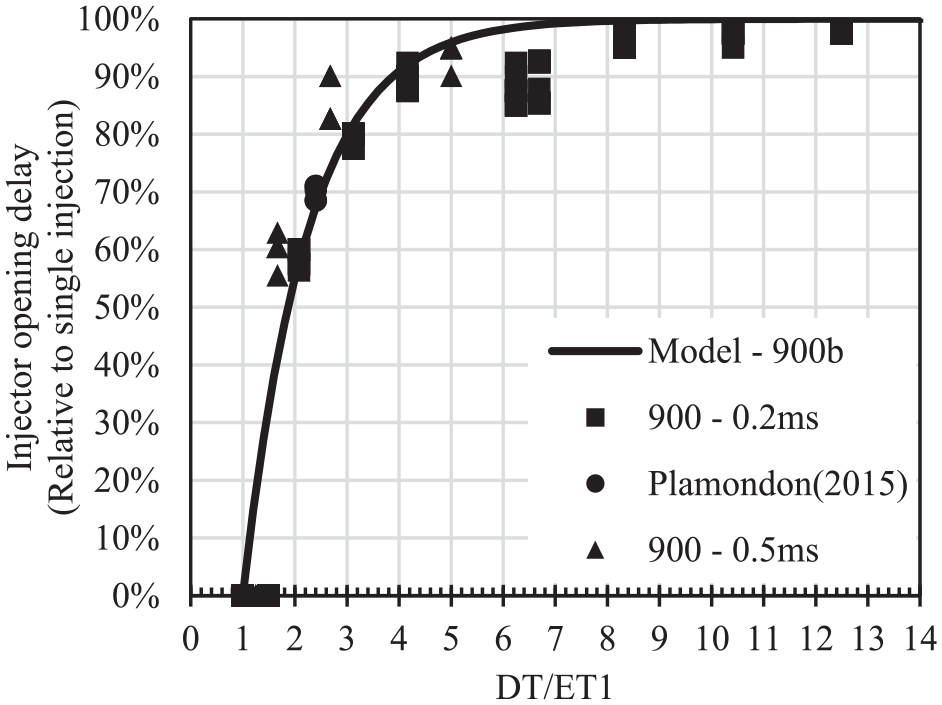
From the experimental results, it can be seen that the injector opening delay of the second injection is highly sensitive for DT/ET1 <2, which is obtained in cases where a partial or complete fusion of both injections has been observed. For DT/ET1 >4, it can be considered that the opening delay is equivalent to the delay associated with a single injection. The shorter opening delay observed in Figure 6 at a DT/ET1 of 6.25 corresponds to the third coupling mode (higher Cd of second injection even if the injector closes between both injections) observed in Figure 3. Finally, the closing delay of the second injection is reported for the split injection tested in Figure 7 and shows a dependence on DT/ET1, the injection duration (ET2) and Pinj, contrary to a single injection, for which the closing delay is only a function of Pinj and ET. Thus, due to its greater sensitivity to both parameters, the closing delay shows more variations for DT/ET1 below 3, while it tends to the value of a single injection at higher DT/ET1, with the exception of when DT/ET1 is equal to 6.25 and 6.75, in which case the closing delay increases (Figure 7). Figure 6 already showed a decrease of the opening delay. This behavior explains the increase of total mass injected in Figure 5 and where it is observed an extreme case (split injection with ET1 = ET2 = 0.2 ms) of a relative mass of 550% with respect to a single injection which is also equivalent to 2.5 times the expected mass of a split injection in the absence of fusion.
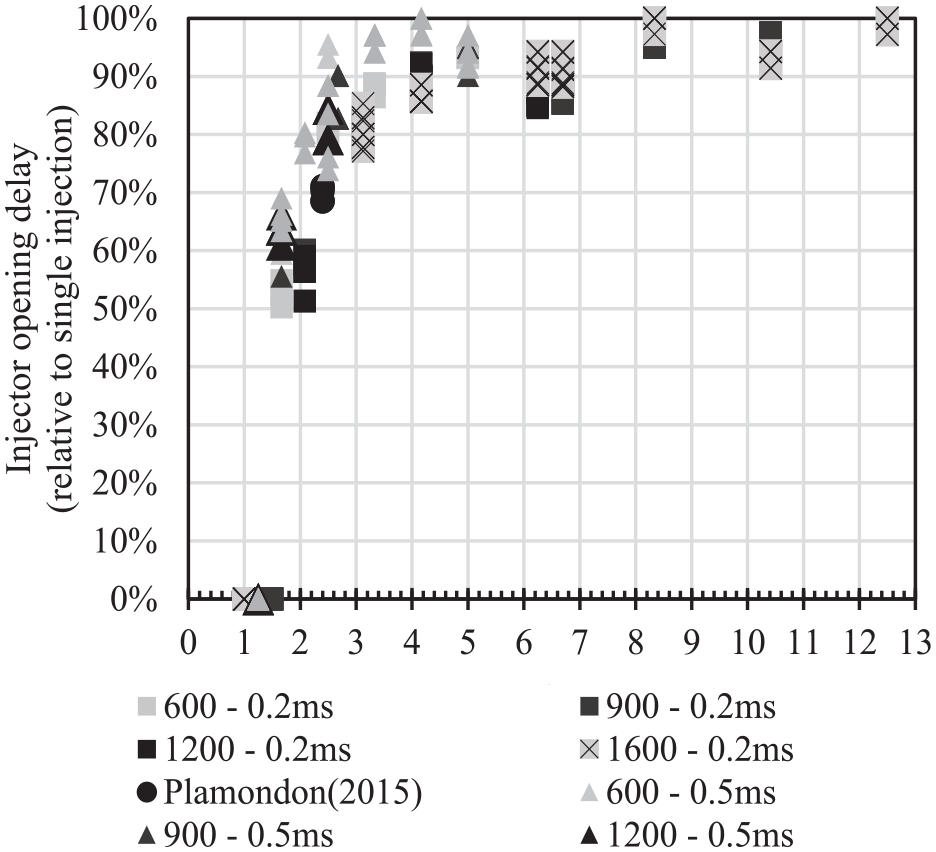
Influence of DT/ET1 on the injector opening delay of the second injection.
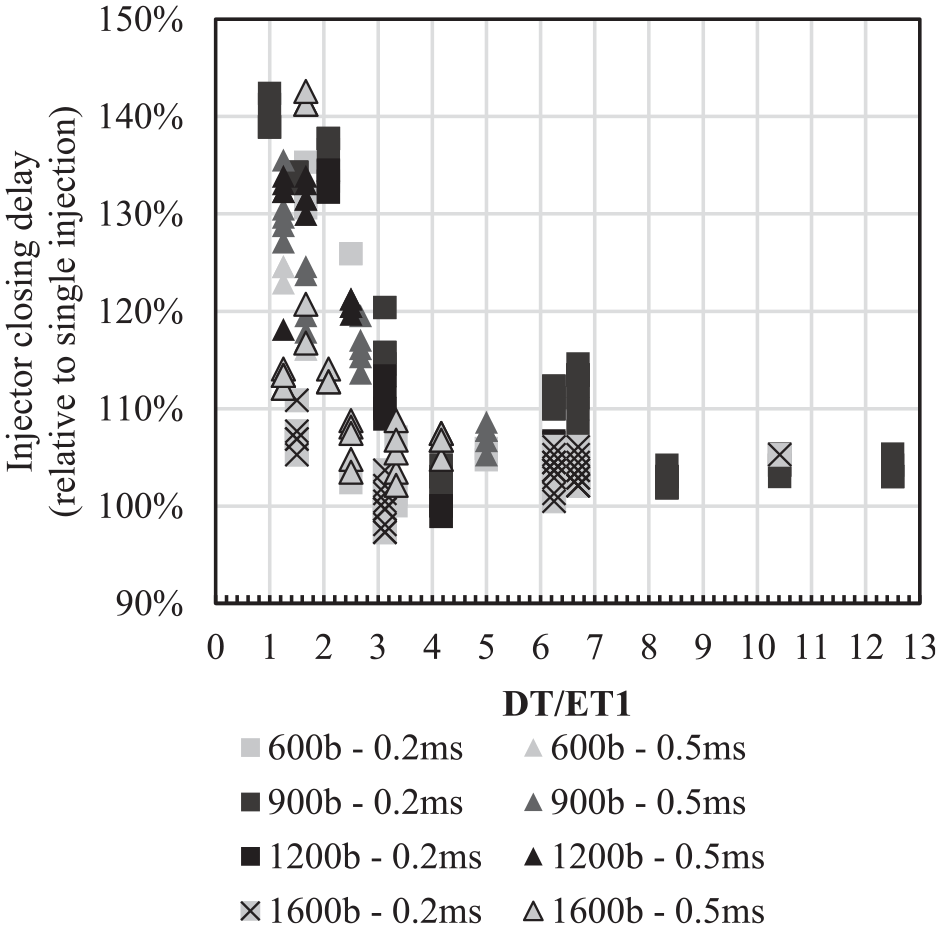
Influence of DT/ET1 on the injector closing delay of the second injection.
Empirical model
Based on the above experimental observation, an empirical model is proposed, and is based on the analytical solution of the response of a first-order linear dynamic system to an impulsion.
27
Thus, the model uses an exponential function to predict the experimental discharge coefficient
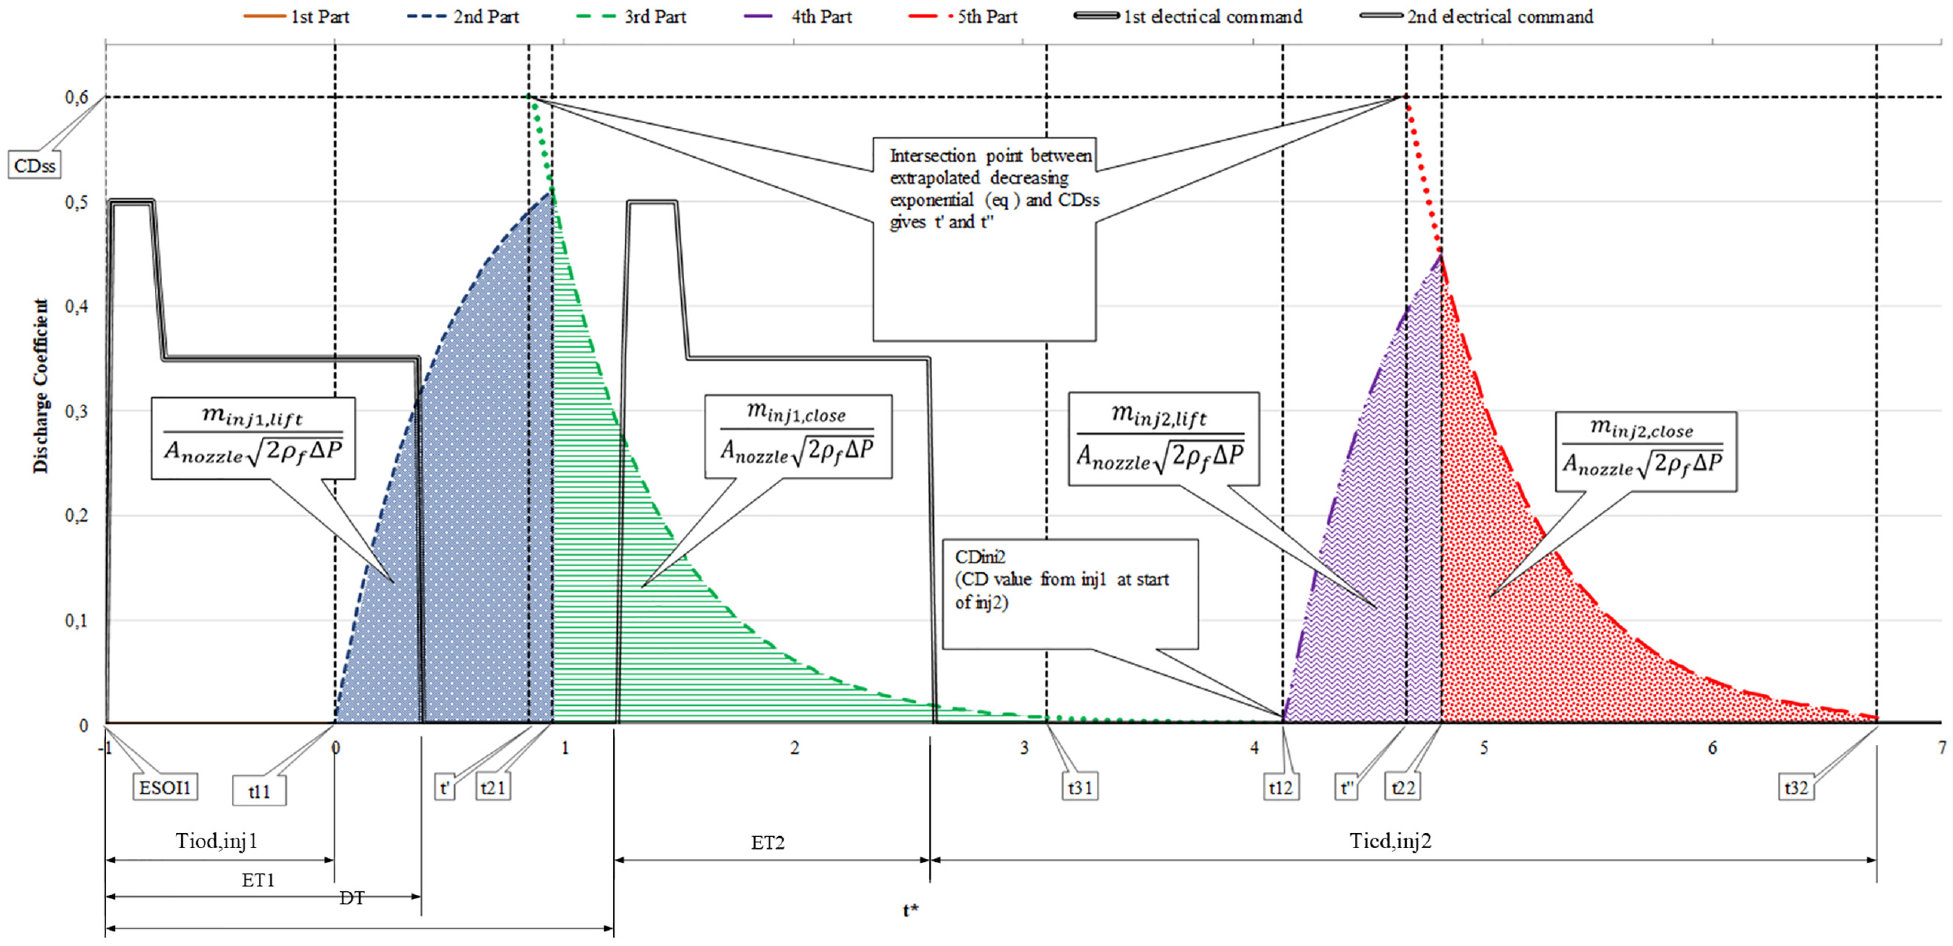
Piece-wise model graphical nomenclature of the mass flow rate/discharge coefficient
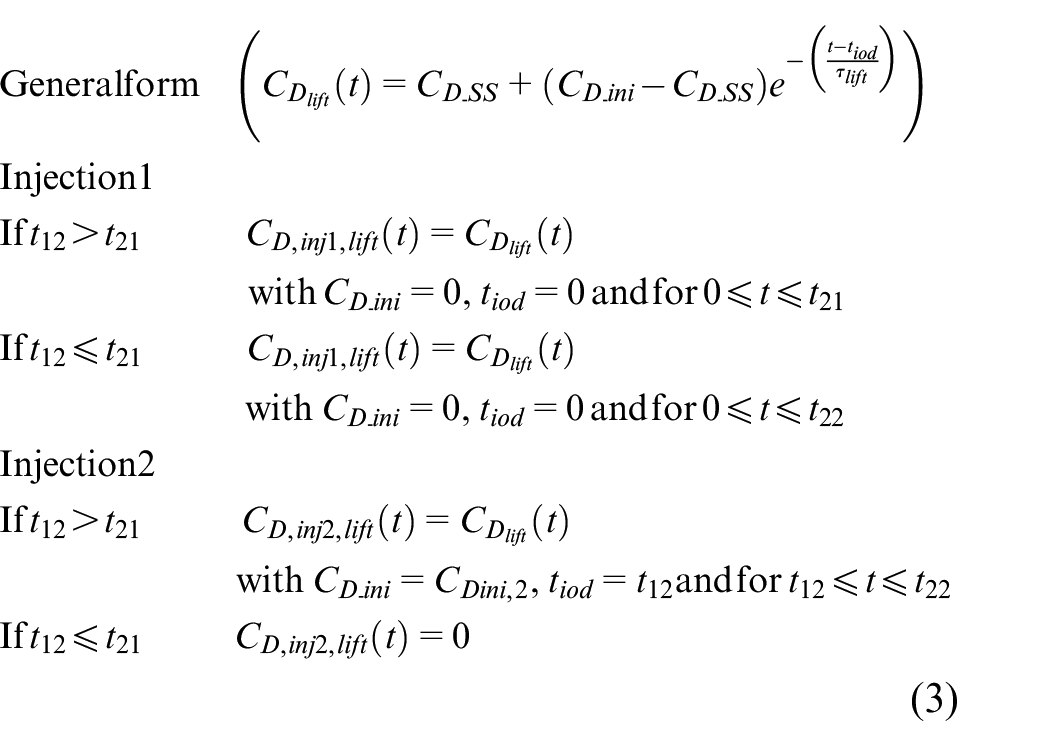
The proposed empirical equations are developed using the experimental results of single injections (see Table 1 for experimental conditions) to statistically calibrate the ramp-up period. Following the opening delay, the second phase is represented by equation (3) and ensures a constant mass flow rate increase as a function of adimensional time (t*) until the steady-state value (

Using the same approach, the discharge coefficient for the last phase of the injection process is based on the single injection after the end of the electrical command. A decreasing exponential function is used as expressed by equation (5), where
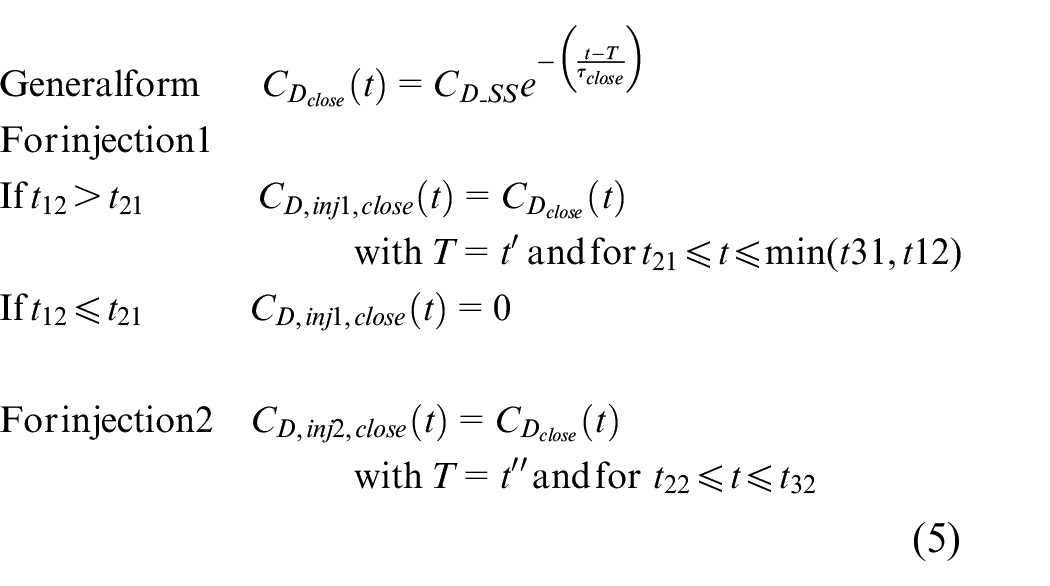
In equations (3) and (5), two characteristic times for the opening delay (
In the absence of fusion, IOD is constant and equal to
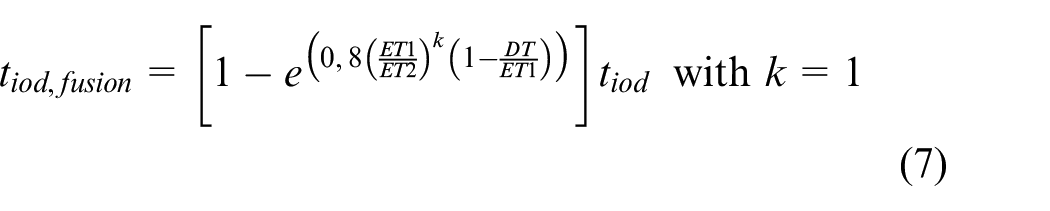
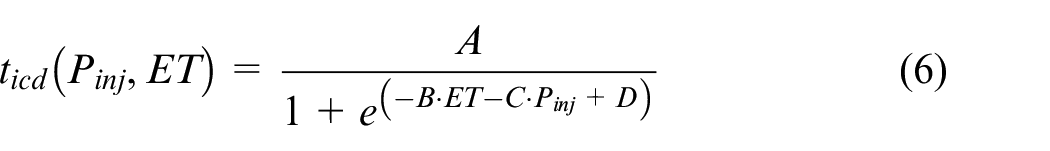
The characteristic times for the needle opening (

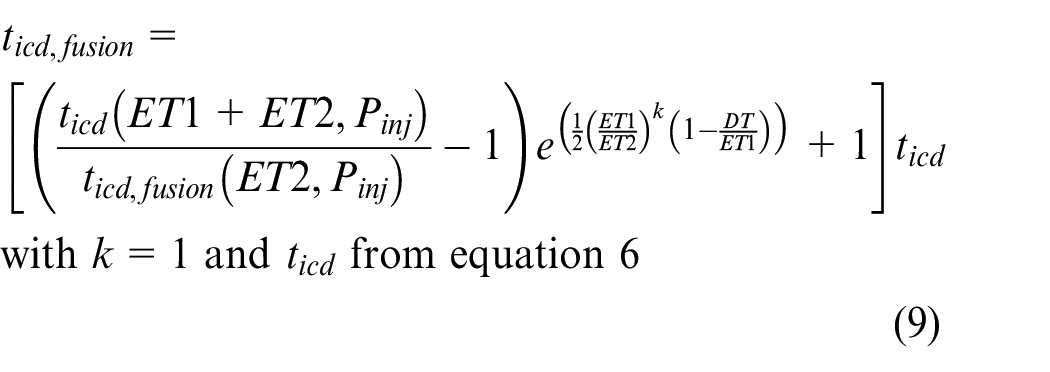
Finally, the coupling effect on the closing process between the first and second injections is represented by equation (9), where it can be seen that ICD during fusion is a function of ET1, ET2, and DT. In equation (9), the term
The above equations (2–9) can be used by themselves to obtain
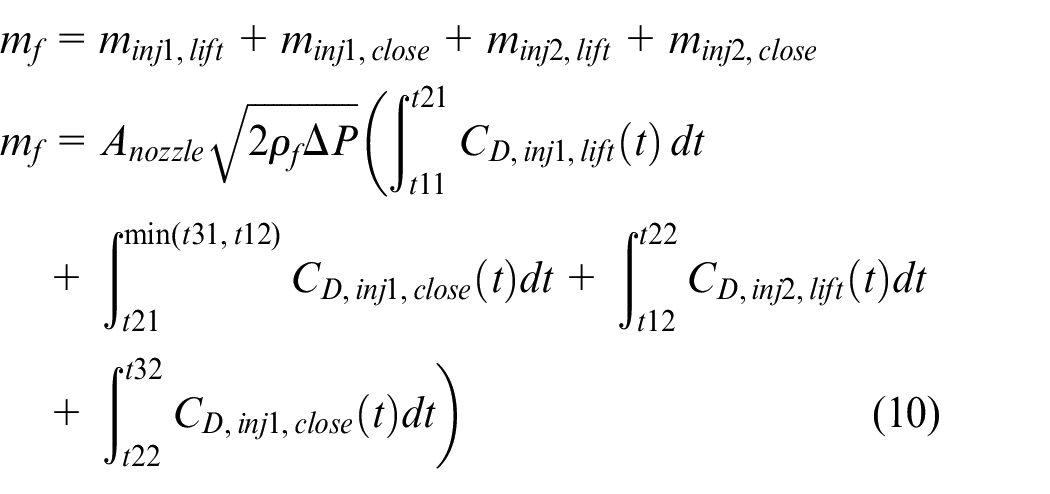
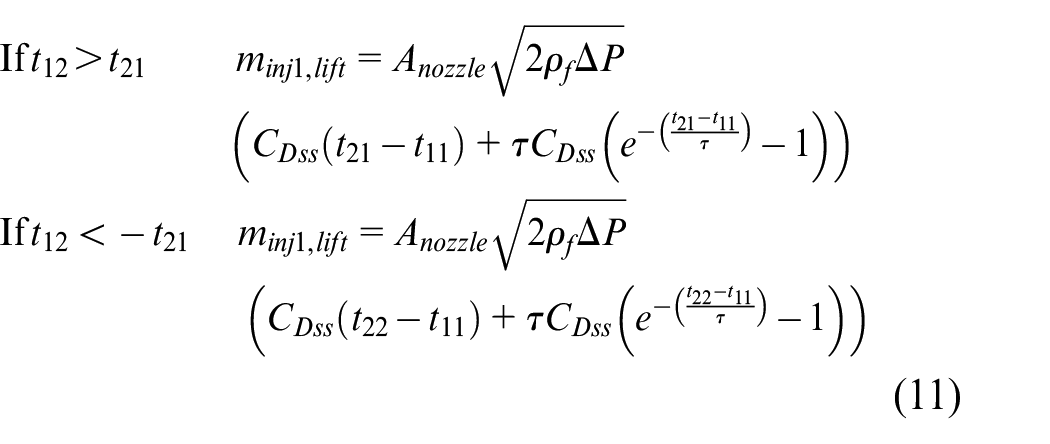
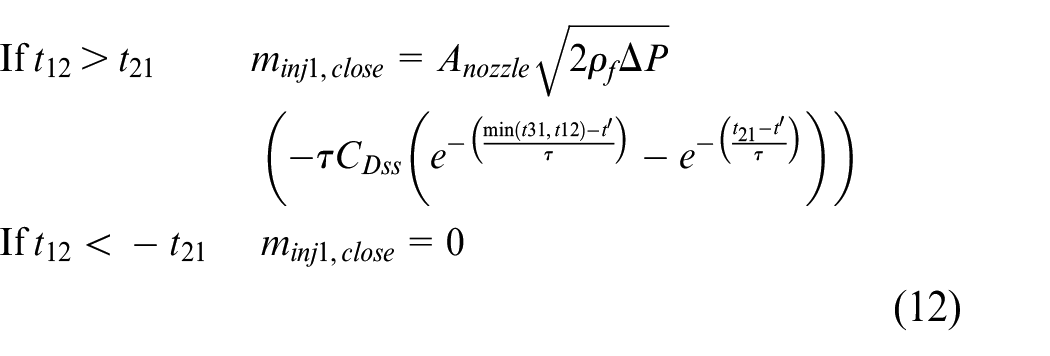
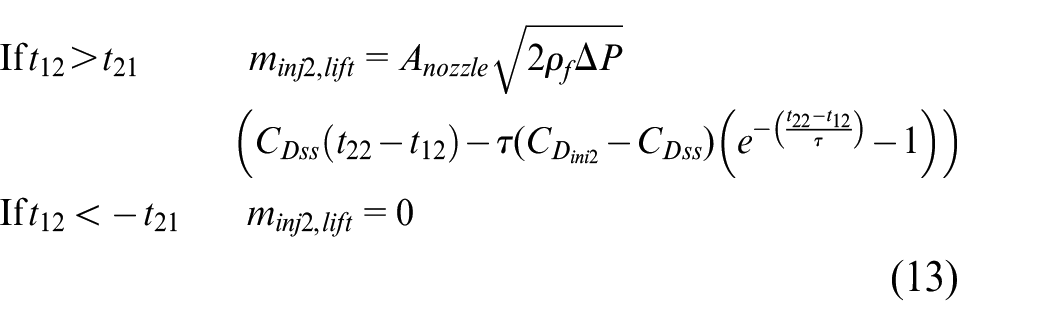
The total mass injected in equation (10) is thus the sum of the fuel of each phase identified in Figure 8. equations (11) and (12), allow calculating the mass injected during the needle lift and closing phases, respectively, of the first injection, while equations (13) and (14) permit the same calculations for the second injection.
The different time constants associated to the first injection are computed as follows using parameters that have been defined previously.


The initial discharge coefficient of the second hydraulic injection (
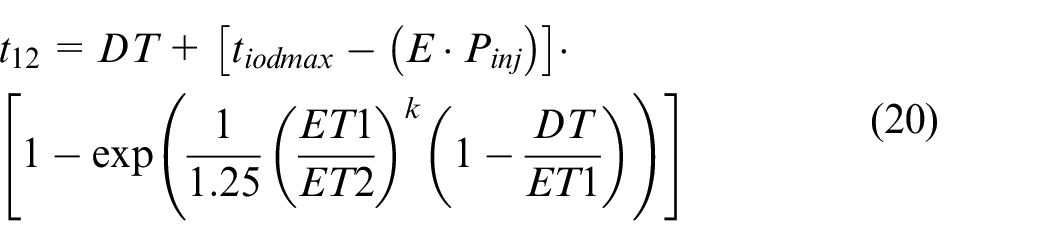
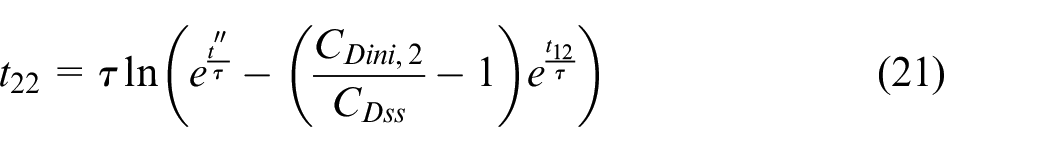
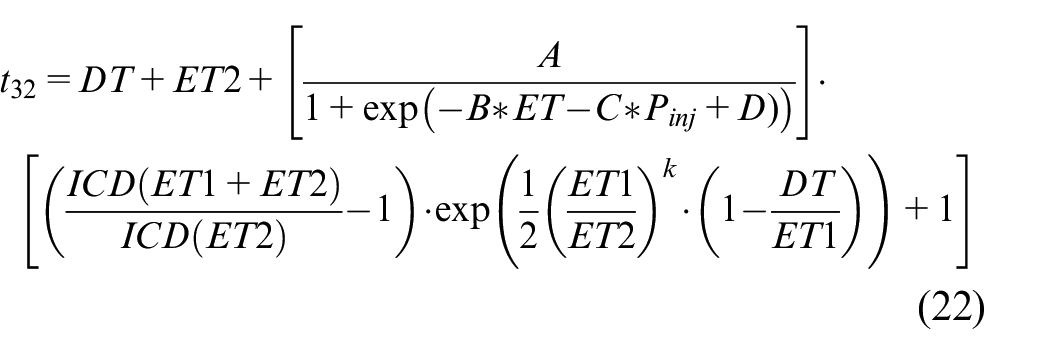
The, the time constants linked to the second injection can be found using equations (20)–(24).

Finally,
Injector opening delay of the second injection in the presence of coupling (fusion) with the first injection. Experimental results (symbols) and equation (6) (line).
Comparison model and experimental results
The above model was programmed in Matlab and its results are first compared to the experimental results obtained herein. Figure 10 presents a comparison between the experimental results and the model for different single injections using a Pinj of 900 bar. These single injections are used to calibrate all the model constants, and show a good performance by the model. A maximum overprediction of 12% is obtained by the model on the total mass injected for the shortest injection of 0.2 ms. The accuracy reported herein is similar to the one shown by Kim et al. 2 with injection durations of 0.45 ms and 1 ms using a complex modeling approach (commercial software).
Comparison of single injections between experimental results and the proposed model for different ETs. Test conditions: Pinj of 900 bar and Pback of 15 bar.
The calibrated model is now used to predict different split injections having an ET of 0.5 ms tested herein, and the results are shown in Figure 11 for a Pinj of 900 bar and different DT. The results show the model’s ability to predict the presence or absence of fusion between injections, while the maximum overprediction on the total mass injected is 3% for cases with a DT of 0.625 ms. This is comparable to the value reported in Payri et al., 6 where a maximum deviation of the total mass injected is lower than 8% for pilot injections. Thus, it can be said that the model allows representing the behavior of the injector for both single and split injection strategies. Moreover, the predicted injected mass shows a good agreement with the experimental results. This can be seen in Figure 12, which compares the predicted total mass injected to the experimental one (R2 = 0.99).
Comparison of split injections (ET = 0.5) between experimental results and the proposed model for different DTs. Test conditions: Pinj 900 bar and Pback of 15 bar.
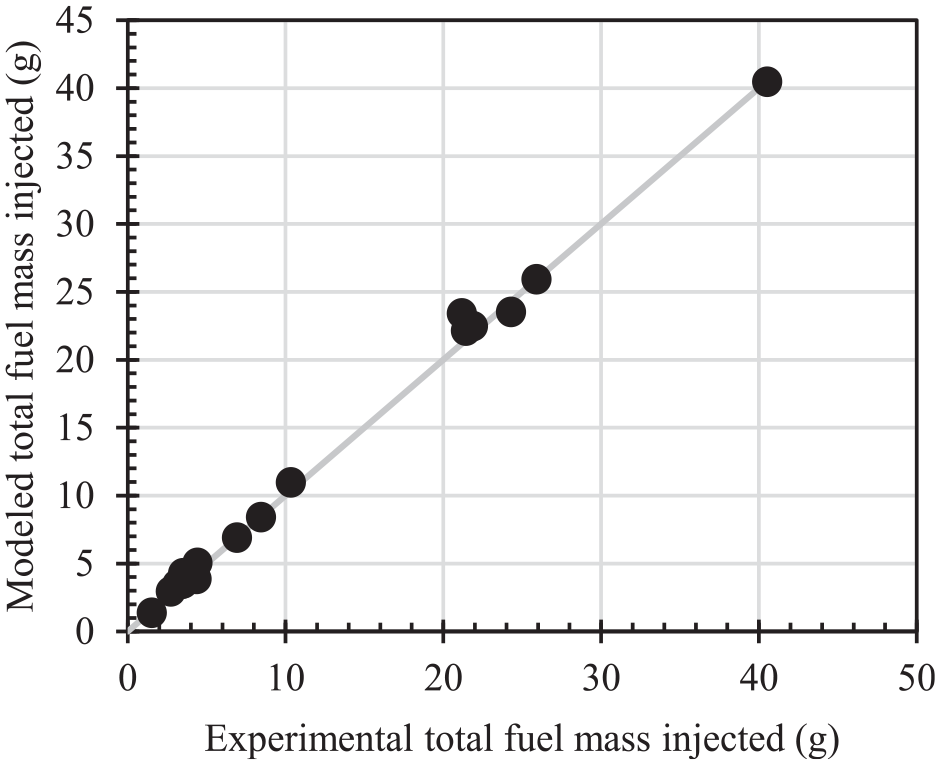
Total mass injected of single or double injection: prediction versus experiment results.
Finally, to show the versatility of the model, two different injection strategies using a piezoelectric injector are now modeled based on experimental results available in the literature. The Pre-Main and Main-Post injection strategies from Ferrari and Zhang 7 using a piezoelectric injector offered enough data to pursue this additional validation of the proposed approach. Their experiments presented mass flow rate measurements using a piezoelectric injector for a fused pilot-main injection and an unfused main-post strategy. While few data were available to determine the different time constants, the proposed model is able to predict the general flow rate behavior, as can be observed in Figure 13 for four (4) different injection strategies. The values of the constants A, B, C, D, and E used in the model are also provided (see figure title) to show the similarity with the values used above, while it is noted that the injector technology is different. The model shows satisfactory prediction results under the pilot-main injection strategies. However, it overpredicts the injected mass under main-post injection strategies, as illustrated in Figure 13 (bottom-right). This mass overprediction can be attributable to a different fusion behavior under main-post strategies, as reported in Ferrari and Zhang. 7 The proposed model accounts for this behavior by using a (ET1/ET2)k factor in equations (6), (8), (11), and (15), but additional data would have been necessary to properly calibrate the model. Overall, satisfactory results were obtained, considering the simplicity of the model.
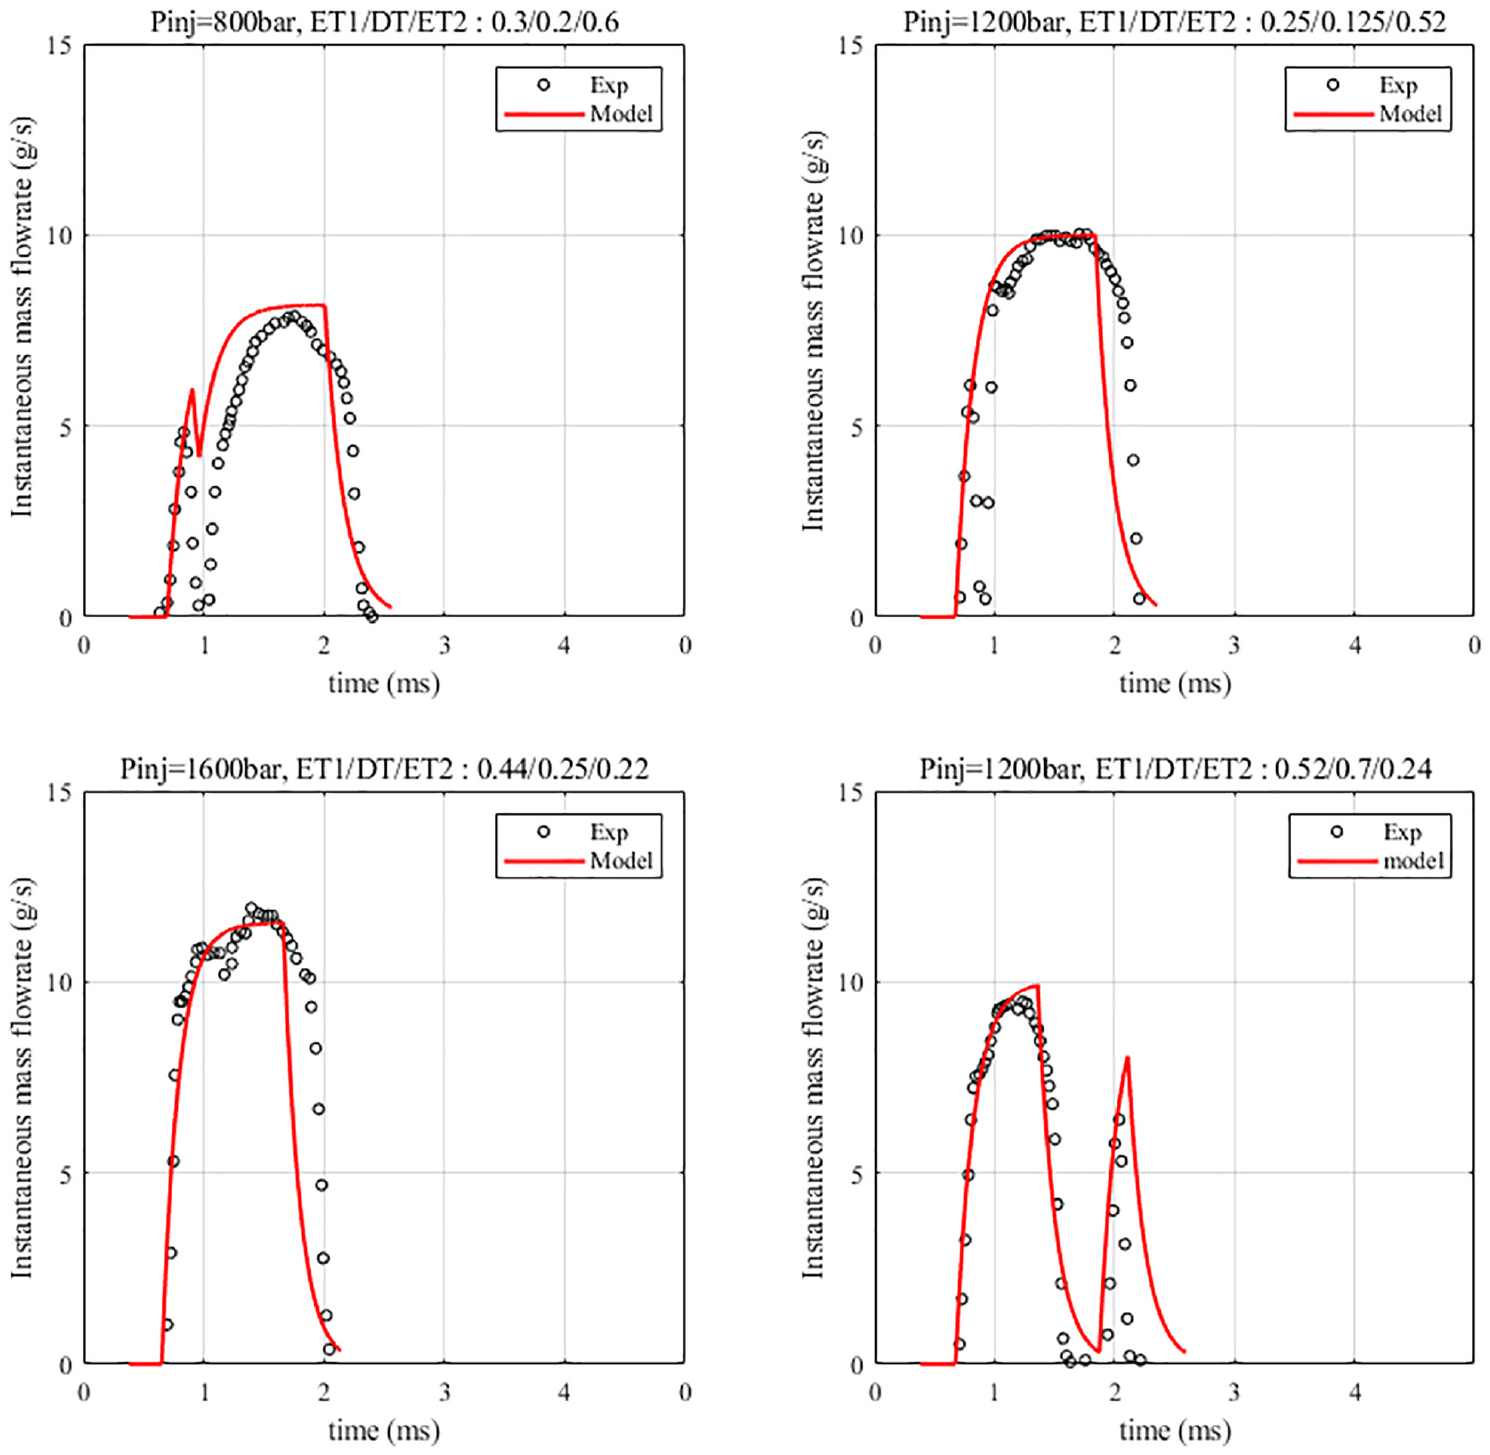
Comparison between the proposed model and experimental results of Ferrari and Zhang 7 for different double injection strategies using a piezoelectric diesel injector (tiod,inj1 = 0.00036, A = 0.0011, B = 5500, C = 4e-9, D = 1,28 and E = 5,62e-13).
Conclusion
The paper proposes a new rate-of-injection empirical model based on an analytical solution of a first-order linear dynamic system exposed to an impulsion, and is validated against experimental data. It is thus based on a simple algebraic solution. To support the model validation, experiments have been conducted with simple and split injection strategies over different injection pressures, injection durations, and time intervals between injections. While single injections were successfully modeled, one of the main features of the model is its ability to predict the double injection mass flow rate even when a fusion of both injections is observed.
The proposed model was developed using an indirect solenoid injector. However, by using data available in the literature, the model shows its universality by allowing to predict the instantaneous mass flow rate of a piezoelectric injector. Finally, the model allows predicting single and double injections with and without fusion.
Footnotes
Appendix A
Declaration of conflicting interests
The author(s) declared no potential conflicts of interest with respect to the research, authorship, and/or publication of this article.
Funding
The author(s) disclosed receipt of the following financial support for the research, authorship, and/or publication of this article: The financial support from NSERC is greatly appreciated.