
Abstract
Internal combustion engine research predominantly focuses on routes to lower emissions to meet various emission legislation. Lower emissions can be achieved with increased fuel efficiency and less lubricant throw off/lubricant combustion in the piston ring zone. These are all dependent on the oil film that forms between the liner and piston components. This article details the use of ultrasonic sensors to study the lubricant film thickness between the engine liner and piston rings/skirt in a fired diesel two-cylinder YTR engine. The testing regime covered a series of engine speeds and loading levels and found the minimum oil film thickness to vary from 1 to 3.5 μm. Spectrograms (time-varying ultrasonic amplitude spectra) have shown a residual oil film on the liner, first present after the skirt moves above the sensor that peaks at 440 μm, which then dissipates until the next oil control ring passage. Start-up and shut-down captures have visualised the build-up and reduction of the film thickness, in which during start-up typically a 2-s interval between the first ring passage and a consistent film thickness was seen. Whilst the shut-down tests showed a lesser variation, anticipated to be due to the oil pump already operating and is, therefore, less subjective to a reduction in engine speed providing a threshold of oil remains on the liner. Measurements like this help to describe how lubrication occurs in the piston ring zone and hence can optimise component design and an oil injection schedule.
Keywords
Introduction
Modern engine development is focussed on reducing fuel consumption and lowering emissions to meet emission regulations such as the Cleaner Trucks Initiative in the US 1 or EURO VI 582/2011 in the EU. 2 This is compounded with a consumer desire to meet these goals; for low- and zero-emission vehicles 3 and a reduction in fuel consumption, as some companies report fuel to account for 30% of operational costs. 4 With the advent of EV and hybrid vehicle technologies, modern internal combustion engines will have to continue to improve to remain economically competitive and environmentally acceptable.
Several studies quantify the mechanical losses in different engine components due to friction.5,6 Generally, it is understood that the largest single factor is the piston-ring and liner lubricated interface contributing some 20%–40% of mechanical power loss.7,8 It is this tribo-system that also has the most substantial influence on effective gas sealing. It is regarded as the most complicated tribological component of an internal combustion engine as in every stroke of the piston, the ring and liner may experience boundary, mixed and full fluid film lubrication conditions 9 and is subjected to large, rapid variations of load, speed, temperature and lubricant availability. 10 Maintaining a separating oil film, thick enough to avoid bore polishing or scuffing, but not so thick that oil is lost into combustion, is of prime importance. A significant amount of work has been undertaken to improve the tribological performance of the piston-ring and liner dynamic interfacial conditions.11–14 A comprehensive review of piston ring dynamics, lubrication and tribological performance is presented.15,16 Work in this area generally falls into three categories: lubrication state improvement, surface modification and design parameter optimisation. 7
There is a recent general trend to improve the lubrication state by reducing automotive engine oil viscosity to minimise both viscous friction and pumping losses leading to a reduction in fuel consumption. However, as these thin lubricants are used there is a risk of film breakdown and solid-solid contact at the lubricated interfaces in the engine. This can lead to reduced engine life and, in some cases, catastrophic wear. Fully formulated engine oils contain a range of additives to improve performance in this thin film regime, but also to maintain viscosity at high temperatures. As engine lubricants age they degrade over time, particularly the long-chain Viscosity Index Improvers (VIIs) may break down affecting the lubricant viscosity.
The design of the ring-pack has been shown to significantly impact the tribological performance such as ring profile, width, ring twist and torsional stiffness, materials and coatings and ring spacing.17,18 Studies have demonstrated the importance of compression ring design and surface profile8,19 and also the influence of oil control ring configuration, particularly in combination with the liner out of roundness.20,21
Significant work has been undertaken to model and simulate the piston-liner film thickness with varying levels of complexity, see Mishra 22 for a comprehensive summary. To assess the resultant performance of new designs, lubricants and to validate models, experimental measurements are required.
Much can be learned about the performance of the piston-liner tribo-system from simplified bench tests23,24 but final validation is usually achieved by extensive engine testing and inspection of bore surfaces post-test. This expensive process would be greatly enhanced with an experimental method to measure oil film thickness in the engine with minimal invasion.
Several different methods have been employed to measure the oil film between piston-ring and liner. Laser induced fluorescence involves directing a laser through a transparent window onto the oil film which energises specific bonds in fluorescing material raising electrons to a higher energy state. Upon returning to their original state, photons of a different frequency are emitted and can be correlated to oil film thickness.25–28 Electrical capacitance probes and inductance probes can be mounted flush on the internal surface of the liner and have also shown much success in measuring the minimum oil film thickness.29–34 These methods require invasive machining of the cylinder bore such that the probe is in contact with the oil film, or that there is a transparent window to facilitate the optical measurement. A comprehensive review of instrumented engine tests using the various methods is given in Garcia-Atance Fatjo et al. 33 which describes the different experimental techniques and draws comparisons with the theoretical studies.
Ultrasonic approaches have recently been explored to measure piston ring oil films.35–41 These techniques are based on pulsing an ultrasonic wave through the liner wall and its reflection from the oil film. The amplitude and time of arrival of the reflected pulse is used to determine various aspects of the lubrication process including the oil film thickness. A clear advantage is that the approach is non-invasive and requires no penetration of the sensor into the bore.
In this work, an ultrasonic oil film measurement approach was used to explore the formation of oil films at various points along the axial length of the liner. The film thickness of each piston ring is compared and the variation between the different strokes in the engine cycle at various speeds and loadings are explored. Novel work was performed to quantify the residual lubricant film thickness over an ultrasonic sensor. In addition, novelty is found from the use of the ultrasonic sensors to evaluate the film formation during start-up and shut-down of the engine which is particularly relevant with hybrid and stop-start engine technologies.
Ultrasonic measurement concept
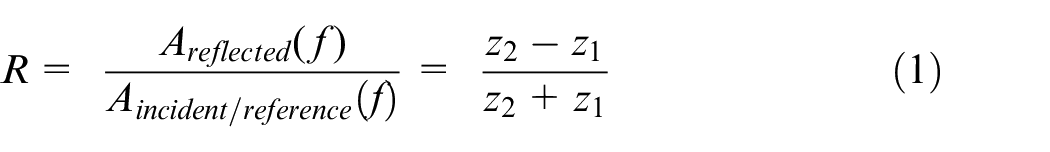
The basis of ultrasonic lubricant property measurements is grounded on a piezoelectric transducer being bonded to a medium, in this case, the external surface of the cylinder liner. The transducer is excited with an electric pulse which generates a high-frequency acoustic pressure wave due to the principle of piezoelectricity. The sound wave propagates through the host medium and is reflected from the internal surface of the liner. When there is no piston ring aligned with the sensor the ultrasonic pulse is fully reflected (from the solid-air interface, black line in Figure 1) whereas when a piston ring is aligned, part of the pressure wave is transmitted through the lubricant film and part is reflected (solid-solid interface, blue line in Figure 1). This transmittance results in a reduction in the amplitude of the reflected wave. The amount of the wave amplitude reflected depends on, amongst other things, the thickness of the oil film. The proportion that is reflected relative to the incident amplitude is termed the reflection coefficient, R, and is purely dependent on the acoustic impedances of the two media. The definition of R is shown in equation (1). At a solid-air boundary, the signal is almost completely reflected (R = 1) and so this can be used as the reference signal (Areference(f)).
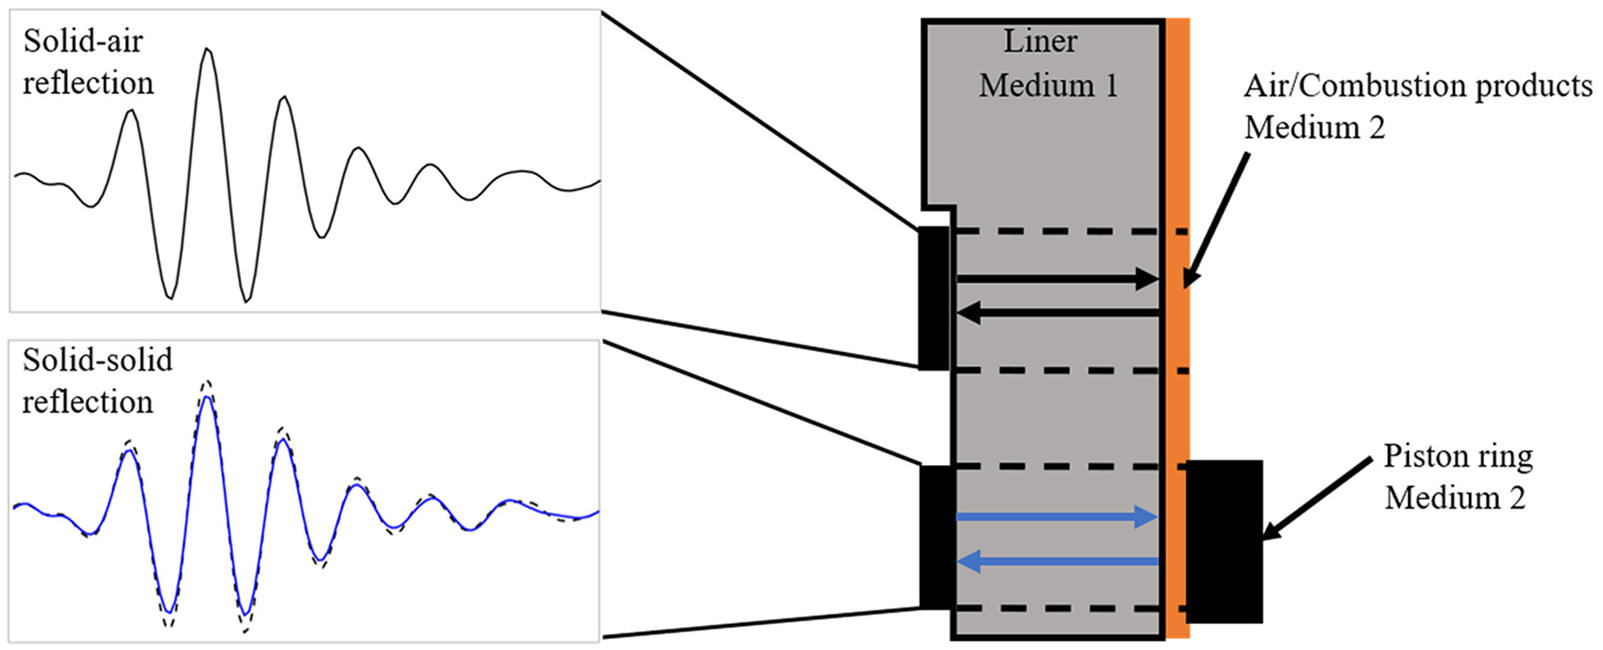
A schematic describing the ultrasonic measurement of film thickness from an engine liner mounted transducer.
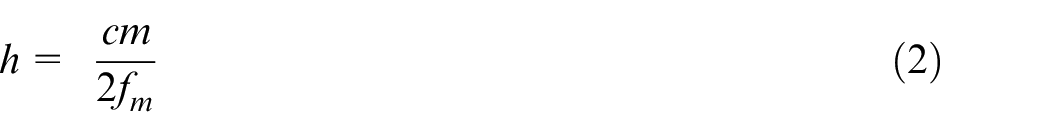
There are several ways to calculate the lubricant film thickness from the reflected wave. The reduction in amplitude can be used in a so-called Quasi-Static Spring Model.42–44 It is also possible to use the change in phase of the wave,45,46 time of flight based methods, 47 and a recent approach that uses an exact analytical solution to the three-layer reflection problem. 48 For thick films a time-domain separation method 49 can be used when there are two reflections clearly separated in the time domain. Alternatively in thick films the resonant frequencies of the oil film can be studied. 43 The film thickness from frequency resonances is found by applying equation (2) which has previously been applied in applications such as journal bearings 50 in which c is the speed of sound, fm is the dip frequency and m is the resonance mode.
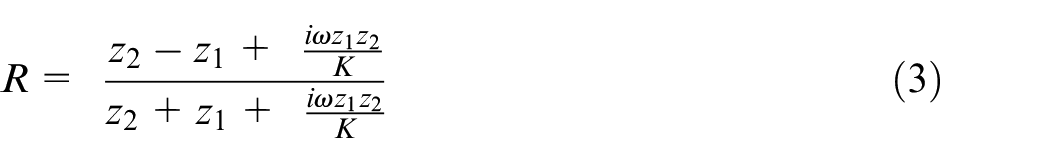
For very thin films like those seen between a piston ring and the liner, the Quasi-Static Spring Model 42 is the most appropriate as it is highly sensitive over the film thickness range 0–20 μm. This approach is based upon modelling the solid-oil-solid system as two mediums that are connected via a series of springs that remain within their elastic region. The stiffness of these springs dictates the reflected portion of the ultrasonic wave, this model improves the definition of the reflection coefficient shown in equation (1) to equation (3). Omega (ω) is the angular frequency, K, is the interfacial stiffness and the complex terms are shown via the complex number i.
The stiffness of the lubricant film between the piston ring and liner is dependent upon the fluids bulk modulus, B, and the lubricant layer thickness, h, shown by:
The bulk modulus can be rewritten in terms of the speed of sound and density, to provide an alternative definition of the stiffness:
The combination of equations (3) and (5) produces an equation for the lubricant film thickness which is dependent on the reflection coefficient and material properties of the system 43 :
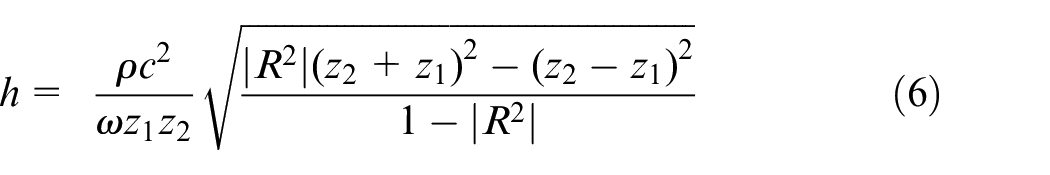
This equation is the basis for the determination of oil film thickness from the reflection coefficient. It holds true for thin oil films (where the wavelength of the sound wave is large compared to the thickness) separated by parallel flat surfaces.
Implementation on a test engine
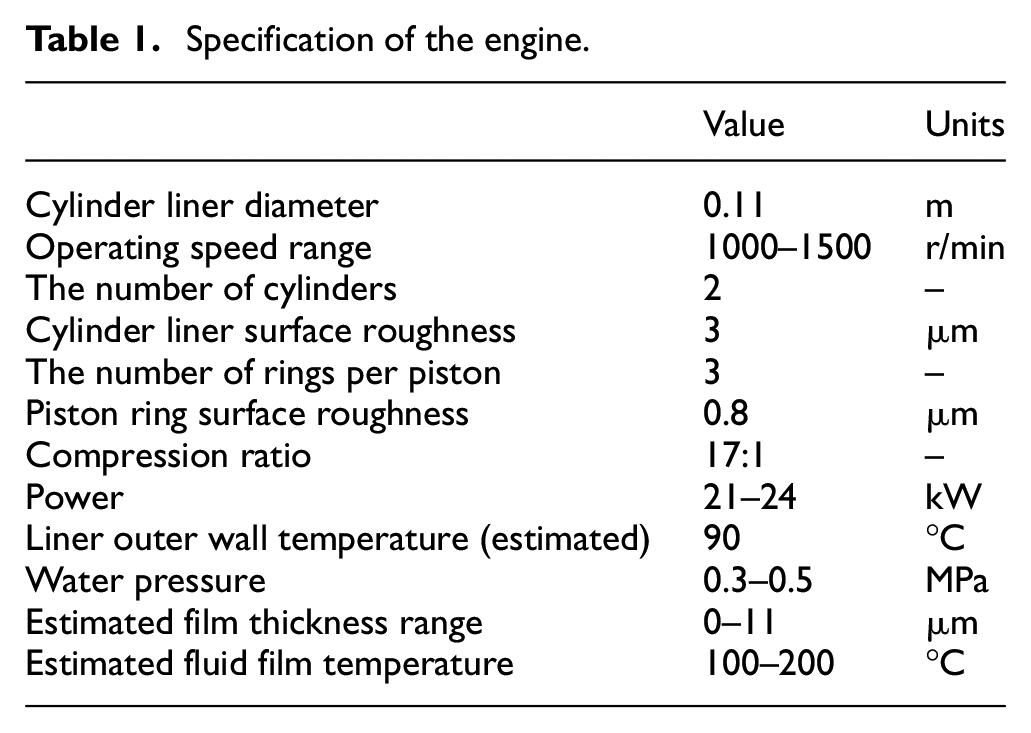
The engine considered in this work is a diesel YTR engine, specifically a YTRC2110D, the two-cylinder engine is typically used in heavy-duty vehicles such as tractors. The test rig setup is shown in Figure 2 with the main specifications of this engine are shown in Table 1.
Specification of the engine.
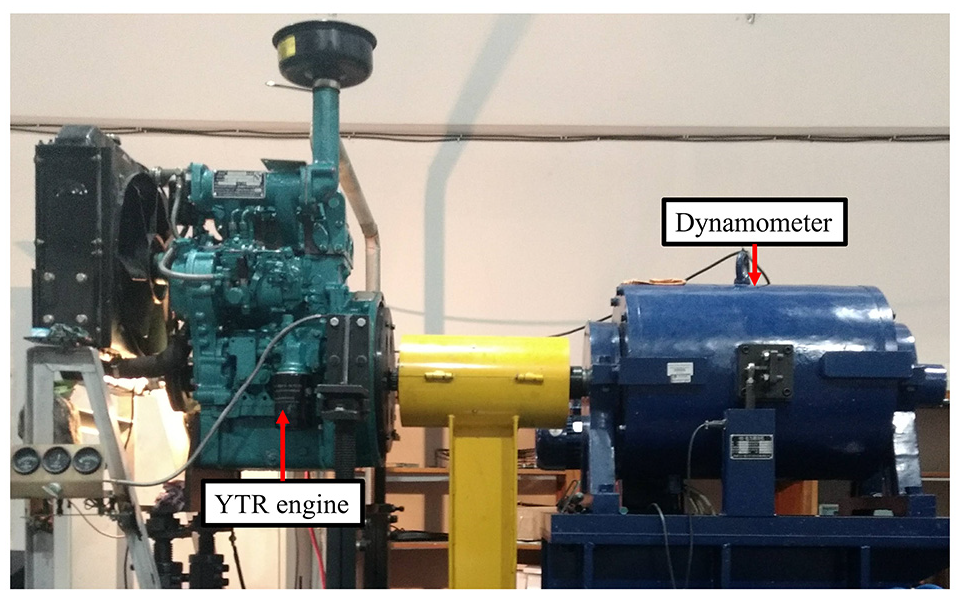
The YTRC2110D test engine and dyno.
Liner instrumentation
The YTRC2110D engine uses a wet liner, therefore, to enable ultrasonic instrumentation the liner was removed from the engine and a small flat was machined on the external surface of the liner. This flat was to locate the transducers and to enable the liner external diameter to remain the same post instrumentation. A total of 11 high temperature 5 MHz longitudinal transducer elements were adhesively bonded to the liner each with a width of 1.3 mm. While during the engine testing the optimal six transducers were selected based on the geometric position and signal quality. Figure 3(a) shows the position of the transducers used for testing, numbered 1–6, with the piston at its top dead centre (TDC) position. Figure 3(b) is a photograph of the instrumented component (sensor assembly is shown under a protective layer of Kapton film which was removed prior to installation in the engine).
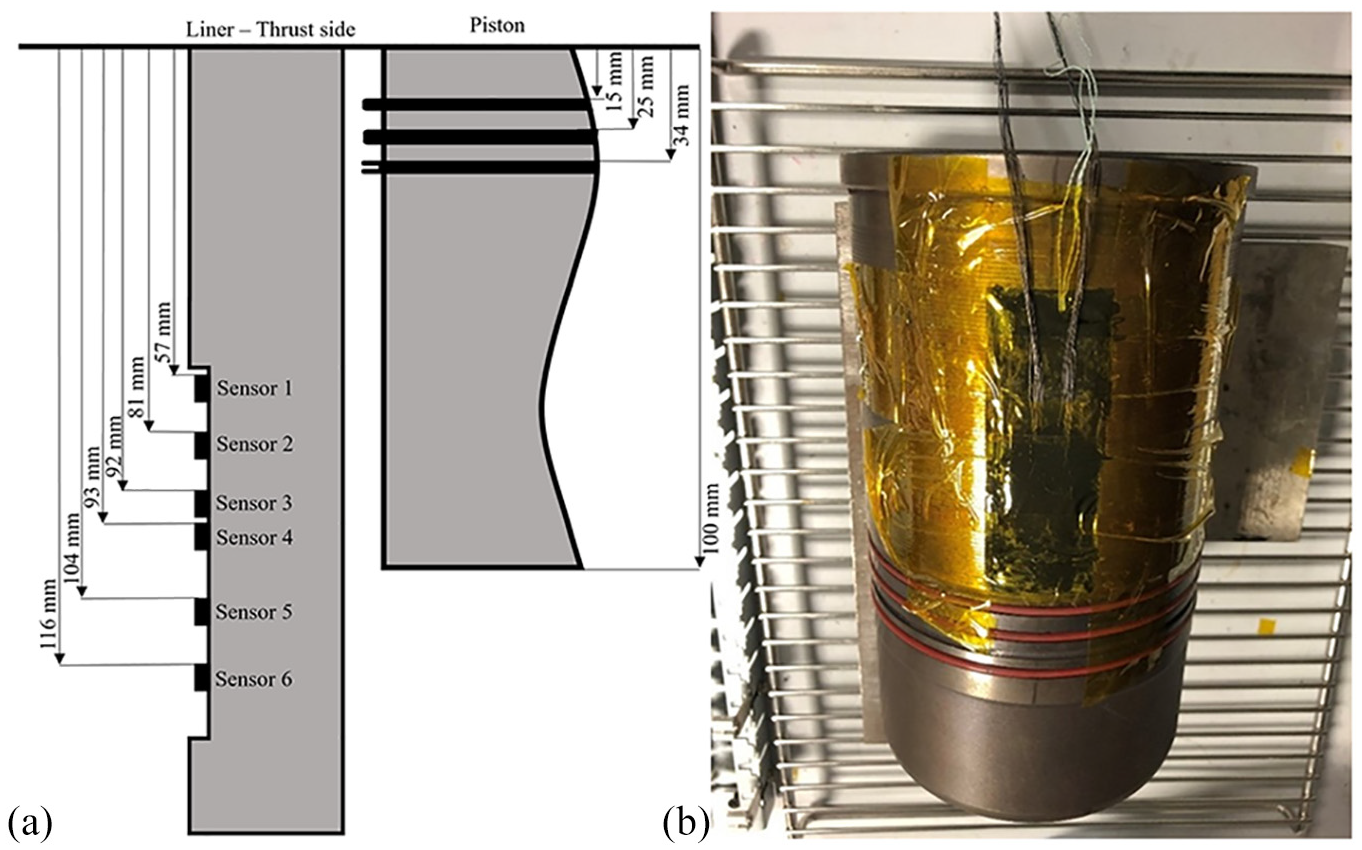
(a) Schematic of the transducer layout and (b) a photograph of the instrumented component.
Coaxial wires were soldered to each sensor and the wiring was gathered into a bundle. Each sensor was protected with an epoxy potting compound to seal against any coolant that could potentially damage or short the transducers. The liner was inserted into the engine block and the wiring loom was fed out through a pre-existing coolant channel that was not in use. Figure 4 shows photographs of the liner during the installation process. The liner was installed to the engine with the sensors on the neutral axis Figure 4(a), final placement of the sensors (Figure 4(b)) positioned the sensors on the thrust side of the engine. The complete installation process required minimal modification to the engine, the only modification to the engine was the flat machined onto the external surface of the liner (see Figure 3).
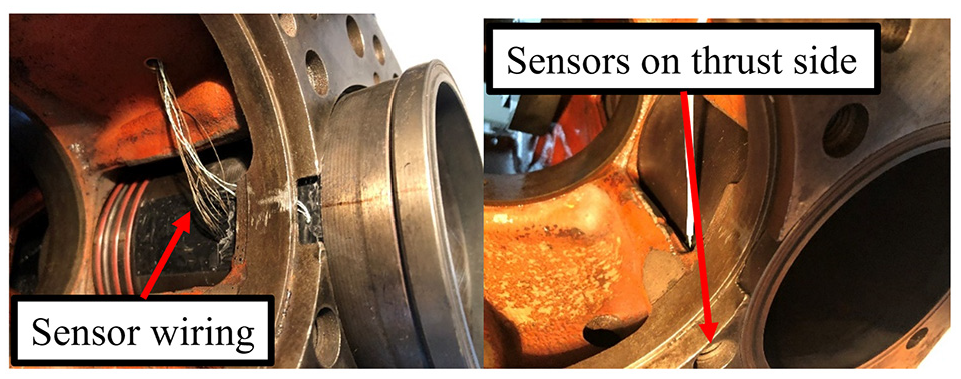
Photographs of the instrumented liner being installed into the engine. (a) cylinder liner inserted with sensors on the neutral side. (b) final liner positioning with the sensors on the thrust side.
Ultrasonic equipment
A schematic of the ultrasonic instrumentation and signal processing equipment is shown in Figure 5. An ultrasonic pulser receiver (UPR) was used to control the ultrasonic signals. Inside the UPR a card generates short voltage pulses that are sent to the ultrasonic transducers. The sensors converted this voltage to a mechanical displacement due to the piezoelectric effect and therefore propagate an ultrasonic wave through the cylinder liner. The ultrasonic wave is reflected from either the liner internal surface or the piston ring and is detected by the same sensor. The sensor converts the signal back into a voltage, which was then digitised in the UPR and shown in real-time as a time-domain reflection of the ultrasonic wave. Two ultrasonic pulse rates were used during the testing regime, a lower pulse rate when data were captured on all sensors at once (10 kHz) and a higher pulse rate when data were captured on a single sensor (80 kHz).
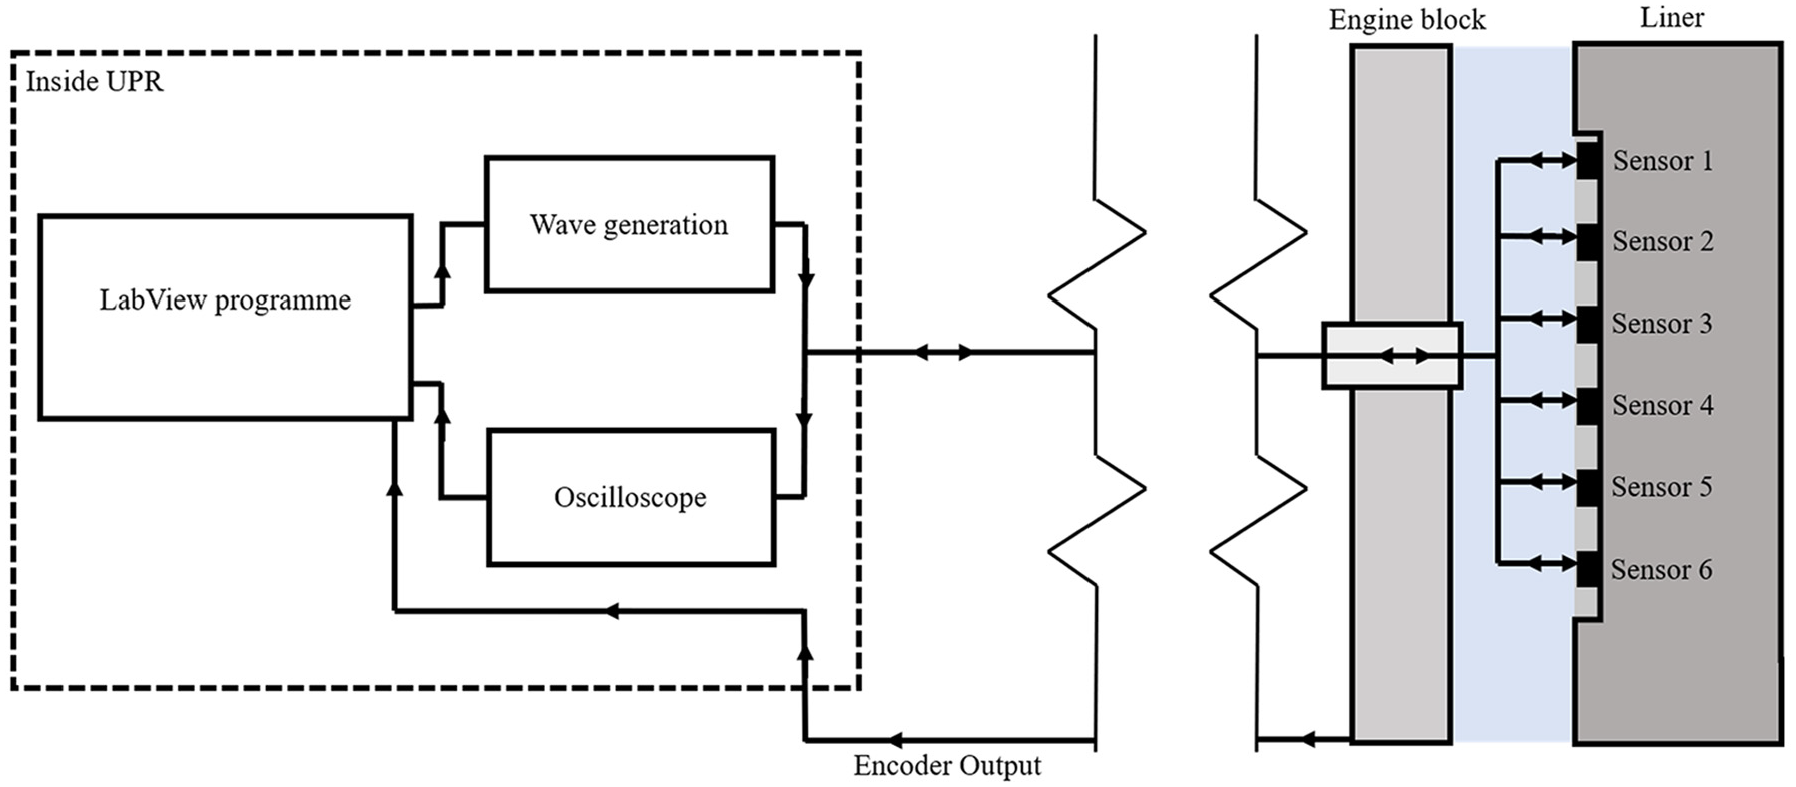
Schematic diagram of sensor layout, DAQ and signal processing equipment.
Lubricant details
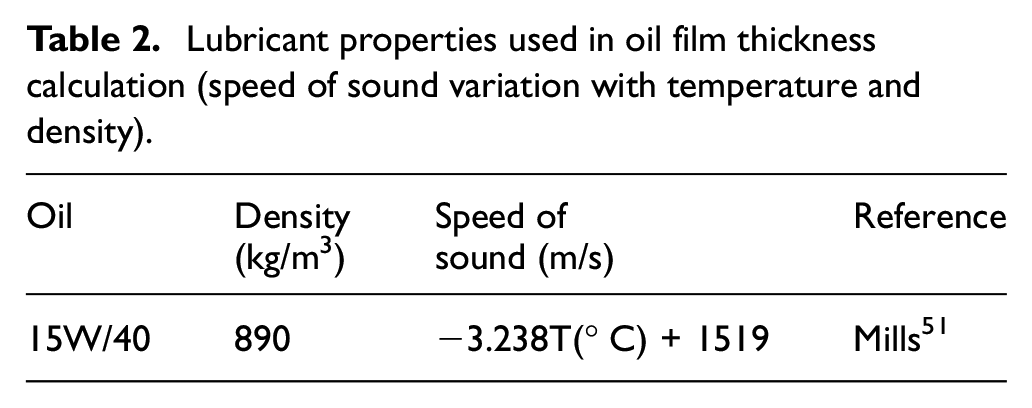
The engine was lubricated with a standard 15W/40 formulated engine oil. According to equation (6), the speed of sound in the oil and the density are required for the determination of oil film thickness from an ultrasonic reflection. The acoustic velocity of this oil has previously been measured experimentally using the time of flight of an ultrasonic pulse through a sample of oil in a vessel of known path length. This experiment was conducted at a range of temperatures in a thermostatically controlled oven. The speed varied approximately linearly with temperature; a curve fit was applied to the data as given in Table 2. The lubricant density was also provided by the supplier (see Table 2). Only the lubricant density and speed of sound are considered here as other factors such as lubricant viscosity are not required for oil film thickness calculation based upon the Spring Model as shown in equation (6).
Lubricant properties used in oil film thickness calculation (speed of sound variation with temperature and density).
Test matrix
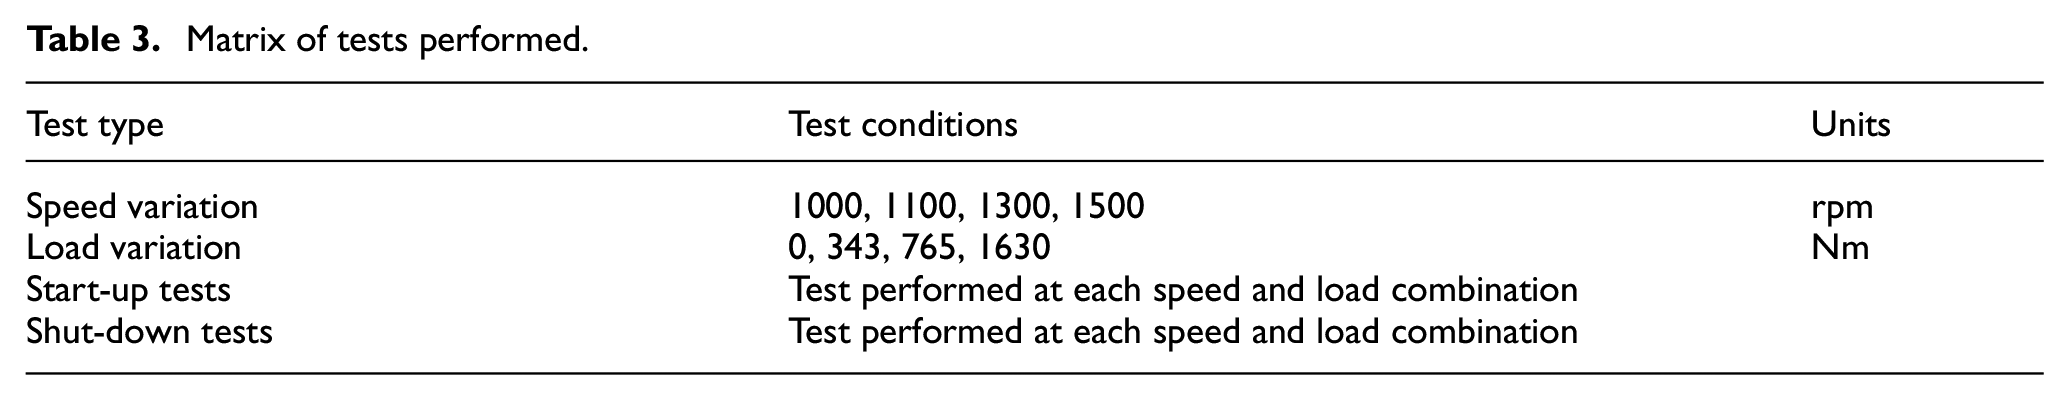
Table 3 shows the range of tests conducted during the testing programme with data captured at each speed and load combination. For each engine configuration, the engine was left to reach steady-state operation and then a high-speed data capture was performed lasting 2 s. The crank angle (CA) was also captured using a shaft encoder mounted on the crankshaft. In addition to steady-state testing, data was recorded for each start-up and shut-down of the engine, these recordings typically lasting for 10 s. At the engine speeds shown in Table 3, an ultrasonic pulse rate of 10 kHz equated to one data capture per 0.6 CA at 1000 rpm and one capture per 0.9 CA at 1500 rpm. Whilst the single sensor captures reduced the data capture interval by a factor of 8.
Matrix of tests performed.
Signal processing
A typical reflection pulse is termed an A-scan and an example is shown in Figure 6. The sound pulse initiated from the ultrasonic transducer propagates back and forth inside the liner until the energy has dissipated therefore several reflections are seen. The four reflections are annotated in Figure 6. For the data recordings the first reflection was studied, therefore only the time window relating to this pulse was recorded (see Figure 7(a)).
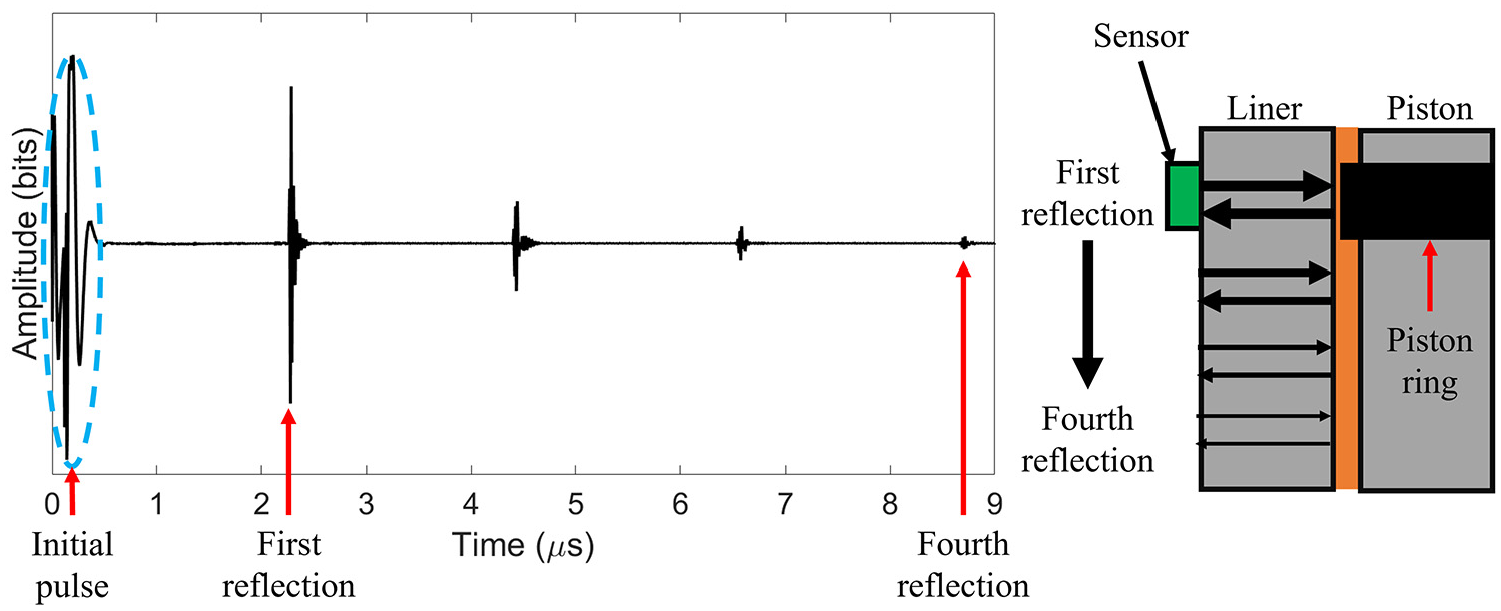
Typical A-scan of the reflected signal. Four reflections from the internal surface of an engine liner are shown. Note in the sketch the four reflections occur at the same location, yet the reflections are displayed down the liner for visualisation purposes.
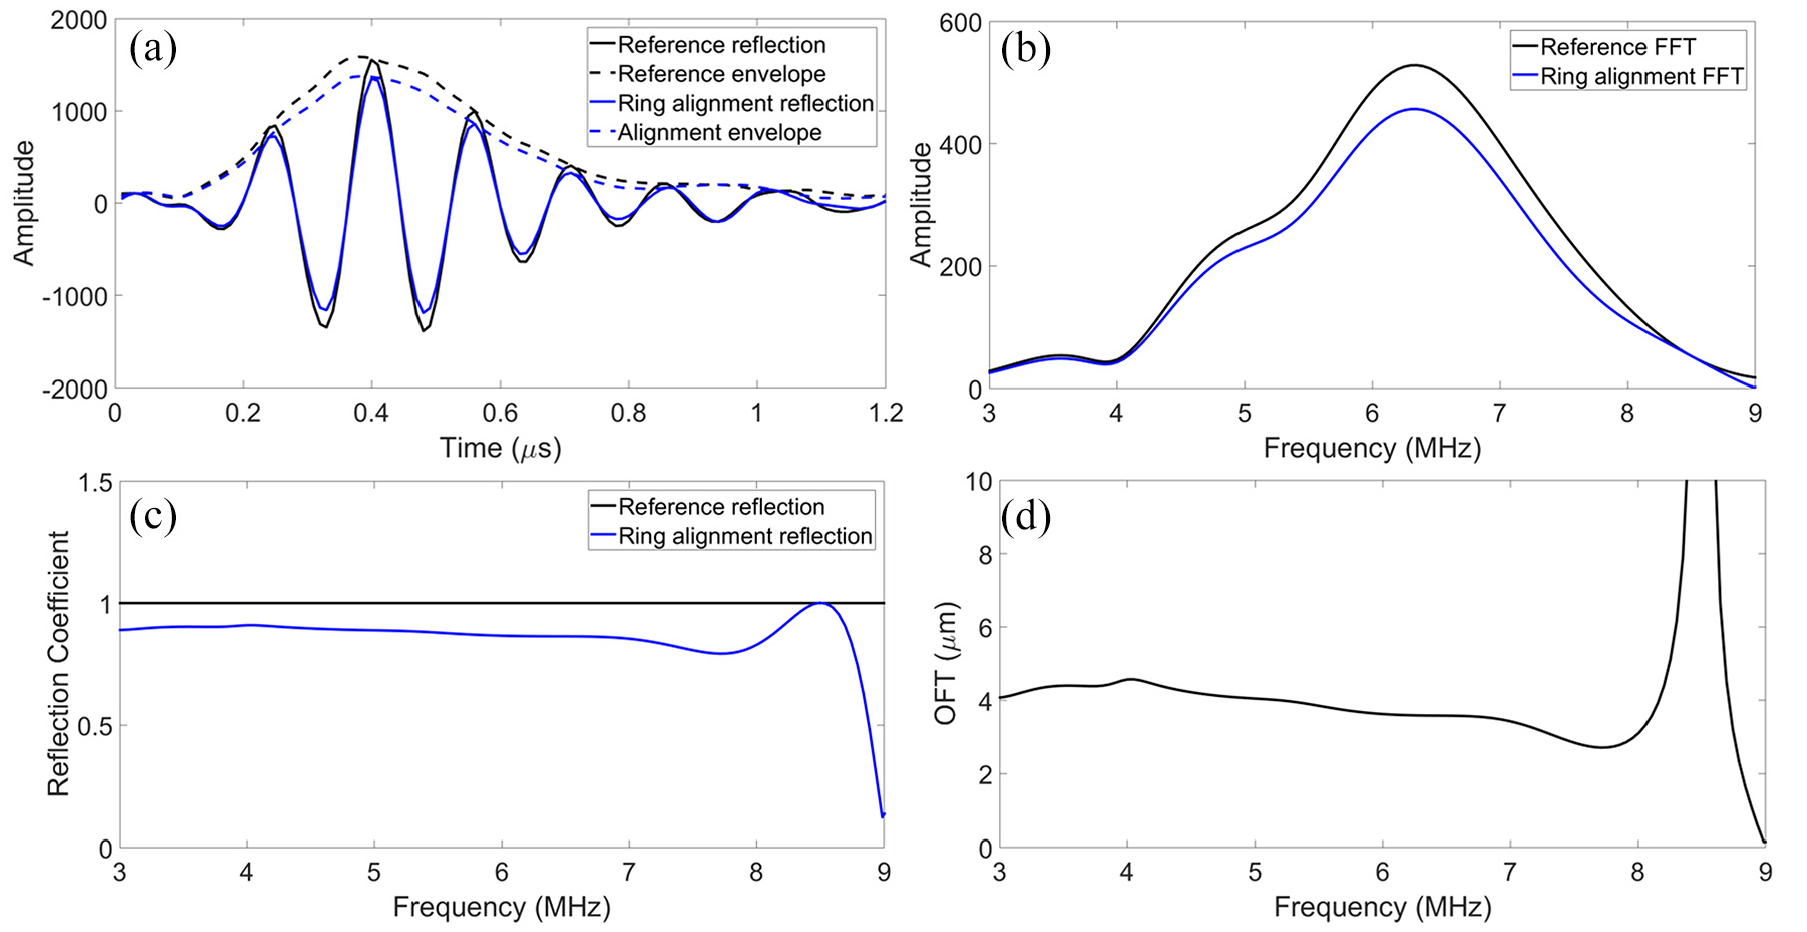
(a) Reference and ring aligned ultrasonic reflection, (b) reference and ring aligned FFT, (c) reflection coefficient with respect to frequency and (d) oil film thickness with respect to frequency.
The typical data processing steps applied to the first reflection to obtain the oil film thickness are shown in Figure 7. In this example, there is a reflection from when a piston ring was aligned with the sensor and a reflection where the piston is close to the bottom dead centre (BDC) and so remote from the sensor location which is used as a reference reflection.36,41
The time-domain response is shown in Figure 7(a) for a reference reflection and a reflection from an aligned piston ring. The fast Fourier transform (FFT) of these reflections is shown in Figure 7(b). It can be seen in both plots that the alignment of the piston ring reduces the amplitude of the reflection in the time and frequency domains, this is due to a portion of the wave energy being transferred to the piston ring. The reflection coefficient (the amplitude of the measurement signal divided by the reference signal according to equation (1)) is calculated over the full frequency range as shown in Figure 7(c). The usable range of reflection coefficient is approximately 50% decibels (dB) of the FFT bandwidth (4-7 MHz in this case). The lubricant film thickness is then calculated (Figure 7(d)) from the reflection coefficient using equation (6). The lubricant film thickness is frequency independent so, within the bandwidth of the transducer, this should appear as a flat line. Figure 7(d) shows that this is indeed the case and so indicates the validity of the spring model equation (6).
In previous works that have applied this data processing route41,52,53 there have been significant peaks at the shoulders of the ring passage (see the reduced impact of this in Figure 8 termed the ‘fringe effect’), these are anomalous (reflection coefficients greater than one are unexpected). This feature is caused by the finite size of the sensor; the beam emitted from the sensor is of similar size to the ring so that some parts of the beam will strike the ring at different times. When these reflect back there is some interference between the different parts of the signal and regions of constructive and destructive interference occur (this has been previously discussed extensively52,53). To reduce the impact of the time-delayed reflections from differing sections of the ring outside the alignment of the sensor, a novel data processing method was used to define the reflection coefficient (the peak of the Hilbert envelope relative to the peak of the reference envelope, see Figure 7(a)).
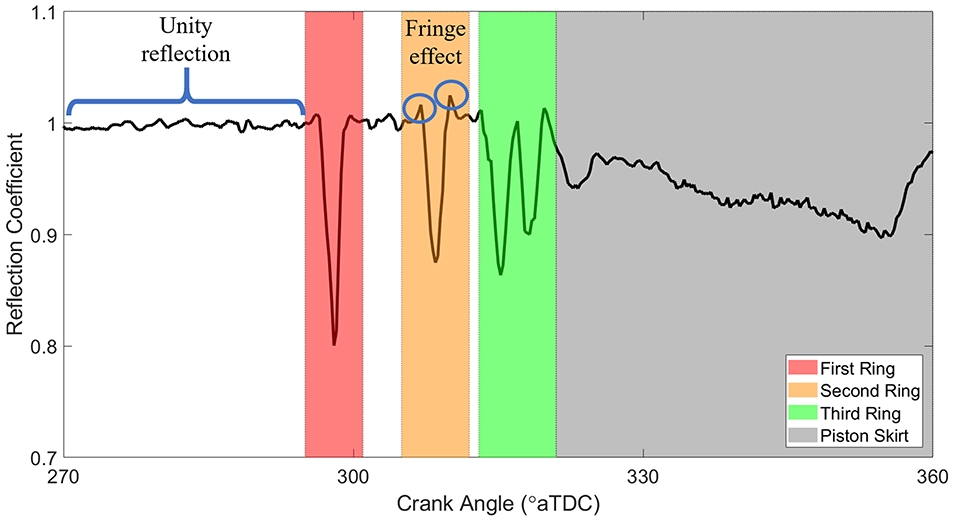
Reflection coefficient plotted as the ring pack passes over Sensor 1 during a compression stroke for an unloaded test case at 1500 rpm.
In the data captures, reflected pulses were recorded continuously for 2 s, therefore the four-stroke engine experienced multiple compression and exhaust cycles (0°–720° CA) in each capture. Figure 8 shows the reflection coefficient over Sensor 1 during a compression stroke (270°–360° CA) in which the data is averaged from the multiple cycles covered in a data capture. The regions where all three piston rings and the piston skirt are aligned with this sensor have been highlighted.
When the piston is remote from the sensor, the reflection coefficient is unity (R = 1) as gaseous mediums are unable to propagate ultrasonic waves. Whereas when a piston ring passes the sensor there is a dip in reflection coefficient (R = 0.8, for the First Ring) as a portion of the sound wave propagates through the oil film into the piston ring and therefore less of the wave is reflected.
The compression stroke is an upward stroke of the piston, therefore the first ring to pass the sensor is the compression ring (First Ring) followed by the scraper ring (Second Ring). Next, the oil control ring (Third Ring) as this ring has two rails each rail passage is detected. Lastly, the skirt of the piston moves over the sensor over an extended CA range leading to a prolonged reduction in reflection coefficient. This dip in R reduces throughout the stroke suggesting tilting of the piston as it moves up the liner, with a lower value of reflection coefficient indicating a thinner lubricant film so the lower portion of the skirt is in closer proximity to the liner.
The reflection coefficient data is converted into oil film thickness (OFT) using equation (6). The materials of the ring and liner are steel and cast iron respectively, whilst the piston is made from aluminium. The speed of sound and density are defined from the equations in Table 2. The resulting oil film thickness variation over the compression stroke of Sensor 1 is shown in Figure 9.
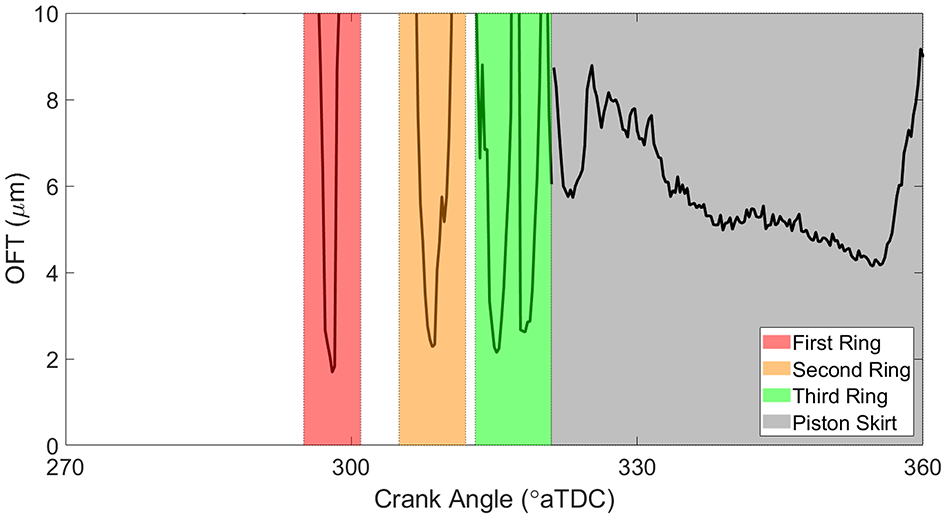
Oil film thickness, plotted as the ring pack passes over Sensor 1 during a compression stroke for an unloaded test case at 1500 rpm.
The oil film thickness of the three rings and piston skirt can clearly be seen. In this example, the oil film is thinnest for the first compression ring (∼2 μm) and gets progressively thicker for the scraper ring, oil control ring (∼2.5 μm) and is thickest for the skirt (4–9 μm). The compression ring is expected to have the thinnest film in this stroke as this ring can be considered as a buffer between the higher pressure of the combustion chamber and the lower pressure of the crankcase. The ring is expected to be located at the bottom of the ring groove at this point in the stroke, therefore, enabling gases in the combustion chamber behind the ring leading to the ring to conform more to the liner, producing a thinner lubricant film. The thickest film, over the piston skirt, shows a progressive thinning of the film as the piston moves up the liner, this suggests tilting of the piston with the lower edge of the skirt being in closer proximity to the liner. This trend is clear from 330° to 350° CA until a sudden increase in the OFT as the piston is nearing its TDC position, as the tilting of the piston may be reversed here.
In the regions where the rings/skirt is remote from the sensor (R = 1), or in any anomalous or noisy regions (R > 1) the oil film thickness is under-defined (see equation (6)). In these regions the model is not applied as the Quasi-Static Spring model is only applicable for a solid-oil-solid system.
The anticipated piston ring alignment region for each ring is considerably greater than the OFT measurements indicate. This may be due to the averaging effect of the ultrasonic transducers, as the extremities of these alignment regions cover the instant that a ring starts to move over the sensor. In these cases (minor alignment, major misalignment), the averaging effect of ultrasonic sensors will have led to significant over predictions of the OFT to the extent that the calculated film is not within the range shown in Figure 9. The sensors in this work were 1.3 mm wide, with the rings typically 3.5 mm thick, therefore the work will have an improved spatial resolution relative to previous automotive ultrasonic based piston ring work reducing the impact of the averaging effect when the ring and sensor are largely aligned. Although this effect still evidently has an impact on the OFT measurements on the edges of the alignment regions.
Measurements of reflection coefficient were recorded from all sensors for full engine cycles (four strokes over 0°–720° CA) for each of the tests in the Table 3. Results were processed in the same way to provide oil film thickness.
Results
Steady-state operation
The average OFT from multiple engine cycles during steady-state operation over each sensor is shown in Figure 10 for each stroke of the engine. The regions corresponding with the intake, compression, power and exhaust parts of the cycle are indicated on the plot.
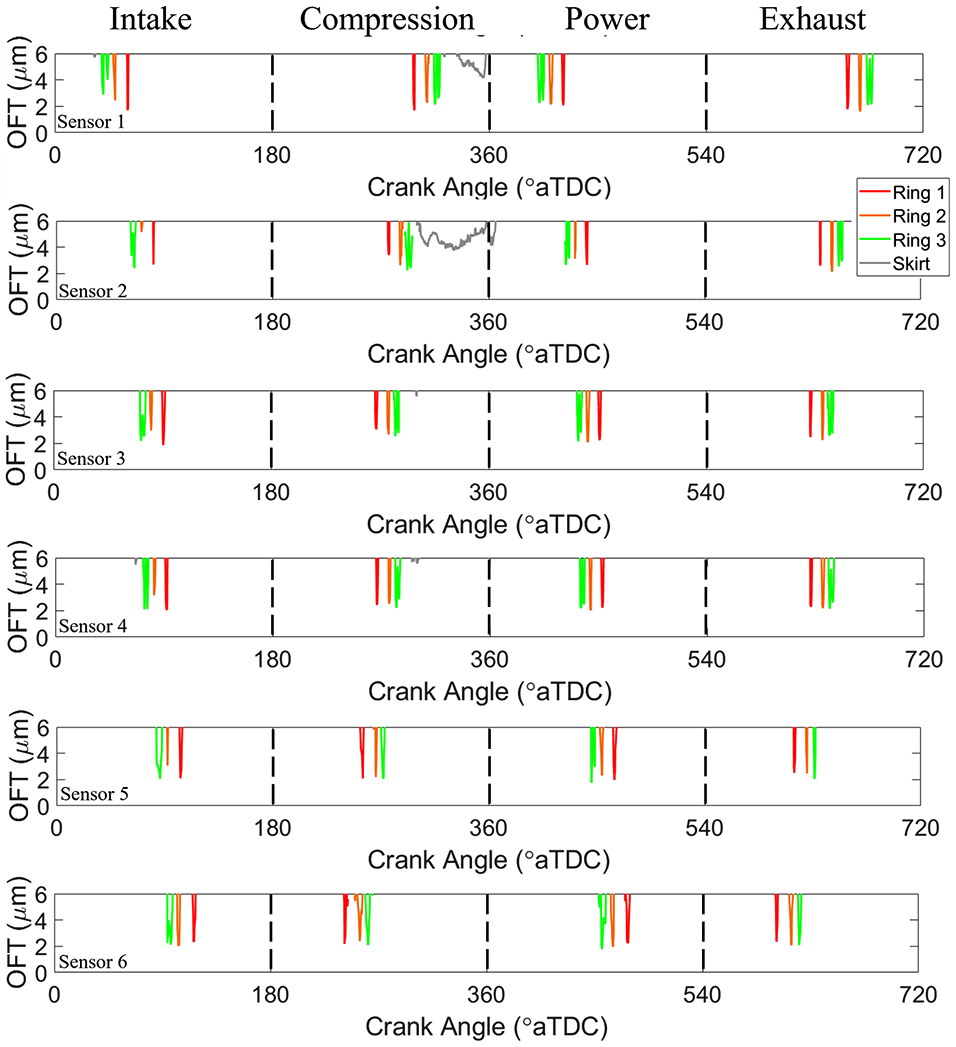
Oil film thickness determined from reflection coefficient measurements from Sensor 1 (top) to 6 (bottom) over two full revolutions of the crank covering intake, power, compression and exhaust cycles from an unloaded test case at 1500 rpm.
In each plot, four sequences of oil film readings can be seen as the ring pack passes over the sensor location for each of the strokes. Sensor 1 is located closest to TDC so the time between the ring passage during compression and power is shortest. Whilst for Sensor 6 the time between compression and power is longest. Reading the plots from left to right, as the engine rotates also indicates whether the piston is in an up- or down-stroke as in an up-stroke the first ring to move over the sensing region is the first compression ring, whilst in a down-stroke, it is the oil control ring/piston skirt.
Observation of all sensors indicates the extent to which the cylinder pressure is affecting the first compression ring. For Sensor 1, the sensor closest to TDC, the first compression ring typically produces a thinner OFT than the oil control ring. Whilst for Sensor 6, the sensor closest to BDC, each piston ring produces a near-identical lubricant film thickness when the pressure in each stroke is negligible.
Interestingly, the piston skirt is only measured over a sensor in the compression stroke and for Sensors 1 and 2 and thus the skirt OFT is outside of the measurement range for the other sensors/strokes. This suggests a number of findings; piston secondary motion is not discernible close to BDC, as the sensors are on the thrust side any tilting in the early stages of the power stroke is towards the anti-thrust side and during the other up-stroke (exhaust stroke) there is no tilting like that during the compression stroke.
Effect of speed on oil film thickness
The minimum oil film thickness (MOFT) has been extracted by isolating the minimum values each ring experienced in each stroke for every engine revolution recorded over the 2 s time interval. These values have been used to define the average MOFT and a standard deviation. The MOFT for the compression ring over each sensor is plotted at each engine speed in the four strokes in Figure 11.
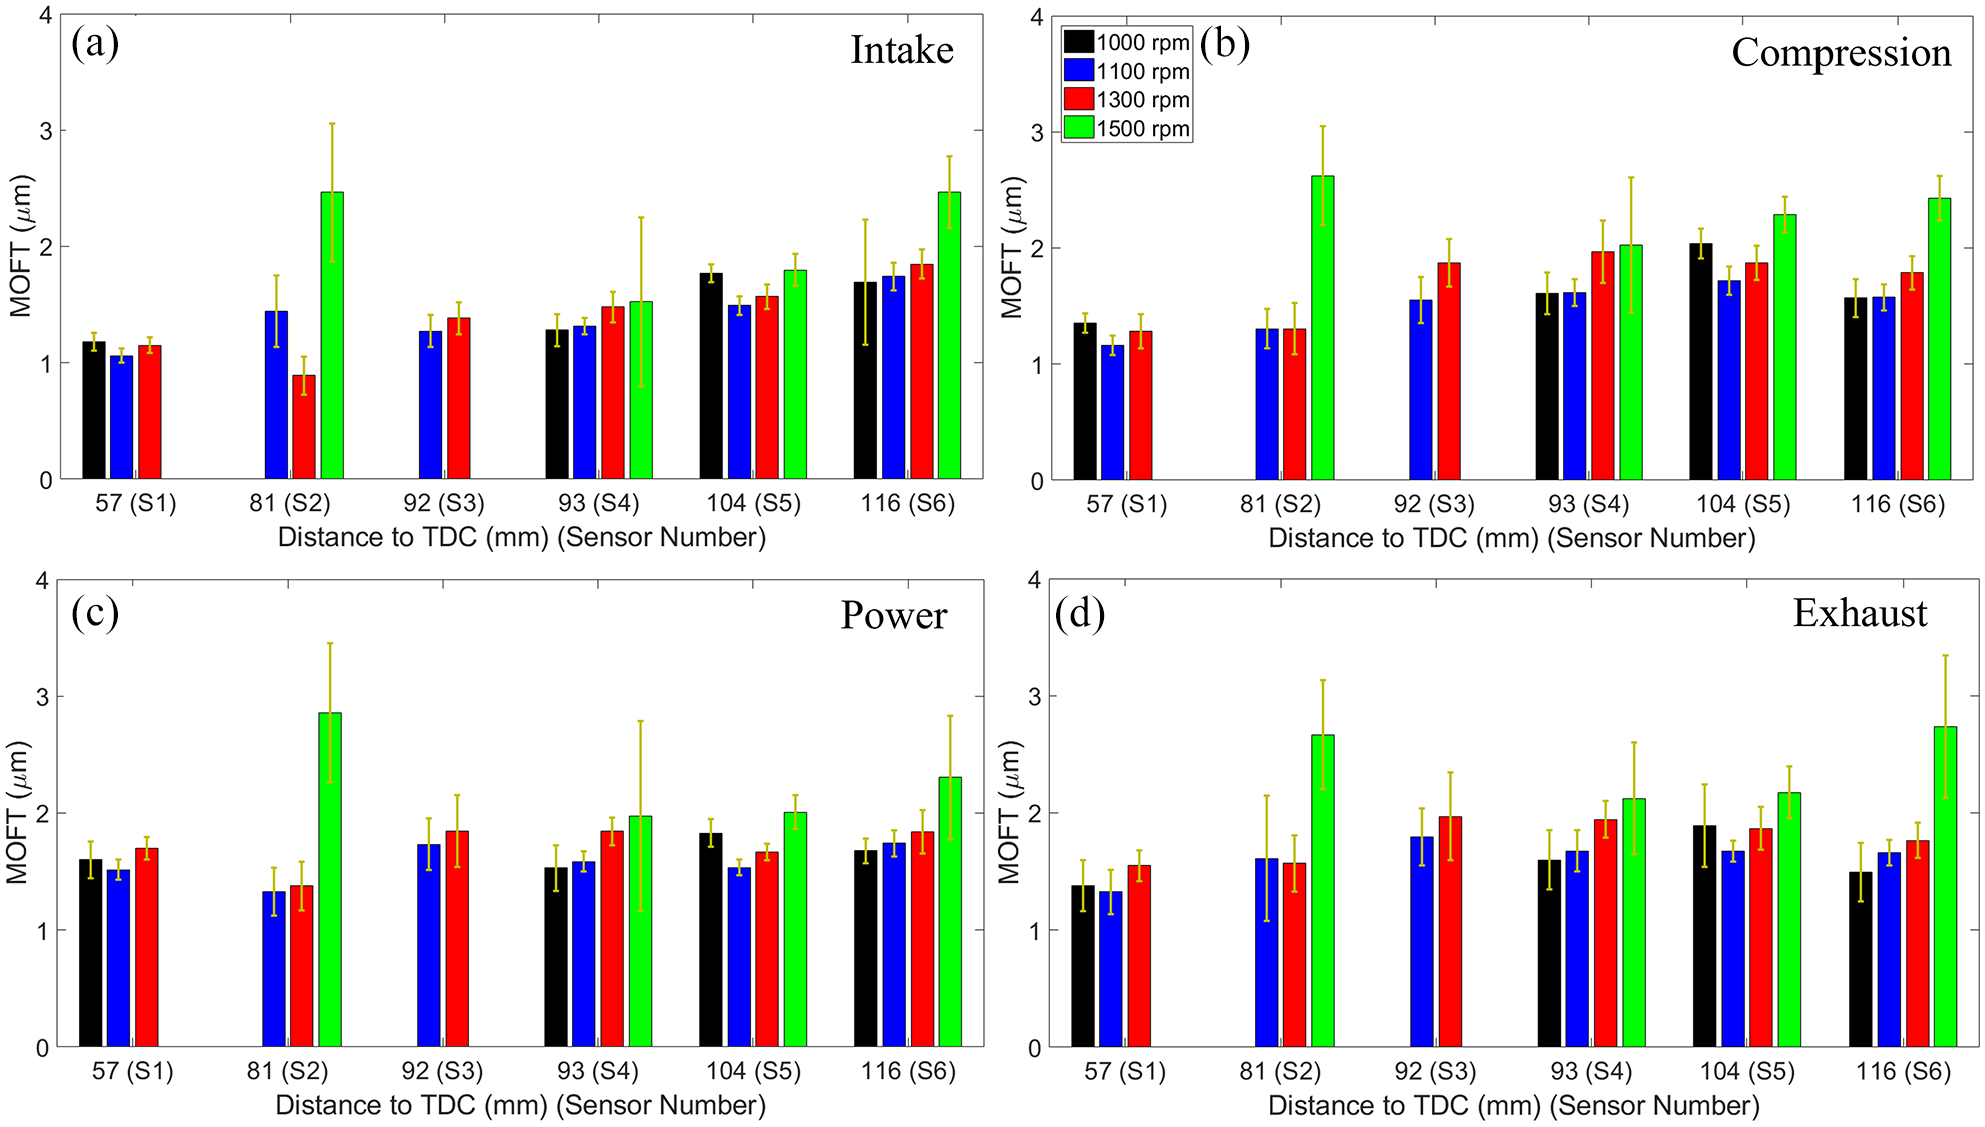
Measured lubricant film thickness for the Ring 1 (compression ring) over multiple strokes from an unloaded test case: (a) intake, (b) compression, (c) power and (d) exhaust.
The first point to note is that there is not a great deal of difference between the minimum film thicknesses in either location or with engine speed. For the First Ring at all locations, the minimum oil film thickness does not vary greatly and varies between 1 and 3 μm with the maximum standard deviation being ±0.8 μm. In all cases, this is thick enough to maintain full film lubrication.
There is a general trend for thicker oil films to form at higher engine speeds (1000 rpm:∼1 μm vs 1500 rpm:∼2 μm); hydrodynamic action causes greater fluid entrainment and film formation; this is true for all six sensor locations. Although this is counteracted by greater heat generation at higher speeds, therefore the lubricant viscosity reduces, reducing the film thickness. The standard deviation is generally greatest for 1500 rpm engine speed, this may be occurring due to the engine having not achieved steady-state operation at this speed, or as 1500 rpm is the maximum speed of the engine this may have therefore caused excessive vibration.
The oil film appears to be very slightly thicker down the engine liner, seen clearest in the intake stroke. Sensor 1 typically gave MOFT values of 1 μm whilst for Sensor 6 it was 2 μm. The cylinder pressure will have been a significant contributing factor to this, with the compression ring exposed to greater pressures whilst it is aligned with a transducer further up the liner.
Speed effect for each stroke
A closer inspection of the MOFT for the compression ring over Sensors 4 and 6 is shown in Figure 12 to provide a comparison of the MOFT in each stroke at each engine speed.
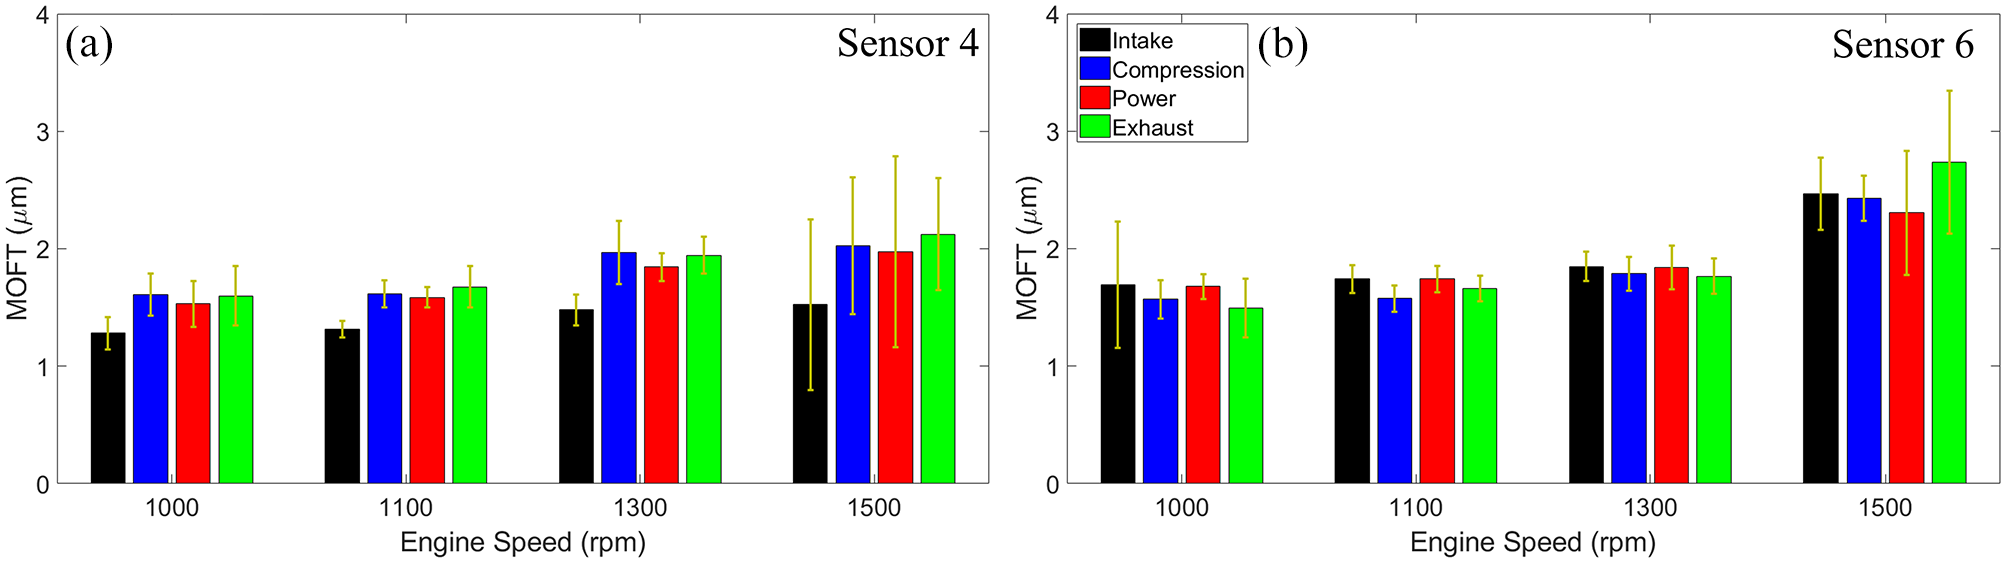
Measured MOFT for the Ring 1 (compression ring) in different engine strokes from an unloaded test case: (a) Sensor 4 and (b) Sensor 6.
Figure 12 shows the peculiar trend that Sensor 4 consistently led to a marginally thicker lubricant film during the compression and exhaust strokes whilst for Sensor 6, a marginally thicker OFT is generally present in the intake and power strokes. The compression ring experiences complex motion through each engine stroke and as the sixth sensor is significantly closer to the BDC than Sensor 4, this may have caused the opposing trends as the piston ring motion and thus OFT may have varied by the last sensor. In general, at mid-stroke an upward stroke is expected to produce a thicker film, as during an up-stroke the first ring is the first to pass the sensing region therefore they may be a bow wave of oil, or an excessive quantity of lubricant left on the liner. Alternatively, on a downward stroke, the compression ring is the final ring over this sensing area post the oil control ring that will have directed excess oil into the crankcase. These factors indicate the trend like those seen for Sensor 4, therefore the cause of these trends for Sensor 6 requires further study.
This stroke-wise view of the MOFT provides a clearer observation that a greater engine speed leads to a marginally thicker MOFT in each engine stroke and 1500 rpm consistently shows a greater cyclic variation in lubricant film thickness.
Effect of load on oil film thickness
The engine testing covered a range of engine loading levels at four engine speeds, the MOFT for the compression ring in each stroke at each loading level is shown in Figure 13 for Sensor 6.
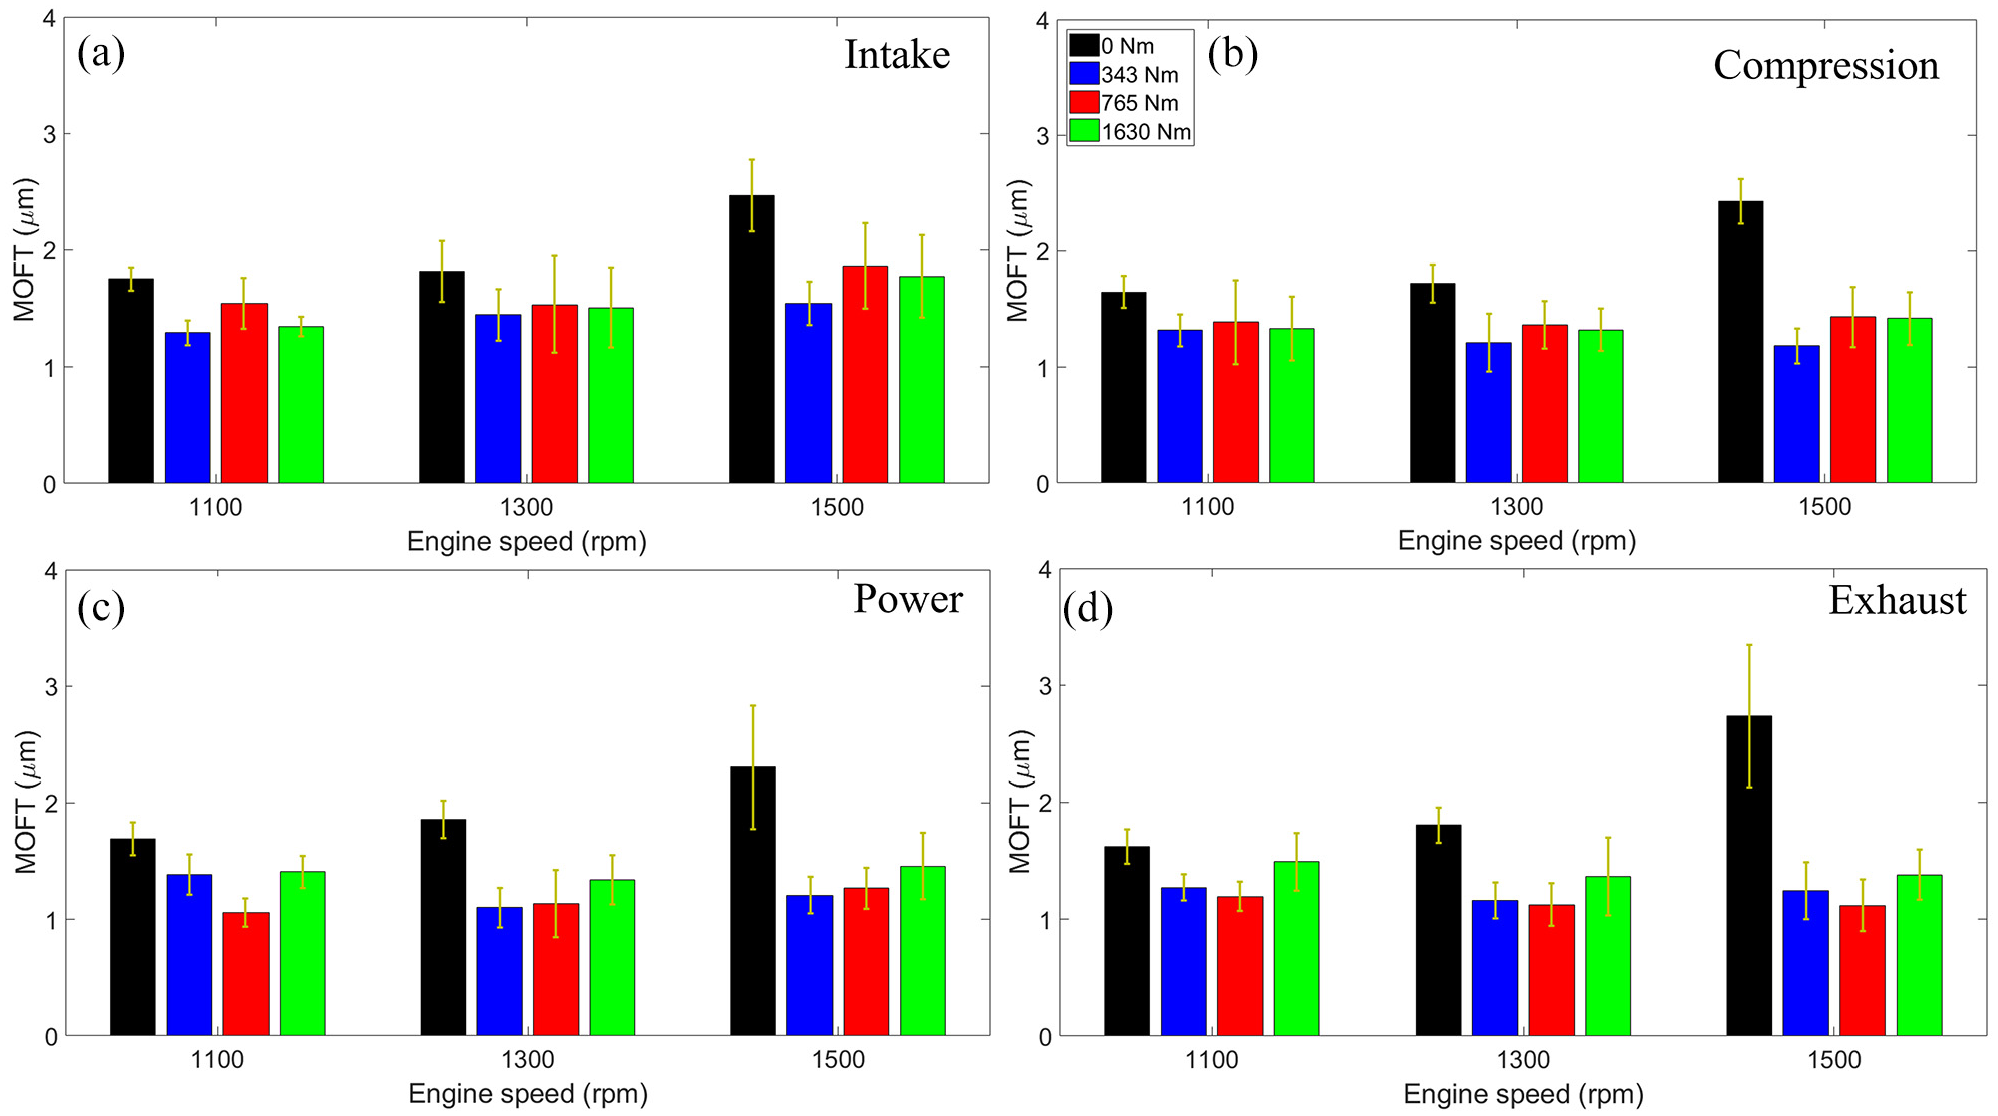
MOFT for the Ring 1 (compression ring) in each engine stroke at various engine loading levels over Sensor 6 (a) intake, (b) compression, (c) power and (d) exhaust.
The engine loading comparison in Figure 13 shows in each engine stroke zero loading led to a thicker lubricant film (1.75–3 μm), in some cases such as the exhaust stroke at 1500 rpm the MOFT was double the thickness at no loading compared to a loaded value. Whilst the trend of MOFT as loading continues to increase is less clear for the loaded test cases than the unloaded, with the general trend of full load (1630 Nm) typically having a greater MOFT than that from low load (343 Nm) although the increase is a fraction of a micron.
A contrast of the MOFT in each stroke at the four engine loading levels is shown in Figure 14 for two engine speeds, 1100 rpm and 1500 rpm.
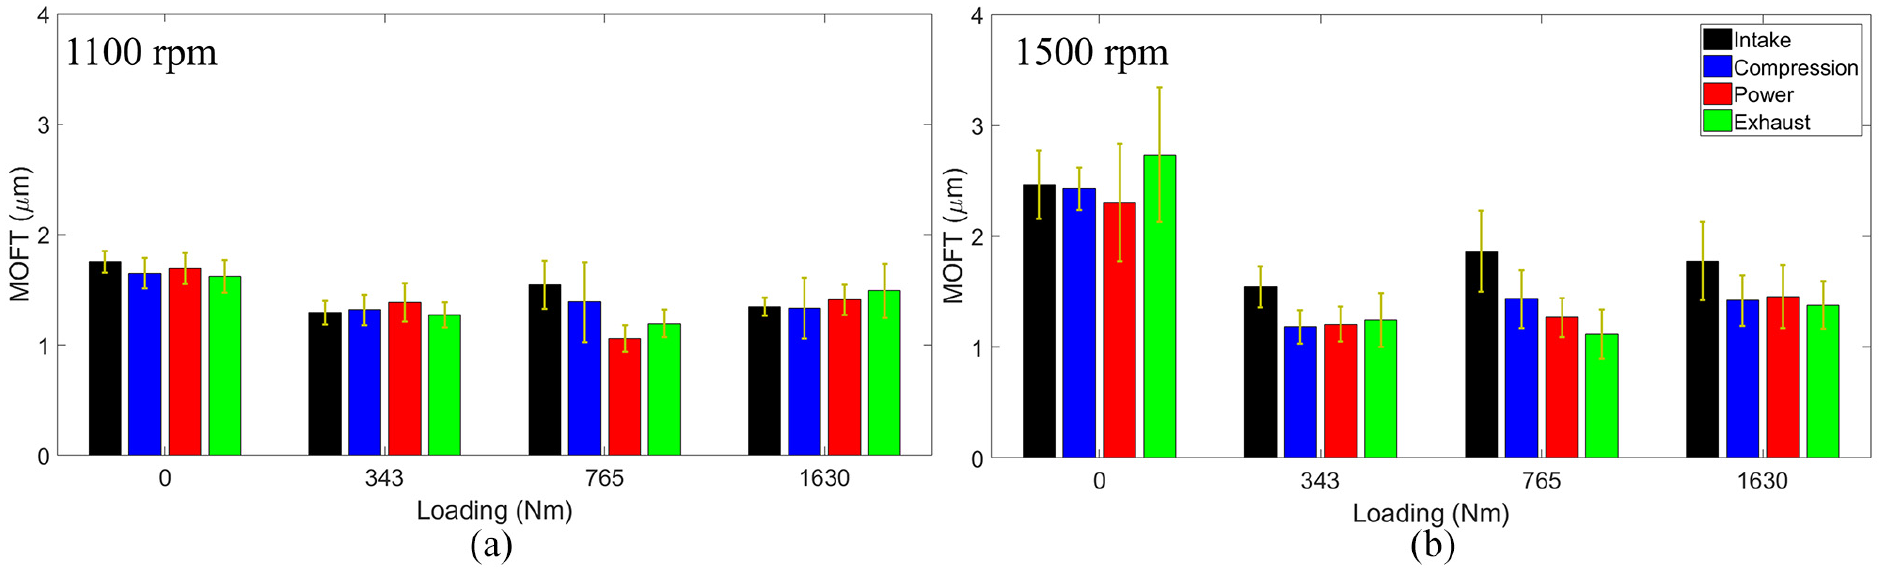
MOFT for Ring 1 (compression ring) in each engine stroke at various loading levels for Sensor 6: (a) 1100 rpm and(b) 1500 rpm.
It is clear again that the zero loading test cases produced a greater MOFT than at any loading level with the film thickness halving from an increase from 0 Nm to 343 Nm loading at 1500 rpm. Although further increasing of the engine loading has a marginal effect on the MOFT with a slight increase with greater loading. The unloaded MOFT in each stroke of Sensor 6, Figure 12 showed the down-stroke to have a marginally thicker film, this trend is not maintained with increased engine loading. For testing at 1100 rpm no discernible trend is definable between the loading levels, versus at 1500 rpm during the intake stroke a thicker film was produced with only minor differences between the other strokes.
Steady-state residual oil film thickness
The resonant dip calculation as shown in equation (2) can be applied to measure lubricant film thickness that is outside of the applicable range for the Spring Model. When the thickness of the lubricant matches the resonant frequency of the transducer, the lubricant layer resonates, which is visualised as an amplitude dip in the frequency domain. A spectrogram for the four strokes is shown in Figure 15 for a 343 Nm loading test case at 1100 rpm. The spectrogram has been limited to 0.9 < R < 1.1 for visualisation purposes, the black dashed boxes highlight the ring pack in each stroke. Whilst the red and yellow boxes emphasise the resonant bands when the skirt is above the sensor versus being aligned with the sensor, which are indicative of a residual oil film.
Loaded spectrogram of Sensor 6 from 1100 rpm at 343 Nm loading.
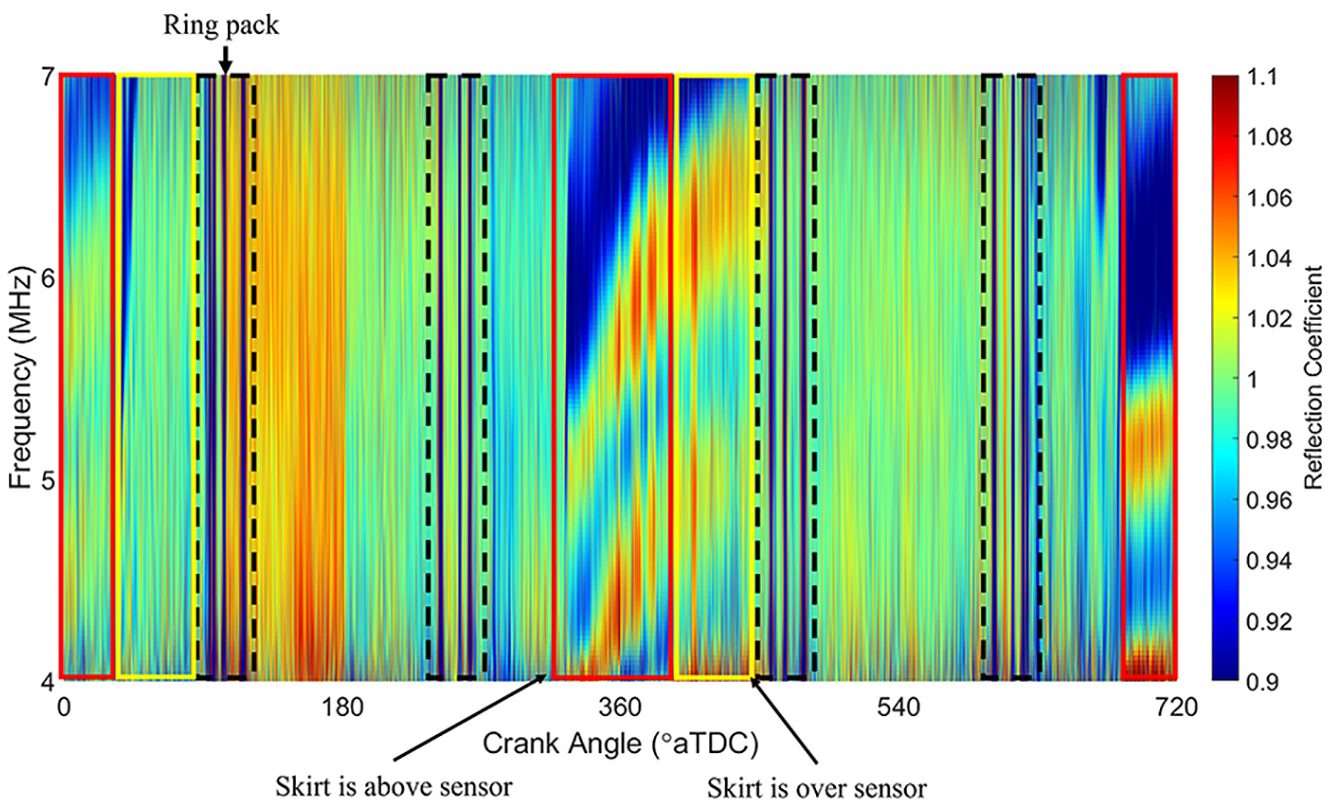
The spectrogram in Figure 15 shows a complex pattern over the 720° CA range, however, the ring pack is visible in each piston stroke via a series of drops in the reflection coefficient. There are also frequency varying resonant dips around the TDC of the piston (360°, 720° CA) whilst there is no equivalent at the BDC (180°, 540° CA). Furthermore, the resonant bands differ at each TDC, the combustion TDC shows a varying frequency band whilst the intake/exhaust TDC shows consistent bands over a shorter CA range. A closer inspection of the spectrogram from a ring pack and the pattern covering the combustion TDC from Figure 15 are highlighted in Figure 16.
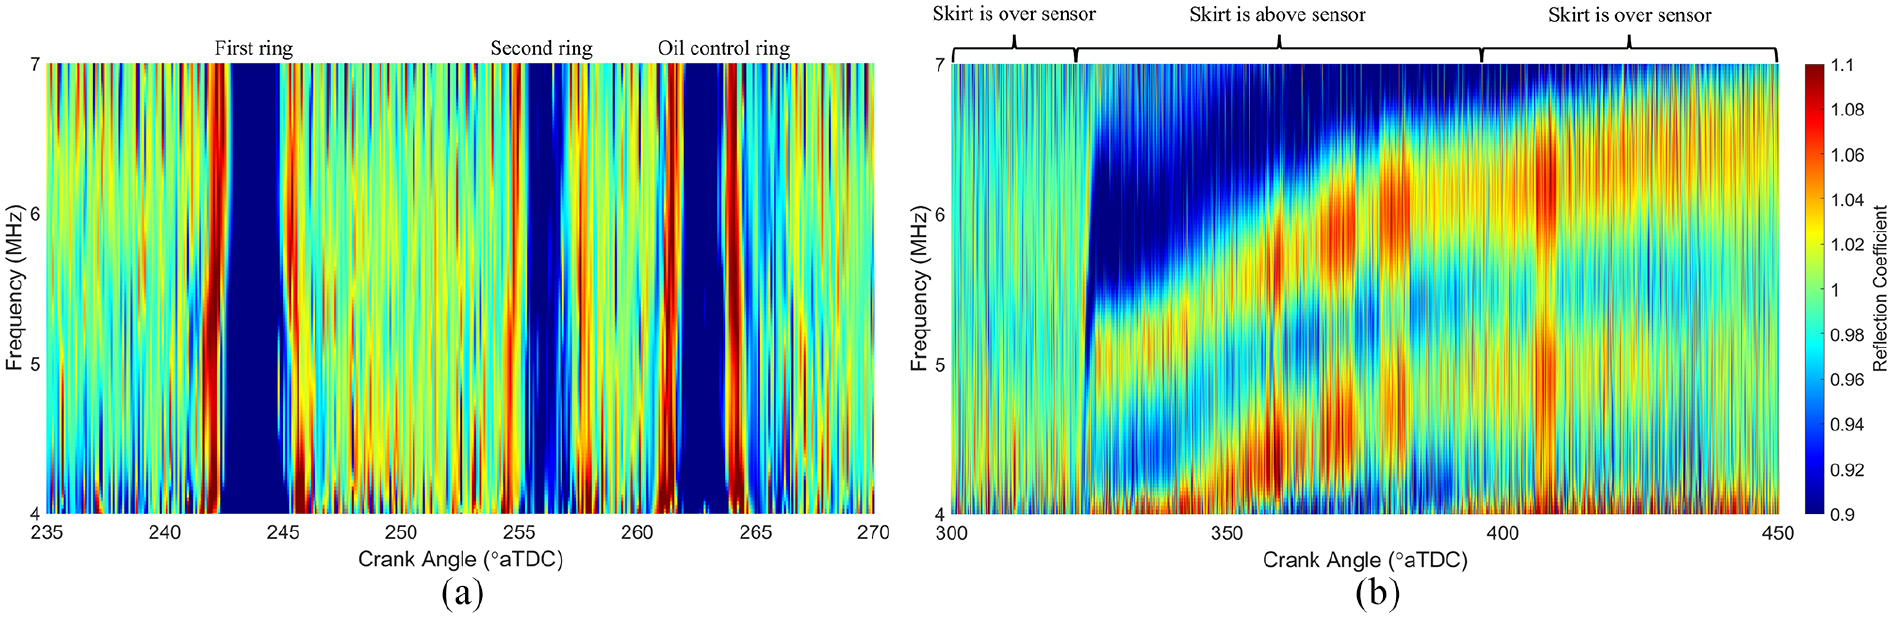
Loaded spectrograms from Sensor 6 at 1100 rpm and 343 Nm loading: (a) a ring pack and (b) time varying resonant frequency bands.
The frequency independence of the reflection coefficient over the sensor bandwidth is visible in Figure 16(a) by a consistent reduction over the frequency range. In addition, the minor fringe effects seen in Figure 8 is also present, indicated via the red band on either side of the ring. The first, second and upper rail of the control ring are visible while the lower rail is only present to a lesser extend (light blue) showing a smaller drop in reflection coefficient.
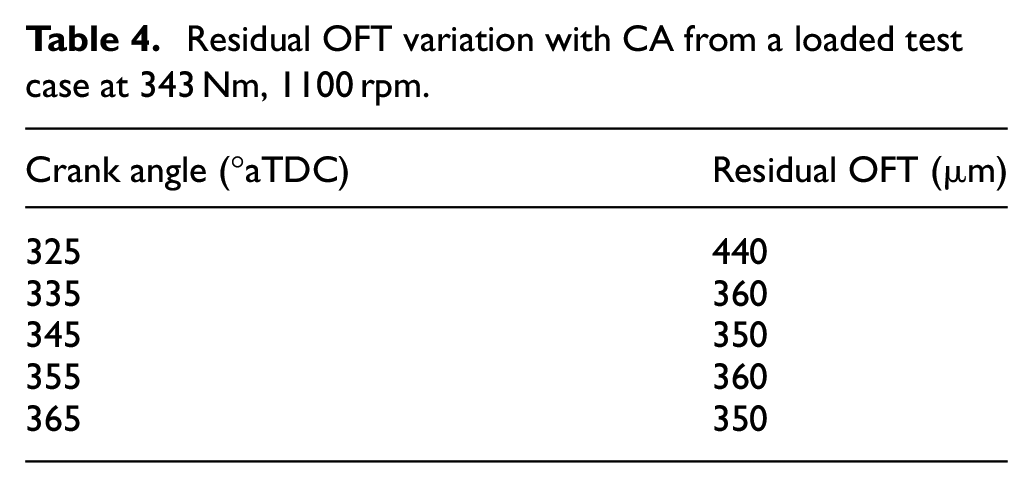
The resonant bands highlighted in Figure 16(b) shows that as the piston skirt was aligned with the sensor (up to 324° CA in Figure 16(b)) no bands are present and therefore no residual oil film was measurable by the resonant dip technique. Whilst at 324° CA, when the skirt moved above the sensor, exposing that portion of the liner to the oil spray in the crankcase frequency varying resonant bands are immediately shown, indicative of a residual oil film of varying thickness. The thickness of the residual oil film has been calculated using equation (2) and these film thicknesses are shown in Table 4 for a series of CA steps. This shows immediately following the skirt moving above the sensor a residual film of 440 μm was seen, which dissipated to 350 μm by the TDC of the piston. The residual film then remained present as the skirt moved back over the sensor on the downward stroke of the piston until the oil control ring moved over the sensor, directing excess oil from the liner down into the crankcase.
Residual OFT variation with CA from a loaded test case at 343 Nm, 1100 rpm.
Film thickness during start-up and shut-down
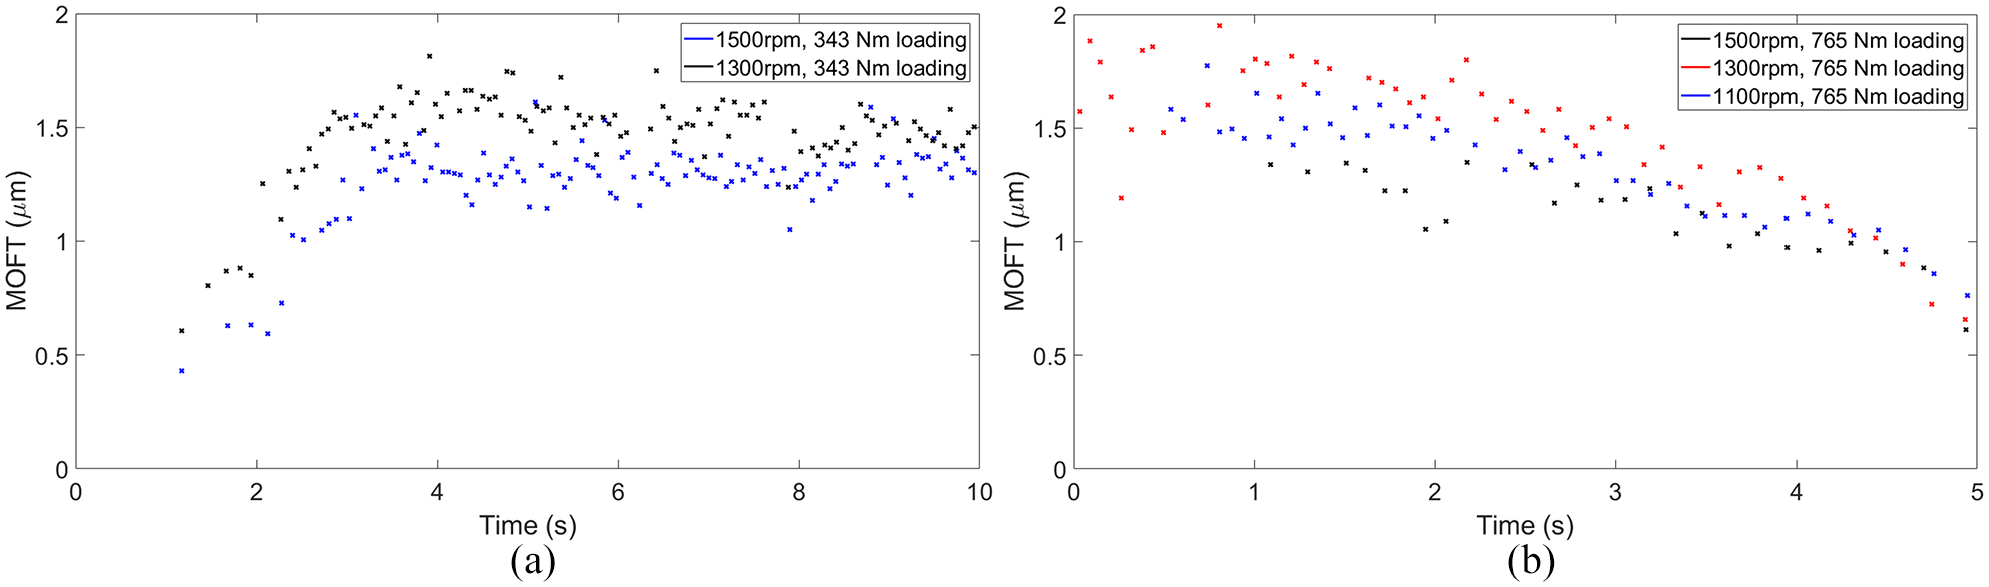
The engine was shut off between each set of steady-state testing, this enabled start-up and shut-down ultrasonic testing for each speed and load combination. The MOFT was extracted for the compression ring as covered in the previous sections. Figure 17 shows the MOFT during engine start-up (a) and shut-down (b) for the four different engine strokes with the addition of the engine rotational speed. Note, in the start-up tests the data recording began at time zero and therefore there may be a time delay before the first time a piston ring was recorded.
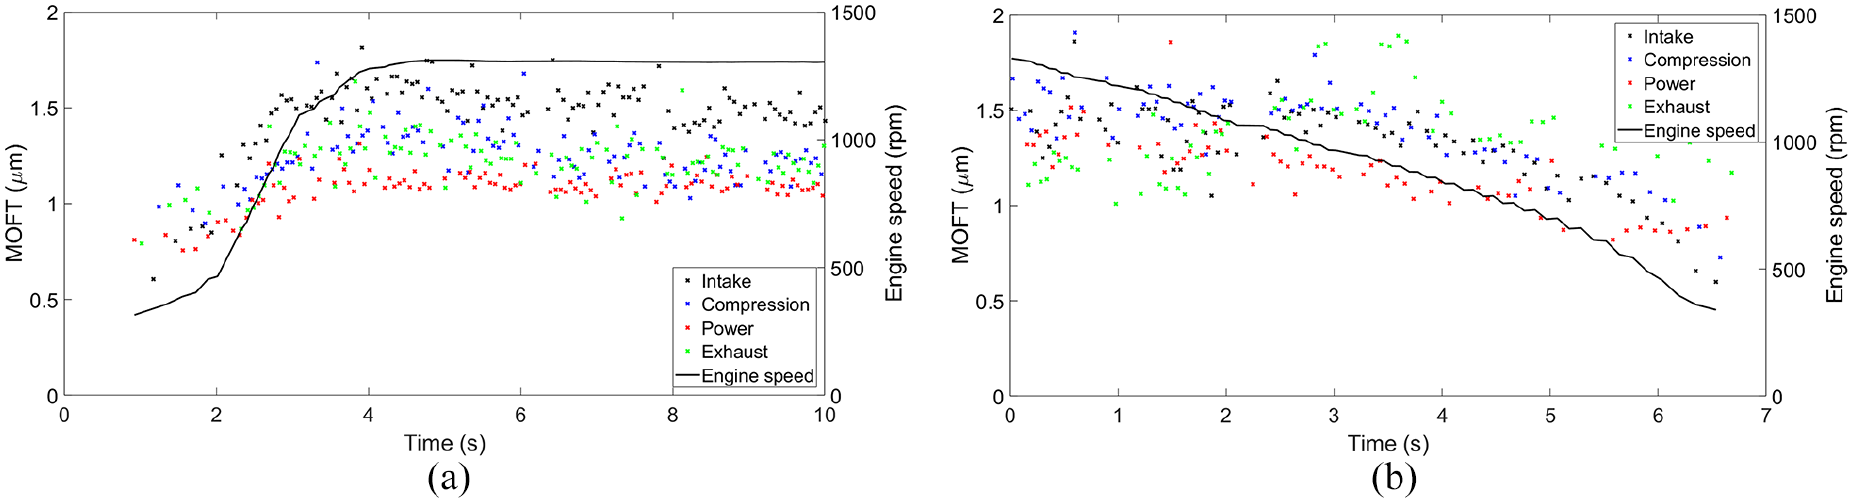
Engine (a) start-up and (b) shut-down, for Sensor 6 at 1300 rpm and (a) 343 Nm, (b) 765 Nm loading. The four engine strokes are identified in various colours.
The start-up test case in Figure 17 reveals that it took 2 s between the first detected ring passage and a consistent MOFT being achieved whilst a consistent engine speed was not achieved for a further 1.5 s. A steady build-up of the lubricant film thickness is shown over this period with the four strokes diverging, leading to the intake stroke having the thickest film whilst the thinnest is consistently seen in the power stroke which is similar to the steady-state MOFT for these conditions in Figure 13. The absolute MOFT recorded in either the start-up or shut-down was 0.6 μm. The liner used in the YTR engine had a manufactured internal surface roughness of 3 μm, it is therefore unlikely that a fully formed oil film was achieved in this stage.
The shut-down of the engine over this sensor produced a less consistent change in the MOFT in the four strokes. Even though each stroke, excluding the exhaust stroke, showed a reduction in the MOFT as the engine shut down. The variation in the MOFT is more pronounced in the start-up of the engine than shut-down, this may be due to only minor levels of oil remaining on the liner before engine start-up then once the oil pump is engaged a build-up of the MOFT is seen. Whilst for shut-down the oil pump is already engaged with a greater level of oil retained on the liner surface, therefore the MOFT is less sensitive to engine speed providing a certain threshold is maintained as the engine slows.
The MOFT for the compression ring during start-up and shut-down in the power stroke is shown in Figure 18 and the intake stroke in Figure 19 for a range of engine speeds over Sensor 6.
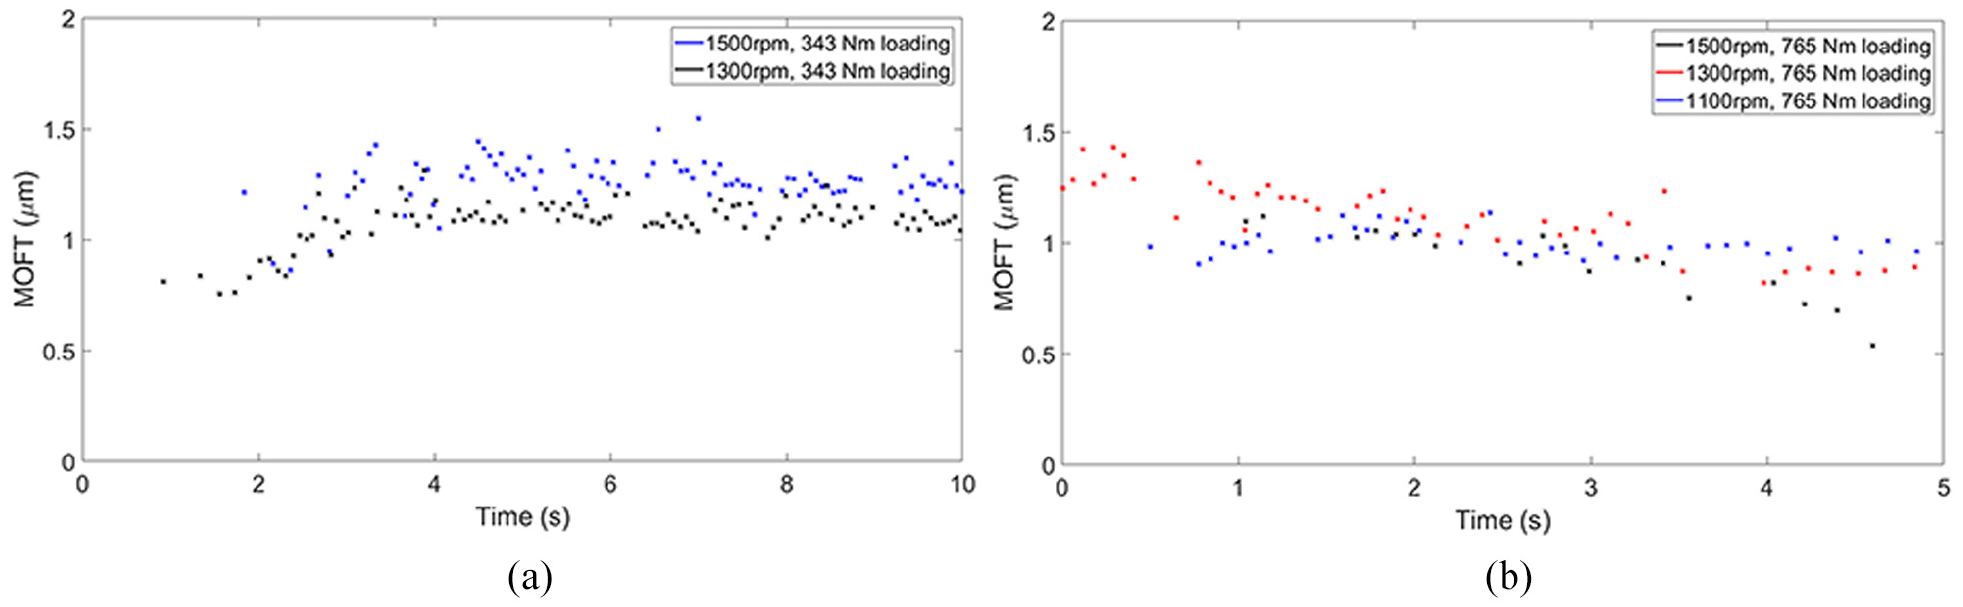
MOFT for the first compression ring at constant loading for a range of engine speeds during the power stroke: (a) start-up and (b) shut-down.
MOFT for the first compression ring at constant loading for a range of engine speeds during the intake stroke:(a) start-up and (b) shut-down.
The steady-state testing indicated that a greater MOFT was achieved at higher engine speeds in each engine stroke, which is consistent with the engine start-up in Figure 18, and somewhat consistent in the shut-down tests in Figures 18 and 19 excluding the shut-down from 1500 rpm. However, the opposing trend is observed in the start-up test for the intake stroke in Figure 19. Although these increases were all minor and the greatest variation was around 0.75 μm.
The variation in the MOFT is significantly clearer during the intake stroke than the power stroke for both start-up and shut-down with the absolute MOFT in the intake stroke being 0.5 μm ranging up to 2 μm versus 0.75 μm–1.5 μm in the power stroke. This leads to more defined trends being shown for the intake stroke with a clear build-up and reduction in the lubricant film thickness as the operation of the engine changes. This may be because the combustion pressure causes more ring conformity in the power stroke leading to a thinner film which the compression ring is exposed to for the whole operation of the engine whilst the ring has relatively more freedom in the intake stroke to vary with engine operation.
Conclusions
Ultrasonic reflectometry has been applied to a fired four-stroke diesel engine, this has been achieved by machining a small flat on the external surface of the liner to locate piezoelectric transducers. The sensors have quantified the lubricant film thickness at a range of steady-state engine speeds and loading levels as well as during start-up and shut-down testing. The results show relatively minor variations in steady-state MOFT values in the different testing conditions with the general trend of an increased engine speed leading to a greater MOFT and cyclic variation in the MOFT. The intake stroke was found to commonly produce the thickest film for both loaded and unloaded testing. Comparison of the MOFT at different loading levels has shown the MOFT to significantly reduce as the engine was first exposed to some loading although there were only minor changes in the MOFT upon further increase of the loading level. Spectrograms have been used to show the frequency independence of the piston ring measurement as well as the presence of resonant frequency bands indicative of a residual oil film on the liner. These frequency bands were first seen immediately following the piston skirt moving above the sensor and showed a residual oil film thickness of 440 μm which dissipated to 350 μm when the oil control ring next passed.
The ultrasonic testing has been capable of studying the MOFT whilst the engine turns on and shuts down showing the build-up and reduction of the lubricant film as the engine approaches/leaves steady-state operation. The results largely show similar trends to the steady-state operation with a greater engine speed typically producing a greater MOFT and the greatest MOFT was found in the intake stroke. A greater variation in the film thickness is observed for the start-up of the engine than shut-down, this is thought to be due to minor levels of oil being retained on the liner before starting the engine, leading to a build-up of the film thickness once the oil pump is engaged.
Footnotes
Acknowledgements
The authors would like to acknowledge the help and support of the College of Power and Energy Engineering at Harbin Engineering University and Peak to Peak Ltd for access to equipment, test facilities and researcher time.
Declaration of conflicting interests
The author(s) declared no potential conflicts of interest with respect to the research, authorship, and/or publication of this article.
Funding
The author(s) disclosed receipt of the following financial support for the research, authorship, and/or publication of this article: The authors would like to acknowledge the financial support of the following contributors: Engineering and Physical Sciences Research Council for part funding this research through Rob Dwyer-Joyce’s fellowship on Tribo-Acoustic Sensors (EP/N016483/1); Centre for Doctoral Training in Integrated Tribology (EP/L01629X/1).