
Abstract
Partial fuel stratification (PFS) is a low temperature combustion strategy that can alleviate high heat release rates of traditional low temperature combustion strategies by introducing compositional stratification in the combustion chamber using a split fuel injection strategy. In this study, a three-dimensional computational fluid dynamics (CFD) model with large eddy simulations and reduced detailed chemistry was used to model partial fuel stratification at three different stratified conditions. The double direct injection strategy injects 80% of the total fuel mass at −300 CAD aTDC and the remaining 20% of the fuel mass is injected at three different timings of −160, −50, −35 CAD to create low, medium, and high levels of compositional stratification, respectively. The PFS simulations were validated using experiments performed at Sandia National Laboratories on a single-cylinder research engine that operates on RD5-87, a research-grade E10 gasoline. The objective of this study is to compare the performance of three different reduced chemical kinetic mechanisms, namely SKM1, SKM2, and SKM3, at the three compositional stratification levels and identify the most suitable mechanism to reproduce the experimental data. Zero-dimensional chemical kinetic simulations were also performed to further understand differences in performance of the three reduced chemical kinetic mechanisms to explain variations in CFD derived heat release profiles. The modeling results indicate that SKM3 is the most suitable mechanism for partial fuel stratification modeling of research-grade gasoline. The results also show that the autoignition event progresses from the richer to the leaner compositional regions in the combustion chamber. Notably, the leaner regions that have less mass per unit volume, can contribute disproportionately more toward heat release as there are more cells at leaner equivalence ratio ranges. Overall, this study illuminates the underlying compositional stratification phenomena that control the heat release process in PFS combustion.
Keywords
Introduction
Engine researchers have been conducting research efforts on low temperature combustion (LTC) engines since the late ’70s. The potential to achieve higher engine thermal efficiencies while maintaining ultra-low
Homogeneous Charge Compression Ignition (HCCI) is one of the low temperature combustion concepts that can overcome the shortcomings of conventional SI and CI engines with respect to throttling losses and engine-out emissions, respectively.1–3 HCCI uses a homogeneous mixture achieved by either port fuel injection or early direct injection (DI), 4 leading to a flameless sequential autoignition process as has been shown by optical diagnostics studies.5–7
While HCCI can reduce both
A number of different combustion strategies have been proposed to increase the control and consequently the operating range of HCCI combustion, thus potentially making it more commercially viable. Initial studies showed that using Negative Valve Overlap (NVO) to dilute the mixture along with Exhaust Gas Recirculation (EGR) assisted in controlling the heat release rate.8–13 Subsequently, variable compression ratio,14–17 spark-ignition assistance,18–21 and intake boosting22–27 have also been investigated to alleviate the excessive heat release rates and thus can increase the load range of HCCI.
Researchers have also investigated the effects of thermal stratification on HCCI combustion to extend the load limit of HCCI engines. 28 Thermal stratification in the combustion chamber results in cascading auto ignition events, where the hottest zones in the cylinder ignite first and subsequently colder zones follow, which leads to staggered heat release. It should be noted that, in a real engine, naturally occurring thermal stratification develops due to wall heat transfer and turbulent convection. Therefore, despite the fact that this phenomenon has been used in multiple numerical and experimental studies to smoothen the high heat release rate, it is intrinsic to the engine and hard to control.
In theory, it should be possible to significantly extend the load limit by increasing the thermal stratification. For instance, Sjöberg et al. 29 showed that increasing the thermal stratification leads to reduced pressure rise rates and increasing the thermal width by 10 K at bottom dead center (BDC) piston position can successfully stagger the combustion enough so that the equivalence ratio limit can be extended from 0.44 to 0.60. Some experimental techniques were proposed to practically control the in-cylinder thermal stratification in a real engine. For example, Sjöberg and Dec 30 have investigated direct injection of ethanol around −80 crank angle degrees (CAD) after top dead center (aTDC) to introduce thermal stratification in the cylinder. The study used 60%–70% of premixed charge and 30%–40% of the fuel as direct injection. The results showed high rates of evaporative cooling compared to gasoline and lower heat release rate compared to homogeneous fuel/air mixture, thereby staggering the auto ignition. However, controlling thermal stratification using practical methods and without increasing heat losses has proven difficult.
Many researchers have studied other LTC approaches that introduce compositional stratification in the combustion chamber to control the heat release rate in HCCI by sequential auto ignition as thermal stratification is very difficult to control. Compositional stratification is attained by direct fuel injection which helps in controlling combustion. Dempsey et al. 31 have classified different LTC modes on the basis of stratification achieved in the combustion chamber. Some of the popular LTC strategies are Premixed Charge Compression Ignition (PCCI),32–37 Reactivity Controlled Compression Ignition (RCCI),38–41 Gasoline Direct Injection Compression Ignition (or GDCI),42,43 Gasoline Compression Ignition (GCI)44,45 and Partial Fuel Stratification (PFS).
In PCCI, high reactivity fuel (e.g. diesel) is injected early during the compression stroke and the combustion phasing is controlled by changing the injection parameters. Kook and Bae
37
have showed that PCCI shows reduction in nitrogen oxides (
Partial Fuel Stratification was proposed by Sjöberg and Dec
46
as another LTC strategy to control the heat release rate. PFS utilizes a split injection strategy to create compositional stratification in the combustion chamber.47–50 Sjöberg and Dec
46
showed that PFS can be used to increase the load range by using fuels that are sensitive to the local equivalence ratio and this behavior was named as
A significant number of numerical studies done on HCCI engines show the importance of using suitable reduced chemical kinetic mechanisms to accurately predict the combustion. It has been shown that accurate results using multi-zone modeling methodology can be obtained for long chain hydrocarbons using reduced chemical kinetic mechanisms.51,52 Fiveland and Assanis 53 developed a model for HCCI engines under turbocharged conditions. Their study coupled chemical kinetics with sub models for physical processes in the HCCI engine. The model predicted peak pressure and burn duration within the standard deviation values. However, predictions for the CO emissions were under predicted. The authors recommended more complex computational fluid dynamics (CFD) modeling scheme coupled with a more robust chemical kinetic mechanism to accurately predict emissions. Kong and Reitz 54 modeled combustion in a HCCI engine by coupling CHEMKIN with KIVA. Their model predicted ignition delay accurately for a range of operating conditions. Jia and Xie 55 compared different chemical kinetic mechanisms for iso-octane and showed that the ignition delay is significantly affected by local pressure, temperature, and equivalence ratio. The authors also proposed a new skeletal iso-octane mechanism that was validated for HCCI applications.
In spite of all the encouraging experimental studies, there have been very few studies that investigate the fundamental processes that control ignition in PFS. Particularly, previous work performed by Priyadarshini et al.
56
numerically investigated low levels of charge-mixture stratification from an early second injection. This study extends upon this previous work by using a 3D CFD model with detailed chemistry employing Large Eddy Simulations (LES) to study PFS under low, moderate, and highly stratified operating conditions. The study uses research grade gasoline coupled with moderate boosting to investigate the performance of three different skeletal chemical kinetic mechanisms, namely SKM1, SKM2, and SKM3 and their respective surrogate fuels. The objective of this study is to investigate the performance, limitations, and suitability, of the three chemical kinetic mechanisms considered for PFS modeling at different levels of
Experimental setup and model development
Experiments
The current study is based on the experimental data gathered at Sandia National Laboratories (SNL). The engine used to collect the experimental data
57
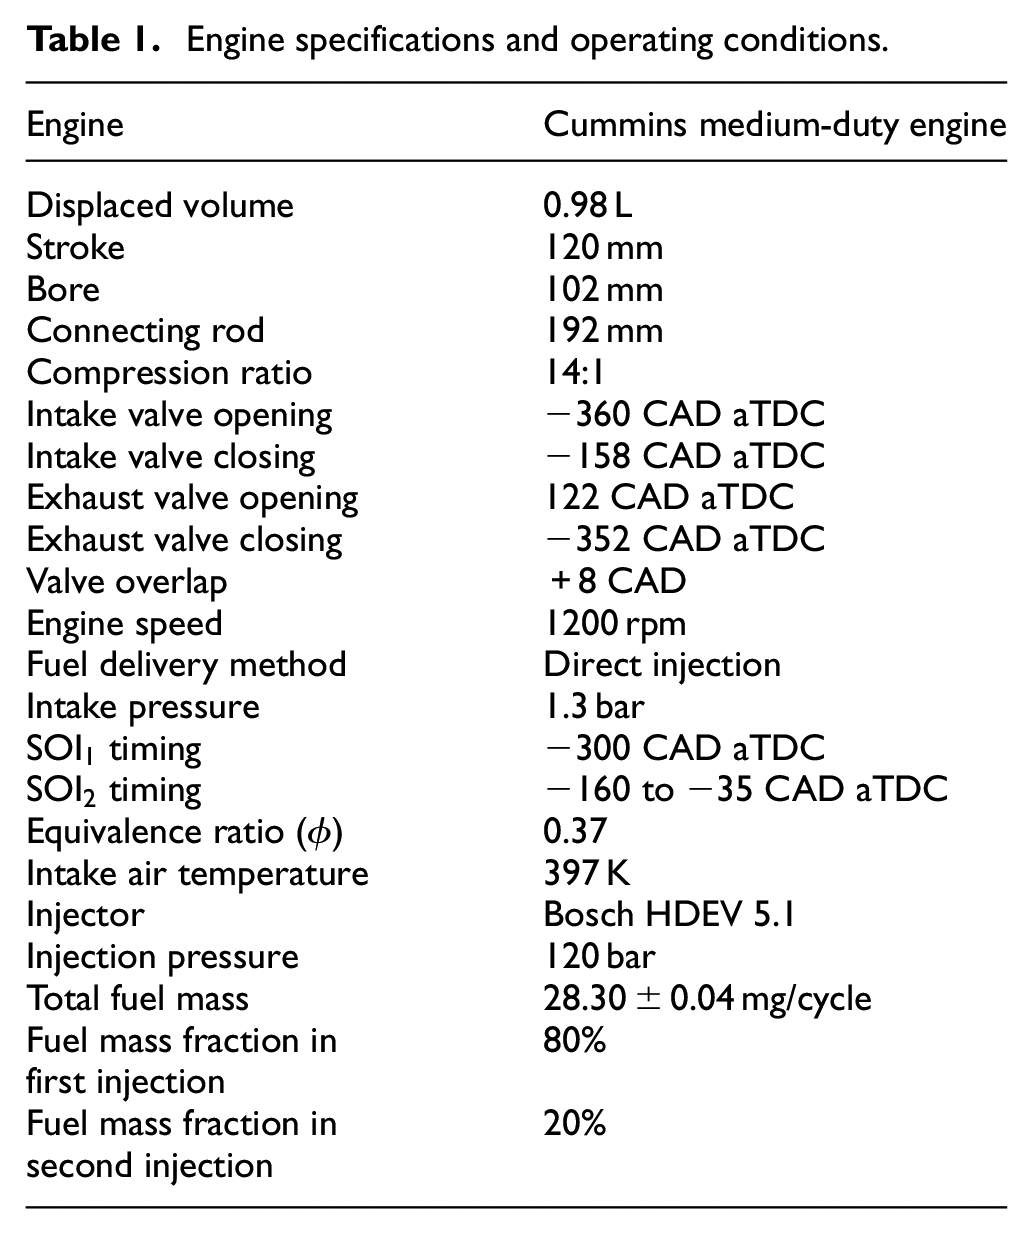
is a Cummins B-series six (6) cylinder medium-duty engine in which five cylinders have been deactivated to effectively create a single-cylinder combustion engine. The fuel used in the experiments is a research-grade regular E10 gasoline named RD5-87 that has been used for recent research in industry, academia, and at national laboratories.58,59 The intake pressure was 1.3 bar, and the engine speed was 1200 rpm. The engine had eight (8) CAD of positive valve overlap, which minimized the residual gas trapping. The experiments also used an 80−20 split injection strategy where two fuel injections were performed every engine cycle. The first injection starts at −300 CAD aTDC during the intake stroke and 80% of the fuel mass was injected. The rest of the 20% fuel mass is injected during the second injection (
Engine specifications and operating conditions.
CFD model
The 3D CFD model used in the current study is shown in Figure 1. The model is built using Converge CFD v 2.4 62 and consists of three regions: the intake ports, the exhaust ports, and the combustion chamber. Each region was initialized separately based on experimental data. An orthogonal cut cell grid 63 with fixed embedding was used in the model to create a mesh of 0.7 mm in the combustion chamber and around the valves, and 0.175 mm around the fuel injector as shown in Figure 2. The engine has been used in the previous CFD study as well. 56 The cylinder wall temperature was estimated by extrapolating the fire deck temperatures. 64 The liquid properties database available in Converge v2.4 was used to describe the physical properties of gasoline surrogates used in the study. The turbulence is resolved by using a LES framework to better capture unsteady flow behavior. In the current study, the Dynamic Structure turbulence model 65 using Favre filtering was used.
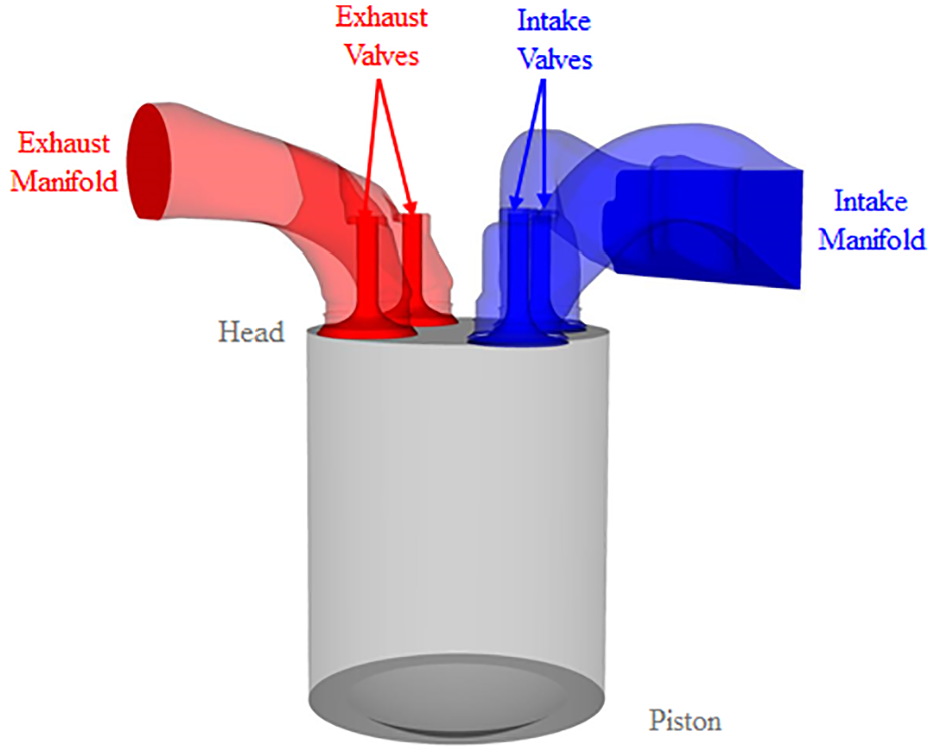
CFD model of the medium-duty Cummins B-series engine showing regions; combustion chamber (gray), intake ports (blue), and exhaust ports (red).
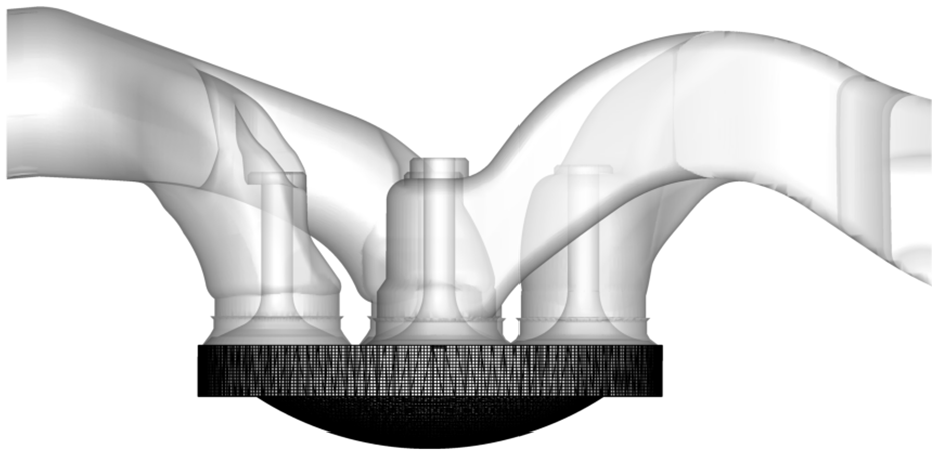
Computational domain of the 3D CFD model of the medium-duty Cummins B-series engine at −20 CAD aTDC.
Spray sub models were used to capture several phenomena from the start of fuel injection to fuel vaporization. The spray breakup was captured using the Kelvin–Helmholtz and Rayleigh–Taylor (KH-RT) hybrid model66,67 which takes into account the Kelvin-Helmholtz (KH) and the Rayleigh-Taylor (RT) instability models. The droplet evaporation is modeled using the Frossling evaporation model. 68 No Time Counter (NTC) Collision model is used to model the droplet collision as the computational cost of NTC collision model 69 increases linearly as the number of parcels increases, thereby allowing the use of higher number of parcels. The droplet drag coefficient was modeled using the Taylor Analogy Break-Up (TAB) model. 70 For simulating the interaction between the spray droplets and the walls, O’Rourke and Amsden 71 wall film model was used.
The combustion was modeled using the SAGE detailed chemical kinetic solver 72 coupled with multi-zone model by Babajimopoulos et al. 73 The wall heat transfer was modeled using the law of the wall model by Amsden and Findley 74 and the wall shear stress was calculated using Werner and Wengle law of the wall model. 75
Chemical kinetic mechanisms
Three different skeletal chemical kinetic mechanisms, termed SKM1, SKM2, and SKM3 were used in this work.56,76 These mechanisms were generated by reducing a 2878-species detailed mechanism for gasoline surrogates recently developed by Lawrence Livermore National Laboratory (LLNL). 77 The reduction was performed based on a large set of extinction residence times and ignition delays of a 7-species surrogate fuel for RD5-87 proposed by Lopez-Pintor et al., 78 termed SV0 in this study and the composition of which is shown in Table 2. Extinction residence times were obtained in a perfectly stirred reactor (PSR) for a pressure variation from 1 to 50 bar, an equivalence ratio variation from 0.3 to 1.5, and an inlet temperature equal to 300 K. Ignition delays were obtained in a closed, homogeneous, constant-volume reactor for a pressure variation from 1 to 50 bar, an equivalence ratio variation from 0.3 to 1.5, and a temperature variation from 600 to 1600 K. Directed Relation Graph (DRG) was first applied to reduce the detailed mechanism with high efficiency, leading to an intermediate mechanism that was further reduced by applying DRG Aided Sensitivity Analysis (DRGASA). It should be noted that the LLNL detailed mechanism used in this investigation includes the chemistry of more than 50 single-component fuels, and most of them are not involved in the formulation of the surrogate fuels. For instance, the LLNL detailed mechanism includes sub-mechanisms for heavy aromatics (such as 1, 3, 5 trimethylbenzene or p-xylene), branched olefins (such as di-isobutylene), alcohols (such as tert-butanol or n-pentanol) or furans (such as 2-methyl furan), the chemistry of which is not relevant for the surrogates and that it is easily eliminated by the DRG method. Only the chemistry of the hydrocarbons involved in the formulation of the surrogates was included in the reduced mechanisms, allowing for a more effective reduction. An in-house routine was applied to ensure the consistency of the mechanisms. This procedure resulted in SKM1 and SKM2 which have 152 species and 563 reactions as well as SKM3 which has 164 species and 582 reactions.
Formulation of the surrogates in % mole.
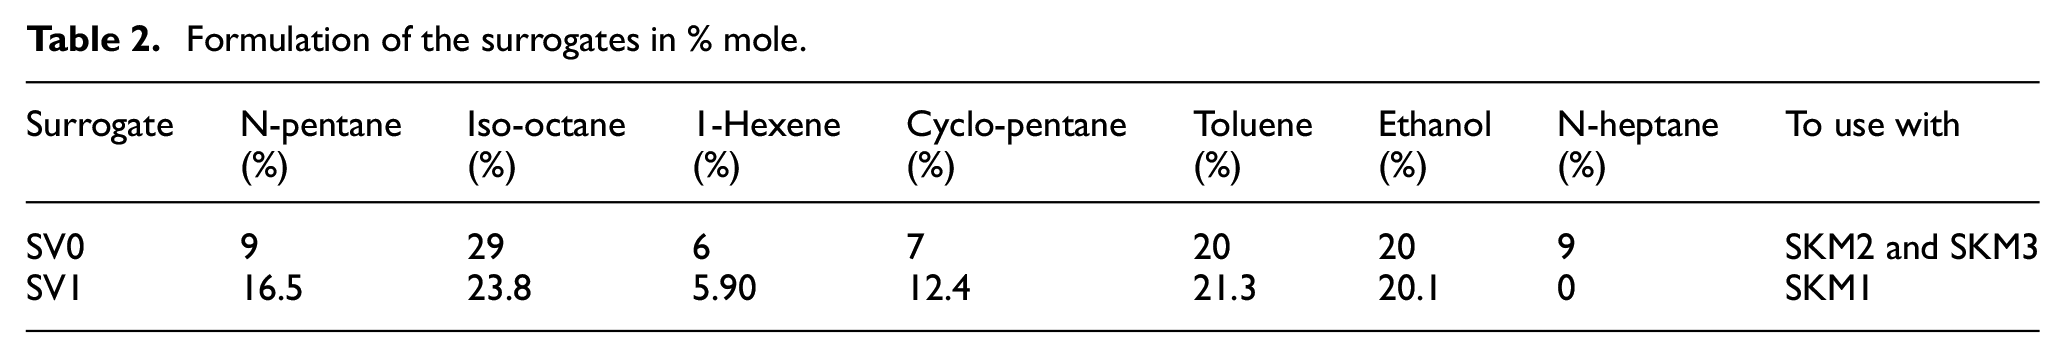
Optimization was applied to the skeletal mechanism to improve the prediction of ignition delays, and different optimization strategies led to the different skeletal mechanisms used in this study (SKM1, SKM2, and SKM3). SKM1 resulted from optimization using a simpler surrogate fuel, termed SV1 and the composition of which is shown in Table 2. Note that the 7-species SV0 surrogate has n-heptane whereas the 6-species SV1 surrogate does not. Thus, the combination of SKM1 and SV1 makes the description of the chemistry simpler, allowing a lower computational cost. SKM2 resulted from optimization using SV0. Finally, SKM3 resulted from optimization using SV0 and assigning a higher weighting factor to the ignition delay data of equivalence ratios higher than
Results and discussion
Compositional stratification analysis
The CFD model was used to reproduce experimental data from Sandia from Gentz et al.
60
The experiments were taken using a split injection strategy where the first injection (
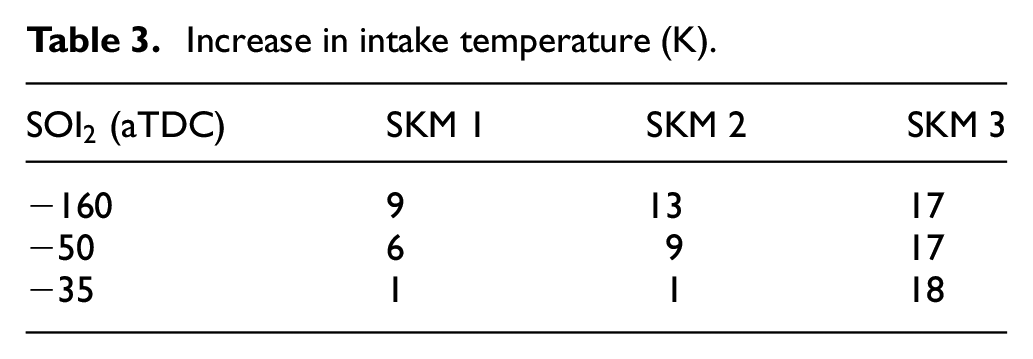
The intake temperature was adjusted in the simulations to replicate the experimental CA50. The increase in intake temperature for each case is shown in Table 3. This methodology allows to compensate for uncertainties in the heat transfer during the intake stroke, in some boundary conditions (such as the wall temperatures), and in the accuracy of the chemical models. The intake valve closing (IVC) temperature deviation between the experiments and the simulations was considered a metric for the accuracy of the simulations. Note that the IVC temperature is more representative of the compressed-gas temperature than the intake temperature, especially considering the uncertainties during the intake stroke. Note also that the CFD model was previously validated against experiments under motoring conditions, and the effective compression ratio of the CFD model was adjusted to account for uncertainties in heat losses of the closed cycle, blow by losses and deformations. 56 Therefore, the IVC temperature deviation should not be affected by these uncertainties. Despite the fact that the spray and mixing models were also validated against experimental data, 56 the uncertainty in the fuel distribution might be somehow masked by the IVC temperature deviation. Nevertheless, considering the limitations of both CFD models and experimental methods, simulations with low IVC temperature deviation will be considered accurate independently of the intake temperature deviation, since matching the experimental IVC temperature indicates that the simulations properly replicate the compressed-gas reactivity of the experiments. Values of the IVC temperature deviation will be reported and discussed in the following section.
Increase in intake temperature (K).
The operating conditions were chosen to provide significant range of equivalence ratio stratification in the combustion chamber. Figure 3 shows the Cumulative Distribution Function (CDF) of mass in the combustion chamber plotted with equivalence ratio for the second injection timings of −160, −50, and −35 CAD aTDC at TDC. The dotted black line shows the global equivalence ratio of the mixture mass which is 0.37. The plot shows the range of equivalence ratio stratification that can be achieved in PFS combustion by changing the timing of second injection. For
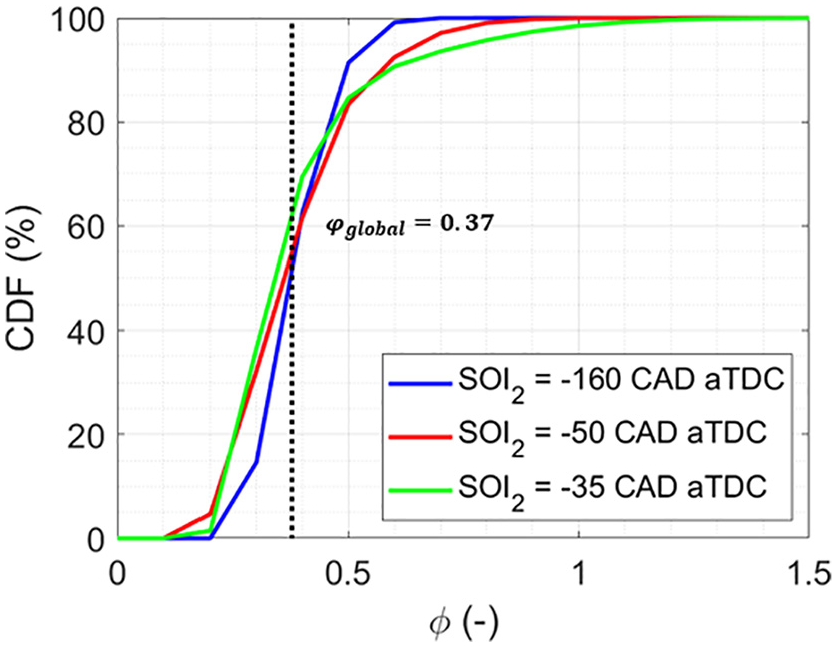
Ensemble averaged CDF of mass as a function of the local equivalence ratio (
Finally, it should be noted that the CFD model used in this investigation has been already validated by Priyadarshini et al. 56 for low and moderate levels of stratification and using SKM1. The current paper extends the work of Priyadarshini et al. 56 by evaluating two additional mechanisms and by extending the test matrix to include highly stratified conditions. Details on the validation of the CFD model can be found in Priyadarshini et al. 56
Evaluation of SKM1, SKM2, and SKM3
A comparison of different combustion metrics between the experiments and the model is shown in Figure 4. Results are shown for low (top), moderate (middle), and high (bottom) levels of stratification. The CA10, CA50, CA90, CA10–50 duration, CA10–90 duration, peak pressure, peak heat release, and IVC temperature are plotted for the experiments (red) and for simulations (blue) with SKM1, SKM2, and SKM3. The experimental values are the average of 100 consecutive cycles and the error bars represent the standard deviation of the experiments where the total height of the error bars is two sigma. The numerical values are the ensemble average of five (5) consecutive runs of the CFD model.
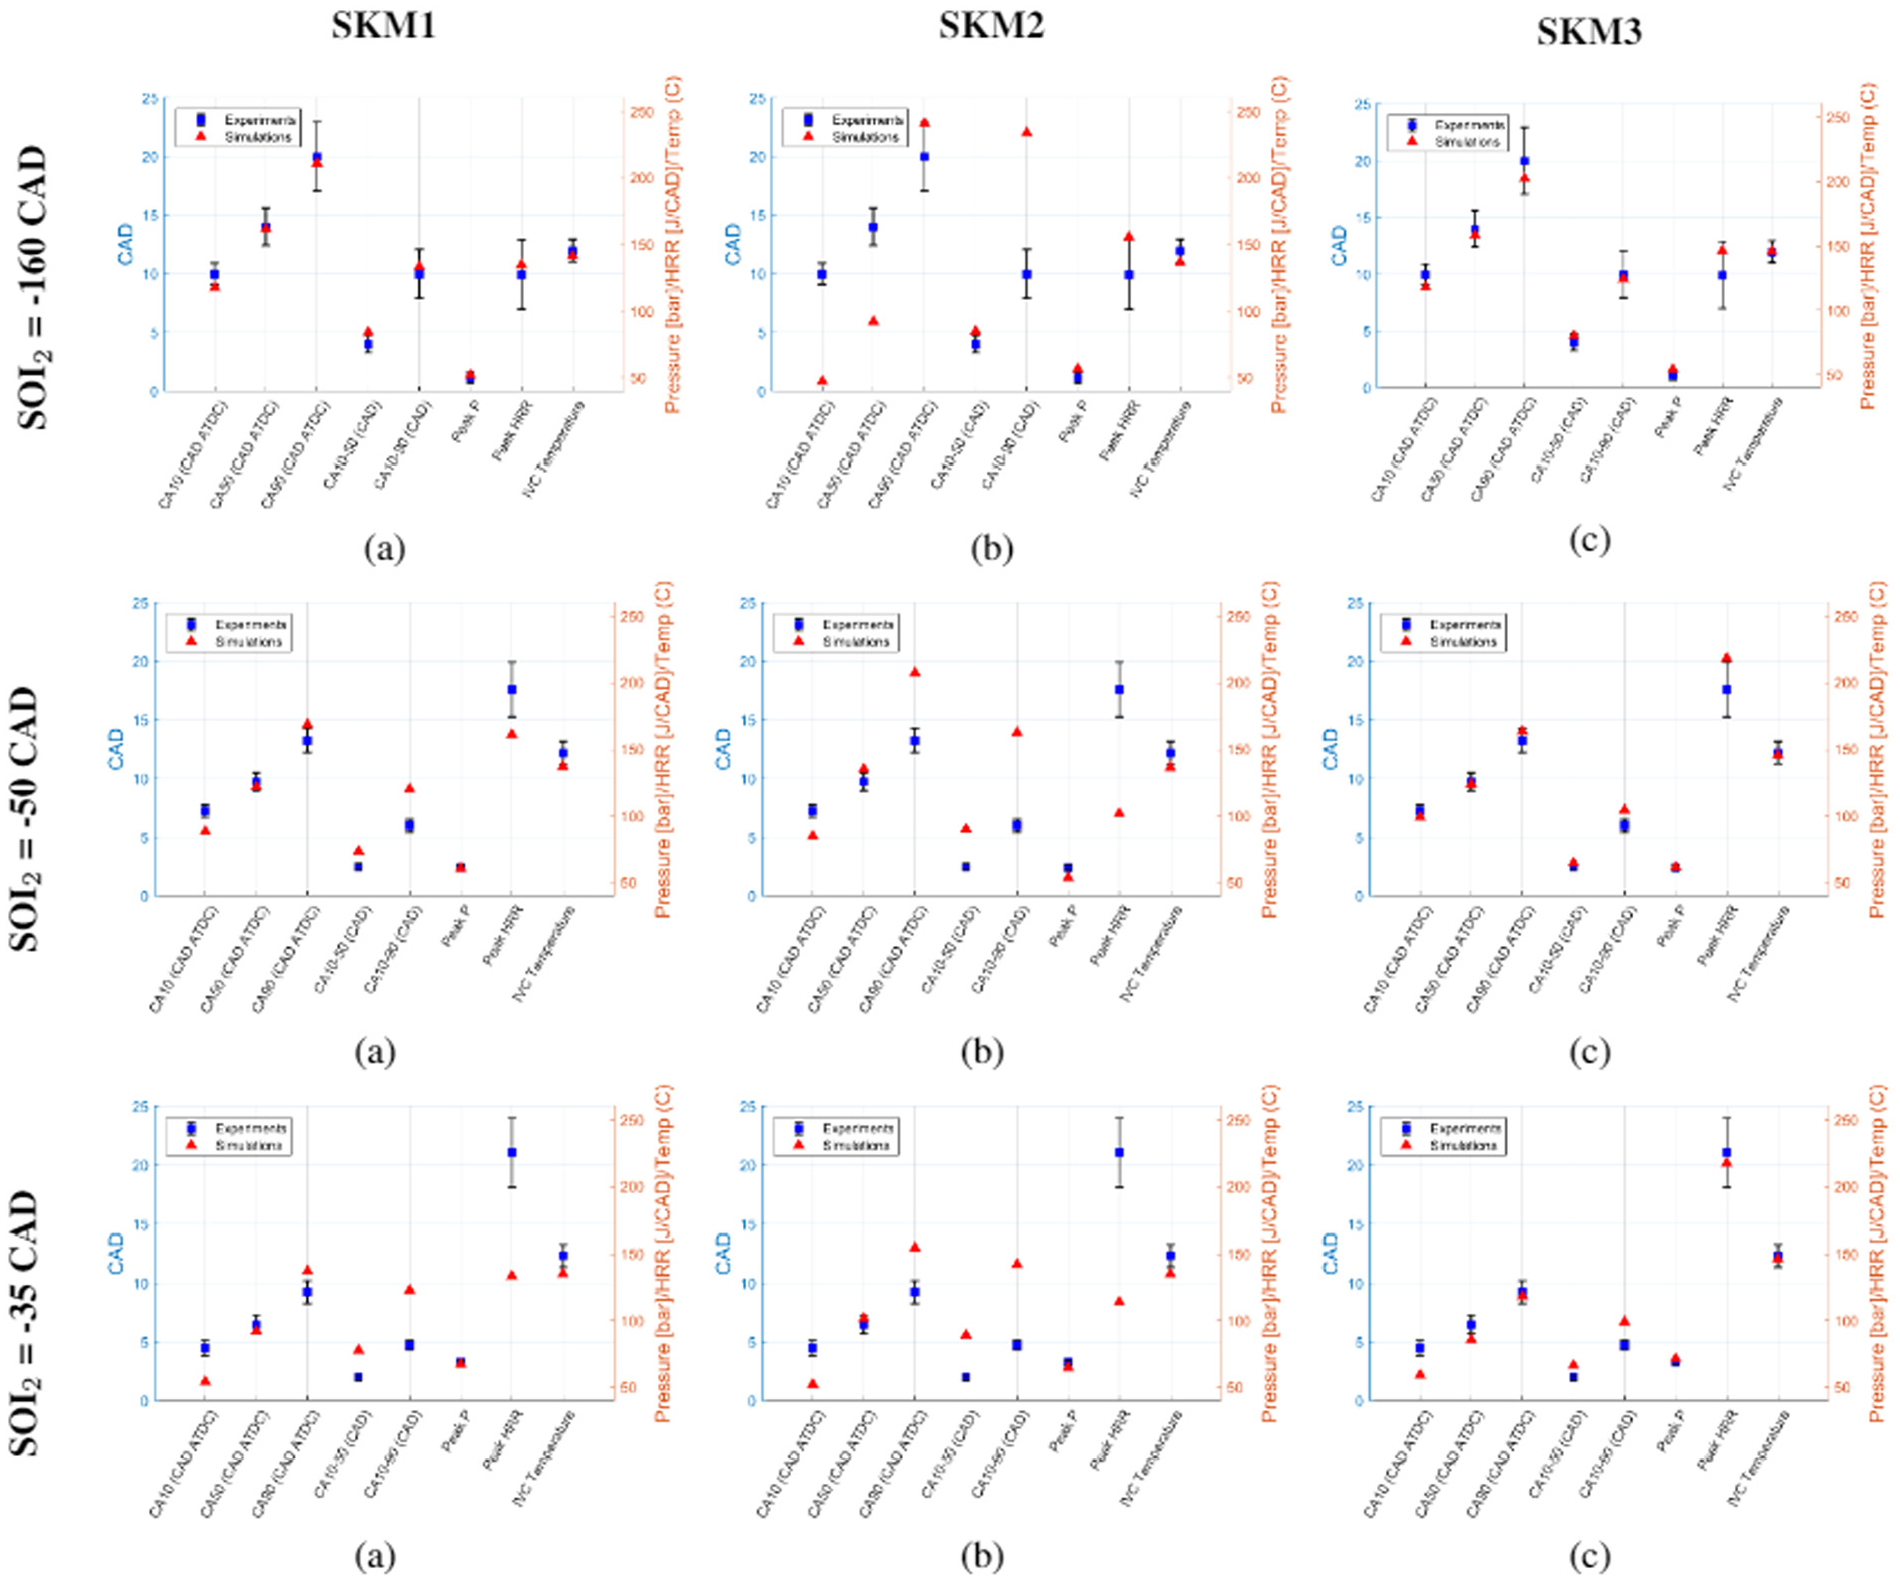
Combustion metrics for experiments (blue) and simulations (red). Top: low stratified conditions (
The top row of Figure 4 shows the results for low stratification (
The middle row of Figure 4 shows the results for moderate stratification (
The bottom row of Figure 4 shows the results for high stratification (
Figures 5 to 7 show the in-cylinder pressure and heat release rates (HRR) for simulations with SKM1, SKM2, and SKM3, respectively. Results for the three levels of stratification (low, moderate, and high) are plotted. For intelligibility, the first twenty (20) consecutive experimental cycles (gray) are plotted out of the set of hundred (100) cycles along with the five (5) consecutive LES cycles (colored) in the figures.
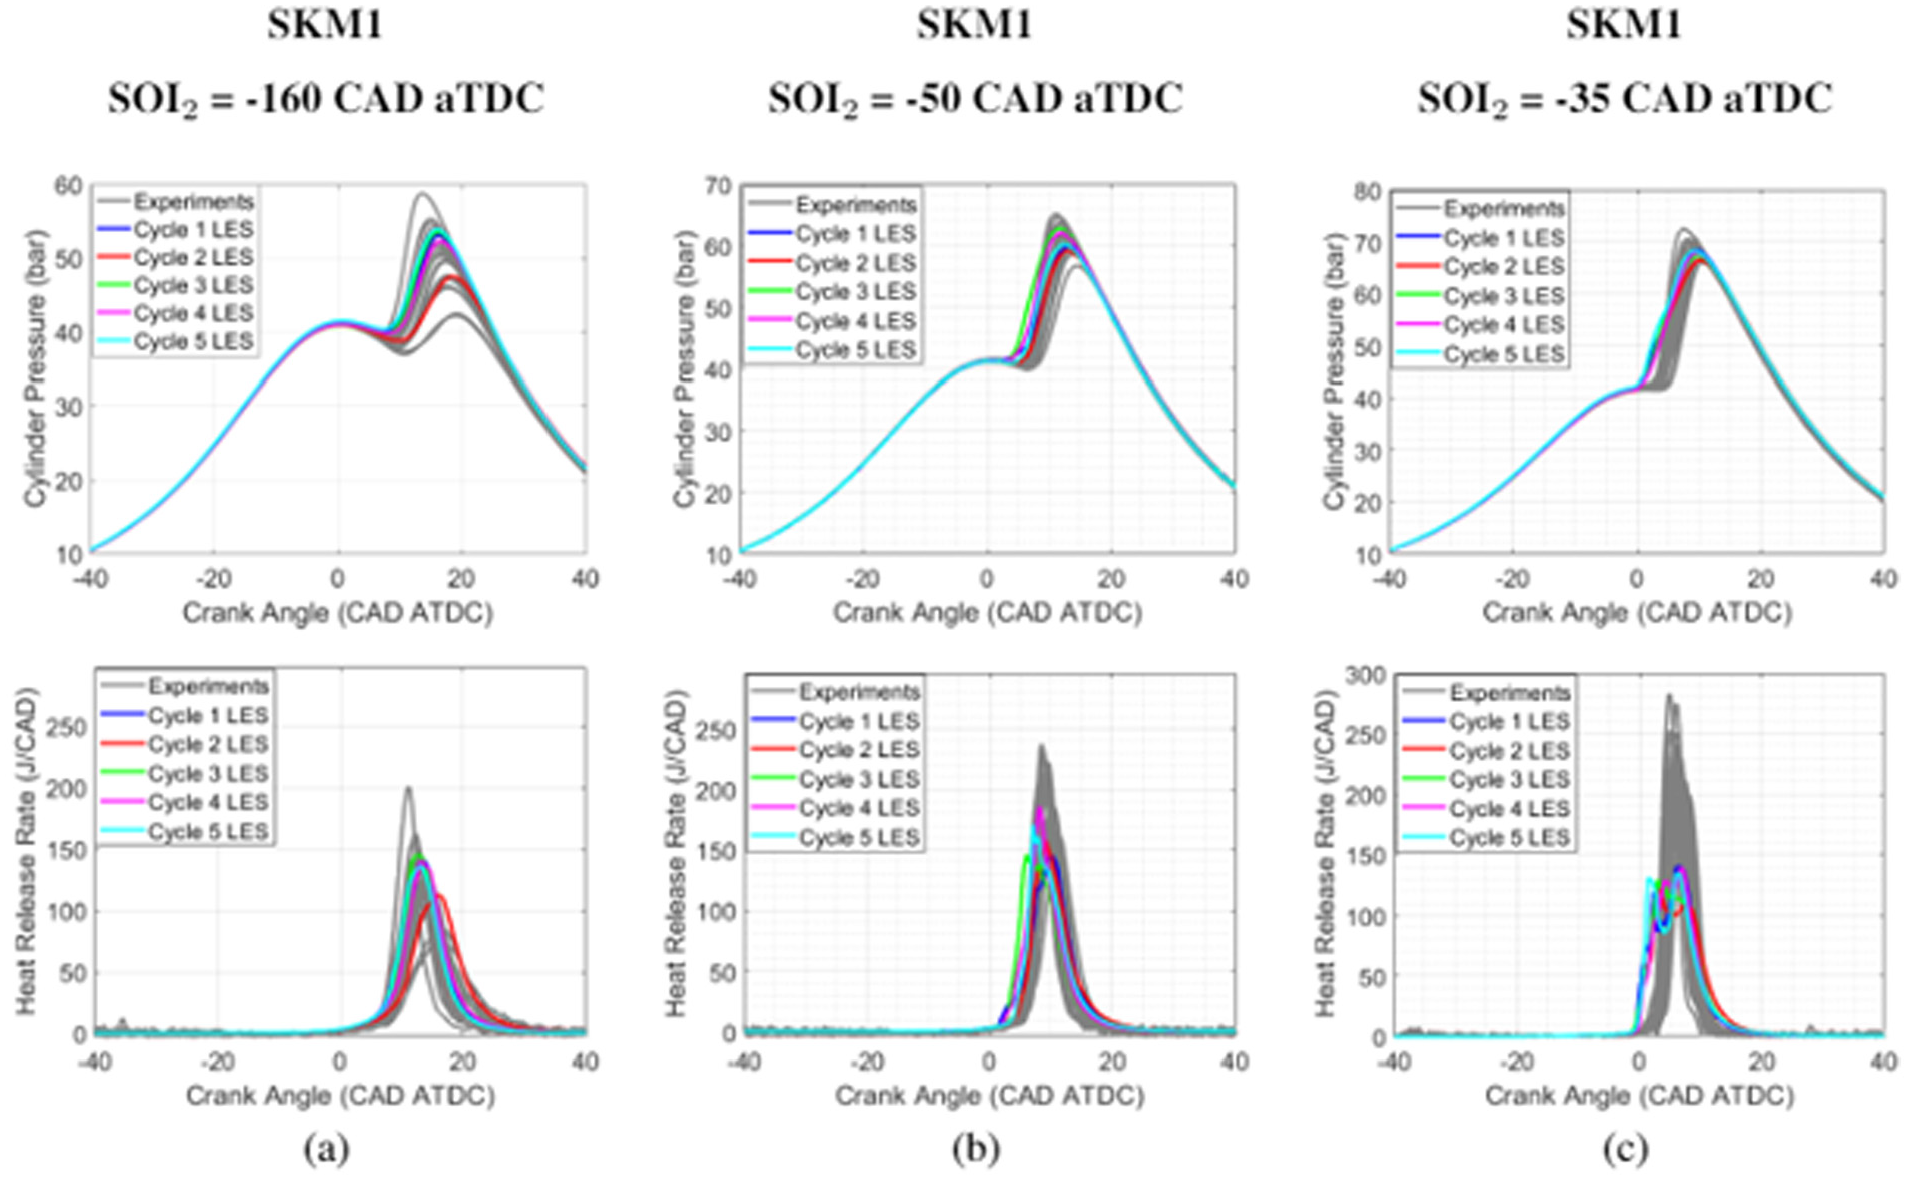
CFD results with SKM1. In-cylinder pressure (top) and HRR (bottom) are plotted for 20 consecutive experimental cycles (gray) and five consecutive LES cycles (colored) at
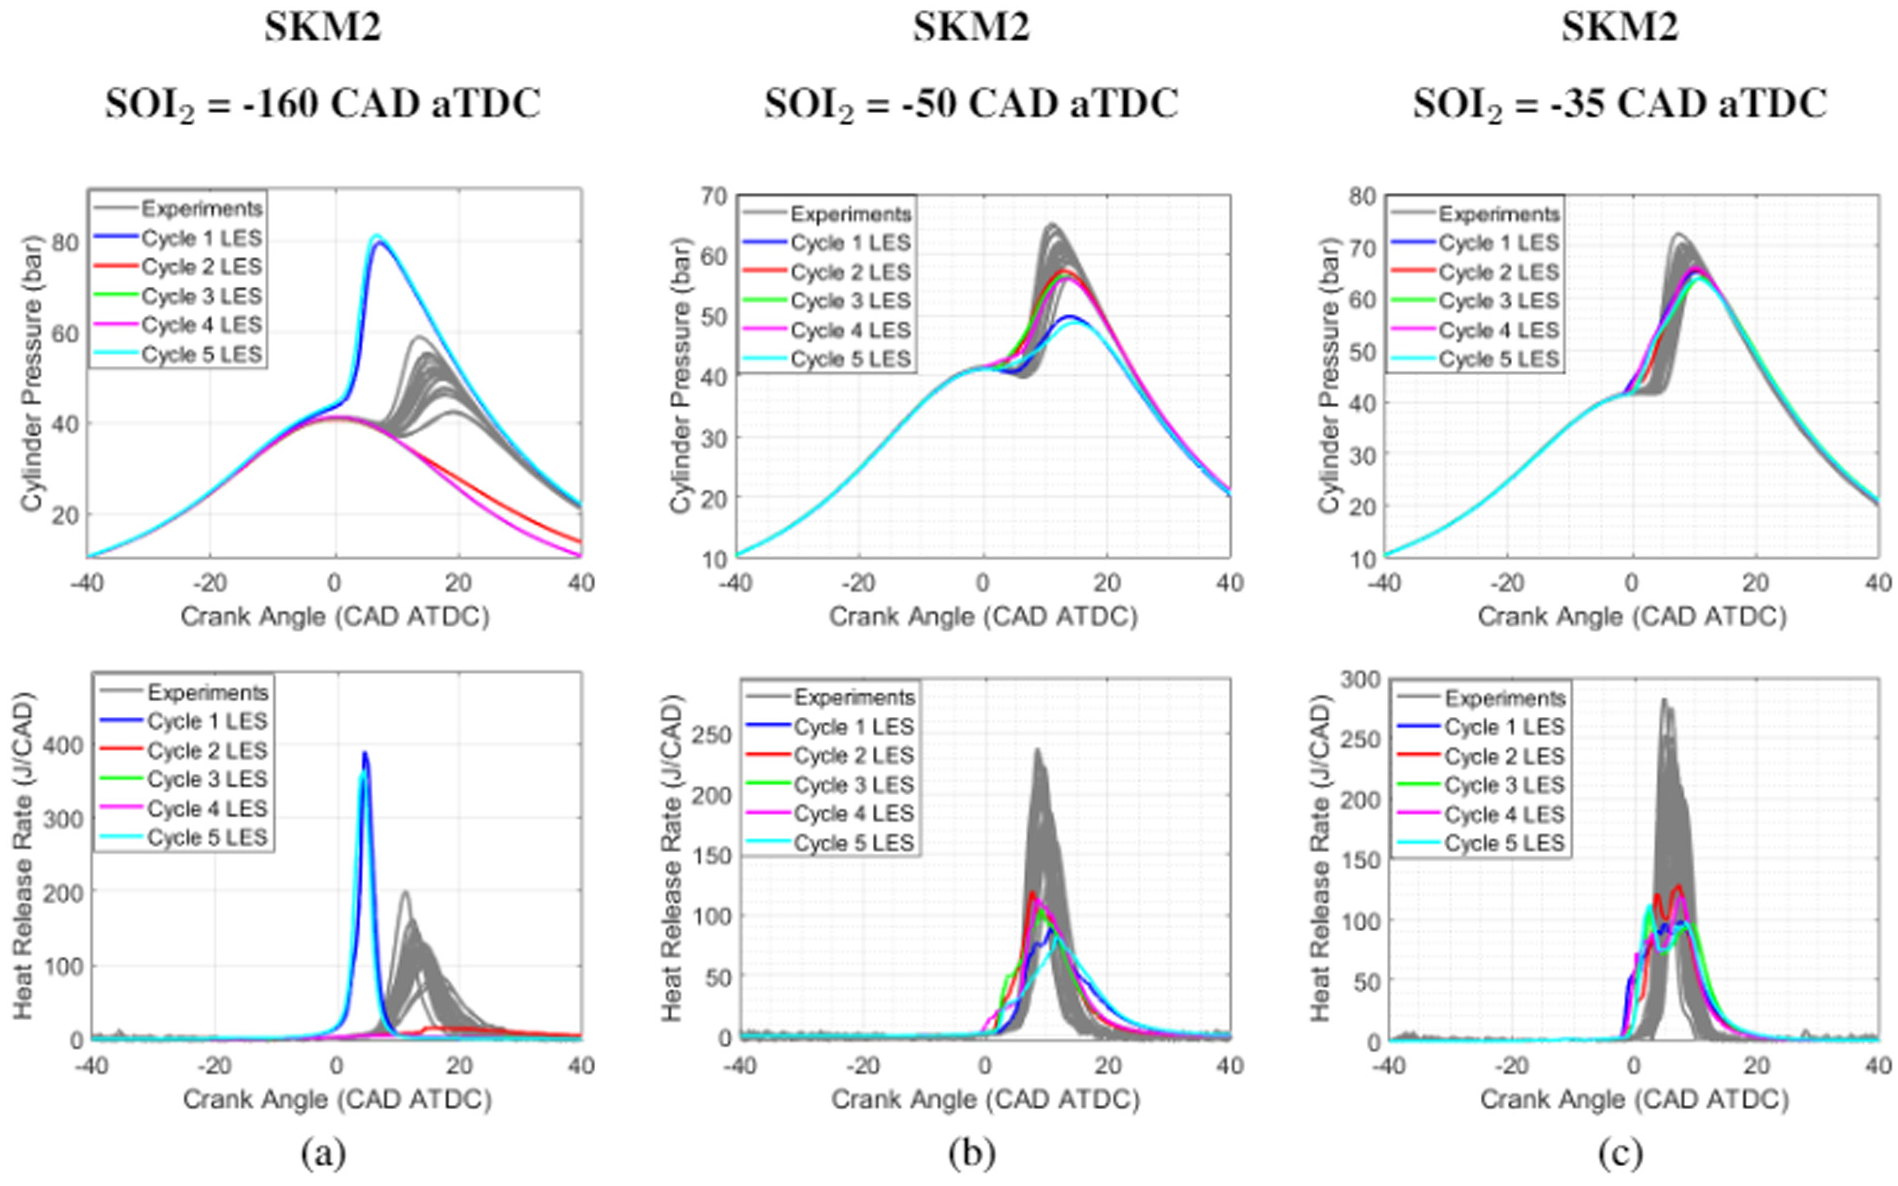
CFD results with SKM2. In-cylinder pressure (top) and HRR (bottom) are plotted for 20 consecutive experimental cycles (gray) and five consecutive LES cycles (colored) at
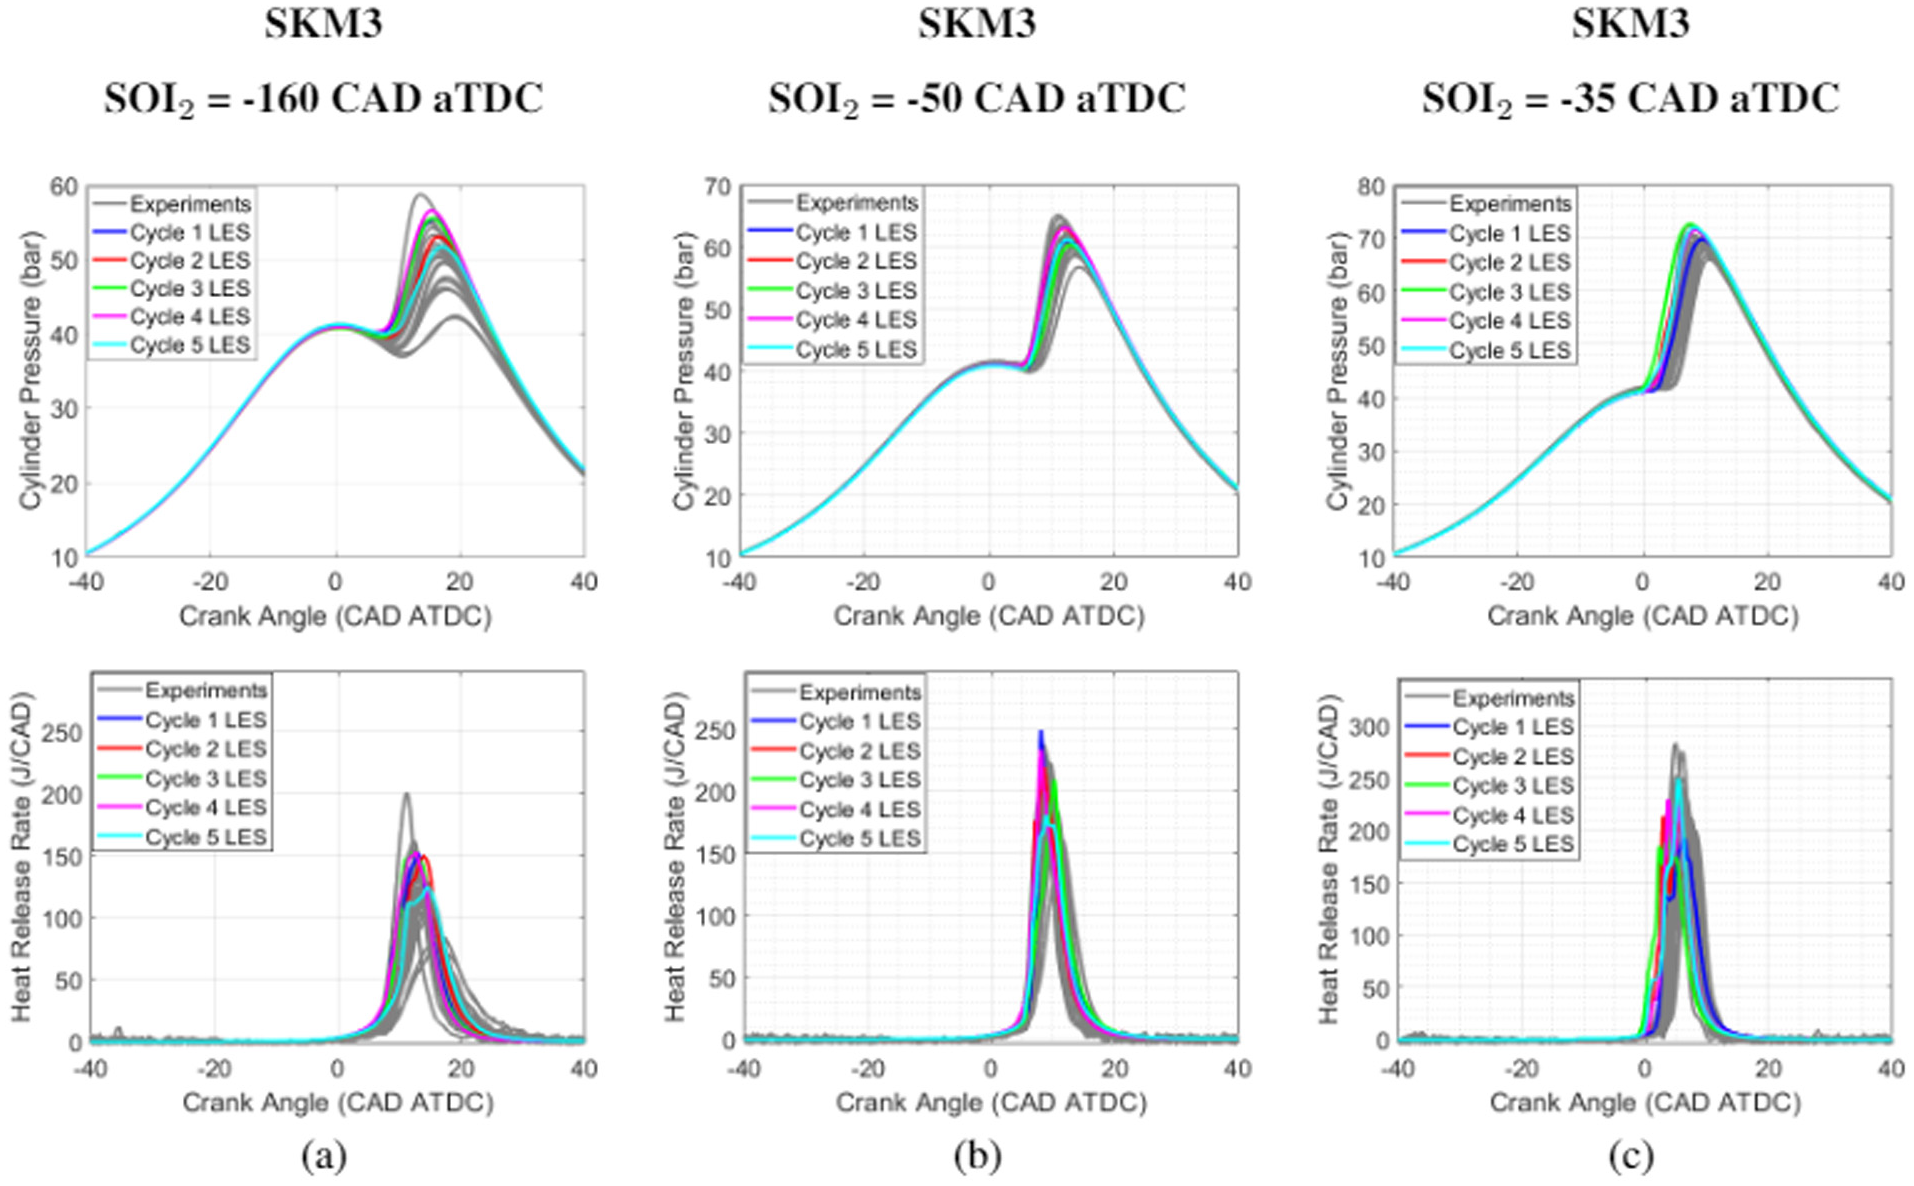
CFD results with SKM3. In-cylinder pressure (top) and HRR (bottom) are plotted for 20 consecutive experimental cycles (gray) and five consecutive LES cycles (colored) at
Figure 5(a) shows that the model is showing very good agreement with the experimental pressure and heat release data for
A similar comparison was performed for the same operating conditions using SKM2. Figure 6(a) shows the performance of SKM2 at second injection timing of −160 CAD aTDC. It was found that the model misfired for some of the cycles and the ignition was significantly advanced for the rest of the cycles. The higher pressure and heat release resulted due to the residuals from previous cycles. The evaluation of SKM2 at
Figure 7(a) shows the results for the second injection timing of −160 CAD aTDC using SKM3. SKM3 is showing very good agreement with the experimental pressure and heat release plots. It is also able to capture the cycle to cycle variability in the experiments similar to SKM1. The performance of SKM3 for second injection timing of −50 CAD aTDC can be seen in Figure 7(b). The agreement between the model and experiments is very good. SKM3 is able to predict start of autoignition with fair amount of accuracy and the pressure and heat release rate profile are also very close to the experiments. Hence, SKM3 is giving good results for moderately stratified mixture. Figure 7(c) shows the comparison of pressure and heat release profiles for second injection timing of −35 CAD aTDC using SKM3. As discussed previously,
The model evaluation for low, medium, and high stratification operating conditions shows that SKM1 works well for low to medium stratified conditions and struggles at highly stratified conditions. SKM2 is not predicting combustion accurately for any of the operating conditions. SKM3 on the other hand is accurately predicting start of autoignition as well as combustion progression and therefore has been used for further analysis of partial fuel stratification at second injection timings of −160, −50, and −35 CAD aTDC.
Analysis of the effects of stratification on the combustion using SKM3
Figure 8 shows the effect of compositional stratification on the combustion phasing for the second injection timing of −160, −50, and −35 CAD aTDC by plotting the joint probability density function (PDF) of temperature and atomic equivalence ratio in the combustion chamber at five (5) different crank angles of −10 CAD aTDC, TDC, CA10, CA50, and CA90 for each operating condition with SKM3. The figure was obtained by binning the cells of the combustion chamber into regions of
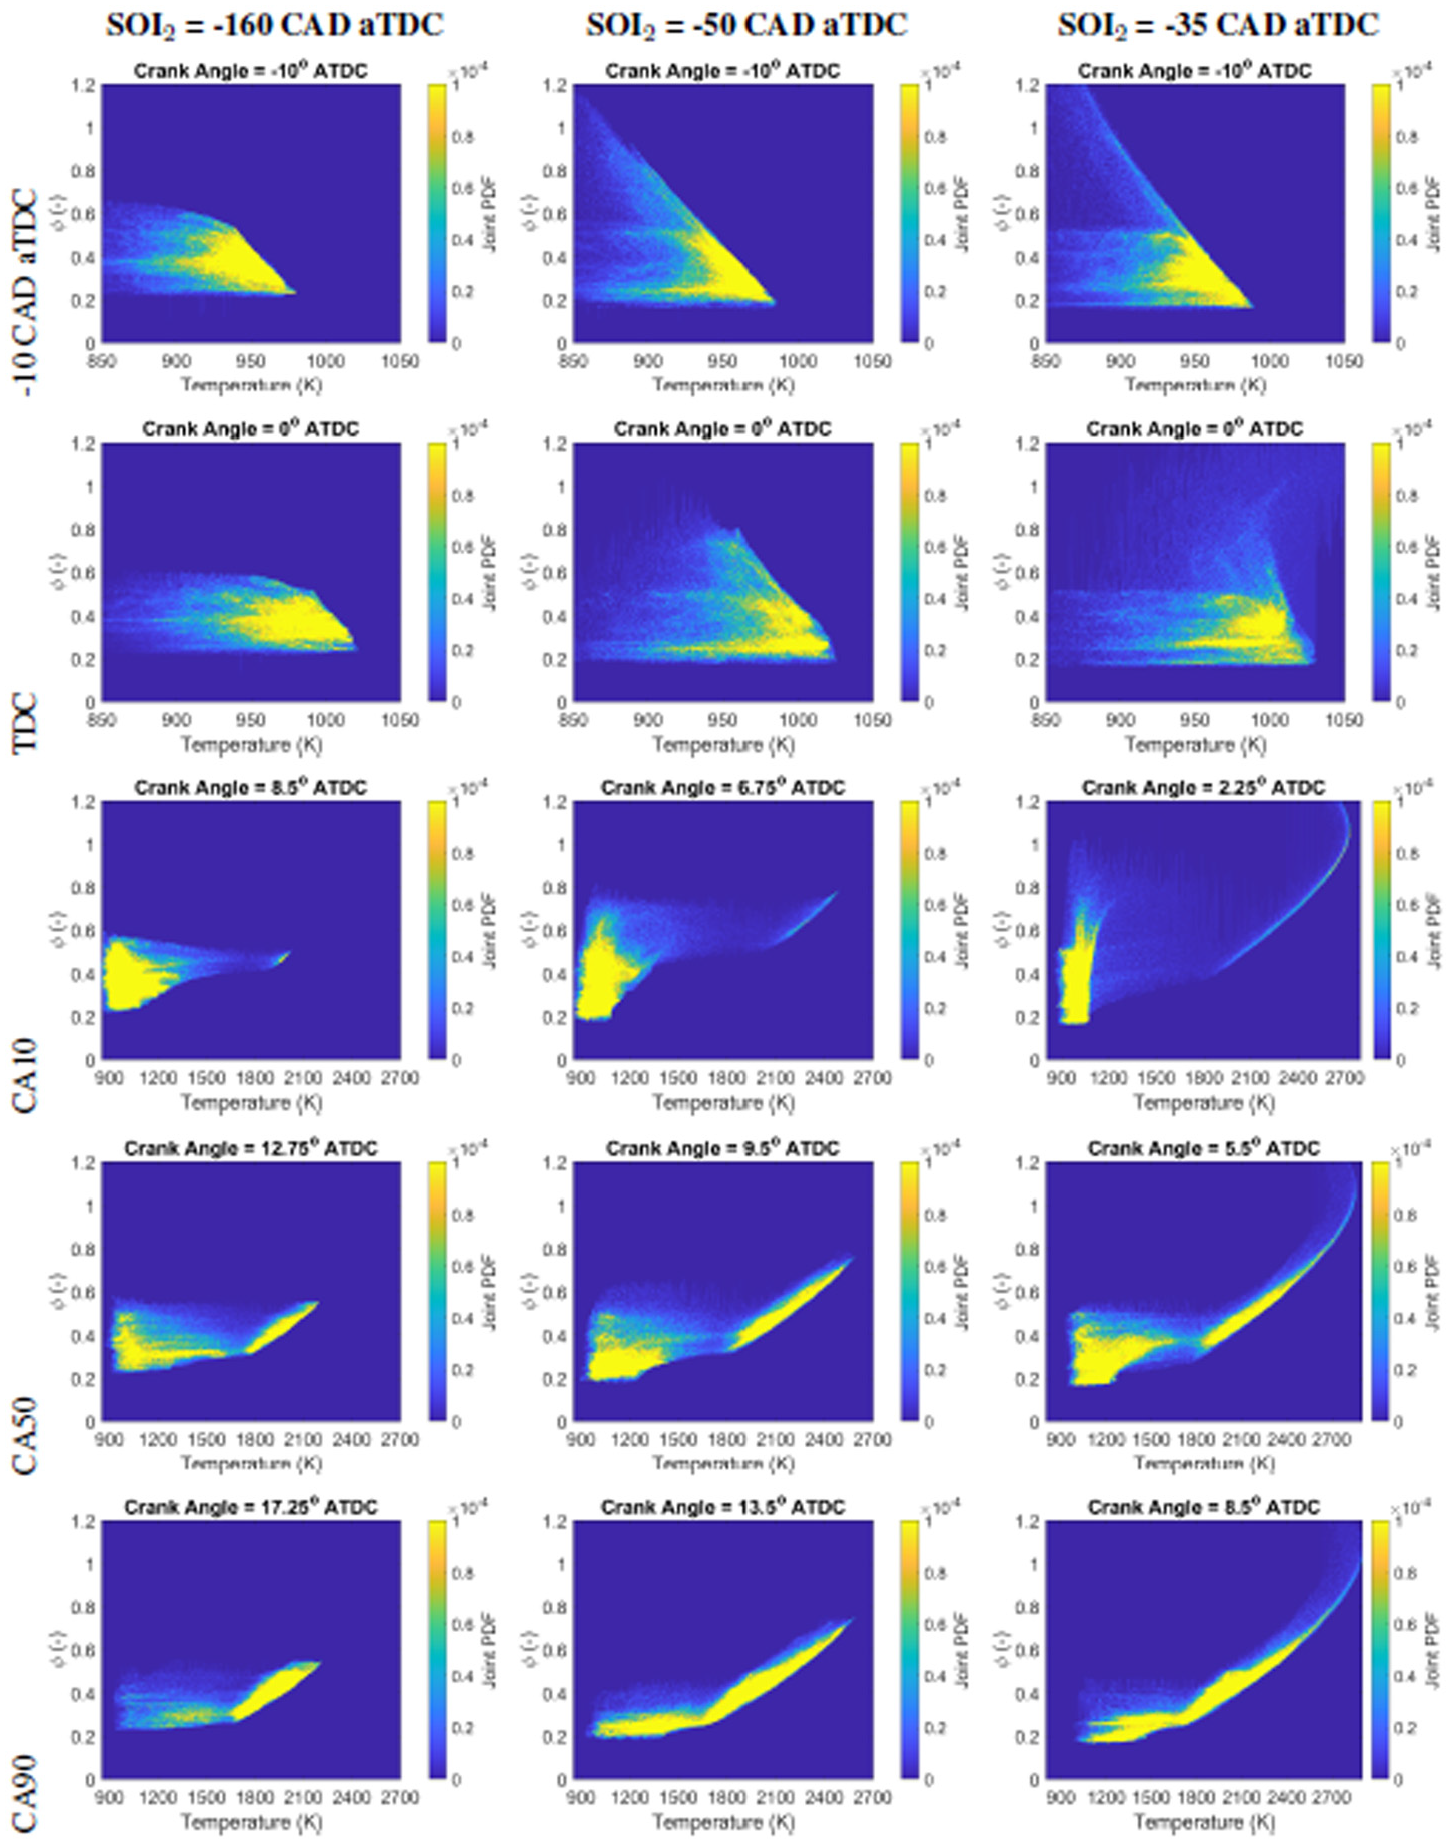
Contours of the joint PDF of mass as a function of equivalence ratio and temperature in the combustion chamber at −10 CAD aTDC, TDC, CA10, CA50, and CA90 for the fifth modeled cycle with
It can be observed that at −10 CAD aTDC, the
The joint PDFs for the three operating conditions at TDC are shown in the second row. The ignition has started for
The third row compares the joint PDFs at the corresponding CA10 value for all three operating conditions. The progression of combustion from the richest to the leanest regions can be observed for all the three cases. For
The fourth row of plots show the joint PDFs at the corresponding CA50 value for all three operating conditions. The positive gradient between the
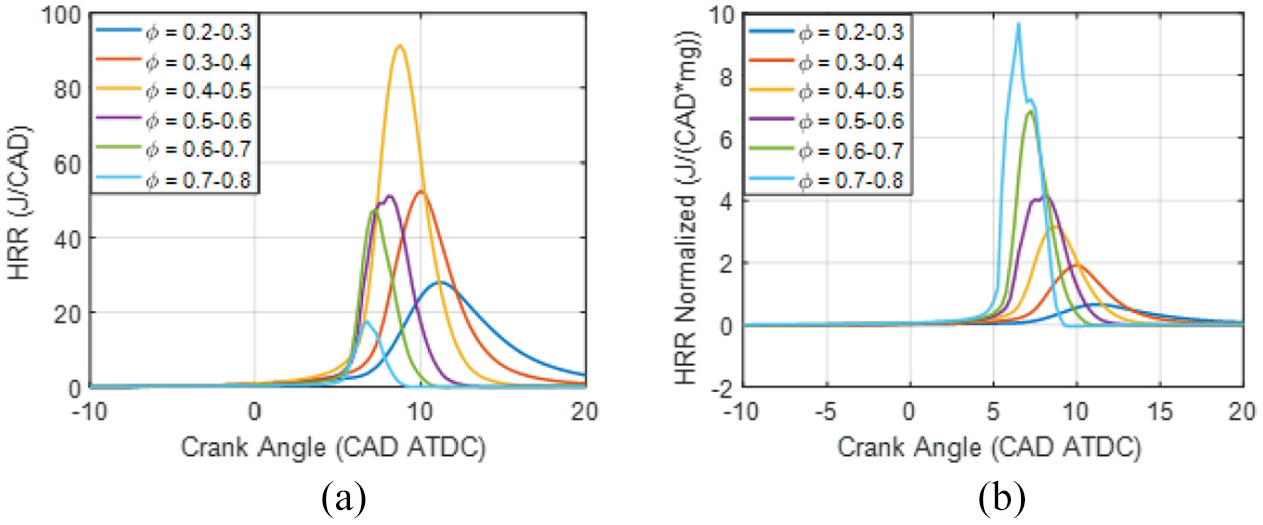
Figure 9 shows the heat release of different regions of
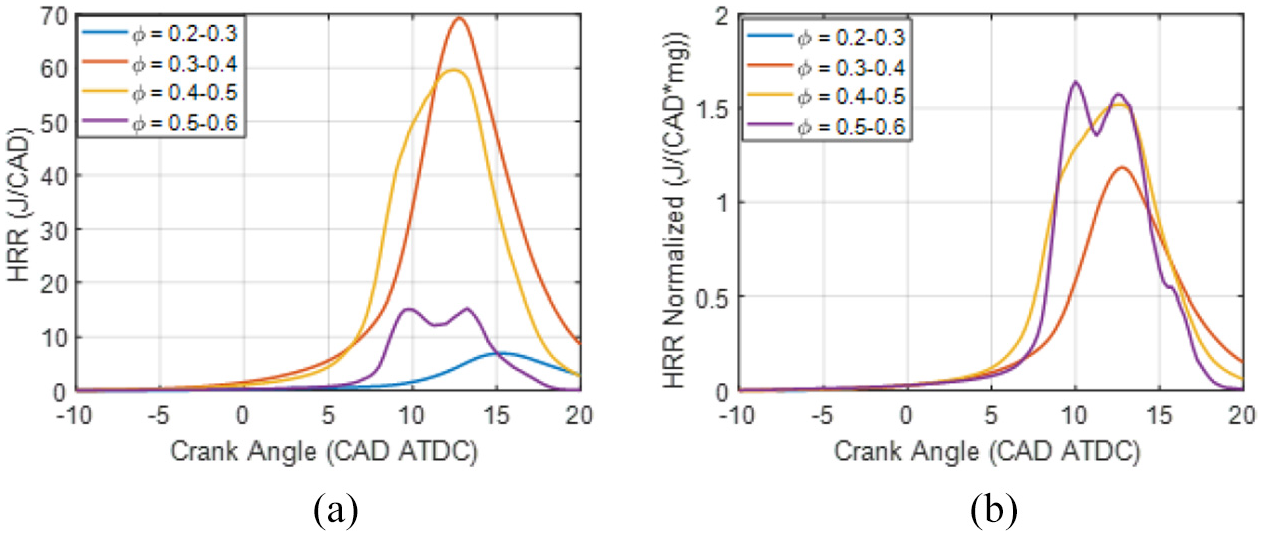
Heat release rates for four zones of different
Figure 10 shows the heat release of different regions of
Heat release rates for four zones of different
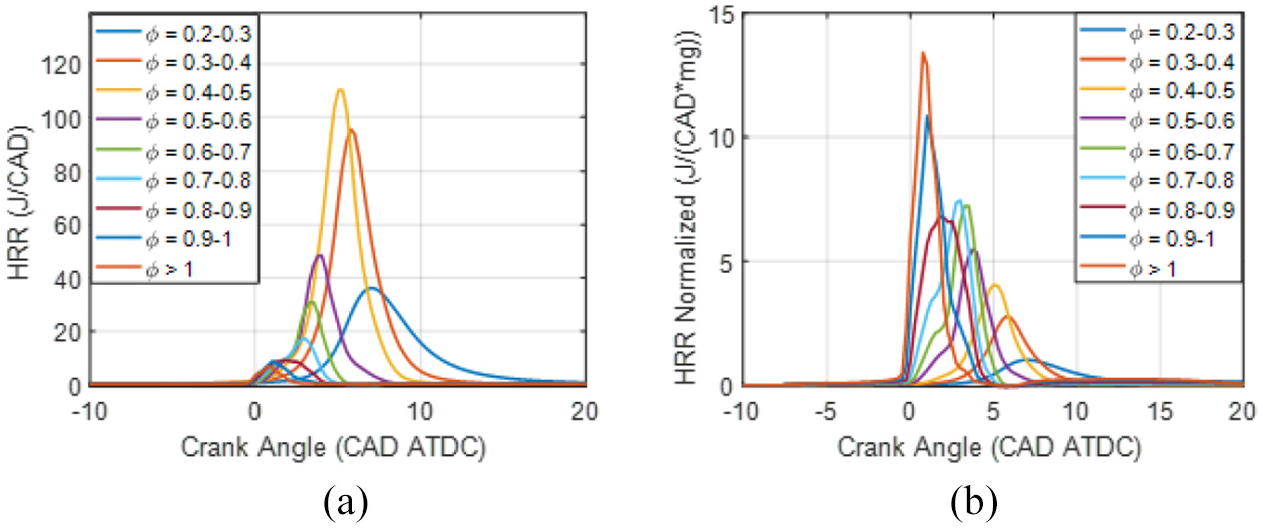
Heat release rates for four zones of different
Chemical kinetic analysis of SKM1, SKM2, and SKM3
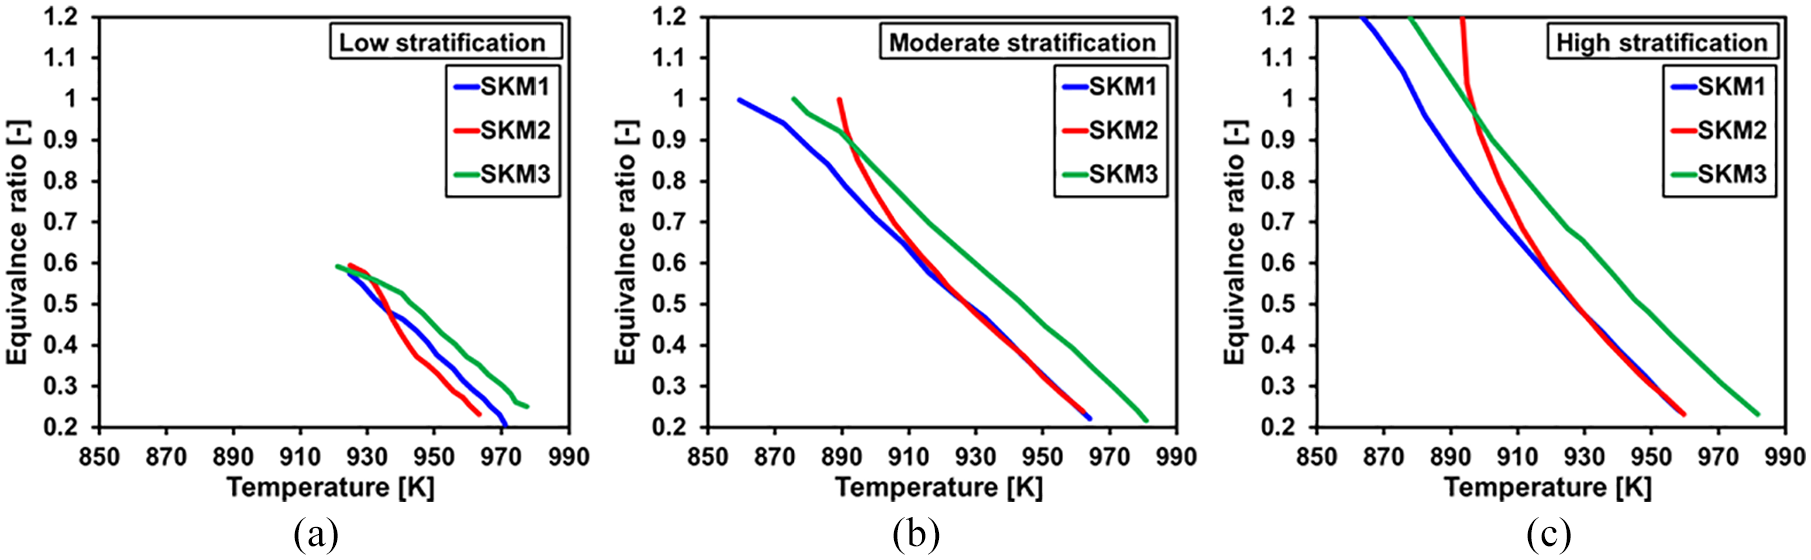
Chemical kinetic simulations are carried out in CHEMKIN to understand the performance of SKM1, SKM2, and SKM3 in the CFD simulations. The joint PDF of temperature and equivalence ratio in the combustion chamber at −10 CAD aTDC (which is shown in Figure 8 for SKM3 and in Appendix A for SKM1 and SKM2) is used to generate a
Figure 12 shows the
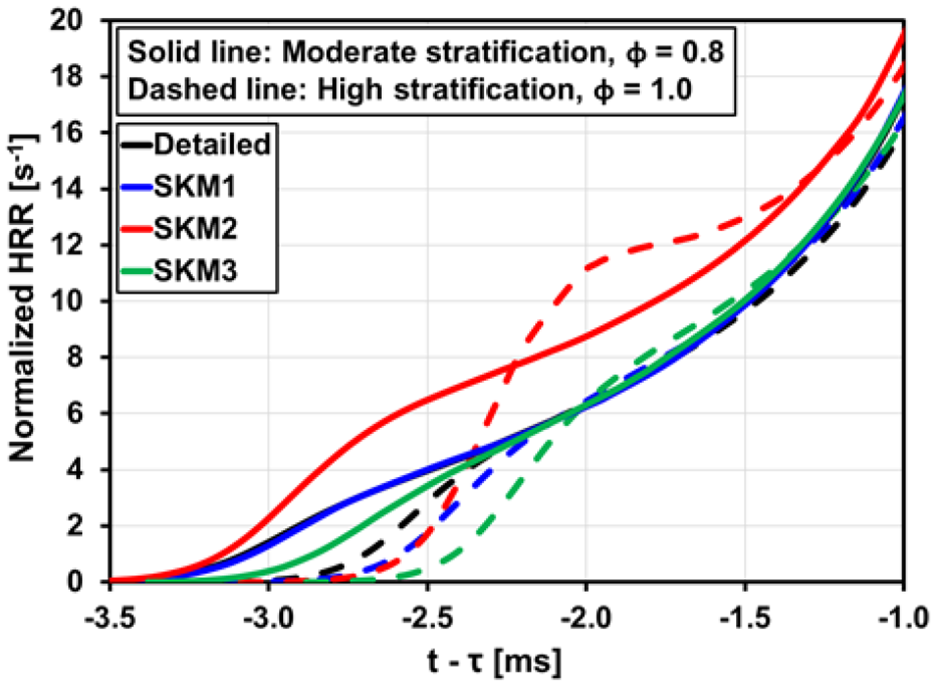
HRR normalized by the total heat released versus time relative to the ignition delay (t−
Figure 14 shows the ignition delay distribution that corresponds to each
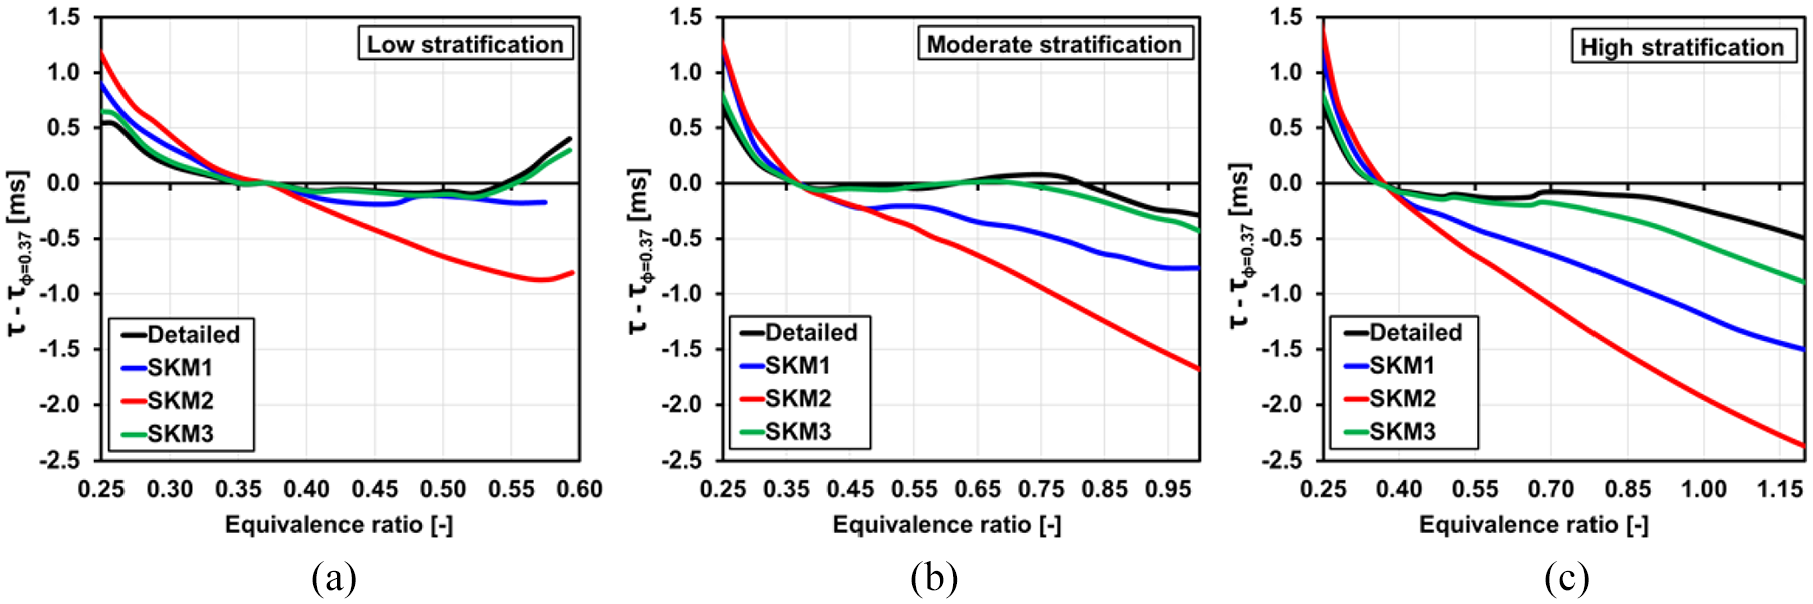
Ignition delay distribution that corresponds to each
SKM1 shows a good agreement with the detailed mechanism at low levels of stratification. However, the ignition of the richer regions progressively becomes overly advanced as the level of stratification increases. Thus, SKM1 predicts earlier ignition than the detailed mechanism at moderate and high stratification. This is in good agreement with the CFD results shown in Figures 4 and 5. SKM1 also shows a higher spread of ignition delays than the detailed mechanism for moderate and high stratification, which suggests a higher spread of heat release in the CFD simulations at these conditions. This is also in good agreement with with the CFD results of Figure 5(b) and (c), in which SKM1 shows lower peaks of HRR than the experiments.
SKM2 shows shorter ignition delays relative to
Finally, SKM3 shows the best agreement with the detailed mechanism among all the skeletal mechanisms, which suggests that SKM3 is more accurate than SKM1 and SKM2. The largest deviation between SKM3 and the detailed mechanism occurs for high stratification. SKM3 shows slightly shorter ignition delays relative to
Summary and conclusions
The present study used a 3D CFD model with Large Eddy Simulations to simulate the partial fuel stratification using research grade gasoline under moderate boosting. A split injection strategy was used where 80% of the fuel is injected at −300 CAD aTDC and the remaining 20% of the fuel is injected during the second injection. The timing of second injection is varied from −160 CAD to −35 CAD aTDC to change the
SKM1 provided acceptable agreement with the experimental results for second injection timings of −160 and −50 CAD aTDC. SKM1 did not predict autoignition and combustion progression accurately for
SKM2 did not perform well for all three operating conditions. The model had misfires at
SKM3 showed very good agreement with the experiments for all three operating conditions. The combustion was predicted a little earlier for
SKM3 is the recommended mechanism for different ranges of operating conditions for PFS modeling using research grade gasoline.
Second injection timing has a significant impact on
For moderate and high levels of stratification, the richer regions in the mixture ignite first and the sequential autoignition of leaner regions follows. However, ignition starts at intermediate
The
Footnotes
Appendix A
Figures A1 and A2 show the joint probability density function (PDF) of temperature and equivalence ratio in the combustion chamber at five different crank angles of −10 CAD aTDC, TDC, CA10, CA50, and CA90 for each operating condition for SKM1 and SKM2 respectively.
Appendix B
Declaration of conflicting interests
The author(s) declared no potential conflicts of interest with respect to the research, authorship, and/or publication of this article.
Funding
The author(s) disclosed receipt of the following financial support for the research, authorship, and/or publication of this article: The authors would like to thank Stony Brook Research Computing and Cyberinfrastructure and the Institute for Advanced Computational Science at Stony Brook University for access to the SeaWulf computing system, which was made possible by a $1.4M National Science Foundation grant (#1531492). The authors would like to also thank Convergent Science for providing CONVERGE licenses and technical support for this work.