
Abstract
This paper presents the details of a Computational Fluid Dynamics methodology to accurately model the process of mixture preparation in modern Gasoline Direct Injection engines, with particular emphasis on liquid film as one of the main causes of Particulate Matter formation. The proposed modelling protocol, centred on the Bai-Onera approach of droplets-wall interaction and on multi-component surrogate fuel blend models, is validated against relevant published data and then applied to a modern small-capacity GDI engine, featuring centrally-mounted spray-guided injection system. The work covers a range of part-load, stoichiometric and theoretically-homogeneous operating conditions, for which experimental engine data and engine-out Particle Number measurements were available. The results, based on the parametric variation of start of injection timing and injection pressure, demonstrate how both fuel mal-distribution and liquid film retained at spark timing, may contribute to PN emissions, whilst their relative importance vary depending on operating conditions and engine control strategy. Control of PN emissions and compliance with future, more stringent regulations remain large challenges for the engine industry. Renewed and disruptive approaches, which also consider the sustainability of the sector, appear to be essential. This work, developed using Siemens Simcenter CFD software as part of the Ford-led APC6 DYNAMO project, aims to contribute to the development of a reliable and cost-effective digital toolset, which supports engine development and diagnostics through a more fundamental assessment of engine operation and emissions formation.
Keywords
Introduction
Internal combustion engine designers and developers are faced everyday with new challenges to improve efficiency and cut down emissions, in order to comply with ever more stringent regulations.1,2 Downsizing and turbo-charging have become common practice, leading to the production of families of small-capacity Gasoline Direct Injection (GDI) engines, which reach high power densities. Despite the advancement in technology, emissions, specifically soot particle emissions (commonly referred to as Particle Matter or Mass, PM and Particle Number, PN), remain a worrisome problem, given their impact on human health and the environment.3–8
Contrarily to experimental engine testing which can be complex and expensive to setup and run, Computational Fluid Dynamics (CFD) modelling of the engine cycle can be used as a reliable alternative, or as a complementary development and diagnostic tool. CFD has the potential to accurately reproduce the engine experimental conditions, providing a deeper and more fundamental insight into the physico-chemical mechanisms leading to the formation of pollutant emissions, and reducing at the same time the necessity for costly hardware testing.
The stoichiometric and (theoretically-) homogeneous charge combustion mode remains possibly the safest approach to obtain a clean and efficient combustion process across the wide running envelope of modern GDI engines.9–11 A homogenous charge requires enough space and time for the injected fuel to evaporate and mix with the surrounding air. In spite of the sizeable fuel consumption benefits, the process of direct in-cylinder injection, especially in small-capacity engines, is largely in contrast with these two requirements. 12 The result is that the process of mixing is imperfect/insufficient and the air-fuel mixture at the time of ignition is not well prepared. 13 In a given engine, Start Of Injection (SOI) and injection pressure/Fuel Rail Pressure (FRP) are two key calibration variables responsible for the quality of the gas-phase mixing process; 14 moreover, they exert a significant influence on the spray-to-wall impact regime and the resulting piston/wall wetting.15,16 Modern control approaches also incorporate the ability to split the injection process into two or more pulses as a solution to minimise the spray-to-wall impingement reducing the formation of liquid film.17,18 The study presented in this paper, however, is not concerned with split or pulsed injection.
In a study by Davy et al., 19 the effects of different levels of SOI timing (330–90 CA deg BTDC) were observed in a Direct Injection Spark Ignition engine with optical access and it was found that the interaction between the incoming air flow and the fuel spray had severe consequences on the final mixture homogeneity and liquid film formation for both very early and very late SOIs. The study showed a high rate of spray evaporation before impaction for SOI between 270 and 210 CA BTDC, but timings of 210 to 120 CA BTDC led to reduced charge homogeneity due to the shorter mixing time; similar outcome has been observed in other experimental studies.20–25 In the work by Stevens and Steeper 26 liquid film burning or pool fire was consistently seen for late injections, presumably due to the non-volatile contents of the remaining deposits. It was concluded that the slow mechanism of pool fire, appearing well after spark timing, was the main source of engine-out Particulate Matter (PM).
Through the application of a multi-component fuel in-cylinder CFD model, which was validated against infrared thermography and fluorescence measurements, Köpple et al. 27 showed a consistent correlation between mixture quality characteristics and PN measurements. They also demonstrated how an increasing FRP improves the mixture quality when in combination with mid-intake SOIs (300 CA BTDC), whilst causing significant increase in wall film with early SOI (350 CA BTDC). Similar FRP effect was outlined by Schulz et al. 28 Increasing fuel rail pressure has been consistently shown to improve mixing due to reduced injection duration; however, when single pulse injection was used, greater injection pressure would result in longer spray penetration length and augmented chance of spray-to-wall impact.29,30
Using a detailed chemistry scheme in engine simulations, Kim et al. 31 found that lack of homogeneity and increased amount of liquid film due to inadequate physical time for mixing in late SOI timings, increased the production of both Acetylene and Pyrene, believed to be precursors in the mechanism of soot formation.32,33 Jiao and Reitz 34 reported less liquid fuel deposition as the result of increased piston temperature and witnessed an improvement in gas-phase mixing. Similarly, the relation between SOI and local wall temperatures was investigated using advanced piston surface temperature telemetry in another study by Köpple et al. 29 The experiments showed localised surface cooling in the impingement region, with the spray footprint temperature reducing temporarily by up to 40 K compared to the average piston crown. In light of this finding, Giovannoni et al. 35 developed a methodology integrating CFD flow modelling and Conjugate Heat Transfer simulation of the engine piston, in order to account for realistic levels of piston surface temperatures. In the current study, the analysis of liquid film is extended to the whole combustion chamber and all its components. However, under the conditions investigated the spray-guided operation causes the vast majority of liquid film to form on the piston top, and in some cases on the liner. The methodology section remarks the importance of using correct or realistic levels of piston temperature to ensure accurate liquid film modelling. The effects of spray on piston surface cooling will be discussed in more details in Part 2 of the current study.
Jiao and Reitz 36 used 3D CFD modelling to replicate the stratified lean operation in a GDI engine using also a predictive soot model. It was found that fuel rich regions from very late injection timing led to high soot production rates. Due to the choice of isooctane as the single component surrogate fuel model, the authors did not find any relation between soot and liquid film, as the latter fully disappeared before the start of combustion. In another similar study of Giovannoni et al., 37 the importance of the multi-component surrogate fuel was outlined to identify a correlation between experimentally measured PM and stratified SOI timing, through predicted mixture uniformity and liquid film mass.
An appropriate account of surrogate fuel components, their phase change and their interaction with wall boundaries is fundamental to realistically reproduce the air-fuel mixture preparation, including the formation of liquid film and its evaporation before combustion. As demonstrated in numerous studies,27,34,35 liquid film deposits may be retained up to spark timing and beyond this point, in some operating conditions, due to the presence of low-volatile components. 21 Although the commercial gasoline fuels are a blend of many different hydrocarbons, 38 engine CFD simulations have been routinely using mono-component fuel models like N-Heptane or Isooctane36,39–41 to simplify the analysis and/or reduce the otherwise large computational burden. More complex fuel models have been adopted such as the Primary Reference Fuel (PRF), a mixture of N-Heptane and Iso-octane, and the Toluene Reference Fuel (TRF), a mixture of N-Heptane, Iso-octane and Toluene33,42 In some cases, 43 fuel models are used where specific properties are optimised to represent a TRF blend,44,45 but with the added benefit of being treated as a single-component model within the CFD solver. 46 Whilst PRF and TRF fuel models may be suitable for combustion modelling (appropriately reflecting Lower Heating Value, aromatic content and RON of commercial gasolines), along with single-component models they lack accuracy in replicating the complex thermo-physical behaviour which characterises the spray and mixture preparation stages of the engine cycle.34,47,48 Further refinement and, generally, integration of more fuel components including light and heavy hydrocarbons have been demonstrated to be essential to reproduce spray evaporation, mass transport and the liquid film tendencies of real gasoline fuels.27,31,36,37
The distillation curve and the saturation temperature are the main properties affecting the initial formation of liquid film and its evaporation.34,49 Since no combustion modelling is carried out in the present study, a multi-component surrogate blend model has been developed to mimic only these properties for the gasoline fuel used in the parallel experimental work. Further work by the Authors of forthcoming publication, extends the analysis through to the combustion process and uses a novel methodology to ‘map’ the ‘mixing fuel blend’ into a ‘combustion blend’ of appropriate characteristics.
Several numerical approaches have been proposed in the literature to model spray-wall interaction (the outcome of each droplet-wall impact) in the context of an engine cylinder, with some still under development to this day.50–57 The results presented in this paper are obtained using the Bai-Onera spray-wall interaction model. Based on the work by Bai and Gossman,50,58 the Bai-Onera model was developed using numerous experimental data attained by the ONERA laboratory.
51
Depending on the thermo-kinetic characteristics of the fuel droplets at the time of impact, the model identifies whether a droplet sticks to the wall, splashes or bounces off the wall. Such characteristics are defined as a function of two variables, namely
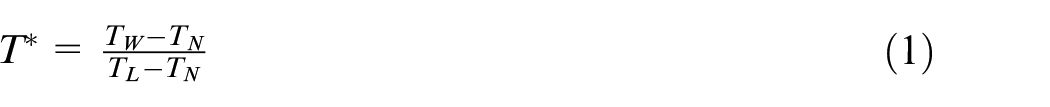
The level of
The variable
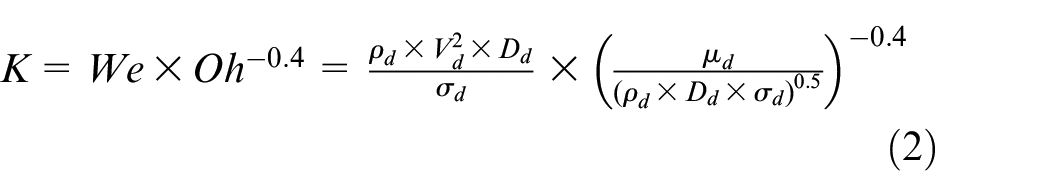
In equation (2),
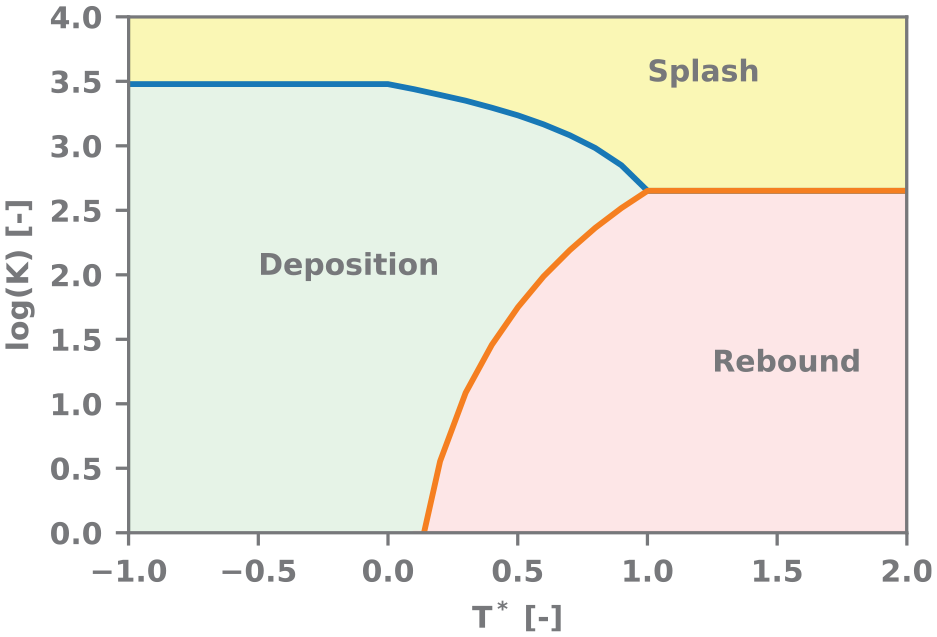
logK –T* diagram according to the Bai-Onera model, 51 showing possible outcomes of spray-to-wall impact: deposition (green area), Rebound (red area) and Splash (yellow area).
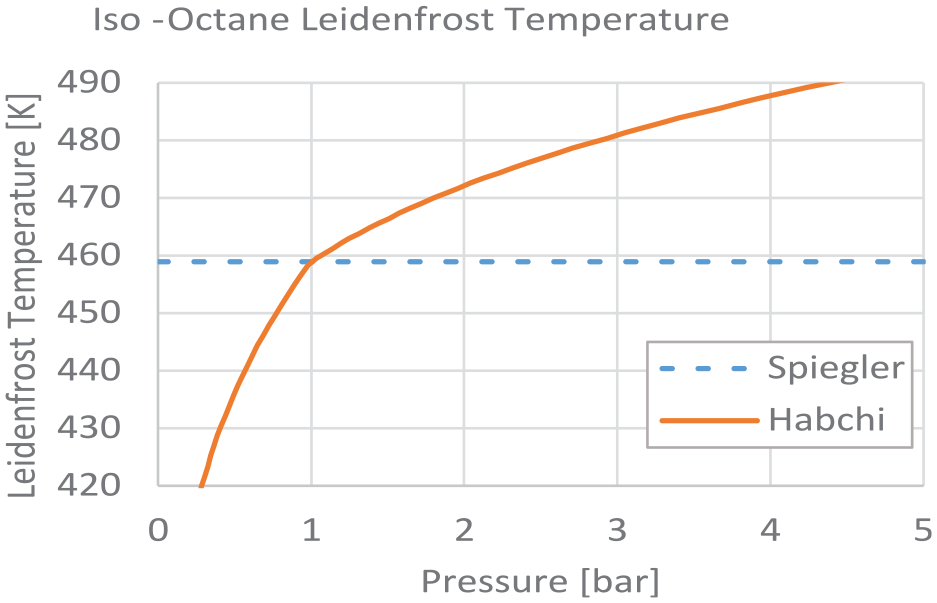
STAR-CD version 4.32 offers two alternative models of Leidenfrost temperature for a given chemical species, the Spiegler and the Habchi models. Spiegler 60 found that when pressure is well below the critical value, the Leidenfrost Temperature is a constant property and a fraction of the Critical temperature.
Habchi 61 developed a more complex Leidenfrost model in order to account for more realistic operating conditions where the environmental pressure is different from atmospheric, as often happens during the intake and/or compression stroke in the engine cycle. Habchi’s model accounts for pressure and saturation temperature. As an example, Figure 2 shows the Leidenfrost temperature for Isooctane, calculated using the two approaches in a range of pressures and temperatures appropriate to in-cylinder conditions. This study benefits from using the Habchi model.
The present study aims to provide the details of a general methodology to attain realistic 3D modelling of the processes of the gas exchange and mixture preparation, in a modern GDI engine operated under part-load conditions. The simulations have been terminated at spark timing and did not include combustion. The established effects of SOI and FRP have been leveraged to demonstrate the efficacy of the proposed approach. The work is based on the Siemens Simcenter STAR-CD CFD package, but the proposed approach can be extended to other software, assuming relevant capabilities and sub-models are available. Section 2 and Section 3 give ample space to the development and implementation of multi-component surrogate fuel blend models, and of the modelling protocols to replicate the processes of spray-wall impact, liquid film formation and film-to-flow fuel re-entrainment. These are essential to impart acceptable accuracy, but may have been overlooked in the past due to the lack of data, or of adequate computational resources. In Section 3, the proposed setup is used to validate the mechanism of liquid film formation against relevant published data. Section 4 reports the experience of applying the validated methodology under a range of engine conditions where SOI and FRP are varied parametrically, and for which experimental engine data and engine-out PN measurements were available. This paper is the first part of a two-part collection. Part 2, of forthcoming publication, expands on the application of the approach presented here, to further explore the correlation between piston/wall temperature and liquid film, and the strong influence this exerts on soot formation due to piston cooling and/or transient engine operation.
Methodology
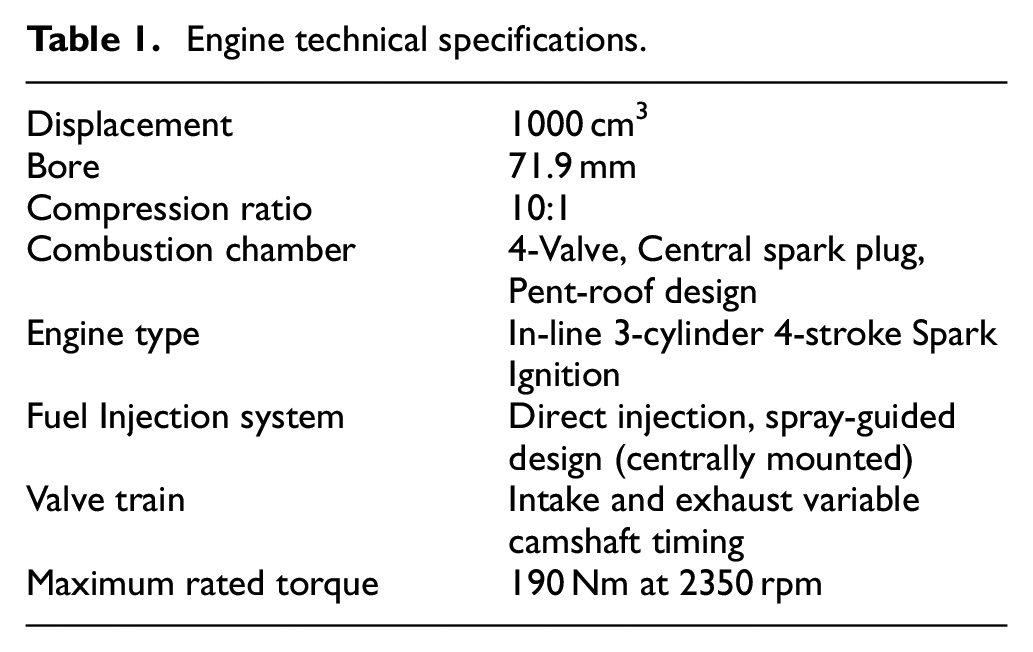
All the CFD simulations and the supporting experimental work have been carried out based on a modern, one-litre, three-cylinder, inter-cooled, turbo-charged, GDI engine, featuring spray-guided injection system with head-mounted injector capable of injection pressure up to 250 bar. The main characteristics of the test engine are reported in Table 1.
Engine technical specifications.
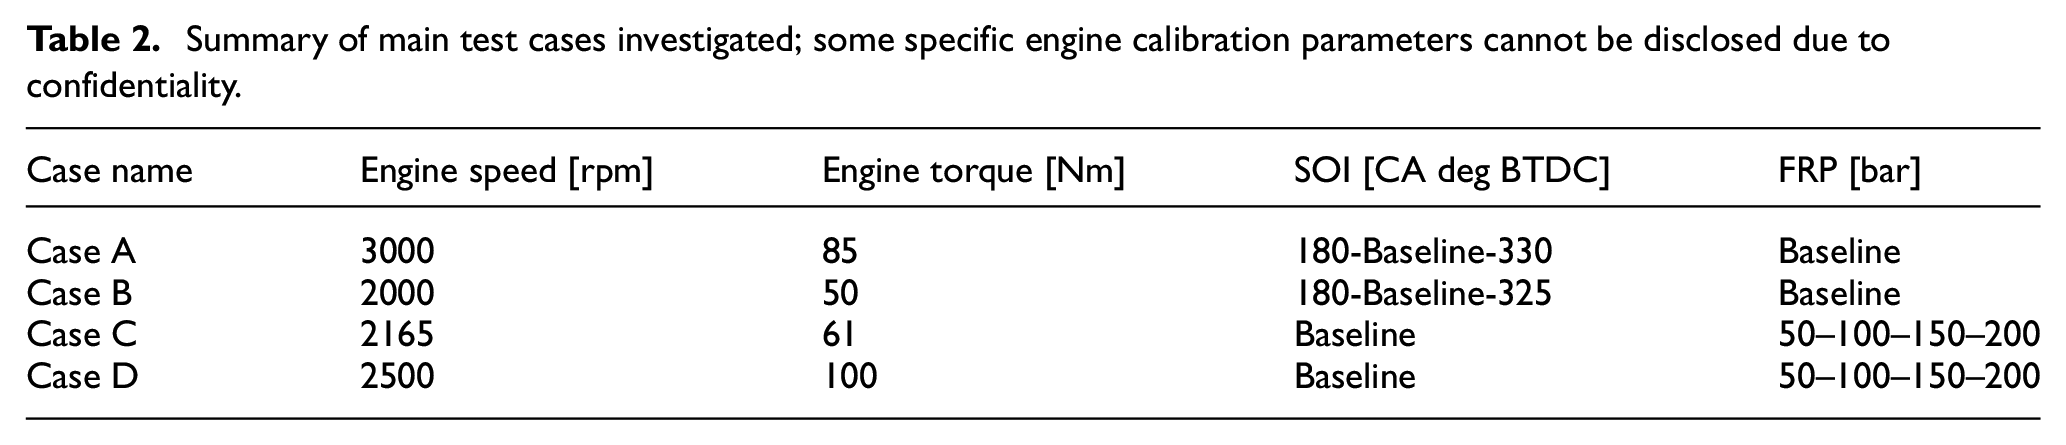
The work has focused on a number of relevant parametric studies, the specifics of which are reported in Table 2. Two variables, namely SOI and FRP, were varied in isolation and in steps, and each variable sweep was carried out at two engine speed and load combinations. The SOI range covered a large span of possible intake stroke injections from early (∼330 CA deg BTDC) to late (∼180 CA deg BTDC), around the baseline calibration SOI which is located mid-way through the intake stroke. For brevity and clarity, the SOI variation reported in this paper includes only three steps at each operating condition. The FRP variation covered a realistic operational range between 50 and 200 bar. The pulse width was modulated to consistently ensure stoichiometric air-fuel mixture operation, with equivalence ratio
Summary of main test cases investigated; some specific engine calibration parameters cannot be disclosed due to confidentiality.
CFD methodology
The CFD work has been carried out using the Simcenter STAR-CD v4.32 software by Siemens. The initial surface mesh was generated using the Siemens Simcenter STAR-CCM+ package and included intake and exhaust ports/runners, valves and the combustion chamber with piston at its Top Dead Centre (TDC) location. The dynamic volume mesh was generated, using a trimming method with hexahedral elements, within the ES-ICE software environment. Having carried out a mesh independency test, the volume cell base-size was set to 0.85 mm with local refinement in the vicinity of the injector, spark plug and valve seat areas (0.21 mm). This yielded a total cell count of 1.42 M with piston at Bottom Dead Centre (BDC) and 360 K with piston at TDC. A visual representation of some details of the computational domain is given in Figure 3.
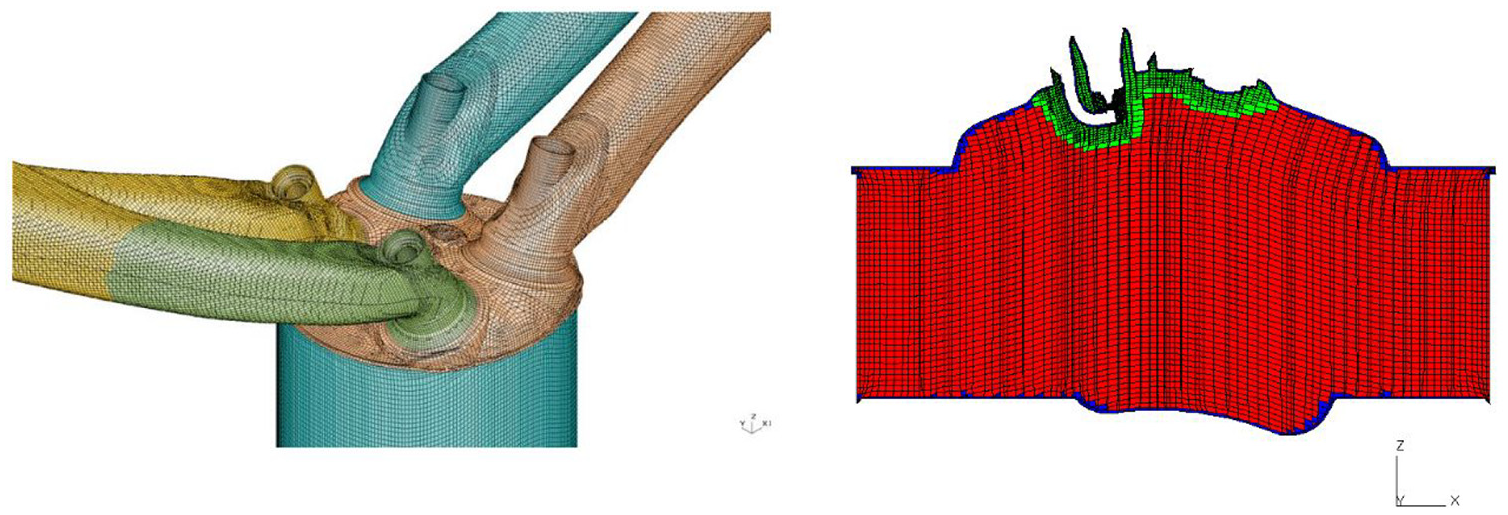
Details of the ‘trimmed’ engine volume mesh.
The simulations were limited to the gas exchange and mixture preparation process, starting at 20 CA degrees before the Intake Valve Opening (IVO) timing and terminating at Spark Timing (ST). The time step was suitably adjusted to assure convergence throughout all cycle phases and physical phenomena, keeping values between 10e-5 and 10e-6 s. 62 The Monotone Advection and Reconstruction Scheme (MARS) was used for the momentum, turbulence and temperature equations, whereas the Central Differencing scheme (CD) for density. The RNG k-ε closure approach was used to model turbulence. A standard vapour-liquid equilibrium-state model, based on the Raoult’s law of partial pressures, was used to model evaporation of droplets and from the liquid film – this was modified through the UNIFAC method (UNIversal quasi-chemical Functional-group Activity Coefficients) to account for the presence of ethanol in the fuel blend. 62 Temperature-dependent thermo-physical properties were used for all gaseous and liquid components.
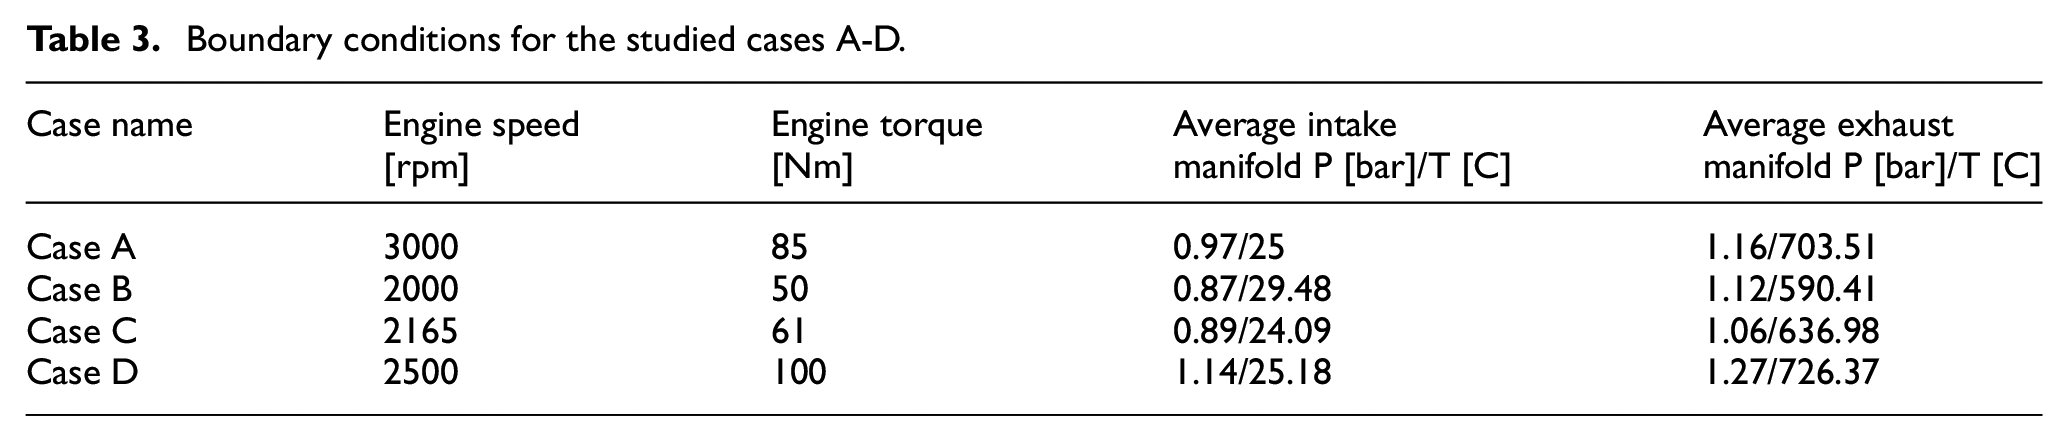
Time-dependent temperature and pressure boundary conditions were applied at the intake and exhaust runners, based on validated engine 0D/1D models created within the Ricardo Wave software environment. 63 All running conditions considered in this study are cases of stoichiometric mixture operation; the mass of air trapped within the CFD simulation at Intake Valve Closing (IVC) timing was validated against measurements, with error consistently lower than 3%. Accurate geometry, trapped mass, boundary and initial conditions, ensure that in-cylinder pressure and temperature along the cycle (up to spark timing) are reproduced truthfully. Table 3 summarises the main boundary condition for the four operating conditions considered in this work.
Boundary conditions for the studied cases A-D.
Homogeneous and constant temperature boundary conditions were applied at the walls, including piston top, liner, dome, spark plug, injector and valves, with region-specific values from available experimental (telemetry) data. As demonstrated by Köpple et al.27,29 and Catapano, 64 piston surface temperature does not change significantly during intake, fuelling and mixing phases (up to spark timing), giving reassurance that, for most operating conditions, the fixed wall-temperature assumption for a spray-guided GDI engine is acceptable. However, they found evidence that in some conditions such as early SOI timing, piston temperature may reduce locally and momentarily by up 40 K due to the cooling effects from spray-surface interaction. In order to capture the effects of local cooling, enabling the impingement and liquid film models to work accurately, the piston surface temperature was suitably reduced for early injection timings. Qualitative comparison between simulations and optical results available within the project showed that, within the limits of the common fixed wall-temperature modelling assumption, reducing piston temperature to capture liquid film formation with early SOI timings is a practical and effective technique.
The injection of fuel from the head-mounted, five-hole injector was simulated using a Rosin-Rammler ‘initial’ fuel droplet size distribution, coupled with the Reitz-Diwakar model 65 for secondary droplets break-up. Simplified time-resolved profiles were used for injection mass flow rate, based on available experimental data. The calibrated values for the combined spray models are taken from previous work43,66 where optimisation techniques were used to match measured levels of spray tip penetration and mean droplet sizes corresponding to the same injector used during the experimental campaign. The initial droplets velocity is calculated internally based on hole diameter, discharge coefficient and experimental mass flow rate. The fuel model, the spray-wall interaction model and the liquid film model, along with their validation, are presented in the next section.
All simulations have been run on remote HCP cluster at the STFC Hartree Centre, exploiting the advantages of the latest computing technology (Bull Sequana X1000 super-computer with Intel SkyLake/Xeon). CFD solvers used for in-cylinder simulation are often power and memory intensive, due to the complexity of the problem (number of employed sub-models and on-the-fly meshing algorithm), requiring multiple compute cores and vast computational time. The software uses a ratio of the power at its disposal for computing the mesh at every crank angle/time step and the rest for model solving. A scalability investigation was carried out using a generic gas exchange and mixture preparation case, to find the best configuration of nodes, each comprising of 32 cores, to use for the simulations. A 3-node or 96-core configuration was deemed best, ensuring the quickest solution time – 36 h on average. Although the number of meshing cores can be as high as the available cores in one node, the best level was found to be 26.
The results from the CFD simulations have been analysed with a focus on quality of the mixture preparation process. Two homogeneity indicators are defined: the volume-based Uniformity Index of Equivalence Ratio,
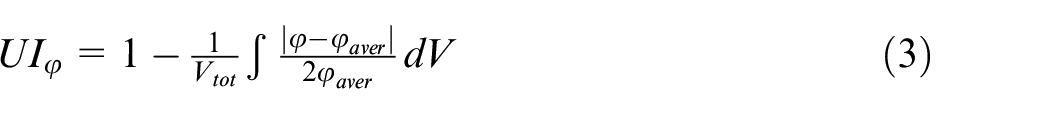
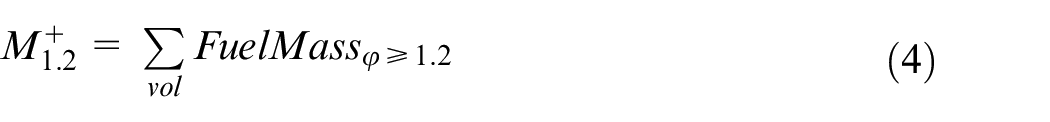
Similar indicators have been found to correlate with experimental levels of PN emissions in GDI engines.37,43 The 1.2 threshold for the equivalence ratio was chosen as it is the lowest value at which differences among distinct engine conditions can be appreciated.
As shown in Section 4, the analysis of results was also supported via 3D CFD images of spray, equivalence ratio and liquid film mass distributions, and via total liquid film mass plots, computed at relevant times along the engine cycle.
Experimental setup and data collection
An experimental investigation was carried out in order to characterise the emissions and performance of the engine. A schematic diagram of the engine test facility is given in Figure 4. A brief description of this is given below, and further details may be obtained from Parker et al. 67
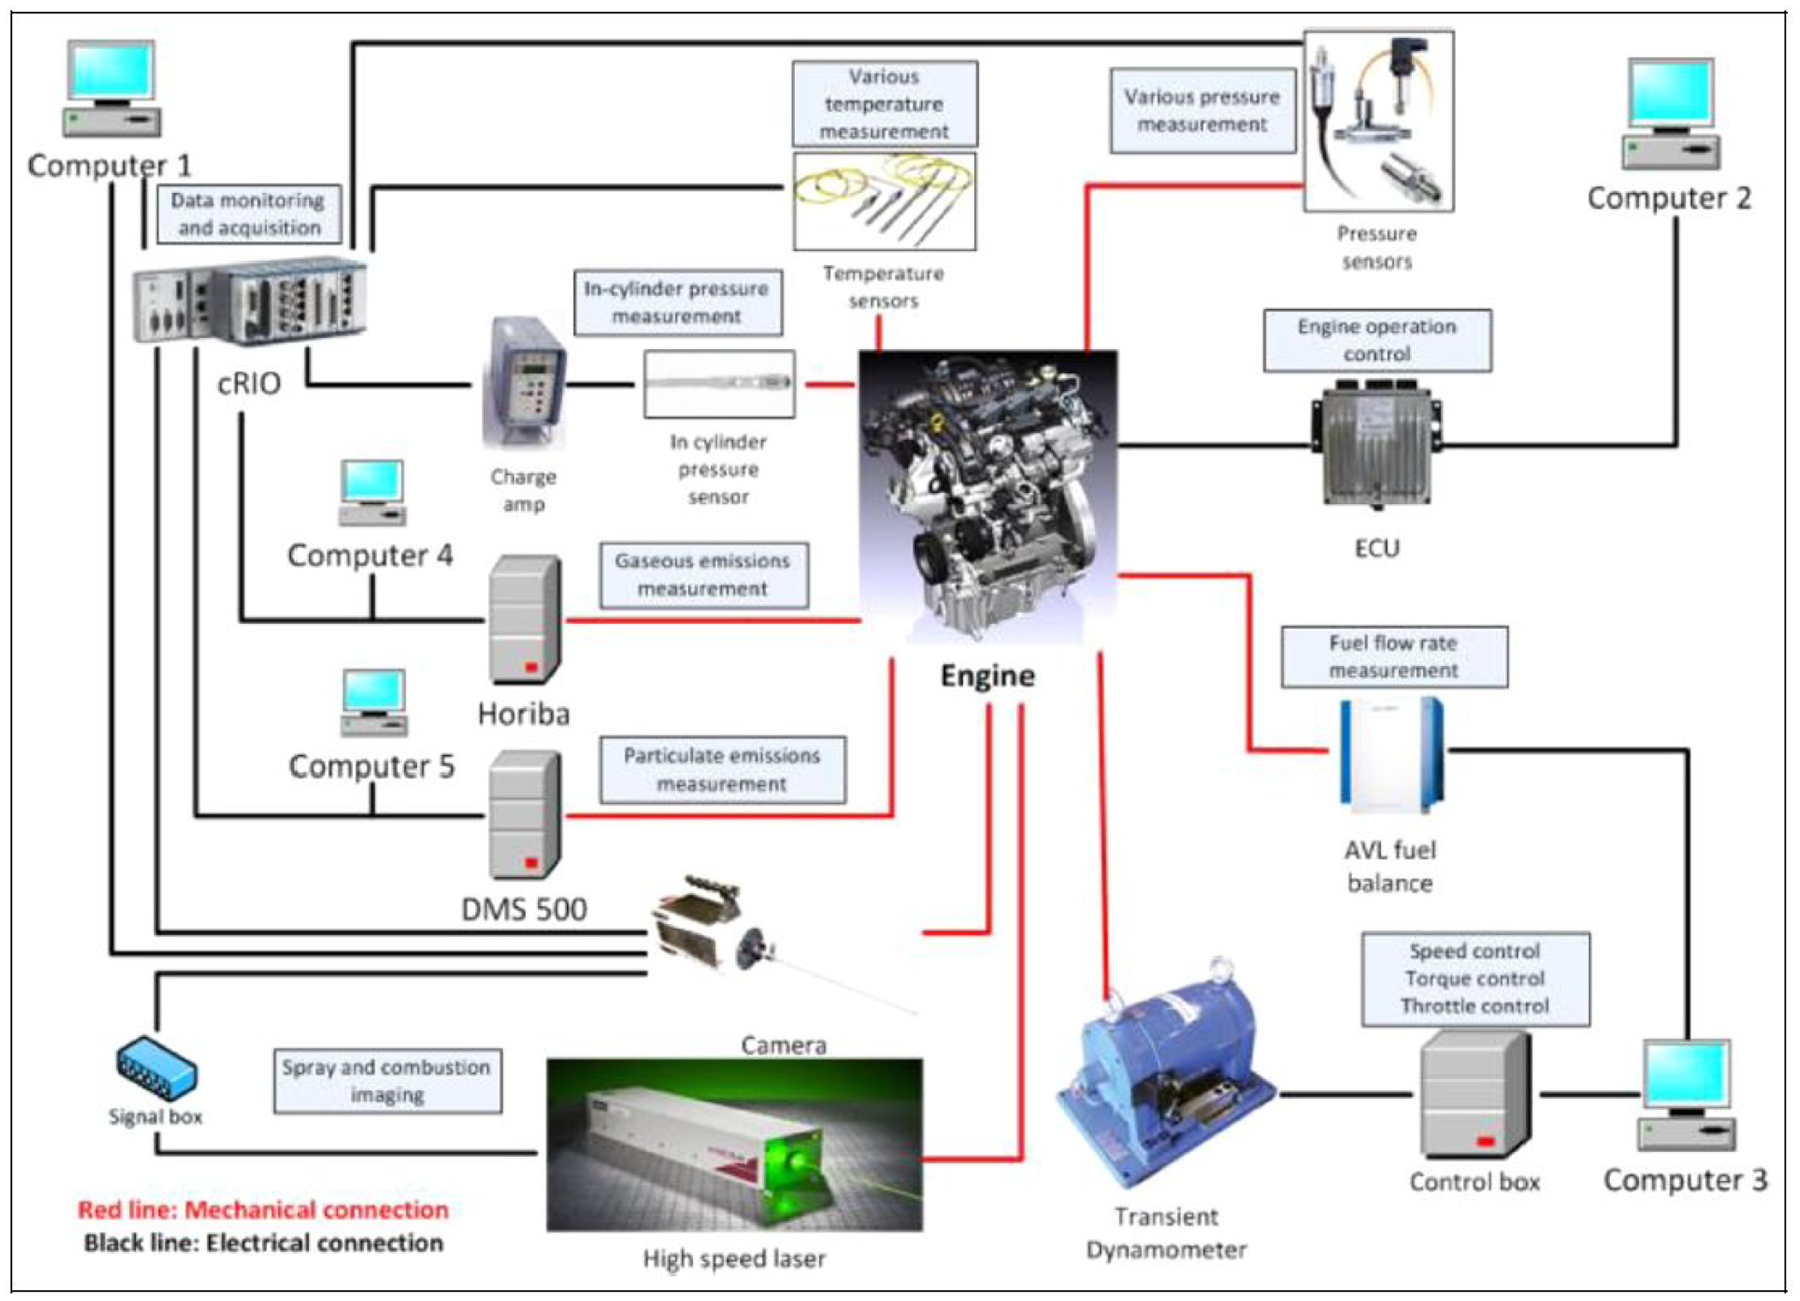
Test engine experimental setup. 67
As shown in Figure 4, the engine is connected to a dynamometer to allow the engine speed to be controlled and maintained within ±1 rpm. The fuel flow rate of this engine is measured using an AVL PD733S fuel balance at a frequency of 50 Hz. The fuel injection related close loop control is realised via an Engine Control Unit (ECU). The ECU is connected to the engine calibration software, ATI Vision, to allow engine parameters to be monitored, controlled and recorded on a computer. Other important engine parameters, such as temperatures and pressure, are measured using T-type thermocouples and GE pressure sensors. The data is logged using a National Instruments Compact RIO (cRIO) control and acquisition system at a frequency of 50 Hz. In-cylinder pressure is measured using a Kistler pressure transducer and the pressure data is logged into the computer via the cRIO system at 0.5 CA deg resolution. The gaseous emissions are measured using a Horiba Mexa-7100 at a frequency of 10 Hz, with sample removal of gaseous emissions after the engine turbine. The particulate emissions are sized using Cambustion DMS500 at a frequency of 10 Hz. The measurement point is at the exhaust runner of cylinder N. 1, which Is the engine cylinder used for CFD simulations. This set-up ensures that the true engine out particulate matter is measured to suit validation of the modelling work, where soot morphology has not been modified through the turbine for example. In order to dampen out the harsh pressure oscillation in the early exhaust manifold tract, enabling more repeatable measurements, 68 and to protect the equipment from the high pressure and temperature of the exhaust gas at this location, a constant pressure relief valve is installed in the middle of the sampling line between the engine and the DMS500 sampling head. Sampling line and remote cyclone temperatures are kept at 150°C. The primary dilution ratio of the DMS500 is set to 5:1, whereas the secondary one to 20:1. These settings minimise repeatability issues and allow for a more consistent signal to noise ratio across a wider range of particulate production rates. At all running conditions, the engine is allowed to stabilise thermally for at least 5 min to reach steady-state operation, before any data recording. Gas sampling and measurement are then operated for 5 consecutive minutes and each test point is repeated three times under nominally identical operating conditions.43,68 Average quantities from these 3 repeats are then calculated. The Cambustion DMS500 system produces a real time classification of particulate matter in the 5–1000 nm size range on the basis of particles’ aerodynamic drag-to-charge ratio. In this study, the recorded data was processed via the manufacturer software to obtain levels of total number and mass concentrations, and average particle size.
Optical observations were also carried out, limited to one operating condition (Case A in Table 2), inside cylinder N.1 using a laser-illuminated borescope imaging system. This allowed capturing 10 KHz high-speed video of the spray and combustion events on the production engine (without geometrical modifications) under real thermal conditions. Specific details of the borescope system can be found in reference. 67
Surrogate fuel, spray-wall interaction and liquid film modelling
Multi-component surrogate fuel blend development
A new surrogate fuel blend model was developed to match the relevant properties of the E5 RON95 gasoline test fuel used in the parallel experimental campaign. A Detailed Hydrogen Analysis (DHAX) was carried out in order to establish the hydrocarbons composition of the test fuel and its distillation curve was built using the experimental data acquired using the ISO 3405 method. 69
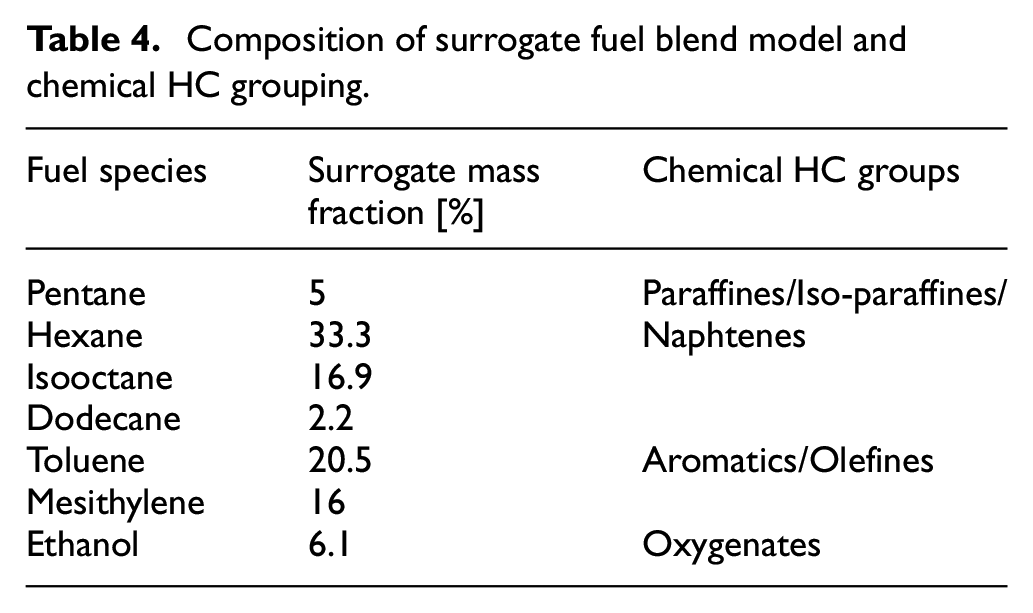
Limited by the availability within the software, the species for the surrogate blend were selected to match as closely as possible the distillation curve, using the least number of components. The hydrocarbon analysis was used to determine the global mass fraction for the main chemical groups such as Paraffines/Isoparaffines, Olefines, Naphtenes, Aromatics and Oxygenates. Then, groups were combined together according to their sooting tendencies. Lastly, the final mass fractions, reported in Table 4, were optimised to match the distillation curve. In Figure 5, the experimental (red) distillation curve is plotted along with the surrogate model’s (green), showing a good alignment between real gasoline and the developed seven-component fuel blend.
Composition of surrogate fuel blend model and chemical HC grouping.
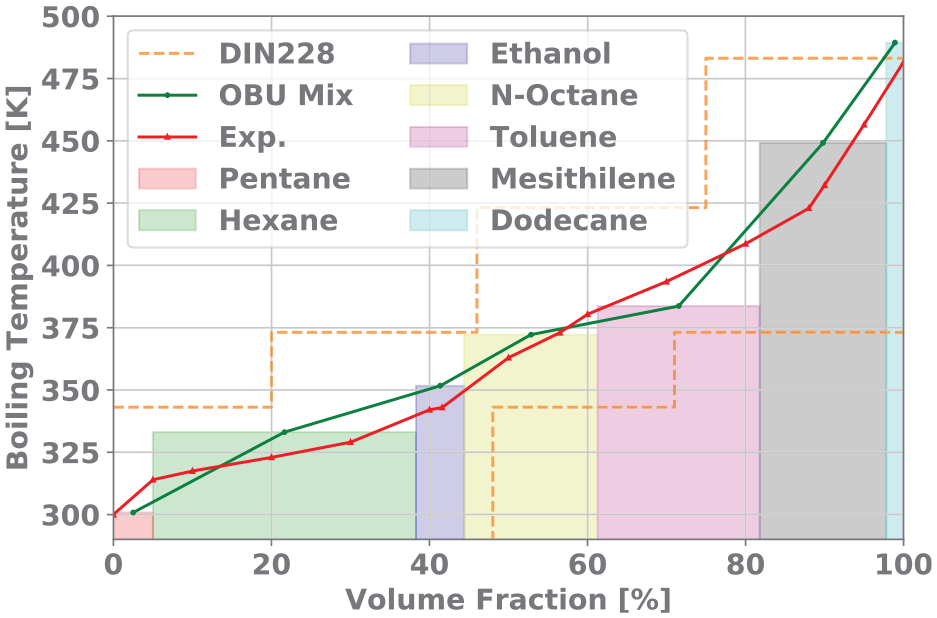
Comparison between the distillation curves of the experimental fuel (Exp.) in red and surrogate model (OBU Mix) in green.
Toluene and Mesitylene are used as representative of aromatics and olefins and mid-high range less-volatile species. Pentane, Hexane and Isooctane are used as highly-volatile hydrocarbons. Dodecane covers the low-volatile part of the distillation curve. The mass fraction of Ethanol has been kept the same as in the real E5 test fuel.
Assessment of spray-wall interaction and liquid film models
The Bai-Onera model was selected to emulate the mechanism of spray-wall interaction.
51
For every species, the Nukiyama temperature is modelled as the boiling temperature multiplied by a constant

Introducing the definition of
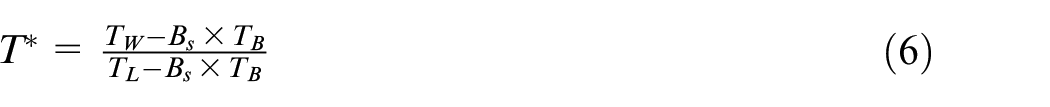
From equation (6), two reference
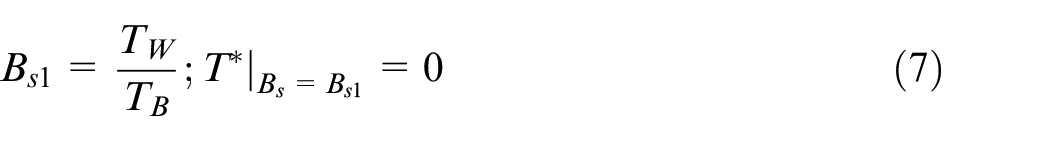
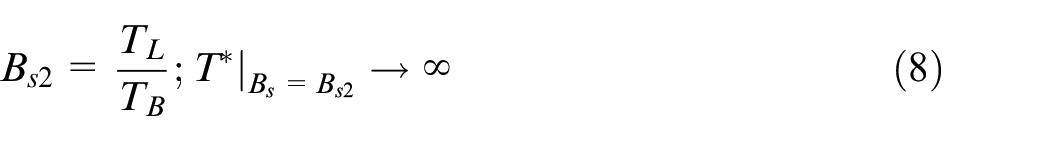
Figure 6 presents the relationship between
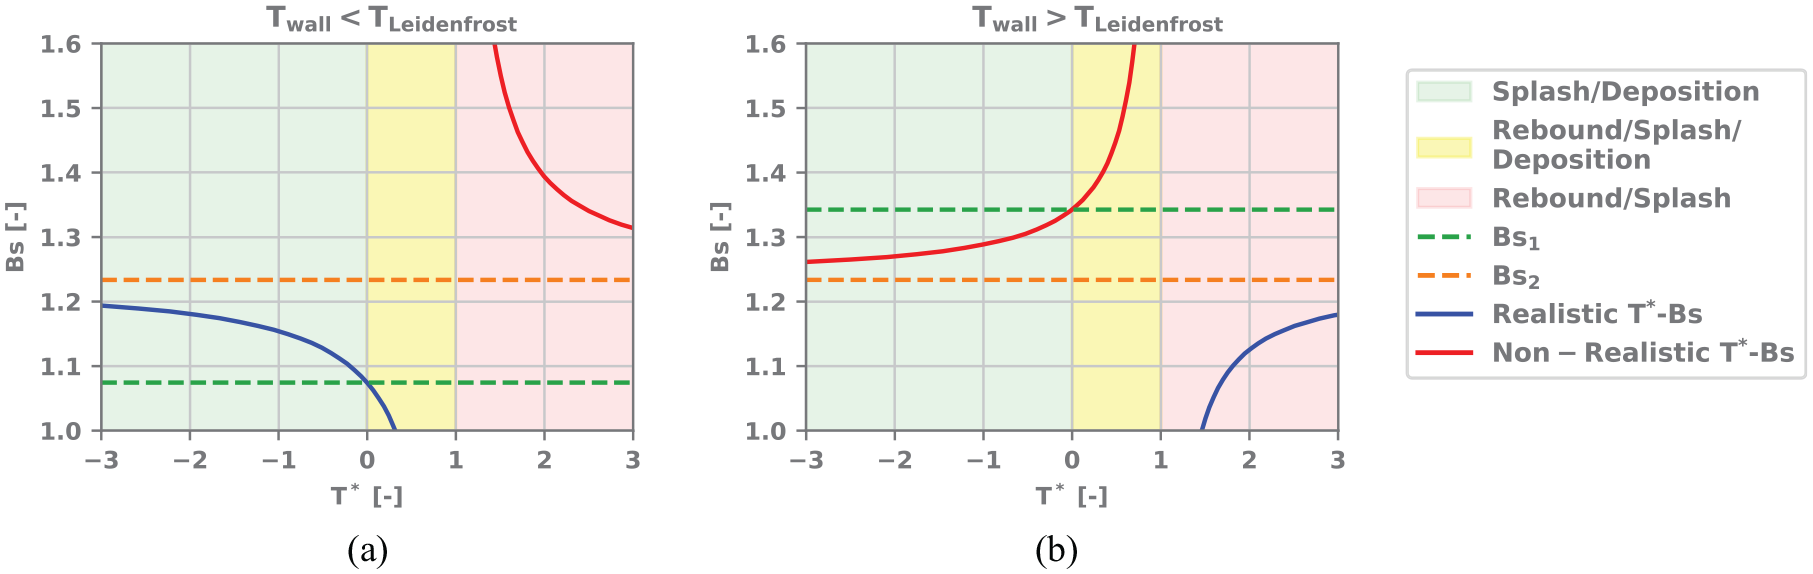
Diagram of
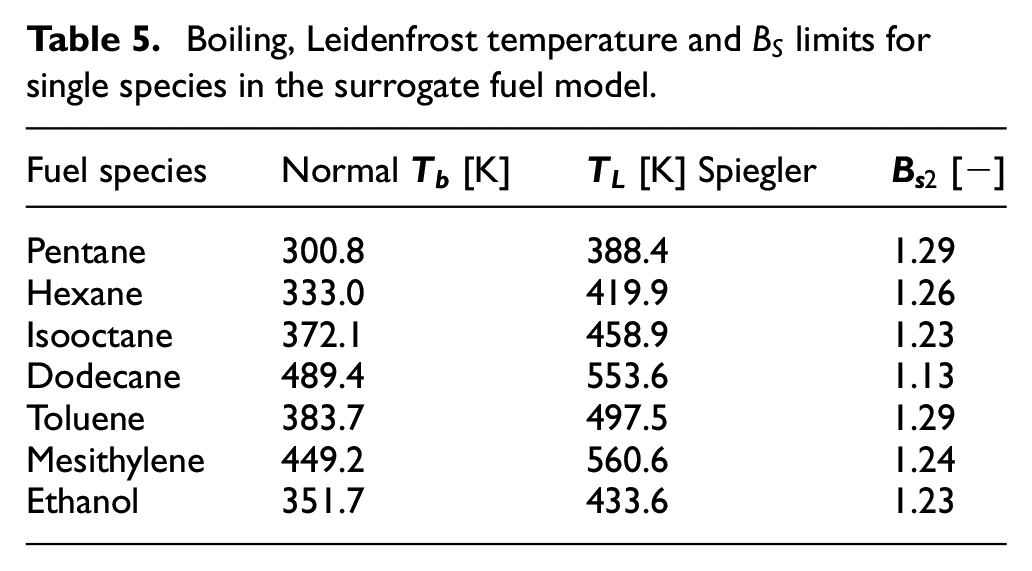
Having established the approach to identify a suitable range for
Boiling, Leidenfrost temperature and

Validation of approach and model calibration
The approach and the underlying assumptions described above, have been validated and verified against published results. Two studies were chosen, which address reasonable ranges of wall temperature, injection pressure and SOI timings, relevant to GDI engine operation.
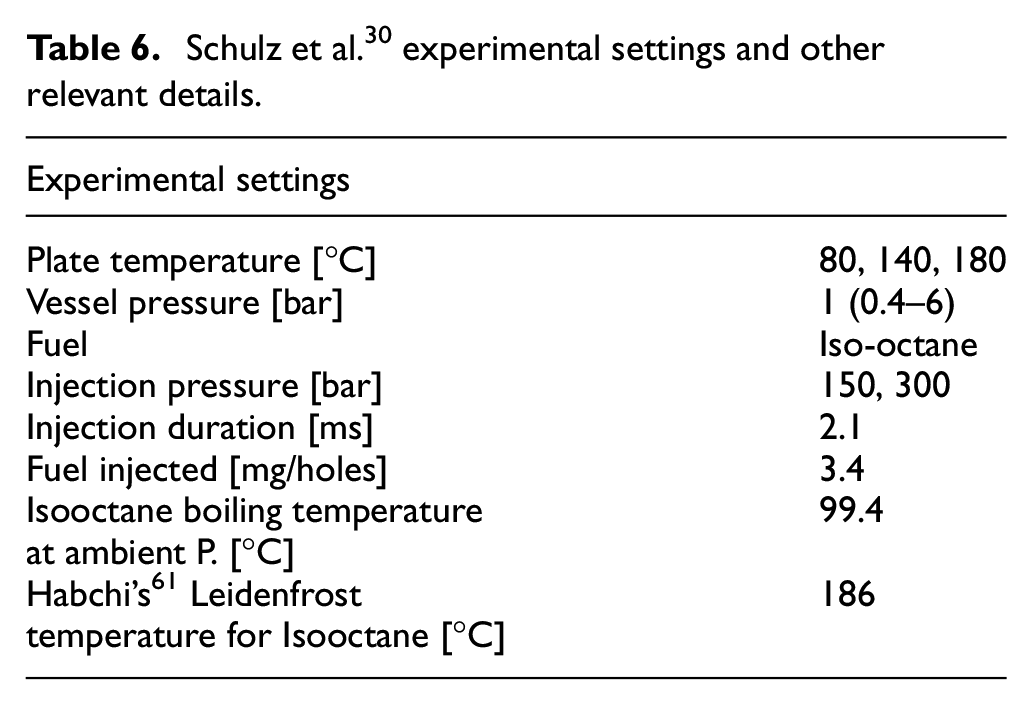
The first validation and calibration exercise is based on the experimental work of Schulz et al., 30 which investigates the influence of wall temperature and ambient pressure on the liquid film deposition on a quartz plate subjected to an iso-octane fuel spray. The study uses a 6-hole GDI injector and tests different combination of injection pressure, plate temperature and vessel pressure in order to replicate various engine operating conditions (from homogeneous to stratified charge mode). The temperature of the quartz plate is controlled and kept at constant levels; the mass of liquid film is measured using laser-induced fluorescence. Table 6 summarises the details of the experimental settings and other relevant quantities. Liquid film mass retained over the quartz plate at 5 ms after SOI, was recorded for the injection pressures of 150 bar and 300 bar, using three levels of plate temperature, 80, 140 and 180 °C, respectively. Further experiments were carried out at fixed plate temperature of 80 °C and increasing vessel pressure between 0.4 and 6 bar. All results were reported as average of seven experiment repetitions, but no uncertainty levels were provided. To reproduce the work of Schulz et al., 30 a cylindrical volume mesh with appropriate refinements was developed and the spray model calibrated to match the given experimental levels of SMD and D10 of the droplets size distribution at 150 bar, 11 μm and 8 μm respectively. For the 300 bar injection, experimental droplet sizes were not available, but the spray model was altered to reflect the expected enhanced atomisation.
Schulz et al. 30 experimental settings and other relevant details.
In Appendix 2, a detailed analysis of the impact of calibration factor
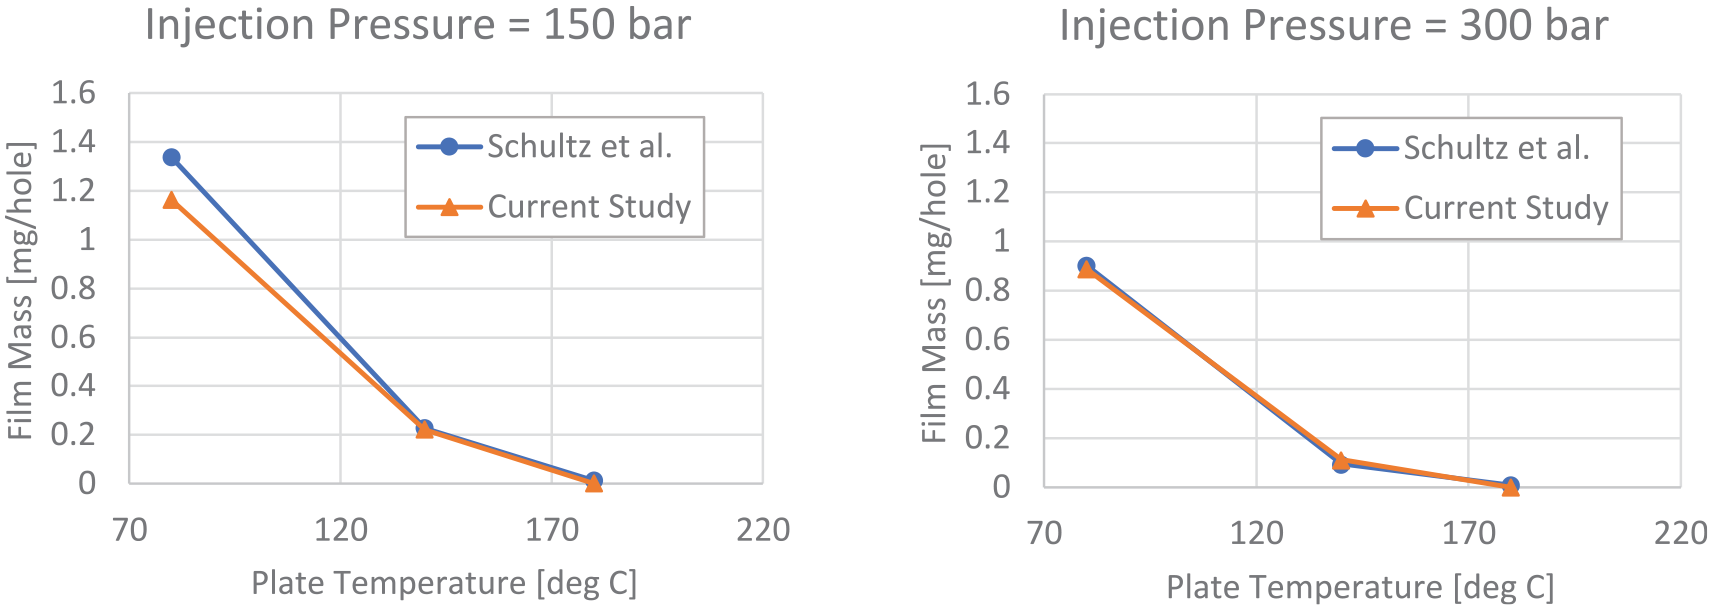
Liquid film mass comparison between the current study and measurements 30 at 150 and 300 bar injection pressure (vessel pressure of 1 bar).
A sweep of vessel pressure was also carried out, as reported above, to further assess the generality of the model. Optimal levels of the calibration factor
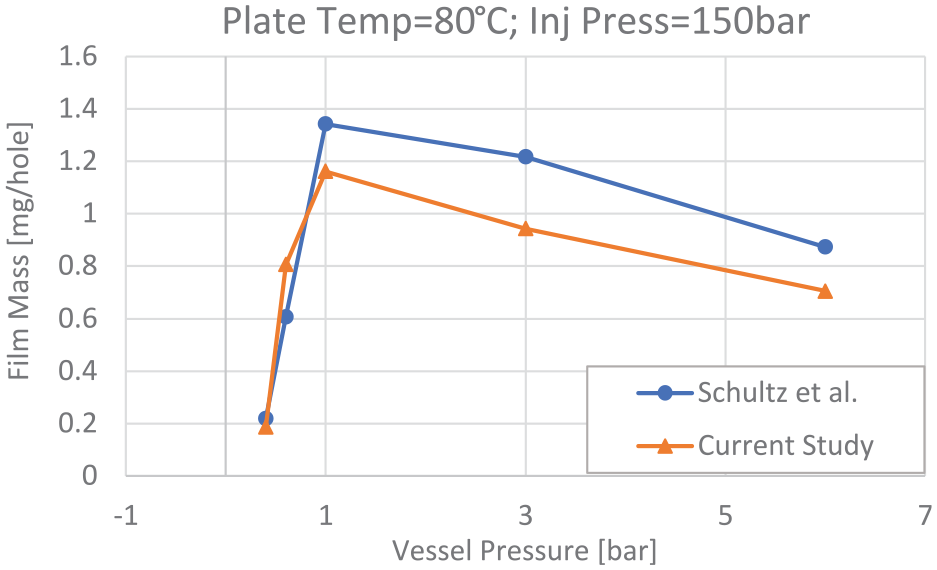
Liquid Film mass comparison between the current study and measurements 30 with plate temperature fixed at 80°C and increasing vessel pressure.
The results of the validation and calibration exercise provide improved details on the calibration factor
The second exercise presented here is used as a further verification of the proposed modelling approaches, and it is based on the work of Kim et al., 31 which is engine-based and investigates the correlation between mixture quality and soot precursor species using a validated 3D CFD model. Kim’s study covers the effects of variable intake-stroke SOI timing at fixed mid-speed/mid-load operating conditions, in a modern small-capacity spray-guided GDI engine. The data from Kim et al. 31 used here for model comparison and verification are summarised in Table 7.
CFD settings for the replication of the work of Kim et al. 31
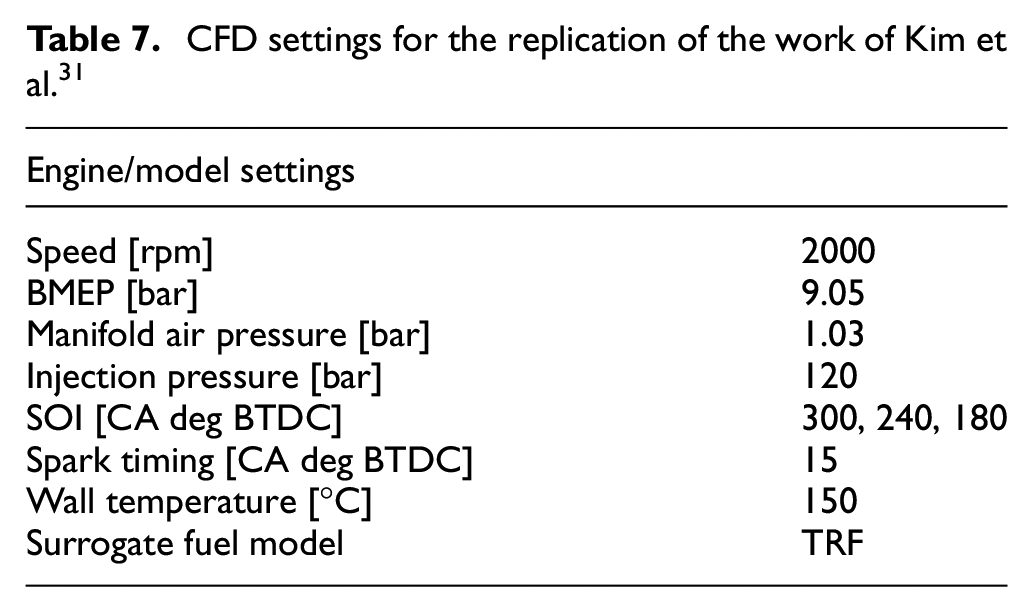
A 3-component Toluene Reference Fuel was used by Kim et al. 31 as surrogate fuel model, and this was coupled with a chemical kinetic scheme to evaluate the formation of species like Acetylene and Pyrene. In this verification study, Kim et al.’s CFD work was replicated as closely as possible, based on the available data. Figure 9 shows the comparative results in terms of normalised liquid film mass as a function of crank angle location.
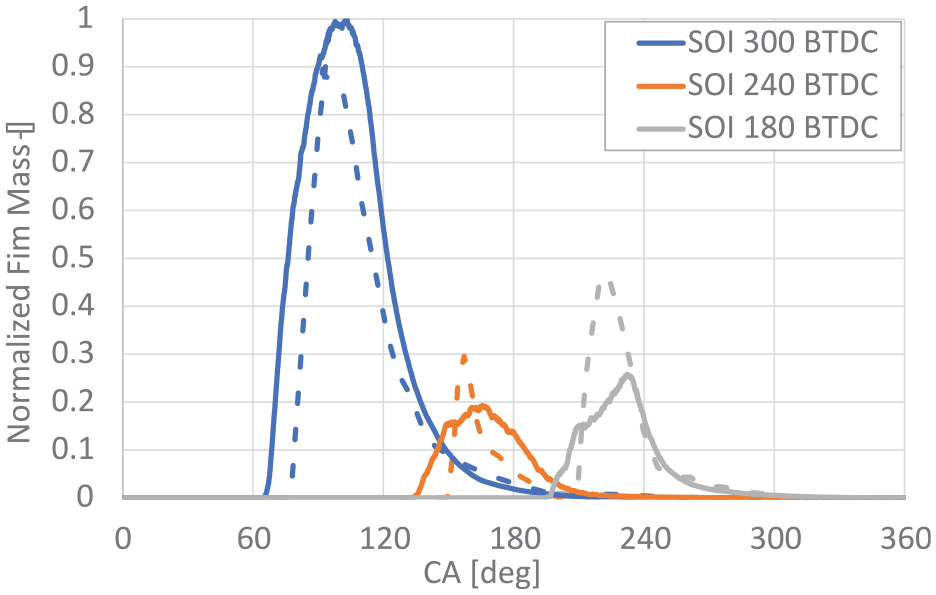
Normalised liquid film mass profiles as a function of Crank Angle deg; comparison between present work (continuous lines) and results by Kim et al. 31
The continuous lines refer to the present study, where the value of
Model application: results and discussion
The validated methodology is herein applied to two limited parametric studies to investigate the influence of SOI timing and injection pressure (Fuel Rail Pressure, FRP) on mixture preparation mechanisms, and how these in turn affect the engine-out PN emissions.
Variation of SOI timing
This section discusses the effects of SOI. For clarity and brevity, the operating conditions considered here include only three SOI settings: an early SOI of 330 (or 325) CA deg BTDC, the so-called calibration or baseline SOI (approximately mid-way through the intake stroke) and a late SOI of 180 CA deg BTDC. The parametric study has been carried out under two different steady-state fully-warm engine conditions, Case A and Case B reported above in Table 2 (3000 rpm–85 Nm and 2000 rpm–50 Nm, respectively).
The experimentally measured levels of engine-out total particle number density (PN) are reported in Figure 10. Case A features higher engine torque and speed than Case B. On the account of higher mass of fuel injected, Case A produces generally greater levels of PN emissions. The data in Figure 10 also demonstrate how strong an impact SOI exerts on PN: in Case A, PN varies across three orders of magnitude between 105 and 108 #/cc; in Case B, across two orders of magnitude, 104 to 106 #/cc. The lowest level of PN emissions corresponds to the baseline/calibration SOI for both operating conditions, as expected. The influence of early SOI (piston close to its intake TDC position) is consistently greater than that of late SOI (piston close to its intake BDC position), but essentially any deviation from the baseline start of injection would lead to a sub-optimal mixture quality and, in turn, much higher levels of PN.19,20 The details of these mechanisms can be explained by means of CFD analysis.
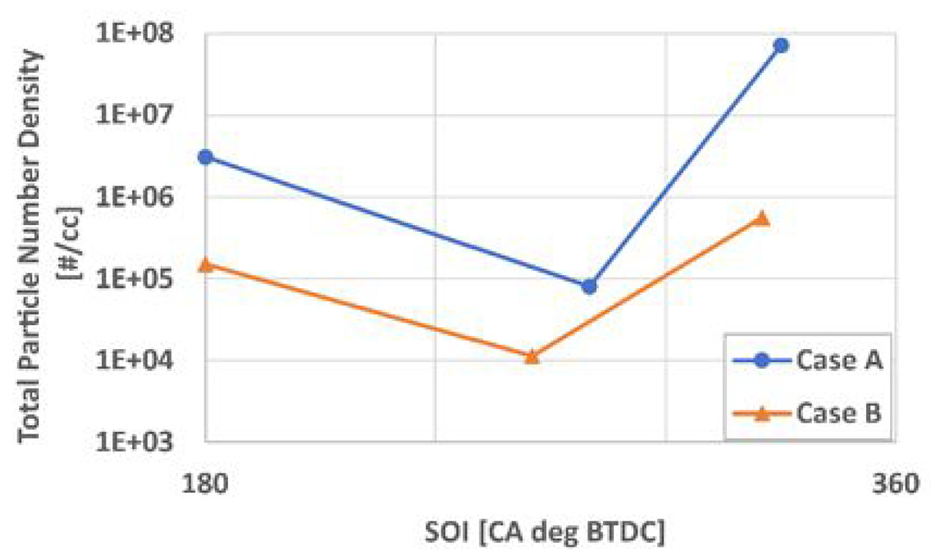
Total particle number density as a function of SOI, for Case A (3000 rpm–85 Nm) and Case B (2000 rpm–50 Nm).
Figure 11 provides a comprehensive account of the process of mixture preparation for Case A, through a combination of CFD-generated images of spray, equivalence ratio distribution and retained liquid film thickness distribution, at various relevant locations along the engine cycle. In Figure 11, the column of the left refers to late SOI (180 CA deg BTDC); the central column to baseline SOI; and the column on the right refers to early SOI (330 CA deg BTDC). At spark timing, no liquid film is seen on any other chamber surface than the piston. A qualitative analysis has shown that the two engine operating conditions considered in this study (Case A and B) demonstrate similar features, confirming that – consistently with the emission data of Figure 10, the SOI timing is the dominant effect on mixture preparation; the corresponding results for Case B are given in Appendix 3, Variation of SOI – Further Results, Figure B1. In a direct injection engine, SOI effectively changes the amount of time available for the fuel droplets to evaporate and mix with the air flow.19,20 with early SOI allowing extended time. At SOI = 330 CA deg BTDC, as shown in Figure 11, the equivalence ratio is comparatively well distributed already half-way through the compression stroke and, at spark timing, presents a large near-stoichiometric (slightly lean) region across the central part of the combustion chamber. In spite of that, the early SOI timing causes the highest level of liquid film deposition and spark timing retainment. As evident from the associated spray image, due to the small piston-nozzle distance during injection, fast and big droplets within the spray are bound to meet the piston surface in the bowl area almost immediately after being released. The droplets either adhere or, due to the high velocity, rebound and reach the dome and cylinder liner. The localised cooling effect29,37 from the impinging liquid spray favours adhesion, generating (as shown by the liquid film image) a thick film rich in mostly heavy aromatic components, 35 which extends across the piston crown from the bowl to the exhaust valve pockets. As reported in the Methodology section, the cooling effect which takes place for early SOI timing is captured in the CFD modelling by pre-emptively setting an appropriately-reduced level of piston surface temperature.
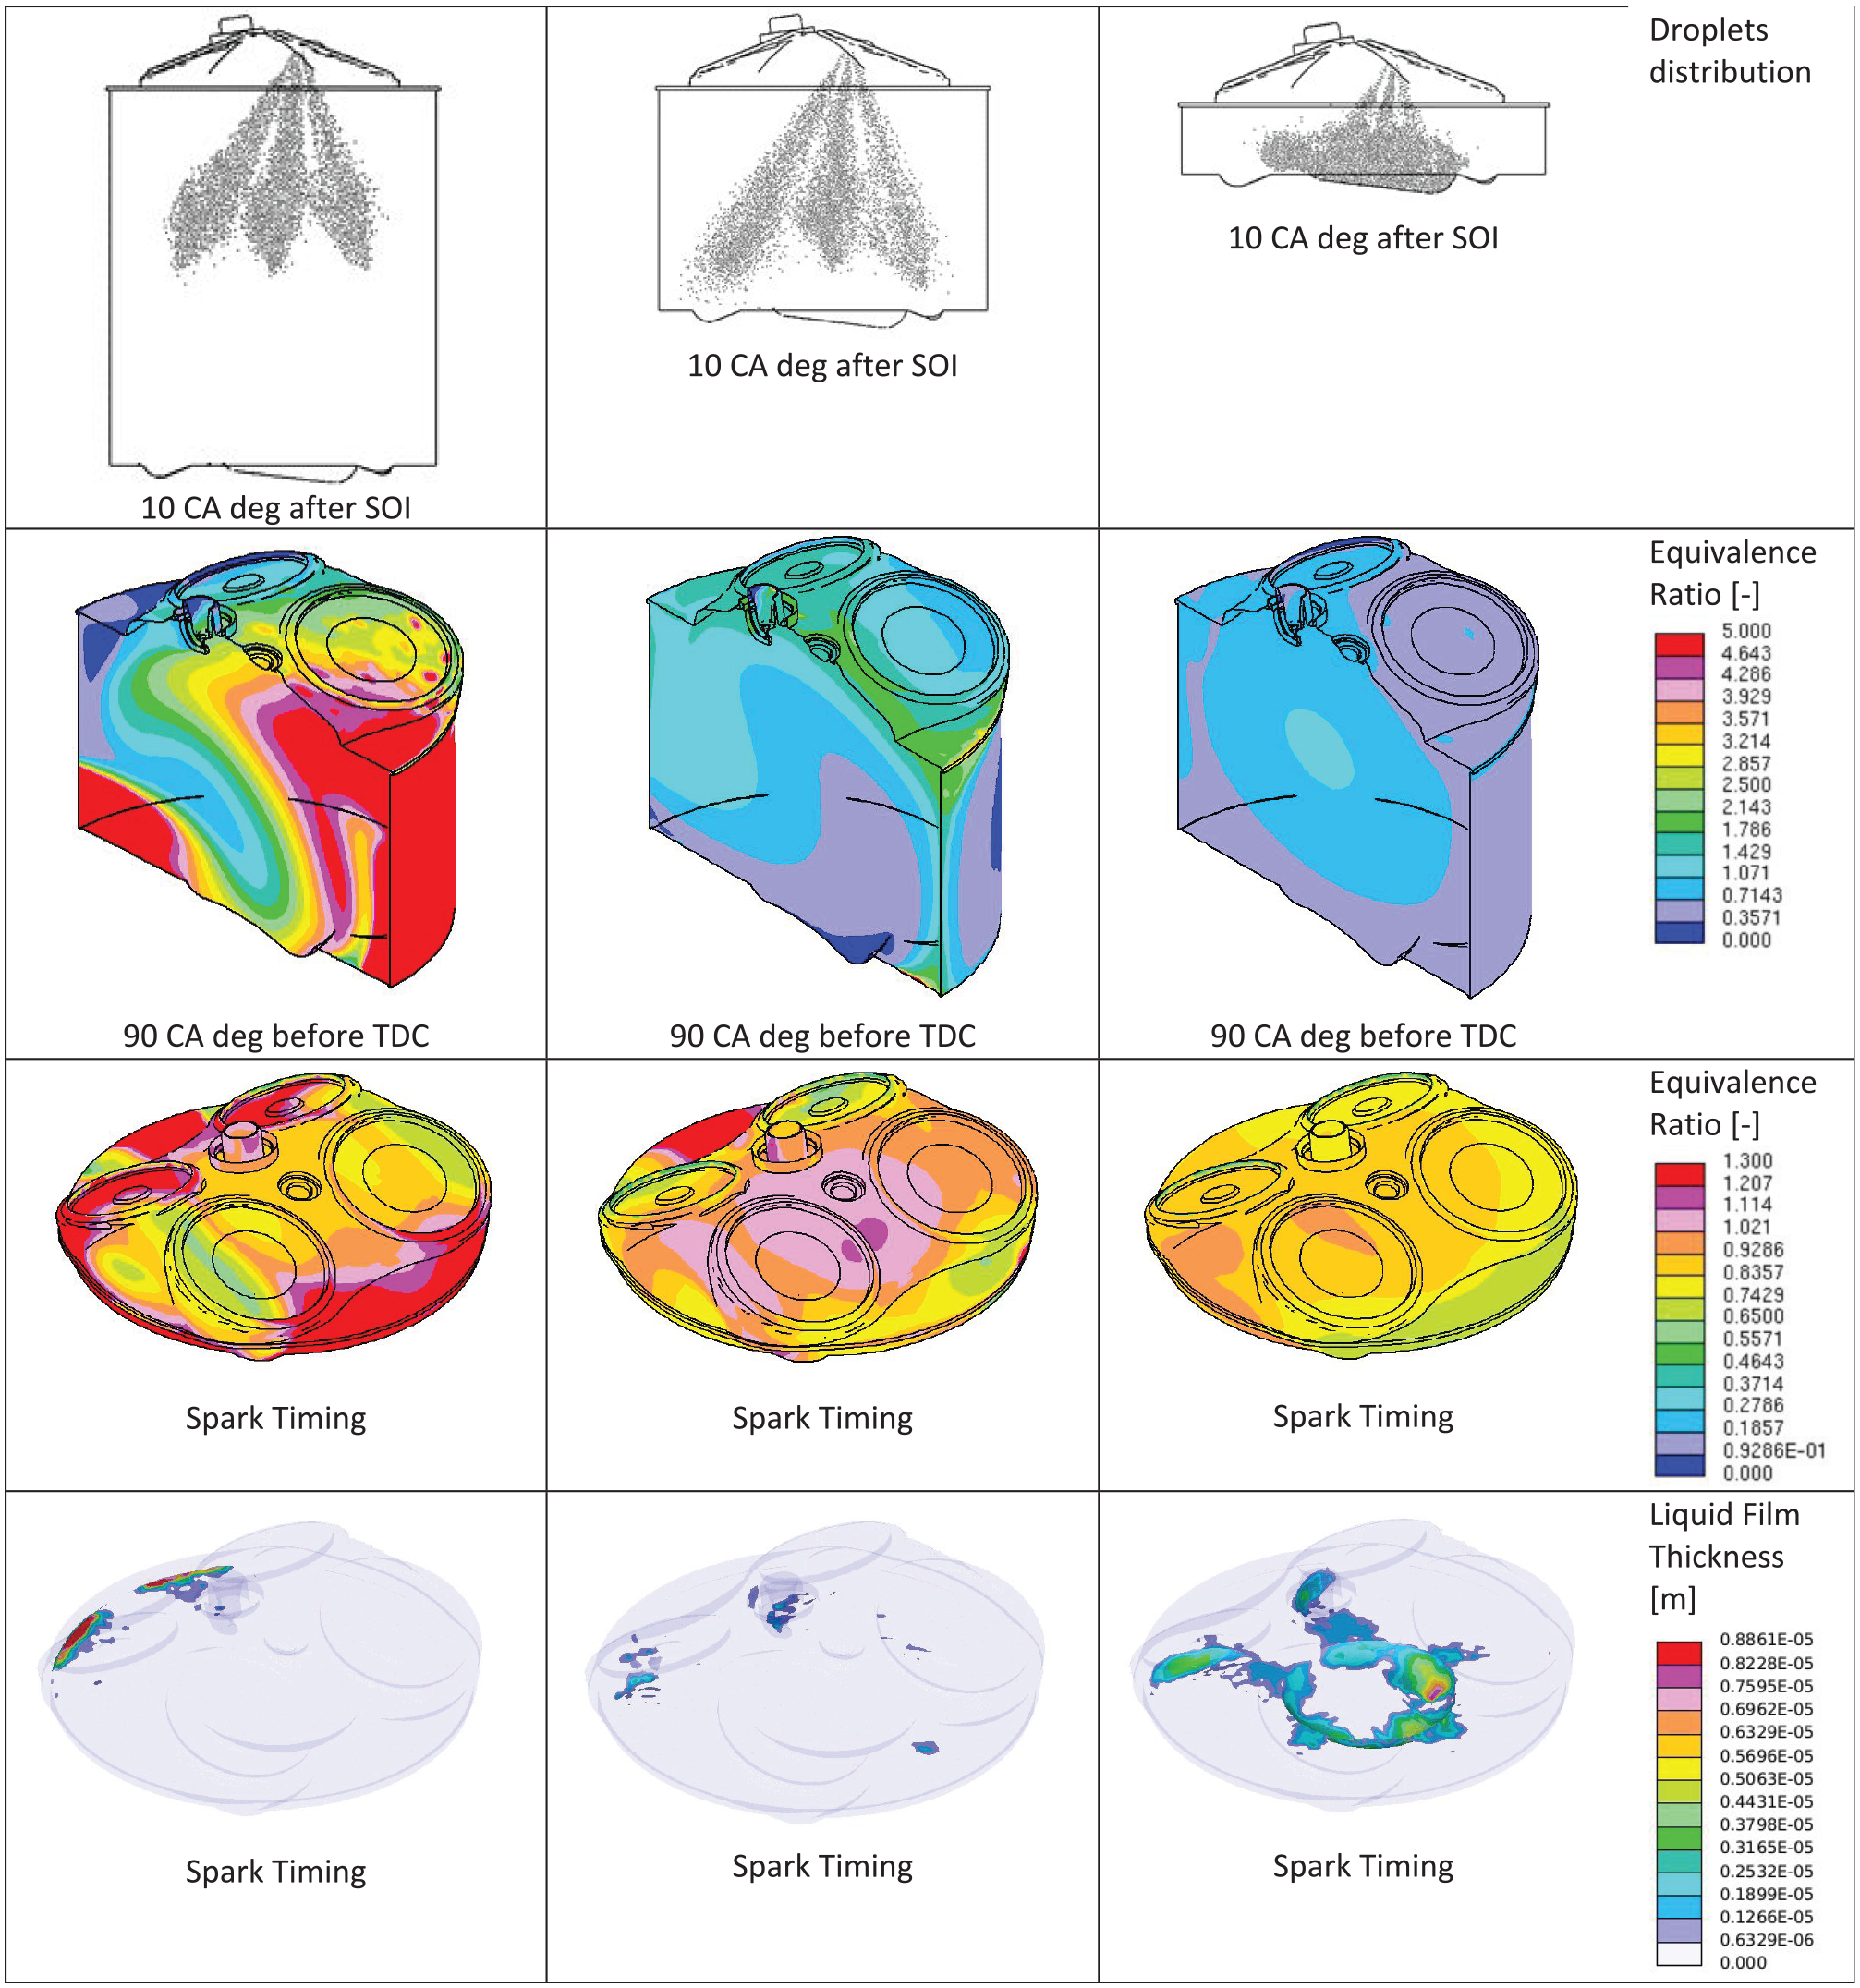
Images of spray, equivalence ratio distribution and liquid film mass distribution at various cycle locations, for Case A. Column of the left refers to late SOI (180 CA deg BTDC); central column refers to baseline SOI; column on the right refers to early SOI (330 CA deg BTDC).
As shown in Figure 11, any injection timing retarded from 330 CA deg BTDC reduces the available mixing time and hence degrades the distribution of gaseous fuel, leading – by the time combustion commences, to fuel rich concentrations around the chamber periphery and especially in the squish region-exhaust side. At these later SOI timings, the fuel droplets encounter a wider empty space as the piston is moving downwards in the intake stroke; the spray can expand enough to impinge on the liner and, as evident from the images attached to the SOI = 180 CA deg case, can also be pushed to one side by the force of the tumble motion generating fuel-rich regions either side of the chamber during the compression stroke. Although the wider spread of the spray precludes or limits the direct formation of liquid paddles on the piston, film may form over the cooler liner walls, to eventually transfer to the piston periphery and crevice region by the piston’s upward film-collecting motion during the compression stroke. This is mostly seen, as expected, in the liquid film mass distribution images for the latest SOI timing of 180 CA deg BTDC, where thick liquid deposits accumulate on the crevices-exhaust side, at the time of ignition.
In Figure 12, overall mixture preparation quantities for Case A, including liquid film peak mass and spark timing levels, and gas-phase mixture quality indicators calculated at spark timing, are presented to support the analysis. The corresponding results for Case B are given in Appendix 3, Variation of SOI – Further Results, Figure B2. At the earliest SOI timing, the Uniformity Index of Equivalence Ratio for Case A is as high as 96.5%, indicating a rather homogeneous, well-prepared gas-phase mixture.
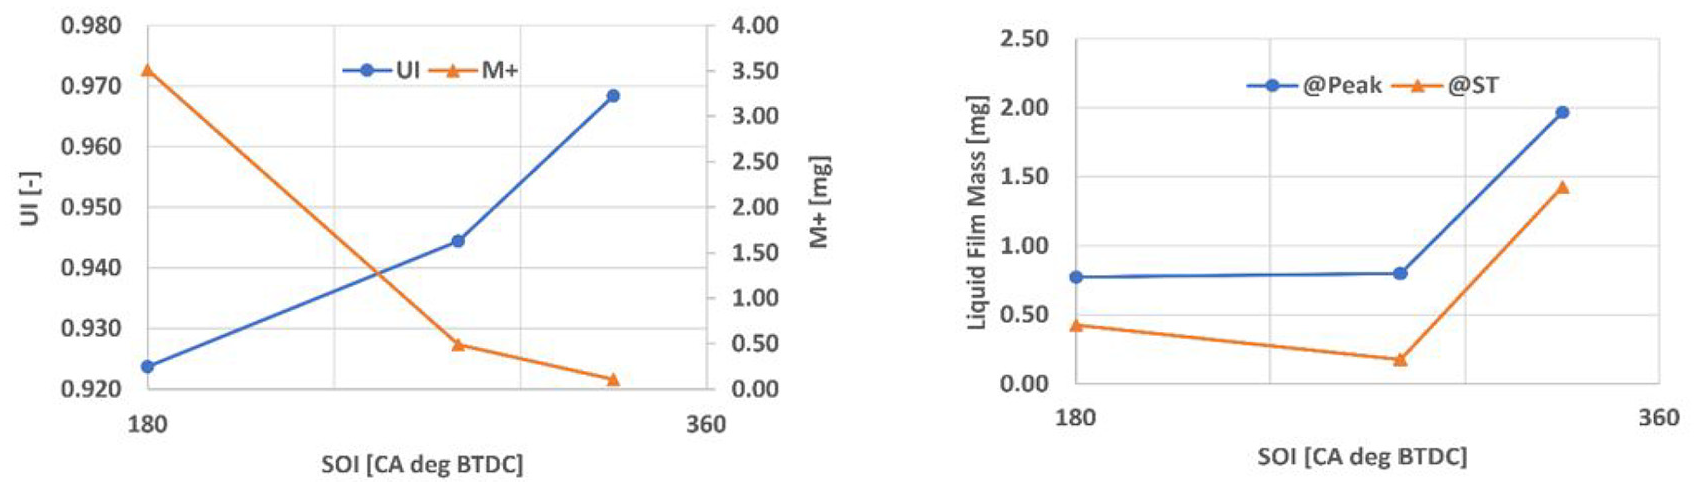
Global mixture preparation indicators for Case A; Top plot: Uniformity Index of Equivalence Ratio and
The other quality indicator,
The second plot in Figure 12 shows the total mass of liquid film accumulated during injection and not evaporated before combustion. The two quantities, peak and spark timing levels, show roughly the same trend, indicating a consistent level of film-to-gas evaporation. The minimum spark timing level of liquid film mass is non negligible at 0.17 mg. As seen with the gas-phase fuel distribution, also the liquid film data suggest a rapid degrading of the mixture preparation process as the injection takes places earlier than the baseline setting.
Referring to Case A only, Figure 13 presents a qualitative comparison between CFD-generated images and corresponding snapshots from experimental borescope videos, for the three SOI timings investigated. The CFD quantities includes liquid film distributions at the time of ignition and, where relevant, iso-surfaces of Equivalence Ratio, with
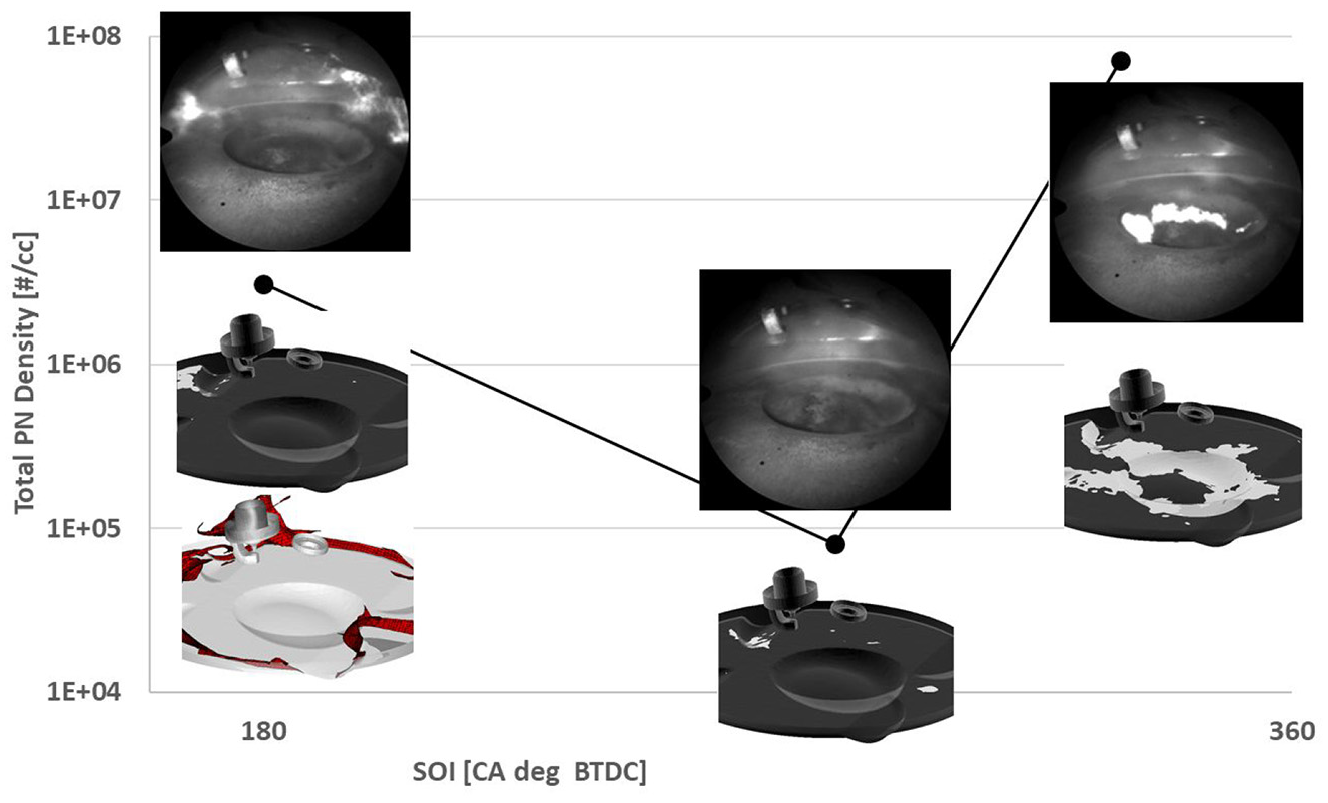
Total PN density versus SOI plot for Case A (3000 rpm–85 Nm); superimposed to it, images from borescope videos of the combustion process, corresponding to MFB90, and CFD images of liquid film and Equivalence Ratio iso-surfaces (
In the late SOI timing case, strong luminosity is seen in the illuminated side of the chamber periphery, where CFD predicts rich mixture accumulation from both imperfect mixing and potential evaporation of liquid film. From the borescope image is not clear whether the luminosity is solely associated to rich gas-phase diffusive burning or to a combination of rich combustion and pool fire. These mechanisms would also favour those chemical reactions which move towards the formation of soot precursors like Acetylene and Polycyclic Aromatic Hydrocarbons (PAH), leading once again to high levels of particulate matter.
In the calibration SOI case, consistently with the CFD results, the borescope image does not indicate the presence of visible sooting mechanisms. The CFD-generated data, supported by the experimental evidence, demonstrate that the baseline (or calibration) injection timing allows, at the same time, acceptable gas-phase homogeneity and minimal liquid film over the piston at spark timing. In particular, at baseline conditions, the spray largely avoids meeting the liner walls and the vast majority of formed film manages to evaporate over the hot piston surface. For a given engine geometry and control setting, this is the optimal mixture preparation compromise as reflected by the minimum levels of PN measured experimentally. The results presented in Figure 13 clearly indicate that the proposed CFD modelling scheme gives reasonably accurate results and can be used with confidence to support engine development or diagnostics.
While formation and retainment of liquid film are undoubtedly detrimental mechanisms which must be minimised, the specific composition of liquid film is also very important, as it ultimately determines the extent to which liquid film contributes to PM formation during combustion. In terms of modelling, given the current limitations of the fuel species databases available for combustion and chemical kinetic modelling in commercial software, a detailed analysis of the liquid film composition and the ability to group the species according to sooting tendencies, are also very important. Figure 14 reports the liquid fuel composition, in terms of mass fractions of the various components, at the time of injection (i.e. as the fuel exits the injector nozzle), and within the liquid film at the instant of peak liquid film mass and at spark timing. The bar chart refers to Case A and SOI = 330 CA deg BTDC; all other cases are not reported here as they show similar features.
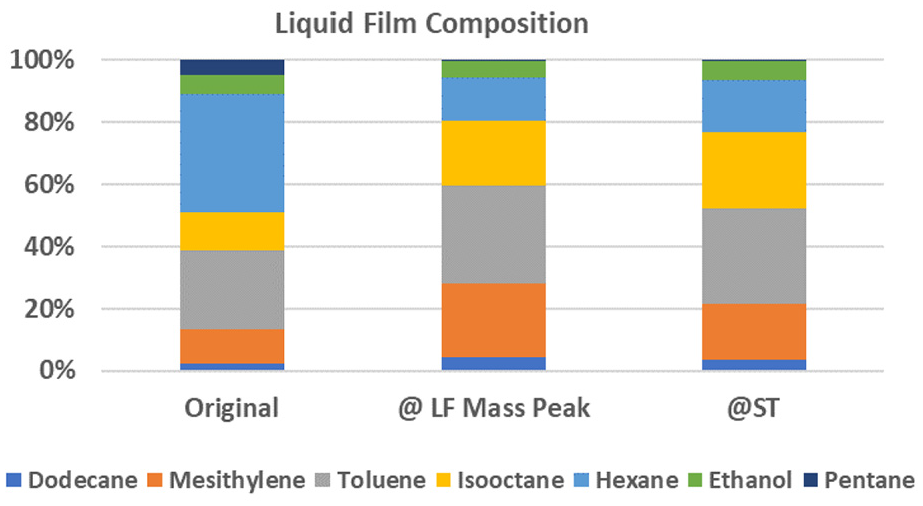
Original fuel and liquid film species mass fractions, for Case A and SOI = 330 CA deg BTDC.
The heavier components are disposed at the bottom of each bar within the chart. As it stands out, the fuel loses a large proportion of its non-oxygenated light species right after injection. At liquid film peak, which approximately coincides with the end of injection, almost 60% of the Hexane and the vast majority of Pentane are already in gaseous form. The Ethanol fraction changes only slightly, most probably due to the higher latent heat of vaporisation. The heavier species, like Toluene and Mesithylene, make up 60% of the deposited liquid mass at liquid film peak, and this reduces to about 55% at spark timing. During combustion, the propagating flame front would lap liquid paddles which are made up, predominantly, of aromatic species of high sooting tendency. 70
Variation of Fuel Rail Pressure (FRP)
In this case study, Fuel Rail Pressure was swept between 50 and 200 bar across two steady-state fully-warm running conditions, Case C and D reported in Table 2 above (2165 rpm–61 Nm and 2500 rpm–100 Nm, respectively). The total soot particle number densities measured at engine-out are shown in Figure 15. The trends of PN variation are generally as expected, with lower PN emissions released as FRP increases;29,30 the impact of FRP is however minor when compared to the SOI’s. PN is of the order 104 #/cc in the lower load case (Case C) and, as FRP varies from 50 to 200 bar, it shows only a three-fold reduction mostly concentrated across the 50-to-100 bar FRP step. PN is of the order 106 #/cc in the higher load case (Case D) and reduces approximately two-fold across the full range of FRP variation.
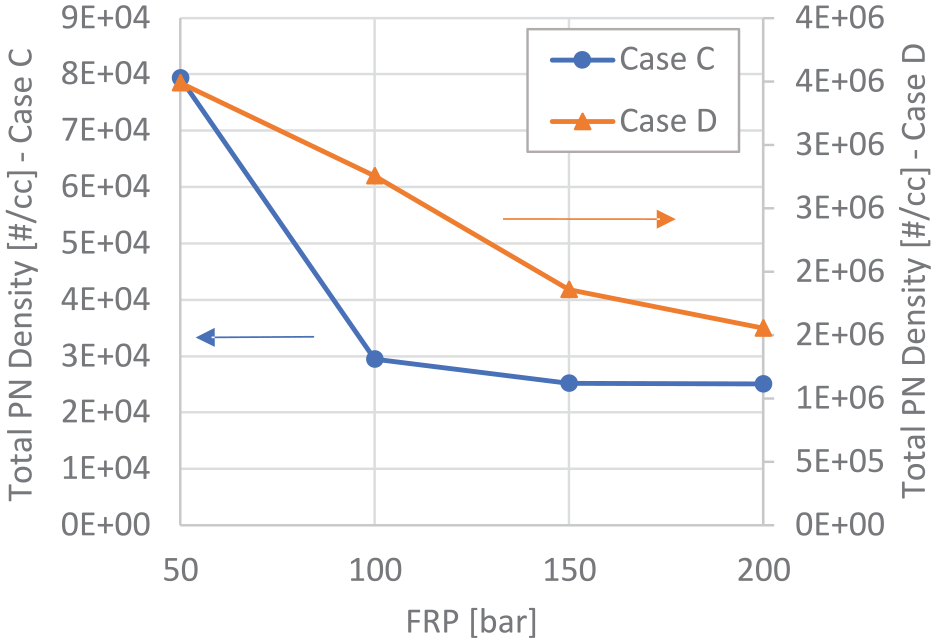
Engine-out total PN density as a function of FRP, for Case C (2165 rpm–61 Nm) and Case D (2500 rpm–100 Nm).
The minor FRP effects unveiled by the analysis of the experimental PN data suggest that, for the small-capacity engine used in this work, the influence of FRP on mixture preparation, including liquid film formation, may not be straightforward. On the one hand, greater FRP improves air-fuel mixing due to enhanced spray droplets atomization and allows longer mixing time due to shorter injection duration. On the other hand, at given chamber temperature and pressure, the initial droplet velocity also increases generating greater liquid spray penetration and, in turn, greater likelihood of spray-to-wall impingement.
Spray images, equivalence ratio distributions and liquid film thickness distributions at relevant locations along the engine cycle are reported in Figure 16, for Case C. Moving from the left to the right column, the Fuel Rail Pressure (FRP) grows from 50 to 200 bar. The corresponding results for Case D, which show similar characteristics, are presented in Appendix 4, Variation of FRP – Further Results, Figure C1. As injection pressure increases, on account of stronger droplets atomisation (and shorter injection duration), the sprays shown in Figure 16 appear less defined and more widely distributed. The average droplet size at 30 CA deg past SOI, is 16.6 µm at 50 bar and 6.88 µm at 200 bar (D32N, Sauter Mean Diameter based on total droplet number within the combustion chamber).
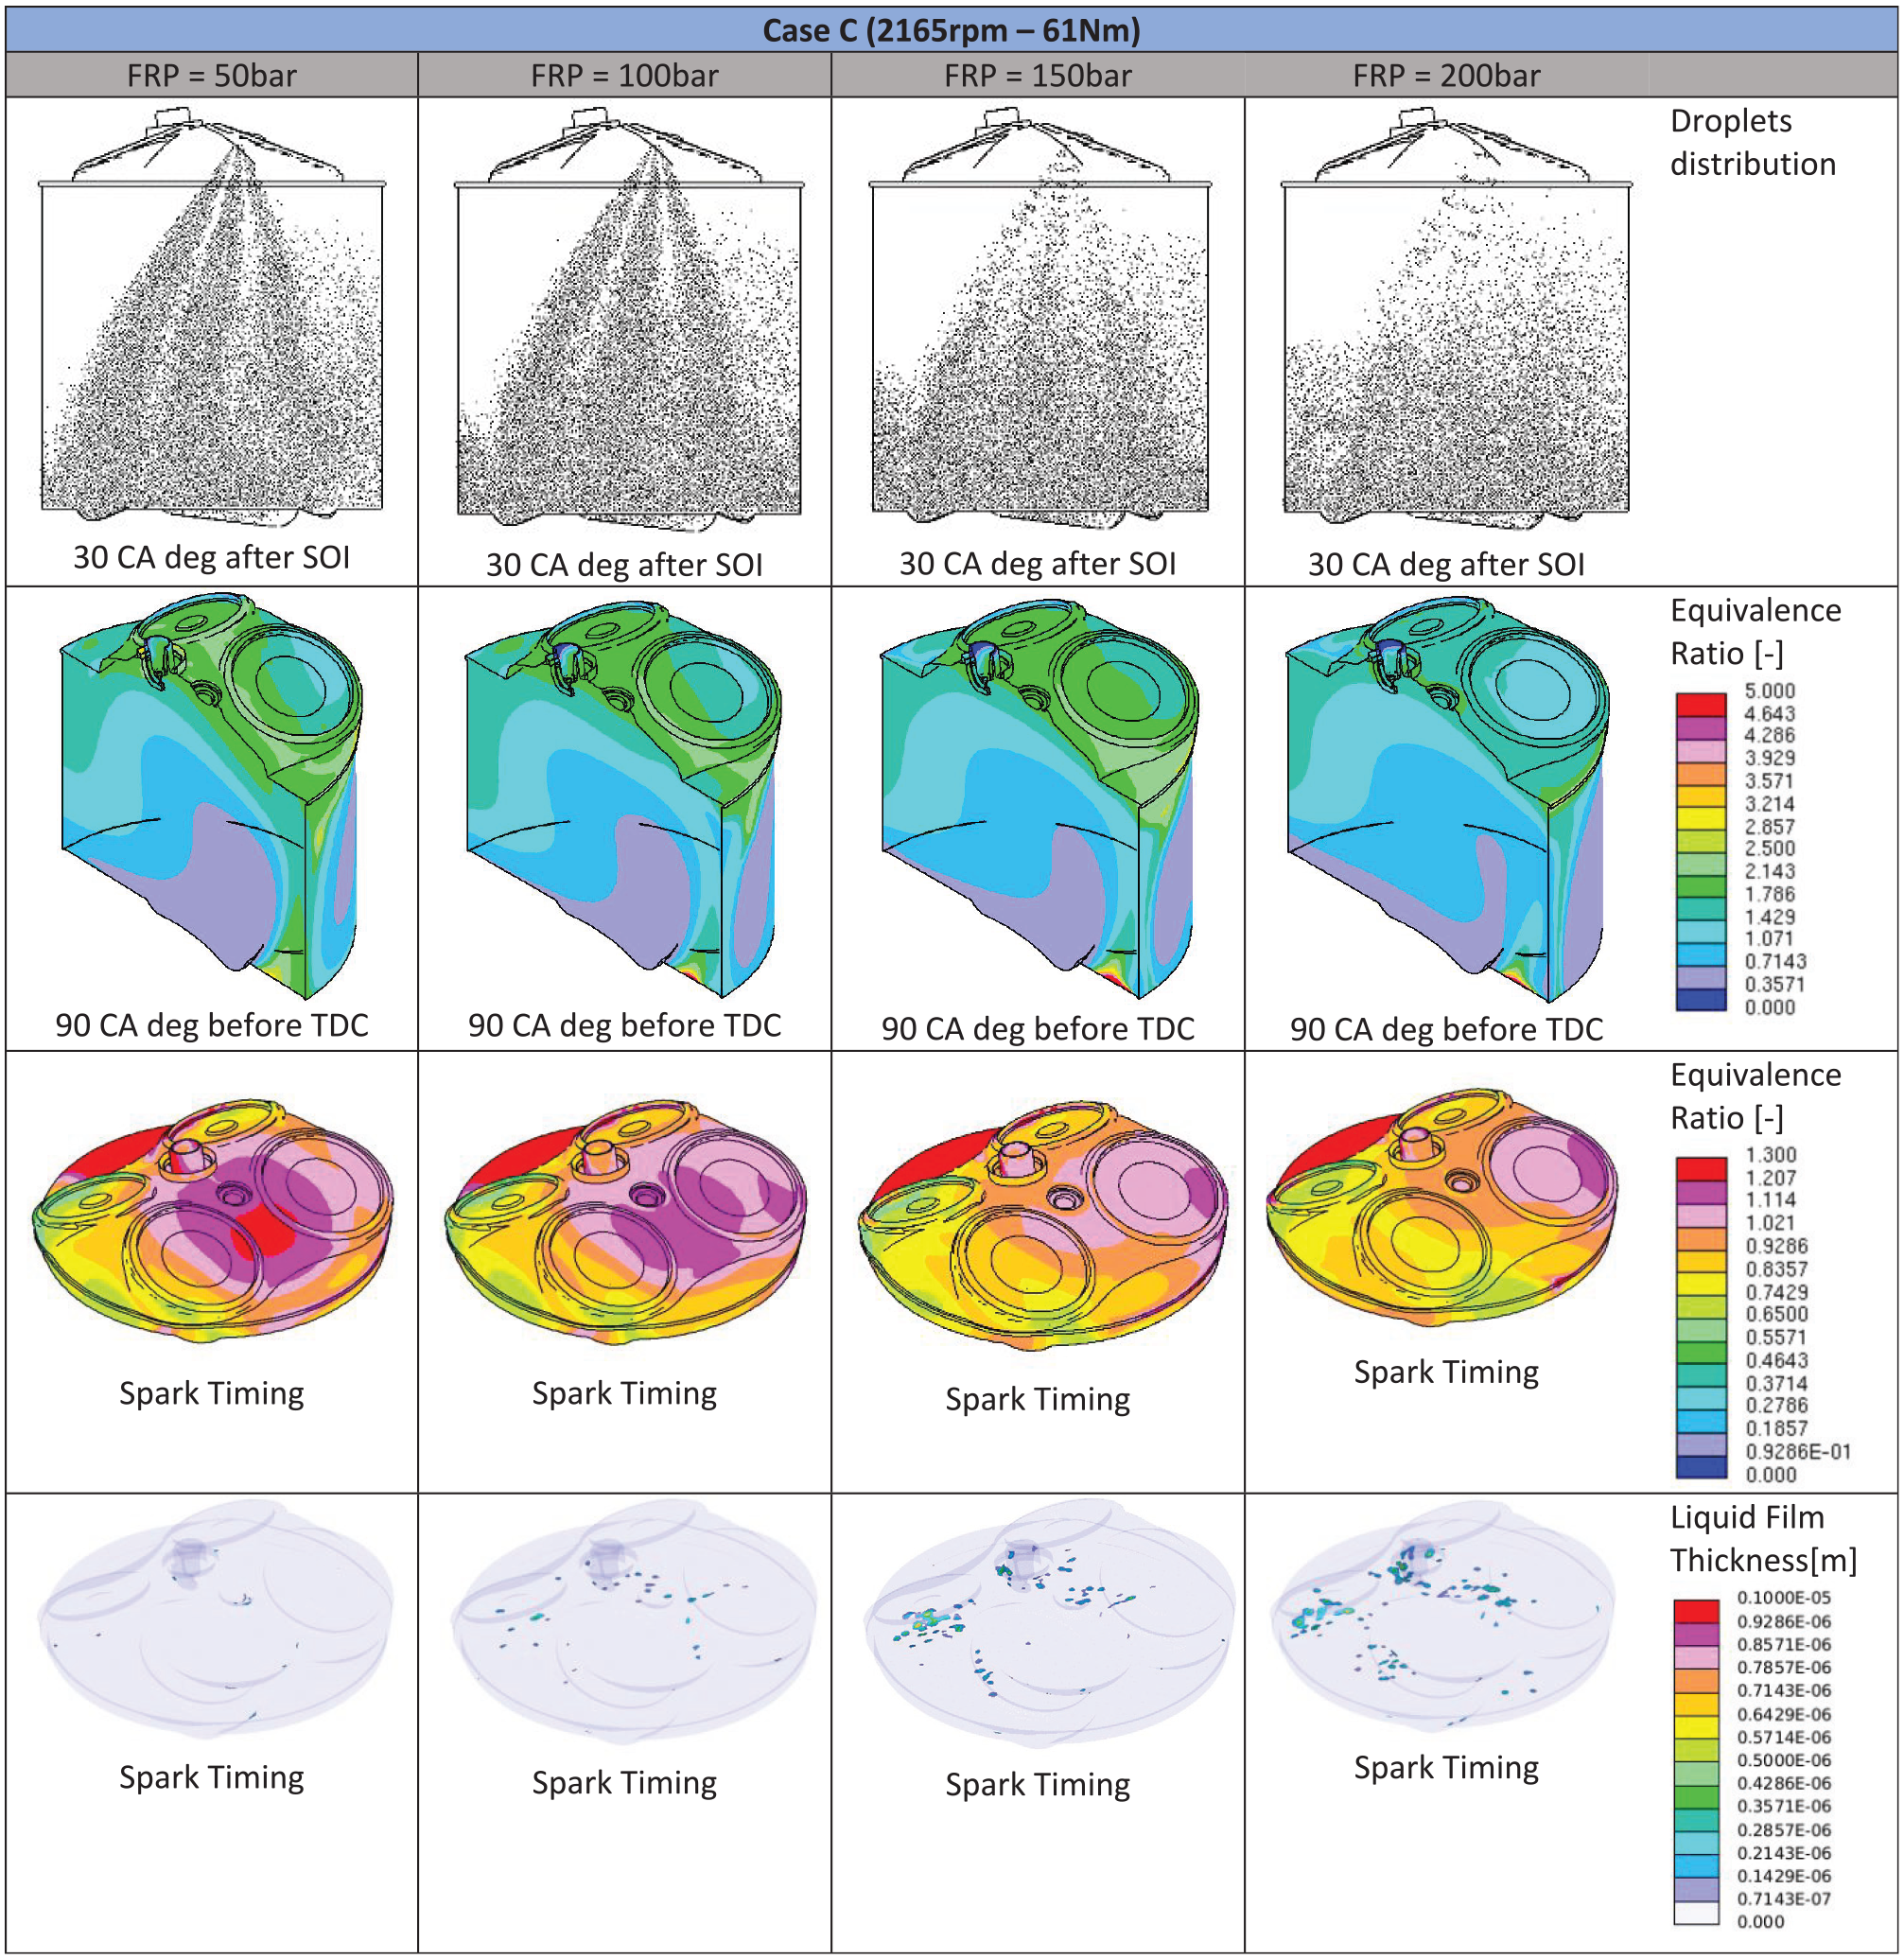
Images of spray, equivalence ratio distribution and liquid film mass distribution at various cycle locations, for Case C. Fuel Rail Pressure (FRP) grows from 50 to 200 bar (left to right column).
The equivalence ratio distribution mid-way through compression is similar for all FRP cases, reflecting the shape of the rotating intake-generated tumbling flow, and only marginally more stratified at lower FRP. At spark timing, the equivalence ratio distribution shows again a similar general pattern; however, at the lowest FRP of 50 bar, a clear fuel-rich area (
In Figure 17 the global (combustion chamber-resolved) mixture preparation indicators are presented for Case C. The corresponding results for Case D are reported in Appendix 4, Variation of FRP – Further Results, Figure C2. The results of
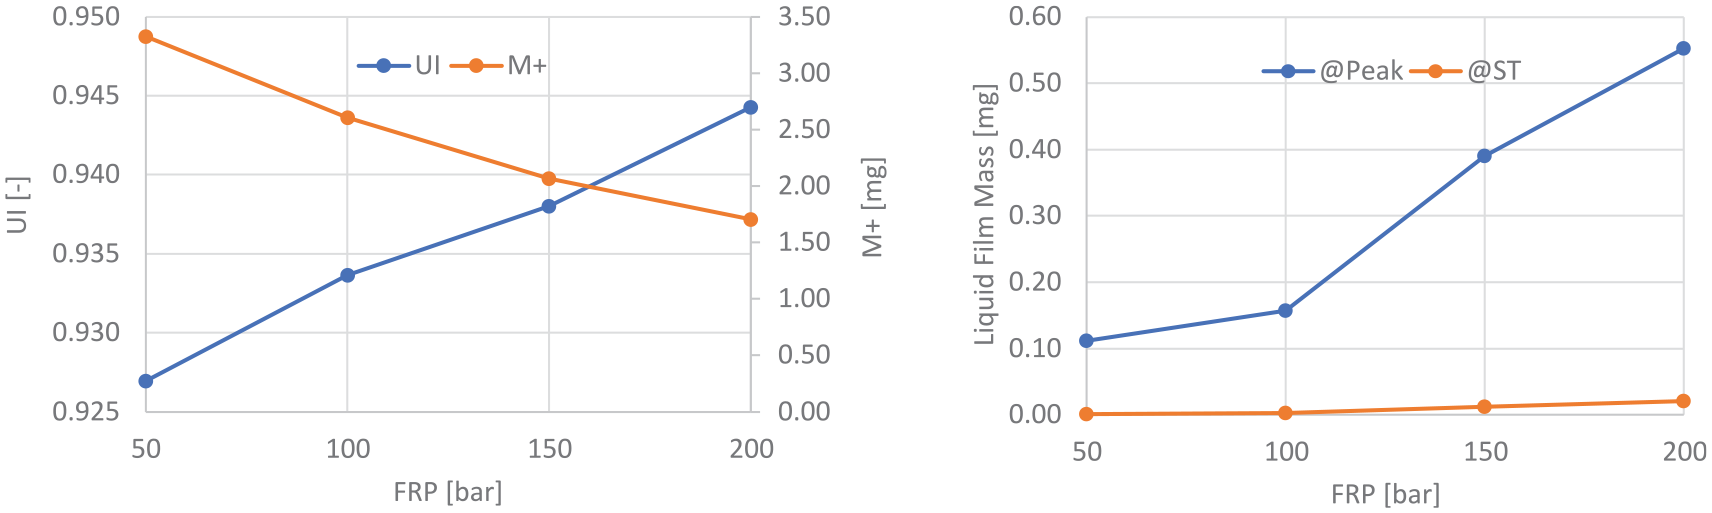
Global mixture preparation indicators for Case C; Top plot: Uniformity Index of Equivalence Ratio and
The bottom plot in Figure 17 shows peak liquid film mass and total retained at spark timing, for Case C. The maxima give an indication of how much fuel would deposit in liquid form on piston (and liner), towards the end of the injection process. These maxima grow steadily as FRP increases, as reported above. Spray-to-wall impingement compromises the quality of mixture preparation directly, by causing uncontrolled droplets rebound and splash, and indirectly, forming liquid film which vaporises at low pace (if partially) generating further local gas-phase mal-distribution. The levels of liquid film at spark timing are very small, arguably in the negligible range (maximum level of 0.02 mg at 200 bar FRP) – due to the spray input setup, direct wall wetting at the injector tip cannot be captured in the current study. Compared to Case B, the available piston telemetry measurements indicate that the piston surface temperature in Case C is on average 20°C hotter, and this may explain the lower levels of liquid film retained at spark timing. A comparative analysis of the two profiles in the bottom plot of Figure 17, gives an indication of the strength of the film-to-flow fuel transfer, once a film establishes during injection. To support the analysis, Figure 18 has been created which shows mass-averaged Turbulent Kinetic Energy (TKE) at the instant of liquid film peak, as function of injection pressure. TKE increases between 84 and 105 m2/s2 as FRP grows from 50 to 200 bar, giving evidence of injection-generated turbulence. Supported by stronger in-cylinder turbulence, the evaporation from the deposited paddles increases with FRP as indicated by the diverging liquid film profiles in Figure 17. Nonetheless, as anticipated above, the results suggest that the mixing of this increasing portion of gas-phase fuel forming near the walls, may not be effective and this ultimately limits the potential benefits associated to increasing injection pressure.
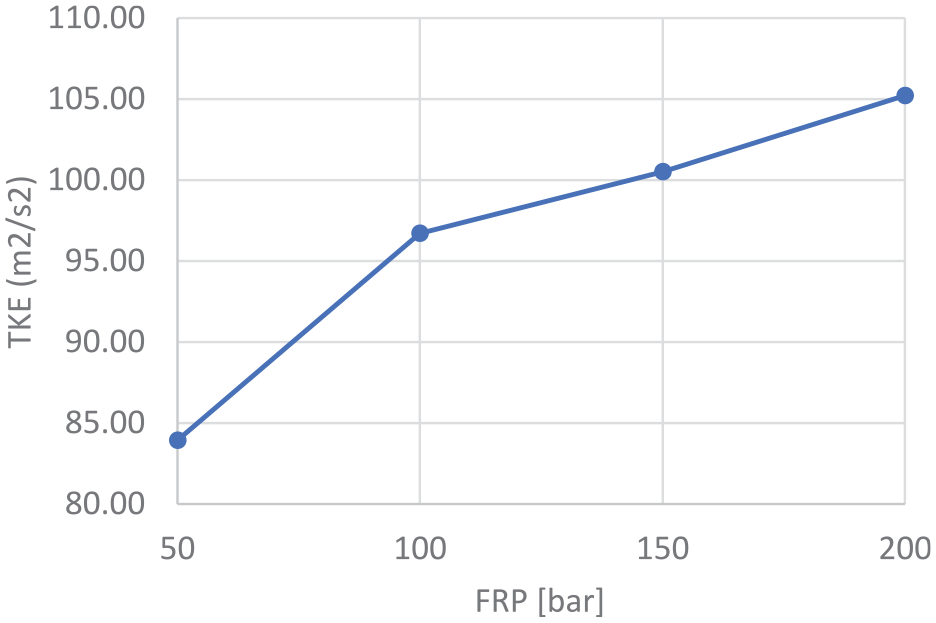
Mass-averaged Turbulence Kinetic Energy at the instant of peak liquid film mass as a function of FRP, for Case C.
Concluding remarks
The forthcoming EURO7 emission regulations expected around 2025/26, and similarly restrictive rules around the globe, bring new significant challenges to engine manufacturers. A routine integration of 3D CFD modelling into the development process, for the unparalleled insight it offers, appears to be an even stronger necessity. Based on a state-of-the-art, spray-guided, GDI engine operated at part-load under stoichiometric and theoretically-homogeneous conditions, this paper outlines the details of a CFD methodology to reliably model the process of air-fuel mixture preparation, with a specific focus on liquid film formation. Through a range of relevant case studies where SOI and FRP are varied parametrically, the pre-combustion mechanisms are put in relation to measured levels of engine-out PN.
The following concluding remarks can be drawn from the analysis:
The study establishes the use of multi-component surrogate blends, which capture the distillation and saturation properties of real gasoline fuels, as an essential modelling step to reliably replicate liquid film formation and dynamics during the engine cycle. Toluene Reference Fuel models, commonly used for engine CFD applications and appropriate for combustion modelling, are insufficient for this purpose.
While the wall temperature is a key variable which controls the liquid film dynamics, with lower wall temperature generally associated to greater deposition and retainment, the liquid film model, based on the Bai-Onera spray-wall interaction approach, can be tuned via a factor
A detailed analysis of the influence of
The validation exercises give evidence of the robustness and flexibility of the modelling protocol, across a range of fuels and operating conditions relevant to GDI engine operation. Sufficient best practice information is given to re-create the proposed approach.
The results suggest that both charge mal-distribution and the amount of liquid film retained at spark timing can be associated to engine-out PN, and the relative importance of their impact depends on engine conditions, wall temperature and enacted control strategy. Altering the SOI over the full span of the intake stroke, gives a strong indication of how this relative importance varies.
Early SOI timing allows sufficient time for gas-phase mixing, but also leads to large liquid film deposition. At 3000 rpm–85 Nm, in spite of good charge homogeneity attained at SOI = 330 CA deg BTDC (
When region-specific fixed wall temperature is used to simplify the analysis, the piston temperature must be appropriately reduced in the case of early SOI timing to capture the effects of injection-induced surface cooling on liquid film.
The effect of increasing injection pressure, with single pulse injection, is not straightforward. In the small capacity engine used in this study, greater injection pressure induces stronger spray-to-wall interaction and more initial liquid film deposition, but also higher rates of film-to-flow evaporation. Depending on the engine conditions, the near-wall mixing may not be efficient, limiting the charge homogeneity benefits potentially associated to better spray droplets atomisation. At 2500 rpm–100 Nm, a very small mass of liquid film is retained over the piston at spark timing at FRP = 200 bar; in spite of that, the charge remains ill-prepared with 2.9 mg of fuel still in very rich regions (
Footnotes
Appendix 1
Appendix 2
Appendix 3
Appendix 4
Acknowledgements
The authors would like to acknowledge Ford Motor Company and Siemens Digital Industries Software for the technical support provided during this investigation.
Declaration of conflicting interests
The author(s) declared no potential conflicts of interest with respect to the research, authorship, and/or publication of this article.
Funding
The author(s) disclosed receipt of the following financial support for the research, authorship, and/or publication of this article: This investigation was financially supported by the Advanced Propulsion Centre (APC), as part of the Ford-led APC6 DYNAMO project, TSB/APC Project Ref. 113130.