
Abstract
An on-going challenge with Gasoline direct injection (GDI) engines is achieving rapid activation of the exhaust catalyst during cold starts, in order to reduce the Nitrogen Oxide (NOx) emissions. Injecting late in the compression stroke, in the efforts to form a stratified mixture, provides the fuel insufficient time to be entrained with the surrounding charge. This results in locally fuel rich diffusion combustion and the formation of high levels of particulate matter. Employing a split injection strategy can help tackle these issues. The current study examines the effects of a split injection strategy on the spray characteristics. Varying pulse width (PW) combinations, split ratios and dwell times are investigated using a Solenoid actuated high pressure injector. The injected quantity and the droplet characteristics of a target plume are investigated. The experiments were performed in a constant volume spray chamber. The droplet velocities and sizes were measured using Phase Doppler Particle Anemometry (PDA). Short and large PWs, in the range of 0.3–0.8 ms, were investigated. The results revealed that the highest injected quantity of fuel was measured with the shortest dwell time of 2 ms, owing to increased interactions between the injection events, which led to larger Sauter mean diameters (SMDs) measured. The SMDs for the shorter PW of 0.4 ms were generally larger than 0.8 ms PW. The droplets in this case were affected by the closely spaced opening and closing events of the Solenoid valve.
Keywords
Introduction
The Gasoline direct injection (GDI) engines have become the dominant powertrain for passenger cars, because of their higher power density and better fuel economy. In particular, the high-pressure direct injection (DI) and its flexible control improve the engine’s performance and efficiency. DI fueling generates more heat of vapourisation of fuel which is aided by the induced charge air, rather than the metal surfaces of the engine when injecting via port fuel injection (PFI). The accompanied high in-cylinder turbulence levels serve to shorten the combustion duration. These combined effects, in conjunction with variable valve phasing and fresh air induced directly into the cylinder, during the gas exchange phase, can help remove burnt gases effectively. These features reduce the in-cylinder temperature, thereby mitigating knock and allowing operations with higher compression ratios. 1
However, there are continuous challenges faced with GDI engines, one of which is optimising the control of the fuel delivery for varying engine conditions. It is particularly difficult to obtain the optimum fuel economy when the in-cylinder charge properties such as pressure, temperature, charge velocity and atomisation rates vary so significantly. On-going studies focusing on optimising the GDI engines and reducing emissions are therefore essential to help tackle the serious concerns related to climate change and to meet the stringent emissions regulations.
Most of the current generation GDI engines employ homogeneous charge operations for a range of operating conditions, whereby the fuel is uniformly distributed across the cylinder. An on-going focus of improvement in the GDI engines is the stratified charge late injection for cold start operations. When employing a single injection per cycle, the fuel is typically injected late in the compression stroke to ensure that a fuel-rich charge is in the vicinity of the spark plug for late ignition. The primary purpose is to help raise the exhaust gas temperature within a short period of time for rapid activation of the exhaust catalyst during cold starts. As a result of the late injection, the fuel does not get enough to time to mix with the surrounding air (which is limited anyway as a result of the throttle being only partly open) and gets inadequate evaporation time. Significant piston surface wetting and liner wetting occurs as a result of the late fuel injection impinging on these surfaces. 2
Due to the low surface temperature distribution during cold start, the fuel vapour condenses when in contact with the surfaces of the piston and combustion chamber. The smoke levels and unburnt Hydrocarbons (THC) rise significantly owing to diffusion combustion of the pool flame on the metal surfaces. The injection strategy can also affect the cycle-to-cycle variation in the indicated mean effective pressure (IMEP) which degrades the engine’s efficiency. 3
Another source of particulate emissions reported is tip wetting, which is often associated with the injector closing event. The sharp throttling effect reduces the injection pressure and changes the mass flow rate. The sudden change in momentum ruptures the liquid fuel, and the pressure drops below saturation pressure of the fluid which forms cavitation. 4 This causes the fuel to settle on the tip of the injector. During combustion, late evaporation of the fuel at the tip can form a porous carbon deposit, which is one of the factors that increase the particulate emissions. 5 Medina et al., 6 reported that higher engine speeds provided less time for the tip drying, which also affected the particulate numbers (PN).
The ideal charge characteristics for homogenuous stratified charge operations are a high rate of atomisation, fast mixture preparation and a fuel rich charge in the proximity of the spark plug at the time of ignition, along with a uniformly distributed charge across the cylinder to avoid pockets of fuel rich and lean regions. This constrains the range of the ignition timing, as the mixture is moving and diluting at a high rate upon fuel injection. 7
A split injection strategy within one cycle, combined with high injection pressure, has the potential to help realise these complex charge characteristics. It has the capability of generating a spatially and temporally well-adjusted fuel-air mixture. With the first injection early in the intake stroke, the fuel gets sufficient time to atomise and form a pre-mixed global homogeneous charge across the cylinder. This also helps to improve the volumetric efficiency at part load condition, in comparison to the typical late single injection in the compression stroke and its attempt at mixing with the limited amount of induced air. The second injection in the compression stroke could help develop a locally fuel-rich charge in the proximity of the spark plug, albeit with short evaporation time before ignition.8,9 The typical injection and spark timings should thus be tuned so that the middle or the tail end of the spray is at, or just past, the spark gap during the spark timing (ST). As such, the timings of the two injections and split ratios are crucial.
With regards to the injection timing, early first injection in the intake stroke can increase the likelihood of its interaction with the remnants of the hot residual gases present from the previous cycle, if the valve timings are adjusted appropriately. This would enhance the rate of evaporation of the first injection and accelerate the formation of a homogenous mixture. 10 Subsequently, second injection close to ST has its benefits as it generates high turbulence levels close to the spark plug, which can be maintained without losing energy during the spark discharge.11,12 The local equivalence ratio near the spark plug also increases as the distance between the spark plug and the piston top is decreased.13,14
Too late an injection, however, can be detrimental to the combustion performance. It raises the local mean equivalence ratio even further, resulting in slower and more fluctuated initial flame propagation. 14 Priyadarshini et al., 15 observed that when injecting too late, past 50°CA bTDC at 1200 rpm, the fuel is injected into a smaller cylinder volume. The benefits of the bulk flow motion are thus difficult to achieve. The fuel gets directed to the piston bowl forming rich mixture zones directly into the bowl, instead of near the spark plug. The consequences of late second injections are large coefficient of variations (CoV) in IMEP and peak pressure, which are associated with significant cycle-cycle variations.13,16
With regards to the split ratio, there is a range of literature supporting a large split ratio. Some studies found that a higher quantity of the fuel in the first injection increased the overall turbulent kinetic energy (TKE) levels, which enhanced the fuel oxidation and the generation of a homogeneous mixture. This resulted in higher lambda when compared to the smaller split ratio, while inducing faster initiation, growth and propagation of the flame kernel and enabling greater number of radicals to be consumed. 17 The volumetric efficiency had also improved due to the effective heat transfer (or cooling effects) taking place between the first injection’s vapourising fuel and the induced air, which allows operation at higher compression ratios.10,13,17,18 The levels of NOx in this case were about 15% lower when compared to that of single injections, but at the expense of higher THC emissions. 19
On the contrary, a smaller split ratio, has been stated to maximise the equivalence ratio in the spark plug zone because the fuel is directed towards the spark plug under the guidance of the piston bowl. This helps develop turbulent flame propagation. 20 Meanwhile, Dahlander et al., 21 and Kim et al., 22 found that greater portion of fuel injected closer to ST resulted in increased soot luminescence. In summary however, a split injection strategy with a large split ratio correctly timed, has been proven to be beneficial for the stratified charge operations, when compared to the single injections. In addition to catalyst heating, the split injection strategy is beneficial for homogeneous charge operations under high load conditions, due to the reduced impact of wall wetting which subsequently reduces the particulate emissions.
While the effects of the split injection strategy have been realised by studying the engines’ in-cylinder conditions, it is important to understand the impact of the interactions of the sprays. In this, studies on sprays and atomisation conducted inside a spray chamber provide valuable information of the complex phenomena of sprays and the effects of the injection system design.
The high injection pressures have been proven to improve the atomisation rates of fuel droplets, which would prevent the likelihood of rich pockets of fuel in the cylinder as a result of the presence of fuel ligaments and large fuel droplets. Although the main tip penetration increases with increasing fuel injection pressure, the critical spray breakup occurs closer to the injector tip. 23 Zhou et al., 24 found that the variation in the liquid phase distribution using 10 MPa injection pressure was higher, when compared to 5 MPa pressure. The effect of fuel temperature on the variations of the spray liquid morphology was found to be relatively low when compared to the injection pressures. The high injection pressures also accelerate the opening of the diesel injector which is beneficial for droplet atomisation. 25
Increasing the injection pressure has resulted in higher tumble charge motion, reduction in the temporal variations of the fuel economy, reduction in tip-diffusion flame combustion and coking deposits, and a reduction in the net specific THC levels.6,26 In spite of these benefits, increased costs and higher power consumption by the pumping system associated with the higher injection pressures, which affects the mechanical efficiency, should also be considered.
It is also important to understand the effects of the flow field formed by the first injection on the development of the second injection in order to predict the spray characteristics of the second injections. 27 With a large dwell time, the first spray gets more time to evaporate before the start of the second injection. This reduces the possibility of the droplets coalescence as well as the penetration length of the second injection.28–31 It was found that the first injection increased the local turbulence levels in the flow field as a result of the first spray interacting with the surrounding air. The subsequent injection/s entered a flow field with higher turbulence levels. These factors thereby oppose the axial propagation of the subsequent injections, 32 but encourage the droplets travelling at high velocities to spread radially. 31 If the second injection occurs when the inlet valves are open, the induced air, which would be accelerated by the first injection, would in fact increase the rate of penetration of the second injection compared to the first injection. Another factor is the fluctuations in the rail pressure, which, if the dwell times are short, generate large fluctuations in the penetration lengths of the second or third injections. 32
Majority of the studies focusing on the stratified charge operation using the split injection strategy have typically been carried out using a Piezo actuated injector. This Piezo actuation technology is typically coupled with outward opening injectors with annular orifices. The injector’s fast needle action provides the capability of operating with short dwell times and PWs. The precision and repeatability of closely spaced injections however have been stated to be problematic. 33 A limited number of studies have been performed using a Solenoid actuated multi-hole injector, which is what the current paper investigates. The nozzles in this case are often either convergent-divergent type or divergent-convergent. Both designs have been proven to have their own benefits in terms of atomisation rates. 34 The Solenoid injector is attractive because of their lower cost, and the capability of typically operating in a ballistic region. In this case the dwell times and PWs are larger than the studies performed using a Piezo injector.
The present work is part of a campaign which consists of a series of investigations focused on macroscopic and microscopic characterisations of a prototype high-pressure Solenoid injector. The current work mainly focuses on the injected quantity and droplets characteristics using single and split injections using large dwell times.
The paper is therefore structured as follows. The test setups are described in the methodology. This is followed by the discussions of the results which are split into five parts. The variation in the injected quantities for 1:1 and 2:1 split ratios, with varying PW combinations, varying dwell times and the corresponding single injections are analysed in the first part. The effects of the 1:1 split ratio, with a PW combination of 0.4–0.4 ms and varying dwell times, on the velocities and droplet sizes various distances downstream of the injector, are discussed in the second and third parts, respectively. These characteristics are compared against the 2:1 ratio, with a PW combination of 0.8–0.4 ms. Their corresponding velocities and droplet sizes at various elevations are discussed in the final two sections of the results discussions. In the final section, the conclusion and future works are presented.
Methodology
Injection parameters
The injector under investigation was a Solenoid actuated, multi-hole DI injector with six holes, capable of injecting at fuel rail pressures of up to 35 MPa. The current-voltage profile unique to this injector was achieved from the injector’s manufacturer.
Figure 1 shows the injection events tested with varying PW combinations and split ratios. The single injection compared against the split injection had a PW equivalent to the total PW of the two injections.
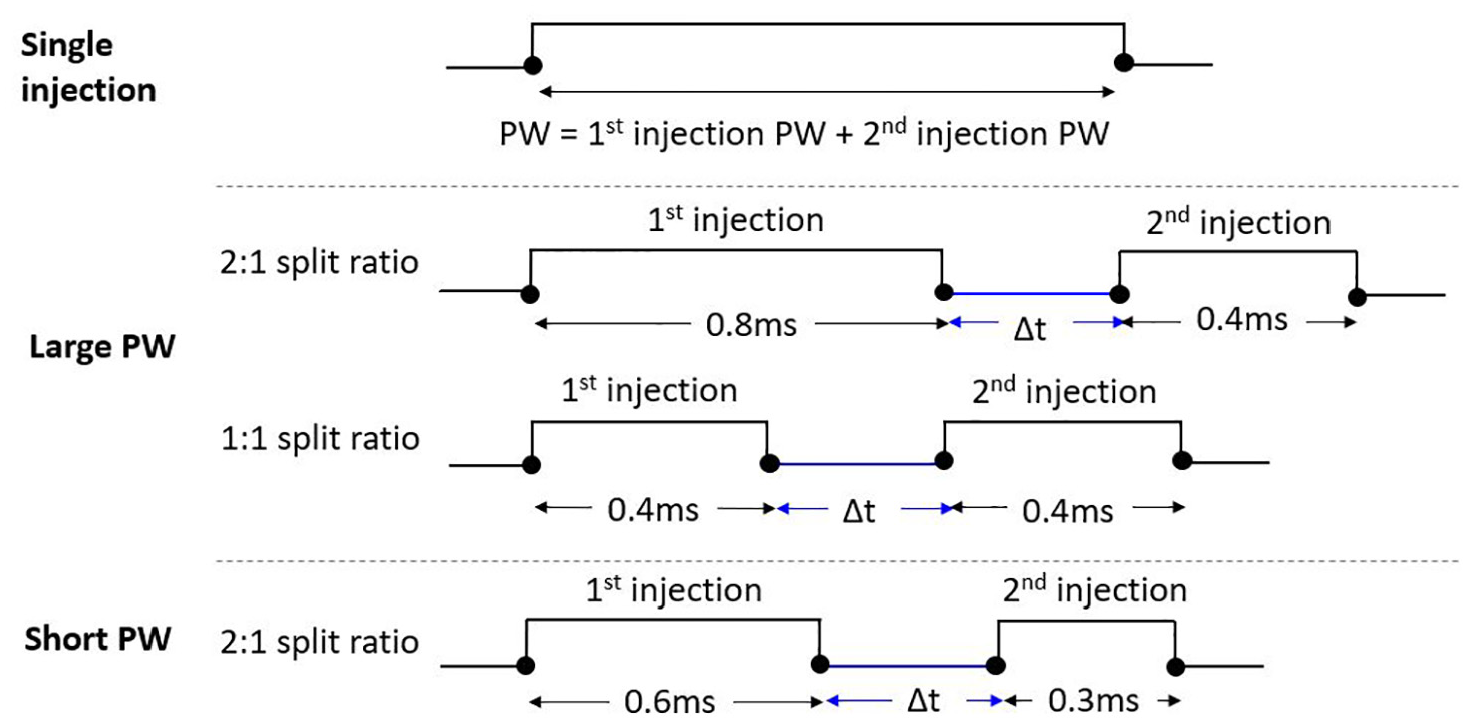
Representation of the tested PW combinations for split and single injections.
The dwell times (Δt) tested are listed in Table 1. The equivalent number of engine crank angles corresponding to the dwell times for speeds representative of cold start and part load conditions are provided in Table 2. The focus of the study is to investigate the spray characteristics with large dwell times. These dwell times are representative of injection cases in GDI engine’s stratified operation at low speeds, where the first injection would be in the intake stroke, and the second in the compression stroke.
Key parameters of the split injection cases tested, including the PW combinations and the range of small and large dwell times. 31
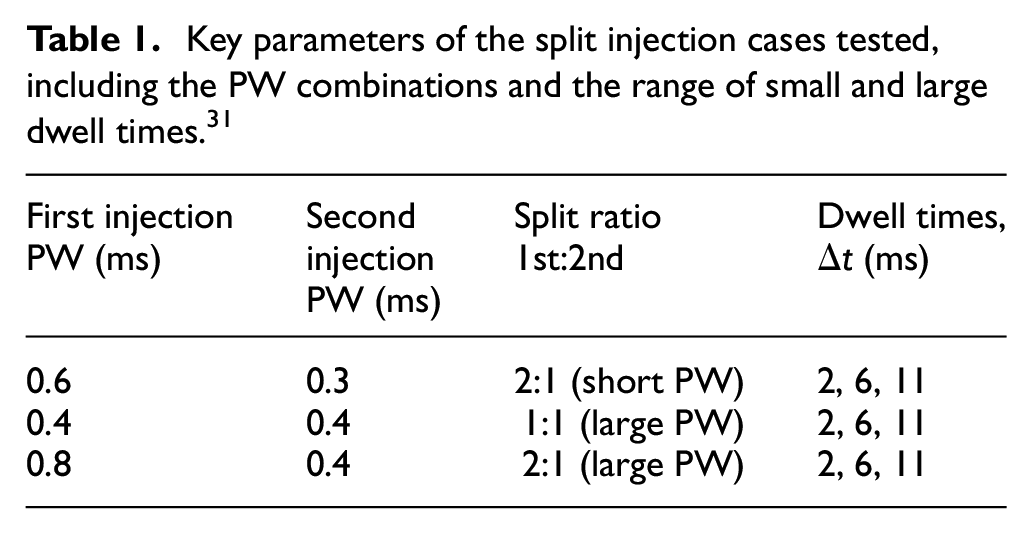
Reference equivalent crank angles in relation to the dwell times for engine speeds of 850 rpm and 1200 rpm pertaining to cold start and part load conditions, respectively. 31
A diaphragm pump was used to supply the rail pressure of 35 MPa. It operated by using the principles of differential area, whereby compressed air (0.6 MPa) forced the liquid through a small area. This in turn provided high output pressures. A fuel filter was installed downstream of the pump to prevent large impurities from infiltrating the injector.
For the measurements of the injection quantity per test case, the injection frequency was 10 Hz and 1000 pulses were injected per injection event. The injected mass was collected in a beaker (height of 130 and 70 mm internal diameter) measured using a precision mass balancer with a resolution of 0.01 g. Ten measurements per injection event were obtained and the average injected mass was determined along with standard deviation errors. A National Instruments (NI) DI driver was used to operate the injector. The dwell times and PWs were triggered using a TTL signal generator connected to the DI driver system. The test fuel used for the mass measurements was Gasoline RON95 and the fuel temperature was maintained between 19°C and 25°C, which was monitored using a thermometer in the fuel tank.
Phase Doppler anemometry
Figure 2 represents the setup of the PDA measurements carried out inside a constant volume spray chamber under ambient pressure and temperature conditions of 1.05 bar and 22°C, respectively. The chamber’s inner diameter was 288 mm and the inner height 300 mm. After each injection cycle, compressed Nitrogen was used to purge the chamber. The accumulated fuel film was purged through and treated using active carbon granules before being exhausted.
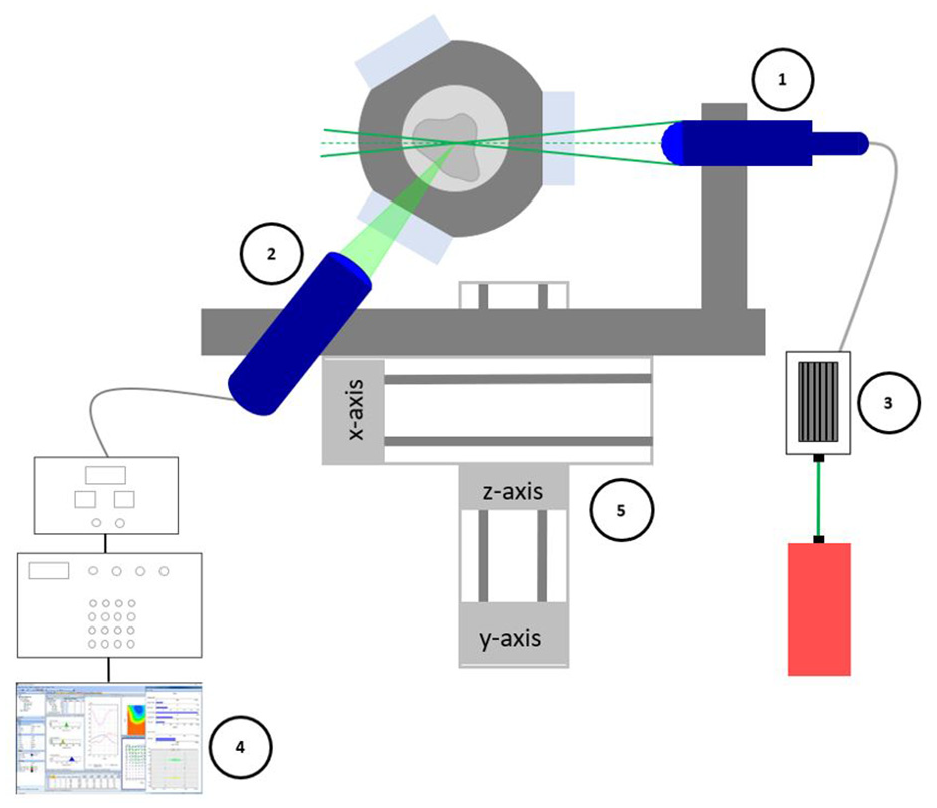
Representation of the PDA setup with the detector positioned 71° with respect to the path of the lasers.
A 112 mm FiberFlow PDA system by Dantec Dynamics, with 60 mm probe diameter, which is labelled as
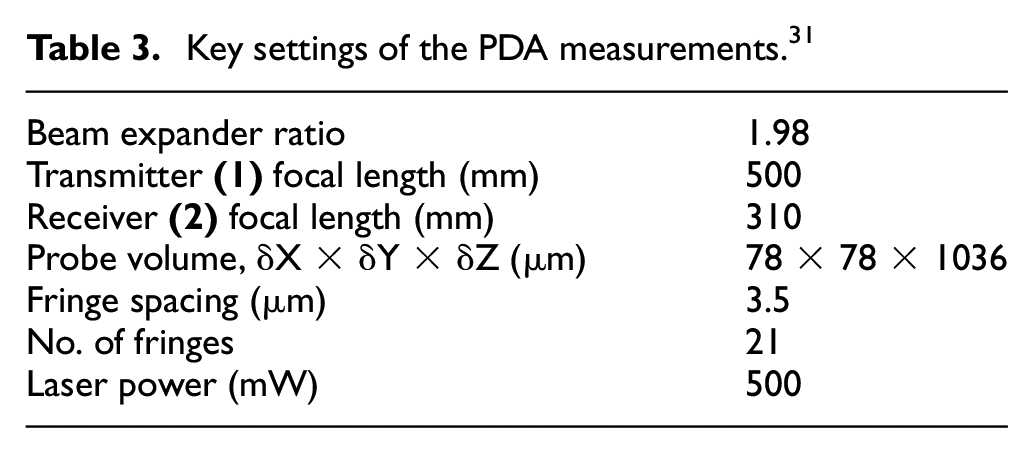
Key settings of the PDA measurements. 31
The PDA system was of side scatter configuration to achieve the optimum signal-to-noise ratio. The receiver
N-Heptane was used to perform the PDA measurements as per JSAE 2715 standards paper, 35 which was maintained between 19°C and 25°C.
For the data acquisition, either 10,000 droplets samples were acquired or maximum acquisition timeout of 100 s was reached for each test position, whichever occurred first. 500 pulses per burst at an injection frequency of 5 Hz were tested for each injection event. The start of data acquisition was synchronised with the start of the injection using a TTL signal generator.
The acceptable sphericity of the droplets was 98% and above. Some sources of errors were still present in the measurement. 100 s of data acquisition meant that towards the end of the injection cycle, the chamber progressively became highly fuel dense, which affected the detection of the droplets. This was observed to be the case in the latter half of the measurements for all tested cases. As a result, data past 50 s were rejected. In addition, the test points in the flow field that detected less than 100 droplets in the 50 s of acquisition time (AT) were rejected.
The axes and points of measurements in the flow field are indicated in Figure 3. The focus of the study was to characterise the droplets in the core of the rear plume. The measurements were therefore performed along the axis of the rear plume, as indicated in Figure 3(b). The elevations (z-coordinates) tested were 11 mm (also referred to as near-nozzle region), 15 and 20 mm for the 0.4 ms PW. The elevations measured with larger PWs also included 30 and 40 mm downstream of the injector tip.
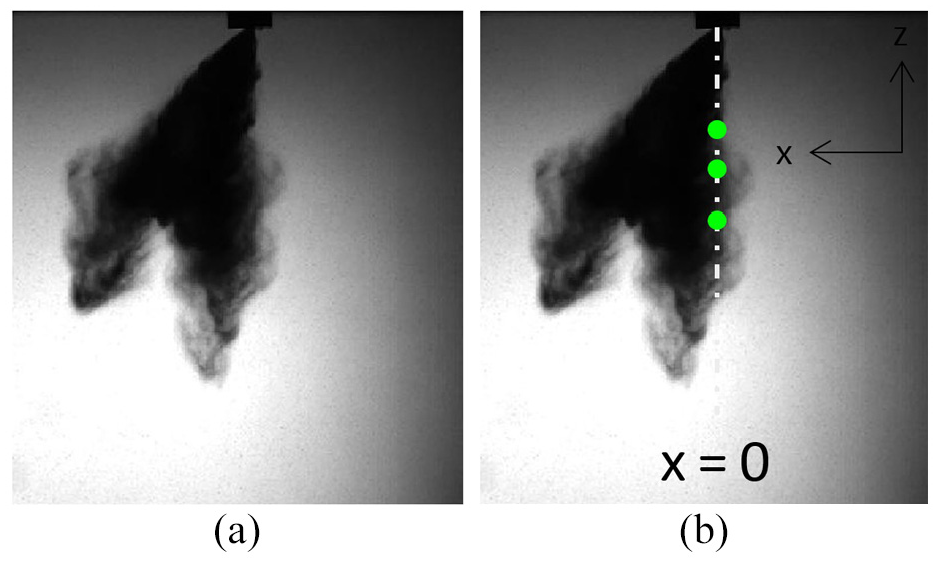
Representation of the measurement points in the flow field for the 0.4 ms PW: (a) is the spray captured using back-light imaging at the end of injection for the 0.4 ms PW and 35 MPa injection pressure and (b) represents the control volumes (green dots) positioned in the core of the rear plume for elevations of 11, 15 and 20 mm downstream of the injector.
The errors in velocities presented in the results are the standard deviation errors of the measured droplet velocities. The uncertainty (errors) in SMDs were calculated using the ratio between the CoV of Di3 and Di2 as defined below:
S_D in this case is the standard deviation error and Di is the measured droplet size. The SMD error calculation has no unit.
Results and discussion
Injection mass measurements
The differences in the injection quantity at varying dwell times and the corresponding single injections are analysed in this section. The purpose is to obtain some indication of the Solenoid valve behaviour and the interaction of the injection events for the split injection cases with varying dwell times using short PWs. Figure 4 shows the effects of dwell times and split ratios on the average injected quantities. Note that a dwell time of zero represents single injections. When observing the injected quantities from the split cases, the data indicates that the highest quantity of the fuel was measured for the shortest tested dwell time of 2 ms. This is the case for all PW combinations and split ratios tested. For dwell times greater than 6 ms, the injected quantities are similar.
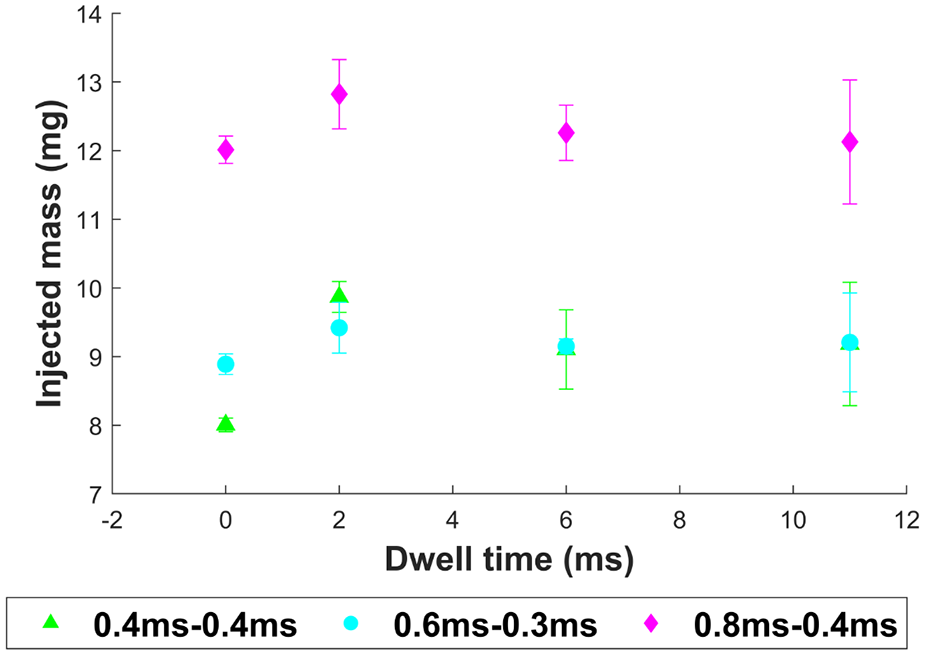
Effects of dwell times and split ratios on the average injected quantity for the split injection cases and single injections (dwell time = 0) for a rail pressure of 35 MPa. The PW combinations represent 2:1 and 1:1 split ratios.
One reason proposed for the larger quantity of the fuel measured at 2 ms dwell time was that the Solenoid valve had not closed fully prior to the start of the second injection. To better understand the valve behaviour, the valve profiles for both 0.4–0.4 and 0.8–0.8 ms PW combinations, using a dwell time of 2 ms, are represented in Figure 5. Both cases show a distinctive gap in the transient current profiles between the end of the first injection and start of the second injection, confirming that the valve was commanded to shut for the duration of the dwell time.
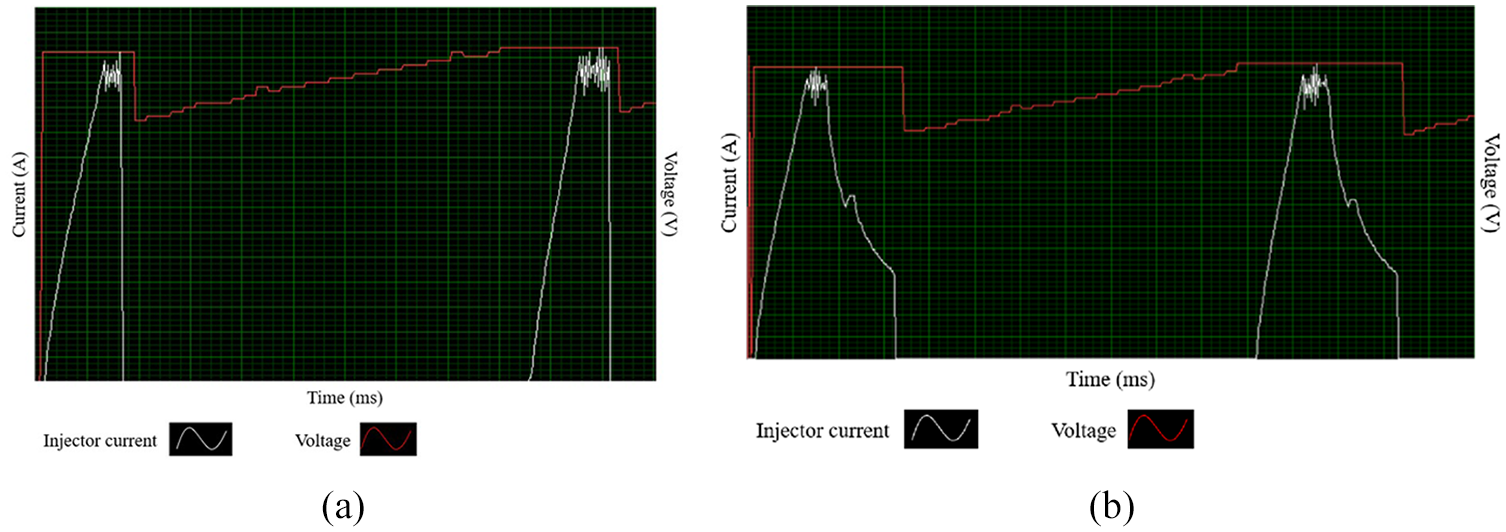
Current-voltage profiles for PW combinations of: (a) 0.4–0.4 ms and (b) 0.8–0.8 ms. The dwell time settings for both profiles are 2 ms. The white and red trend lines represent the current profile and the voltage profiles, respectively.
High-speed images of the tested cases, performed at 20 kHz, had further revealed that the start of the second injection had occurred after the specified dwell time. This confirms that the needle remained shut for the specified dwell time of 2 ms. Contrary to this observation, Wood A, 36 found that for the short dwell times in the range of 0.35–1 ms, the eddy currents from the end of the first injection had remained in the Solenoid and did not dissipate by the start of the second injection. This led to advanced injector opening for the second injection period, thereby increasing the fuel mass delivery. The current high-speed images and the valve profiles showed that the injector valve opening for the second injections occurred after the specified dwell time, which meant that the dwell time of 2 ms was large enough for the eddy currents from the first injection to dissipate prior to the start of the second injection. The eddy current from the first injection thus does not affect the opening time of the injector’s valve in the second injection event, when large dwell times are employed.
A number of studies have observed tip wetting effects,4,5,37 which could be a contributor of the higher mass measured with the split cases. Upon the injector’s closing event, Hélie et al., 5 observed large ligaments of fuel formed at the tip of the nozzles resulting in tip wetting. This effect was intensified by the large injection pressures. High-speed images of the flow field by the end of injections presented in Figure 6(b). however, do not indicate any obvious dripping effects or tip wetting effects. Macroscopic imaging would help in observing formations of ligaments towards the end of injections.
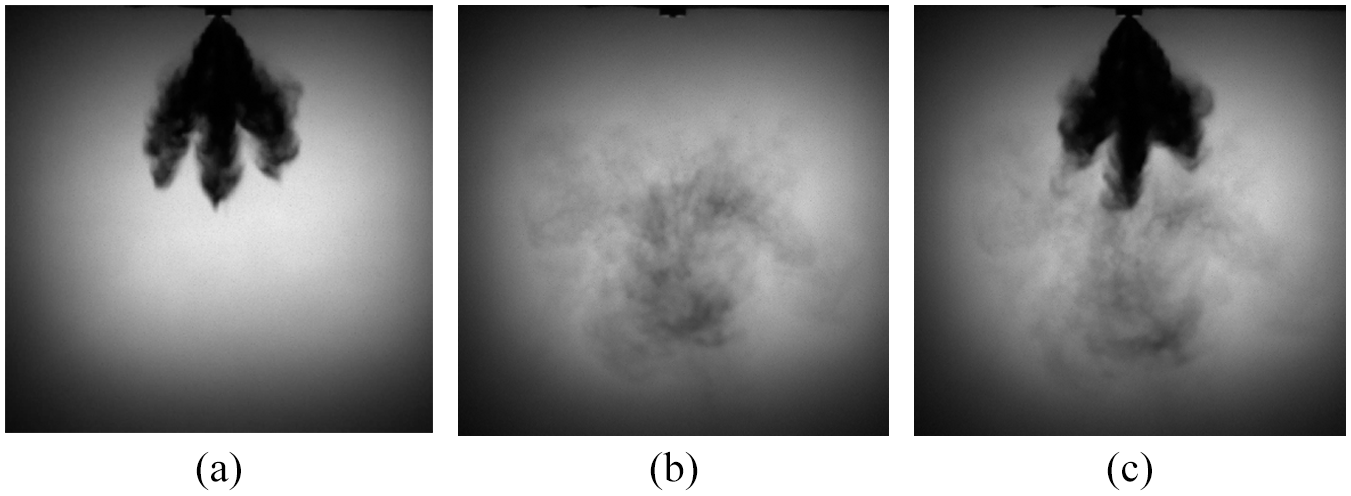
Images of the flow field for 0.4–0.4 ms PWs, dwell time of 2 ms and injection pressure of 35 MPa. The images represent the flow field at: (a) end of first injection and (b) start of second injection and (c) end of the second injection.
The primary reason for the larger quantity measured with the short dwell time thus points towards the injected fuel interacting with each other in the flow field. For the measurements performed under ambient atmospheric conditions, the fuel prior to the start of the second injection is still in the vicinity of the injector, as seen in Figures 6 and 7. As a result of this, the injected fuel from the first injection and the tip of the spray plumes are seen to interact, which would affect the droplet atomisation of the second injection, as observed in the following section. These combined effects thus result in higher injected quantity measured, when compared to larger dwell times. For dwell times larger than 6 ms, there is no dramatic change in the injected mass. This indicates that the dwell time is large, providing sufficient time for the first injection to propagate away from the vicinity of the injector. The interactions between the two injection events would be alleviated, thereby reducing the chances of measuring coalesced droplets collected in the beaker.
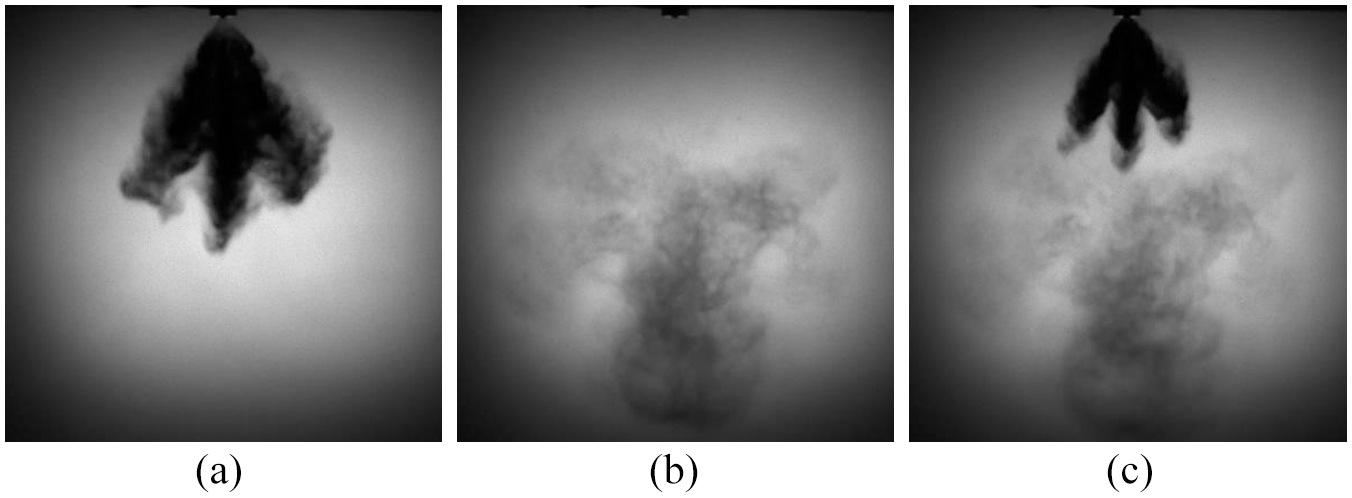
Images of the flow field for 0.6–0.3 ms PWs, dwell time of 2 ms and injection pressure of 35 MPa. 28 The images represent the flow field at: (a) end of first injection, (b) start of second injection and (c) end of the second injection.
The trend in Figure 4 also shows that the overall injected quantities for all the split cases and dwell times tested are generally larger than the single injections. This is caused by the ballistic region repeated twice with the split injections using short PW combinations, which leads to the high mass flow rate initially upon the valve’s opening. To elaborate this further, the effects of increasing PWs and injection pressures on the injected quantity are presented in Figure 8. The measurements were also performed at 10 Hz and 1000 pulses were injected per injection event, with the injected fuel collected in the beaker and weighed. The increase in the average masses for the short PWs in the range of 0.3–0.5 ms is non-linear, whereby the rate of increase is initially high and is dampened with increasing duration. For the larger PWs, between 0.5 and 1.5 ms, the increase in the injected quantity is linear.
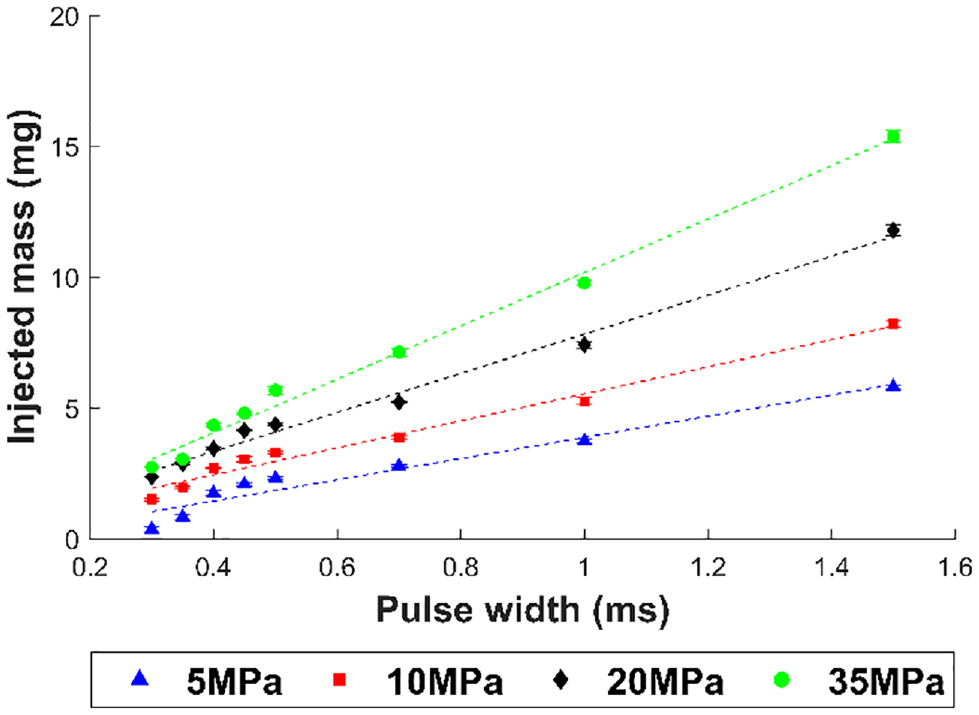
Effects of increasing PWs and pressures on the injected quantity.
This trend is consistent with all injection pressures tested. It suggests that the injection mass flow rate during the start of injection is large as the injector is operating in the ballistic region. Increasing the PW causes a reduction in the mass flow rate past the ballistic region, as the spray reaches a steady state region. This is why a linear increase is observed for the larger PW cases. It is this repetition of the injection in the ballistic zone associated with the split cases using short PWs, that leads to higher injected quantity when compared to the single injections.
Additionally, the highest relative peak in the injection quantity at 2 ms dwell is observed for the short PW combination of 0.4–0.4 ms, as the PW is primarily operating in the ballistic region. The short PWs are also sensitive to the valve’s motion. It was observed in the high-speed images that for 0.4 ms PW, the spray was attached to the injector tip for at least 100 µs after end of injection (EOI). This was not observed for the larger PWs of 0.6 and 0.8 ms.
A possible reason for this occurrence is the sudden drop in the peak current, which interrupted the development of the current over time for the short PW as observed in the valve profile (Figure 5(a)). This sends a sudden command for the valve to shut, instead of a progressive drop in the current and therefore a progressive closing of the valve (Figure 5(b)). In addition, a second shorter peak in current observed with the larger PW combination is missing from the valve profile of the short PW of 0.4 ms. This indicates that the short PW does not allow the development of the full current profile before the rapid closing of the injector valve. As such, the sudden drop in current commands the valve to shut, but the closing of the valve could be heavily affected by the large forces of the fuel due to the high injection pressure, which would resist the closing of the valve. The untimely closing of the valve therefore would have affected the detachment of the spray from the injector tip, subsequently affecting the injected quantity.
This effect was also observed by Mouvanal. 4 Due to the sudden closing of the valve, the inertia force was found to be predominant in the fuel flow, which was injected at 15 MPa. As a result, the fuel was injected for a longer duration with lower momentum. As a higher injection pressure was employed in the current study, the inertia forces are greater which means increased resistance against the closing of the valve. This explains why the fuel would have remained attached for a large duration after EOI.
The reason for the higher relative peak in the injected quantity for the short PW combinations observed at 2 ms dwell time is thus due to the combination of the delayed detachment of the main spray tip after EOI (independent of the dwell time) and the increased rate of interactions between the two injection cases (dependent on the dwell times).
Observing the standard deviation error bars, the largest error bars in the injected quantity are observed for the largest dwell time of 11 ms. This is because the large dwell time would allow sufficient time for the fuel from the first injection to evaporate prior to the start of second injections, preventing some droplets from being accumulated in the beaker during the measurements. Some evaporated fuel therefore affected the measured injected quantity per test cycle, as the rate of vapourisation varied shot-to-shot due to the short PWs employed.
Payri et al., 38 reported that the shot-to-shot variability for the pilot/post diesel injection was dependent on both the transitory characteristics and the dwell times for the post injections due to internal pressure waves. This was observed when short dwell times in the range of 200–650 µs were employed, with pressures of up to 200 MPa. They thus found the shorter post injection difficult to control due to the impact of the pressure waves (which is dependent on rail pressure) on the valve’s behaviour. The relatively large standard deviation bars observed with the 2 ms dwell case, when compared to single injections, suggest that the internal pressure waves had affected the second injections, even when a larger dwell time was employed. In other words, the shot-to-shot variations would have been a factor in the large standard deviations measured with dwell times larger than that employed in. 38
Spray characterisation - 1:1 split ratio
For the 1:1 split ratio, the spray characteristics from the PDA measurements, for the PW combination of 0.4–0.4 ms, are investigated. The total PW of the single injection was 0.8 ms and the dwell times analysed are 2 and 6 ms.
Less than 100 drop counts were detected for the 11 ms dwell case, which were deemed insufficient for data validation purposes. This was because 11 ms dwell time provided the droplets from the first injection sufficient time to propagate away from the vicinity of the injector. As a result, the drop counts in the second injection were significantly less due to the reduced interaction with the first injections.
Analyses of the droplet velocities
Figure 9(a) and (b) represent the average velocities and overall drop counts respectively, across varying axial locations in the core of the rear plume (Figure 3). The data is averaged over 50,000 ms AT and include both injection events.
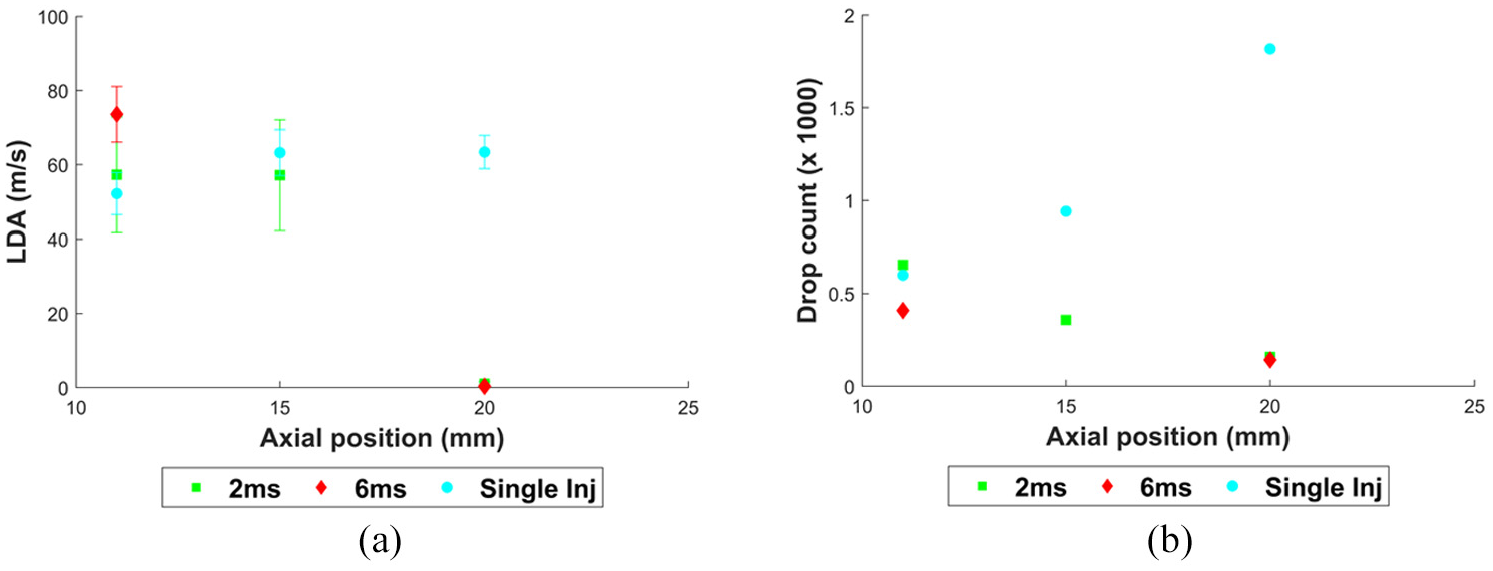
Axial trends of the droplets inside the plume’s core representing: (a) droplets velocities with the standard deviation error bars and (b) drop counts along various distances downstream of the injector. The PW combination is 0.4–0.4 ms for the tested split cases and the PW for the single injection is 0.8 ms.
11 mm downstream of the injector, the average velocities for the split cases are higher than the single injection event, with the largest dwell time of 6 ms possessing the highest average velocities at this position. The average velocities for the split cases at 20 mm elevation decrease to stagnation however. The standard deviation error bars for the split cases, 20 mm downstream, are 0.6 and 0.4 m/s for 2 ms dwell and 6 ms dwell, respectively. The corresponding drop counts 11mm downstream for all test cases are generally similar, with a slightly lower drop count measured for the 6 ms dwell time.
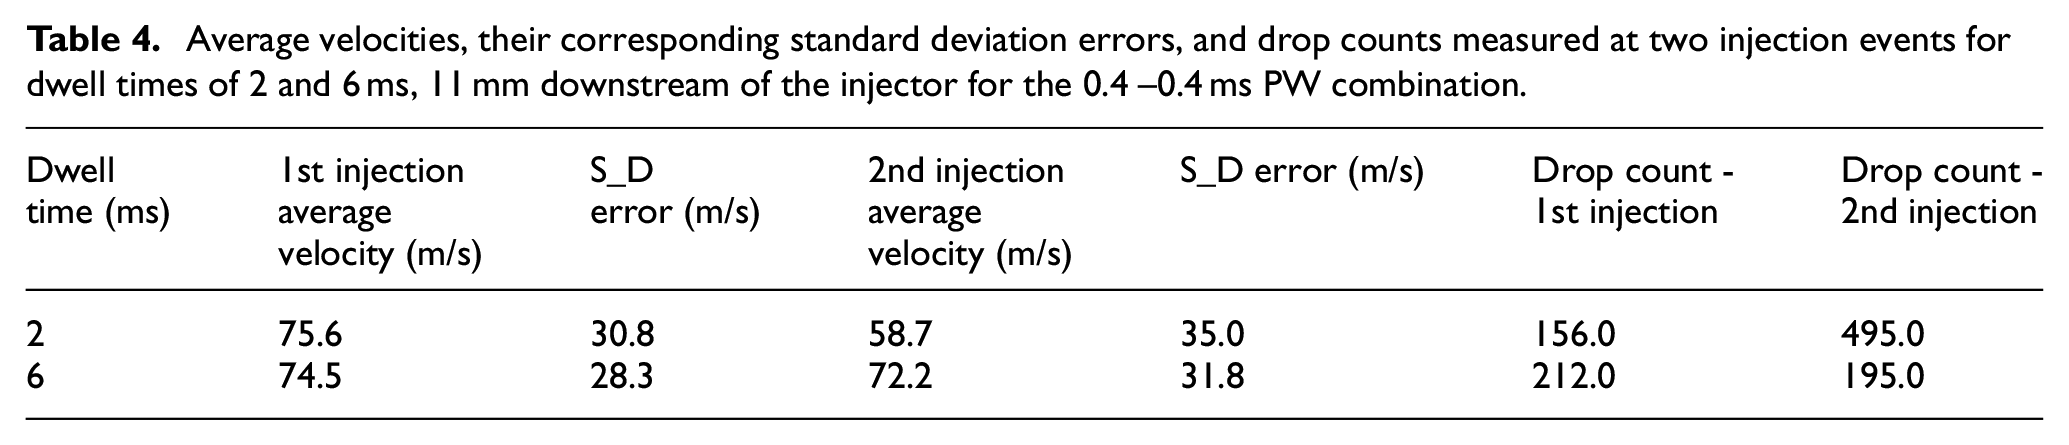
To further understand these trends, Table 4 provides the averaged velocities and drop counts for the first and second injections, for both dwell times tested 11 mm downstream. The transient trends of the velocities and the mean velocities for the three tested cases at this elevation are subsequently presented in Figure 10.
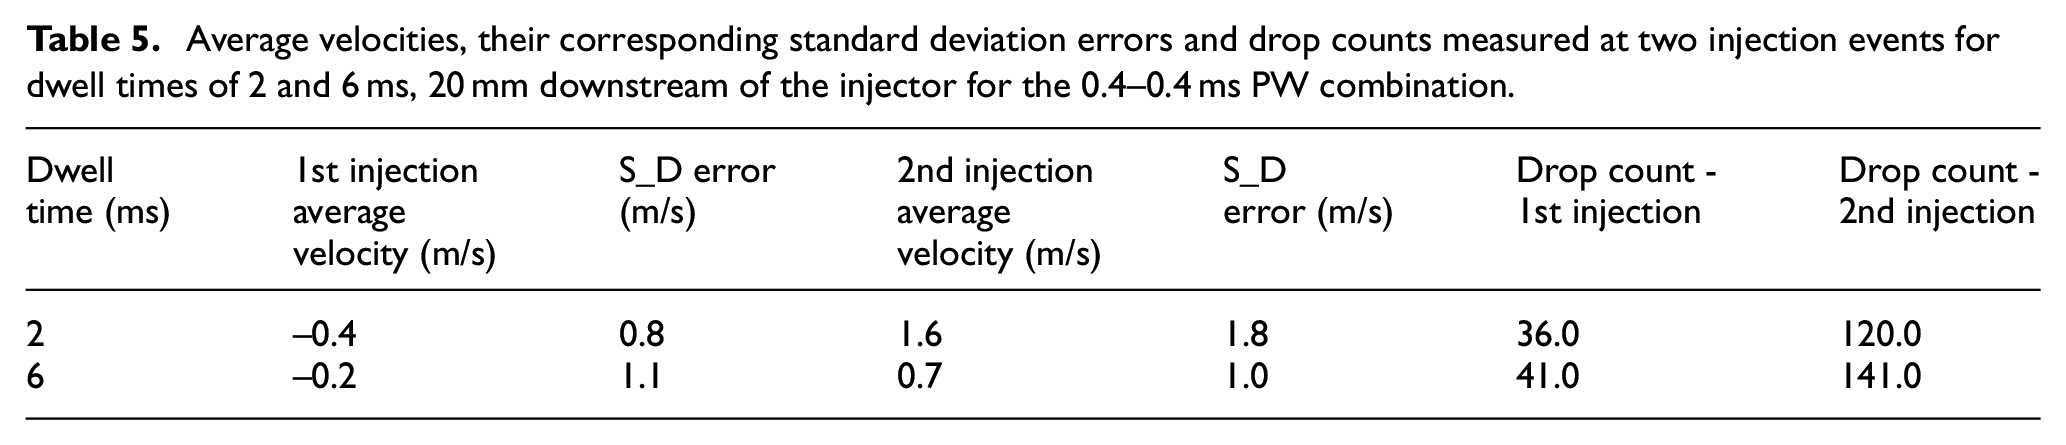
Average velocities, their corresponding standard deviation errors, and drop counts measured at two injection events for dwell times of 2 and 6 ms, 11 mm downstream of the injector for the 0.4 −0.4 ms PW combination.
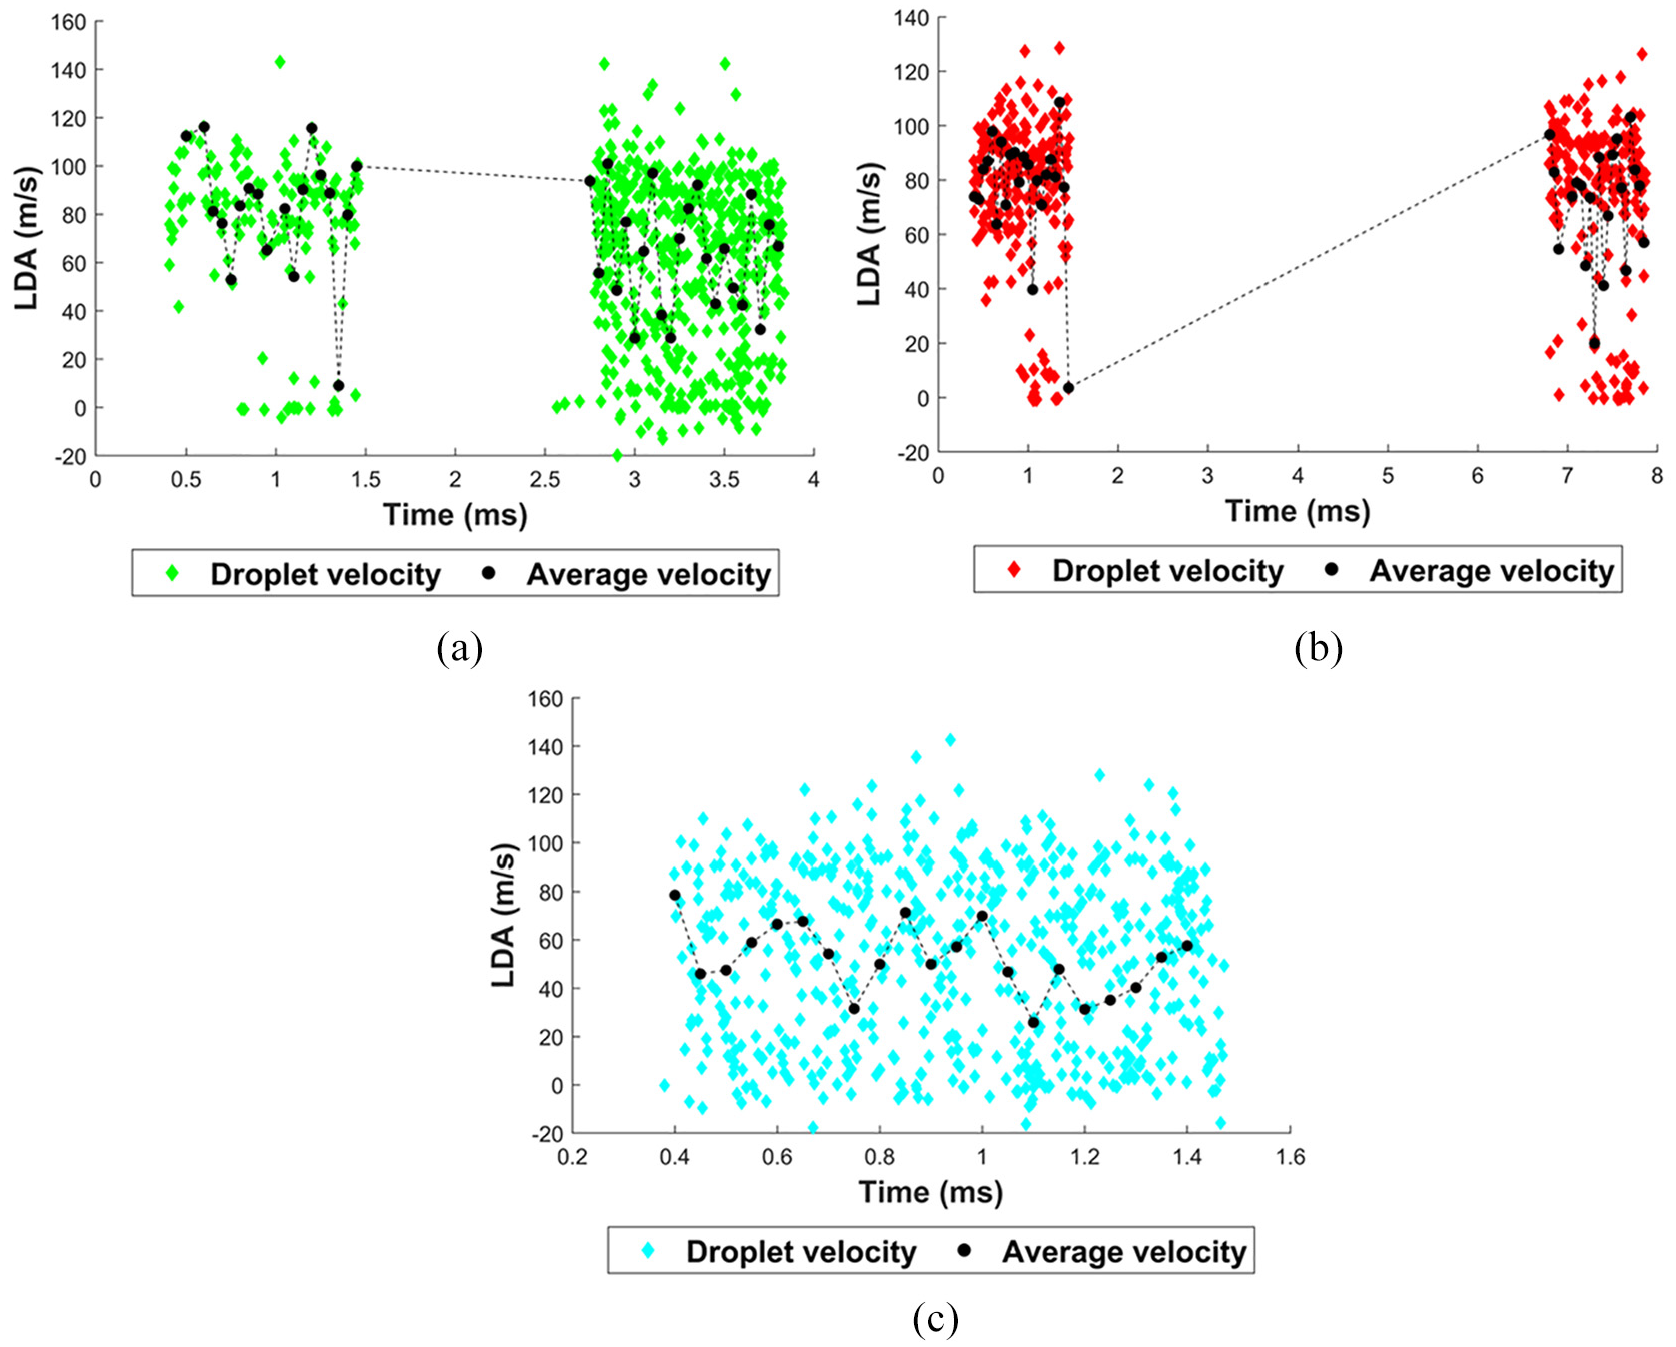
Transient trends of the droplet velocities measured 11 mm downstream of the injector for: (a) 2 ms dwell case, (b) 6 ms dwell case and (c) single injections. The PW combination is 0.4–0.4 ms for the tested split cases and the PW for the single injection is 0.8 ms. The black trend line represents the average droplet velocities.
The transient trend in velocities (Figure 10(a)) shows a large number of droplets in the second injection event which possess low velocities, in the range of −20 to 20 m/s, when compared to the first injection. These velocities are observed from the start of the second injection. The low droplet velocities in the first injection event are detected towards the end of the first injection, which are in fact low in number. One reason for this is the effect of the sudden valve’s closing event towards the end of the first injection, which reduced the pressure due to the throttling effects. 37 This causes deceleration of the droplets prior to exiting the nozzle, which is possibly why the low droplet velocities were detected towards the end of the first injection.
Upon the valve’s opening for the second time after 2 ms dwell, there are greater number of low velocity droplets, in the range of −20 to 20 m/s. Some of these droplets are even detected prior to the start of the second injection. In addition, the drop counts have now more than tripled, when compared to the first injection, albeit the PW being kept the same. This suggests that a number of droplets in the control volume in the second injection event would be those originating from the first injection, which would have been recirculating (as can be interpreted by the large negative velocities) and had propagated towards the vicinity of the injector tip prior to the start of the second injection. It is suspected that high injection pressure would intensify the recirculation velocity. This could cause some droplets, particularly those at the edges of the plume, to travel upwards and close to the injector tip. This phenomenon would have thus led to the reduced average velocity and larger drop counts measured in the second injection event for the 2 ms dwell time (Table 4).
The recirculating droplets close to the injector tip has been stated to form fuel films on the nozzle, as reported by Medina et al. 6 A shear layer is formed between the injected fuel and the ambient gases inside the chamber, which is caused by a complex mixing process that generates air entrainment and mixture between the liquid and vapour phases of fuel with the air. When the mixing occurs, vortices of fuel droplets and vapour are formed, which re-entrain fuel and air back into the bulk flow. This could be the sources of the droplets detected with large negative velocities in the control volume. Those droplets that manage to escape the vortices end up being deposited on the injector tip due to the low-pressure zones formed near the nozzle exit. 6
A dwell time of 6 ms shows similar velocity profile (Figure 10(b)) along with similar averaged velocities and drop counts for the two injection events (Table 4). This suggests that a dwell time of 6 ms is sufficiently large, allowing droplets from the first injection to propagate away from the vicinity of the injector prior to the start of the second injection. This would minimise interactions between the two injection events, but not completely eliminate it.
The droplets with near-zero velocities are again slightly larger in number in the corresponding second injections, when compared to first injections. The presence of these low velocity droplets throughout the second injection implies that even with such a large dwell time, there is the possibility of droplets from the first injection interacting with the second injections, albeit significantly lower in number than those observed in the second injection after 2 ms dwell time.
There is a consistency in the trend of the low velocity droplets being observed towards the end of the first injection for both dwell cases tested. This repeated behaviour confirms the effect of the valve closing on the droplets’ exit velocities.
Another possible reason for the occurrence of the near zero velocities in both injection events is the likelihood of the droplets detected in this region travelling perpendicular to the plume’s direction of motion. This is most likely caused by the large injection pressure, which would cause the droplets to travel with both high radial component and axial component of momentum upon the droplets exit from the nozzles. The low velocity region is also present in the single injection case (Figure 10(c)), but the frequency of this occurrence is large, which alleviates the large fluctuations in the average velocity profiles, when compared to the split cases.
This effect was also observed by Jiang et al., 39 in their studies using 20 MPa injection pressure. They found that smaller particles had a wide range of plume perpendicular velocity close to the injector, while the largest particles that possessed greater momentum continued along the direction of the plume with low transverse velocities. The smaller droplets had responded to the turbulent entrained airflow time scales more readily than the large drops.
However, while this phenomenon is possible, the fact that the low velocities measured towards the end of the first injection indicates that there is a high likelihood of these detected droplet velocities being caused by the valve’s closing events. The larger number of droplets with high negative velocities detected in the second injection, along with the greater drop counts, points toward the interaction of droplets from the first injection with the second injections.
Another observation in the transient trend is the similarities in the second injections’ droplet arrival times for both dwell times tested 11 mm downstream. The droplets arrive around 0.9 ms after the end of the specified dwell time for both dwell cases. This consistency further confirms the lack of needle bounce and the interference of the eddy currents from the first injection on the valve opening time of the second injection, which was observed by Wood A, 36 using shorter dwell times. The similar arrival times indicate repeatable start of injection times for the Solenoid injector, which can be achieved using a minimum dwell time of 2 ms.
This however could be seen as a disadvantage as the repeatable events of the valve’s full opening and closing effects would impact the droplet sizes, as is observed in the following section. On the other hand, Moiz et al., 40 found that using a split PW combination of 0.3–1.2 ms, with a dwell time of 0.65 ms, helped achieve a higher quasi-steady lift-off length, which increased the entrainment effects of the surrounding oxygen in the flame region and led to leaner combustion, when compared to a shorter dwell time of 0.5 ms. These effects would be intensified when employing larger dwells of 2 ms, which would provide sufficient time for the entrainment of the surrounding charge with the atomised droplets from the first injections, prior to the start of the second injection. A potential drawback however would be reduced momentum of the droplets from the first injections towards the end of the dwell time, which could affect the rate of entrainment. As such, 6 ms dwell time would be less favourable in generating a well-mixed lean mixture, with high entrainment rate, when compared to 2 ms dwell time.
The trend in velocities for the split cases 20 mm downstream changes considerably. The transient trends in velocities at this elevation are provided in Figure 11 and the averaged velocities and drop counts for both injection events are provided in Table 5.
Transient trends of the droplet velocities measured 20 mm downstream of the injector for: (a) 2 ms dwell case, (b) 6 ms dwell case and (c) single injections. The PW combination is 0.4–0.4 ms for the tested split cases and the PW for the single injection is 0.8 ms. The black trend line represents the average droplet velocities.
Average velocities, their corresponding standard deviation errors and drop counts measured at two injection events for dwell times of 2 and 6 ms, 20 mm downstream of the injector for the 0.4–0.4 ms PW combination.
For both split cases, the droplets from the first injection are generally recirculating upwards towards the injector, indicating heavy recirculation region at this point. This is represented by the large number of droplets in the negative velocity region (Figure 11(a) and (b)). It is suspected that the plume axis is slightly deflected towards the x co-ordinate of the injector axis (Figure 3), so the droplets measured at this position would be slightly offset from the core of the plume (in other words, at the edge of the plume) being studied 20 mm downstream. However, these droplets seem to create a slip-stream region whereby the droplets from the second injection possess higher overall velocities in the second injection event. This indicates that the droplets from the first injection not only creates a region where the droplets from the second injection are encouraged to accelerate, but also causes the angle of the second plume to reduce slightly, as was also reported in the previous study, 28 whereby a reduction in the second injection’s spray angle was observed. This is independent of the dwell time, as both dwell times indicate a similar transient trend. These larger velocities in the second injections would also enhance the entrainment rate of the surrounding charge and generate a lean pre-mixed mixture prior to the start of the second injection 40 along with a sufficiently large dwell time.
A similar trend was observed by Wood A, 36 when short dwell times in the range of 0.35–1 ms were employed. The author observed that at an axial distance of 10 mm from the injector tip, both injection events presented a similar velocity profile. Further downstream, there was an increase in the maximum velocity observed for the second injection, which was stated to be caused by entrainment from the wake of the first injections.
Observing the trends in the single injection, the overall drop counts increase 20 mm downstream, compared to 11 and 15 mm elevations. The average velocities along the axial distance are similar, with a slight increase in the velocity 20 mm downstream when compared to the near nozzle region. This suggests that 11 mm downstream, with the large PW, the highly fuel dense region near the nozzle made it difficult for all the droplets to be detected. As the optical detection is improved further downstream, greater number of droplets are measured in this region. This indicates that the detection 11 mm downstream possesses some difficulties in representing the actual droplet density. It was reported in 40 that both the validation rate and average data rate had increased with increasing distance away from the injector tip, due to the increased signal strength. In addition, the data rate in the plume centre was reported to be the highest, with the cost of reduced validation rate due to the dense spray obscuring the optical paths. As a result, the slightly larger droplet velocities observed 20 mm downstream, when compared to 11 mm downstream, could be due to the improved optical strength further downstream. This means that the accuracy in the actual average velocity in the near nozzle region could be affected.
Analyses of the droplet sizes
Figure 12 represents the SMDs (D32) of the droplets across varying axial locations in the plume investigated.
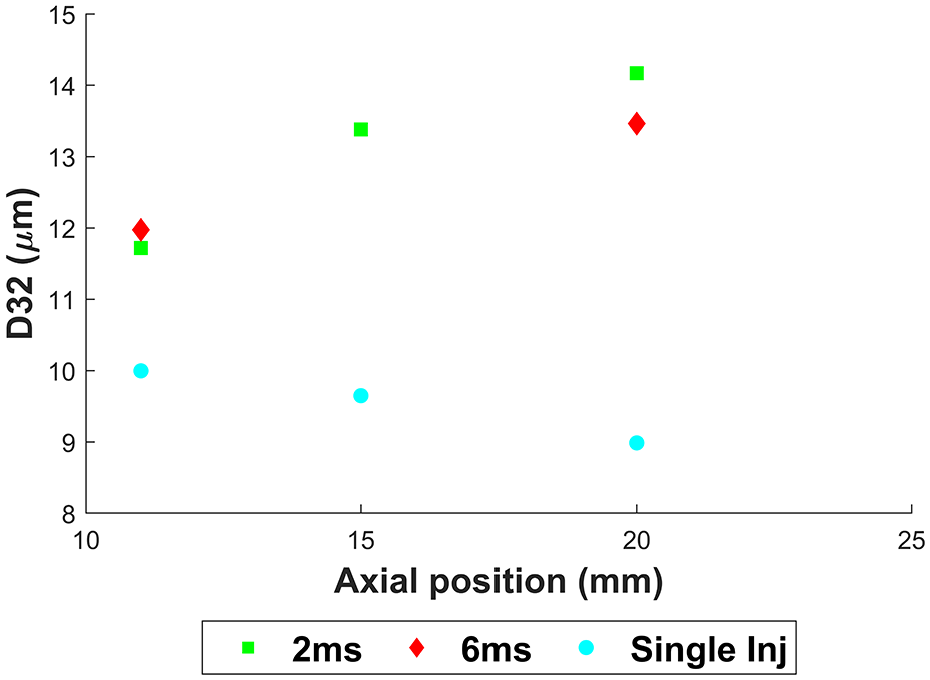
Axial trend in the SMD (D32) of the droplets inside the plume’s core, measured along various distances downstream of the injector. The PW combination is 0.4–0.4 ms for the tested split cases and the PW for the single injection is 0.8 ms.
The trend shows that the droplets injected in a single injection event are generally smaller across all elevations. Additionally, while the SMDs for the single injections decrease with increasing axial distance, the SMDs for the split cases increase.
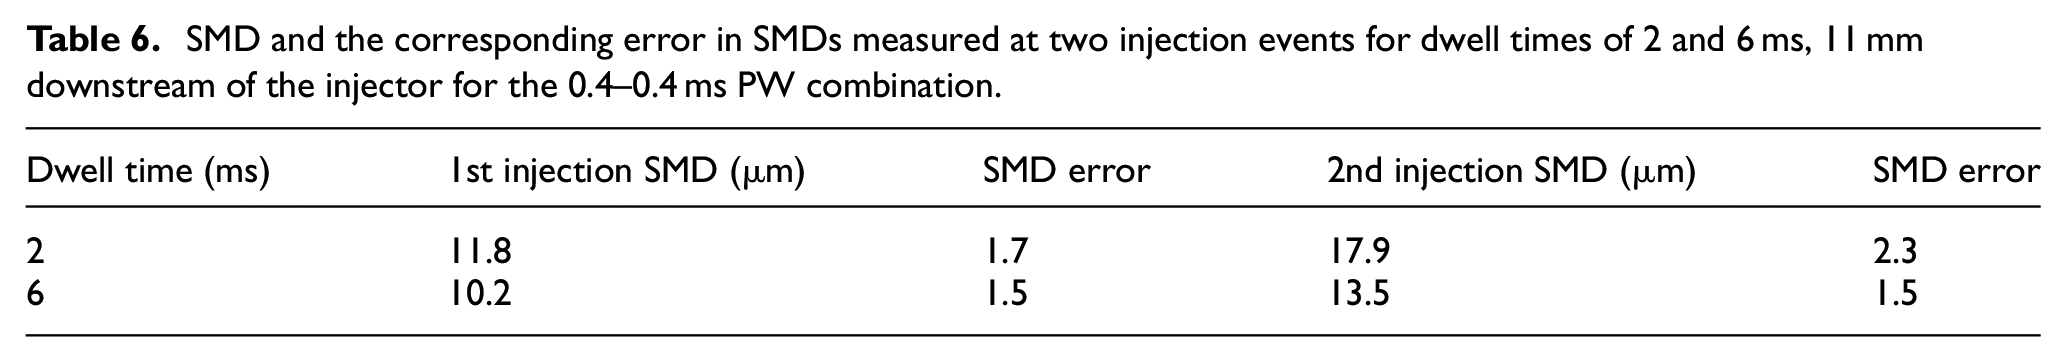
To understand the physical mechanisms causing this trend, we analyse the transient trends in the droplet sizes for all injection cases tested. Tables 6 and 7 provide the SMDs and SMD errors for the first and second injections, 11 mm downstream and 20 mm downstream, respectively. The transient trend of the droplet sizes and the average droplet sizes for the three tested cases are presented in Figures 13 and 14, 11 and 20 mm downstream of the injector, respectively.
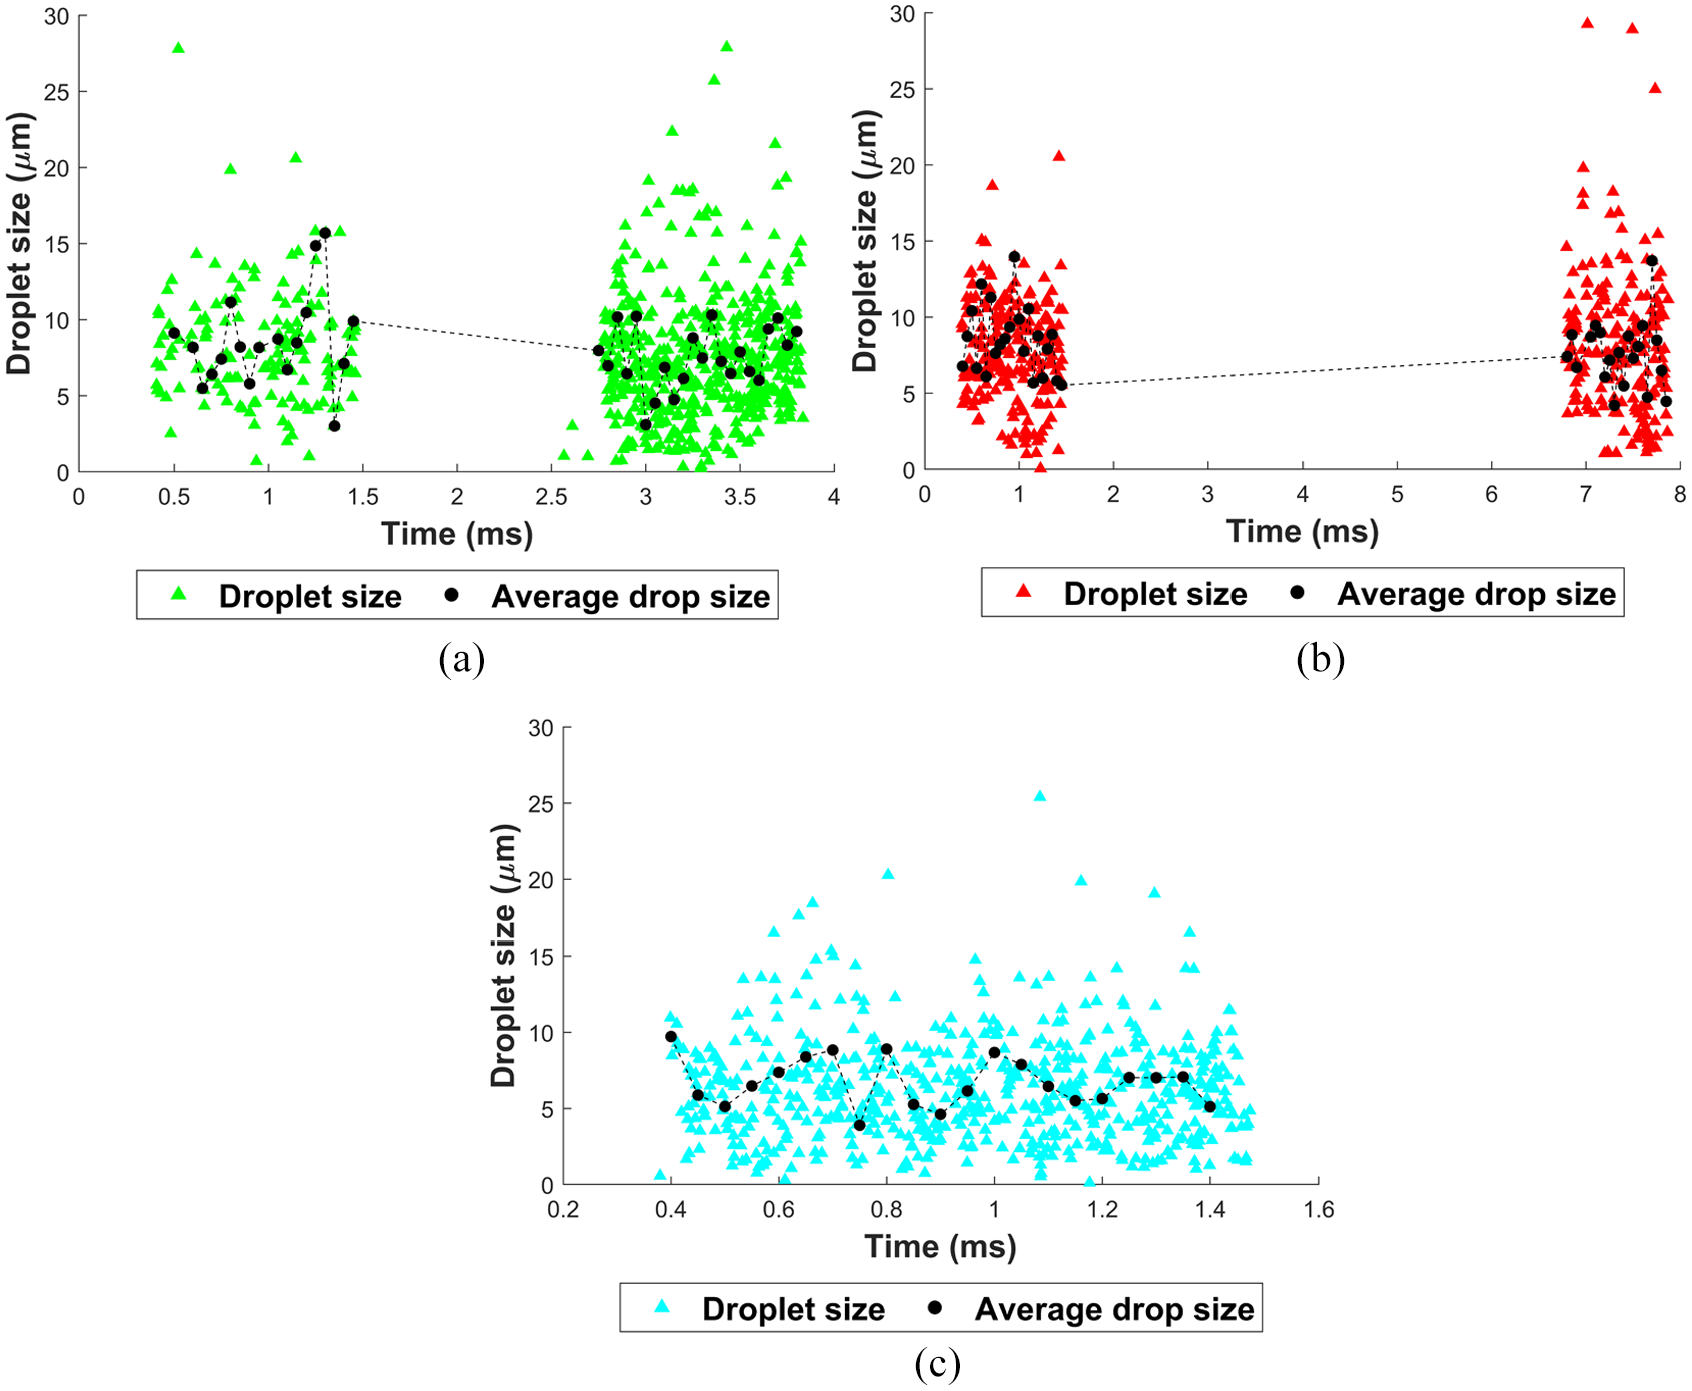
Transient trends of droplet sizes measured 11 mm downstream of the injector for: (a) 2 ms dwell case, (b) 6 ms dwell case and (c) single injections. The PW combination is 0.4–0.4 ms for the tested split cases and the PW for the single injection is 0.8 ms. The black trend line represents the average droplet sizes.
Transient trends of droplet sizes measured 20 mm downstream of the injector for: (a) 2 ms dwell case, (b) 6 ms dwell case and (c) single injections. The PW combination is 0.4–0.4 ms for the tested split cases and the PW for the single injection is 0.8 ms. The black trend line represents the average droplet sizes.
SMD and the corresponding error in SMDs measured at two injection events for dwell times of 2 and 6 ms, 11 mm downstream of the injector for the 0.4–0.4 ms PW combination.
SMD and the corresponding error in SMDs measured at two injection events for dwell times of 2 and 6 ms, 20 mm downstream of the injector for the 0.4–0.4 ms PW combination.
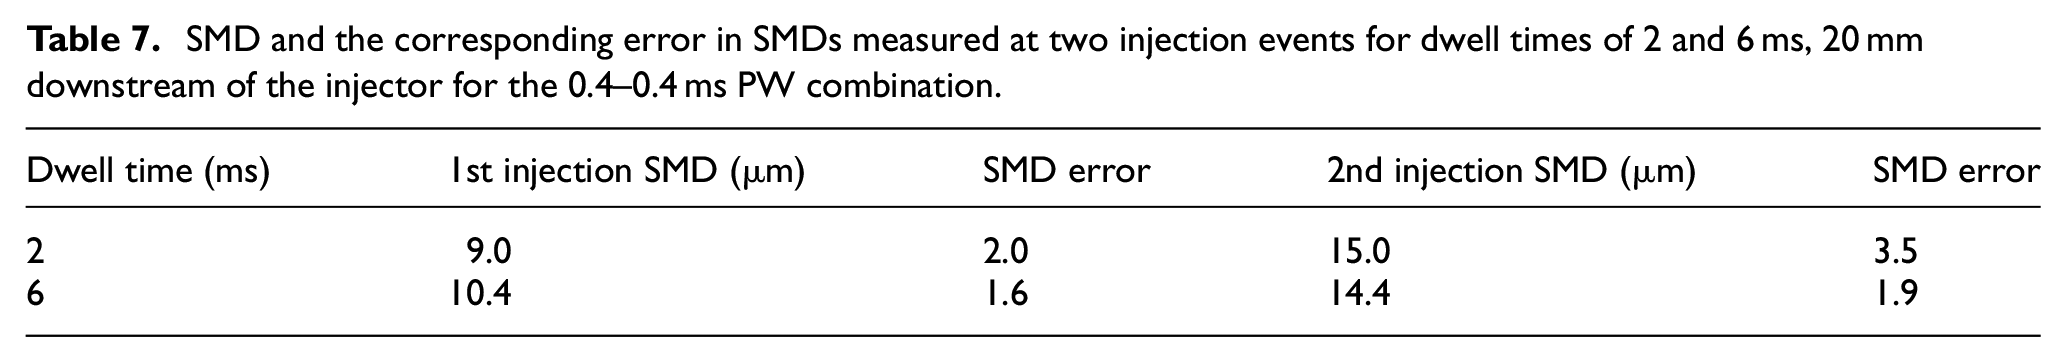
Tables 6 and 7 show that for the elevations of 11 and 20 mm, the SMD of the first injections are of similar order of magnitude as the single injection. This indicates that the variation in PWs or the injected quantity has little effect on the SMDs. The droplet sizes at this elevation could be primarily governed by the high injection pressure.
The SMD and the corresponding error for the second injections increase considerably for the 2 ms dwell case, when compared to the first injection event. Observing the transient trend in the droplet sizes for this dwell case (Figure 13(a)), larger number of droplets are observed in the range of 15–30 µm in the second injection event, which have caused the magnitude of the SMD to increase in comparison.
The larger SMD in the second injection can be correlated with the large number of droplets that possessed high negative velocities observed in the second injections (Figure 13(a) and (b)). The larger SMD in the second injection can thus be attributed to the droplets from the first injection present in the control volume during the second injection, which would interact with other droplets. This would subsequently cause the droplets from both injection events to coalesce with each other and form larger droplets overall.
This is contrary to the observations made in. 36 They observed that the number of large droplets for the second and subsequent injections had been greatly reduced due to the faster opening of the valve with split injection strategies, when employing short dwells times. A steady state spray was achieved more rapidly than for a comparable single injection. One disadvantage with using large dwell times greater than 2 ms therefore is the absence of the eddy current from the first injection advancing the second injection, which subsequently helps achieve the steady state region faster, thereby reducing the droplet sizes.
When observing the transient trends of the droplet sizes in the first injection, it increases towards the end of the first injection. This is the region where the low velocity droplets were observed, which was stated to be affected by the closing of the Solenoid valve. It can thus be deduced that along with the reduction in the exit velocities towards the end of the first injection, the droplet sizes are also affected.
Mouvanal, 4 and Medina et al., 6 observed that the end of injection event had led to tip wetting, with large droplets settled at the tip of the injector caused by the large surface tension forces and reduction in pressure due to the throttling effect. These effects had formed large droplets and ligaments. While macroscopic visualisation close to the injector tip was not performed in the current study, the subsequent large droplets measured towards the end of the first injection event, 11 mm downstream of the injector, could be correlated to the reduced pressure of the droplets prior to exiting the nozzle during the closing event, potentially forming large droplets.
The SMD for the 6 ms dwell case is also observed to increase in the second injection event, but to a lesser extent compared to the shorter dwell case. This is again owing to potential interactions between the droplets from the two injection events. The reduced number of these large droplets and the reduced number of low velocities in the transient profiles of the second injections (Figure 13(b)), when compared to those measured with 2 ms dwell, can be attributed to the lesser increase in the SMD in the second injection event (Table 6). This is also indicated by the lower SMD error in the second injection compared to that measured during the shorter dwell case.
The increase in SMD in the second injection is also observed 20 mm downstream, for both dwell times, albeit the general increase in the velocities of the second injections observed at this elevation. This suggests that the interaction between both injection events is significant, especially since the droplets from the first injection would be stagnating or recirculating with low velocities in this region by the start of the second injections, as represented in the high-speed images in Figure 6 and the recirculation velocities measured in Figure 13(a) and (b).
In addition, one would expect the droplet sizes further downstream to decrease owing to phases of atomisation, as observed for the corresponding single injection case. The lack of similar characteristics observed with the split injection confirms that the larger measured SMDs in Figure 12 are mainly owing to droplets coalescing.
The transient trends in the droplet sizes for the single injection case 11 and 20 mm downstream presented in Figures 13(c) and 14(c). respectively, indicate minor fluctuations in the average droplet sizes during the measurement period. The corresponding SMD error 11 and 20 mm downstream are 1.9 and 2 respectively. This trend, along with the variation in SMD with increasing axial distance suggests that the droplet sizes decrease uniformly with increasing distance downstream. This is indicative of the phases of atomisation that the droplets would be undergoing as they propagate further downstream and face large shear forces which break the droplets up further.
Spray characterisation - 2:1 split ratio, large PW combination
The effects of a larger first PW with a split ratio of 2:1 (0.8–0.4 ms) are analysed at varying distances downstream of the injector. The variation in the spray characteristics are analysed for increasing dwell times, from 2 to 11 ms. These characteristics are compared against single injections, with the PW of 1.2 ms equating to the total PW of the split injection.
Analyses of the droplet velocities
The trend of the droplet average velocities, increasing distance downstream from the injector tip, in the rear plume of the spray are presented in Figure 15. These measurements represent the average velocities of droplets measured over 50 ms AT.
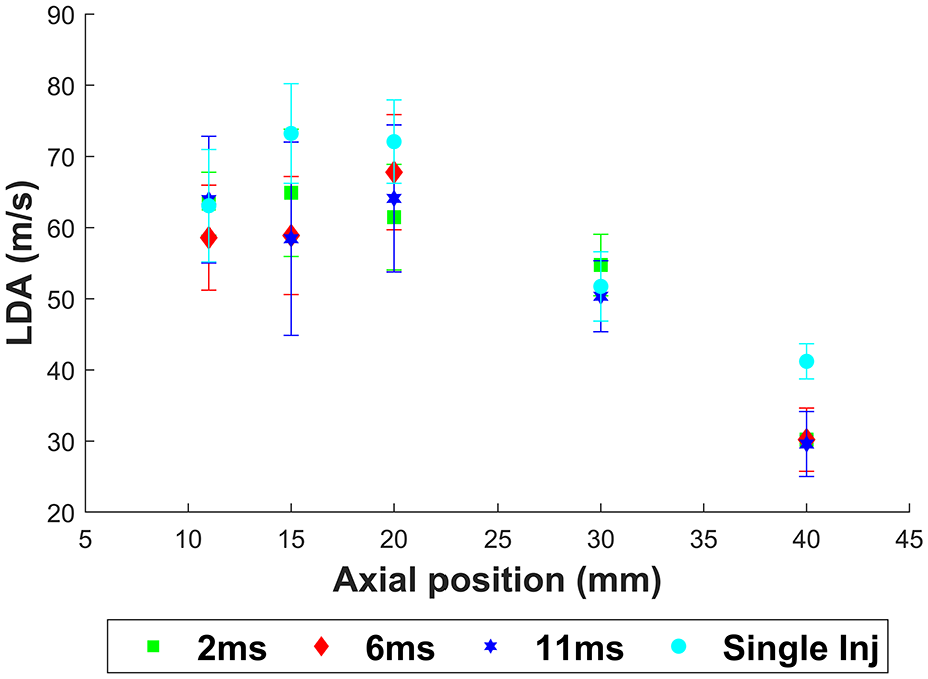
Axial trend in the average velocities (LDA) of the droplets in the rear plume’s core, for single and split cases, measured along various distances downstream of the injector. 31 The error bars represent the standard deviation of the measured velocities. The PW combination is 0.8–0.4 ms for the tested split cases and the PW for the single injection is 1.2 ms.
The trend indicates similar droplet mean velocities along with the corresponding error bars between the injection strategies and varying dwell times. This is true for all elevations tested. The highest axial velocity regions are between 11 and 20 mm downstream of the injector, with the highest overall velocities observed for the single injection case.
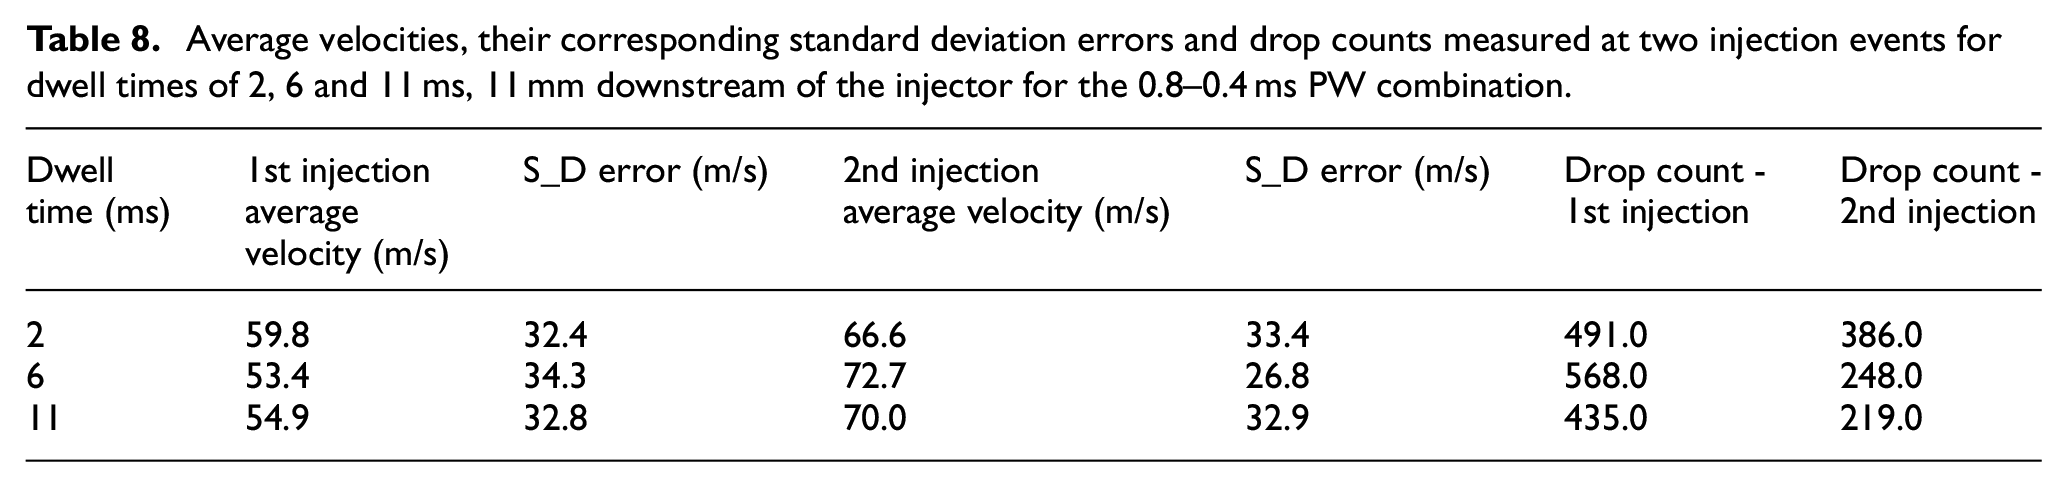
To investigate these trends further, Table 8 provides the differences in the mean velocities, corresponding standard deviation errors and drop counts for the two injection events and the three tested dwell times 11 mm downstream. Figure 16 provides the transient trends of the velocities for the four tested injection cases, with the black dotted line indicating the average velocity.
Average velocities, their corresponding standard deviation errors and drop counts measured at two injection events for dwell times of 2, 6 and 11 ms, 11 mm downstream of the injector for the 0.8–0.4 ms PW combination.
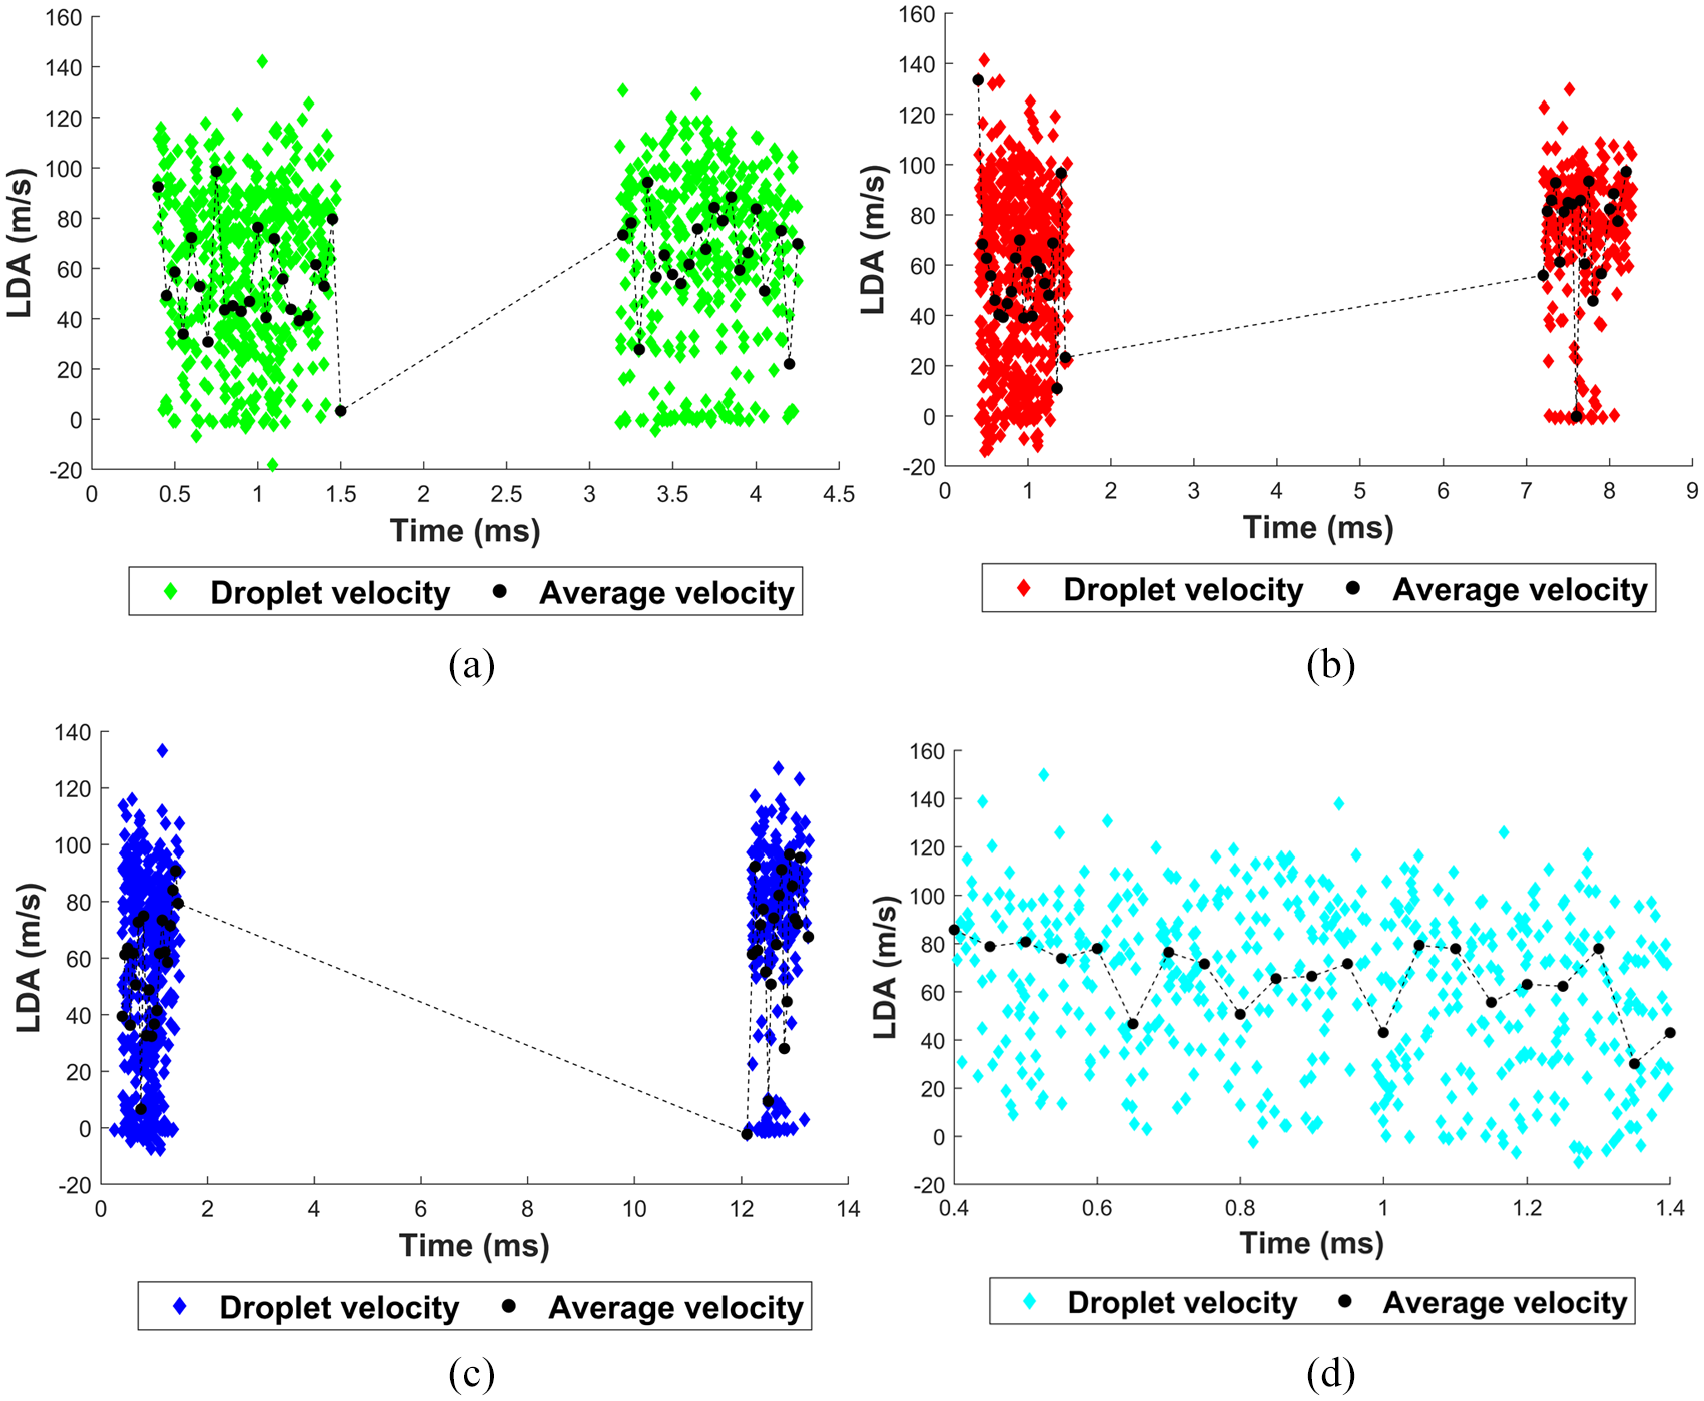
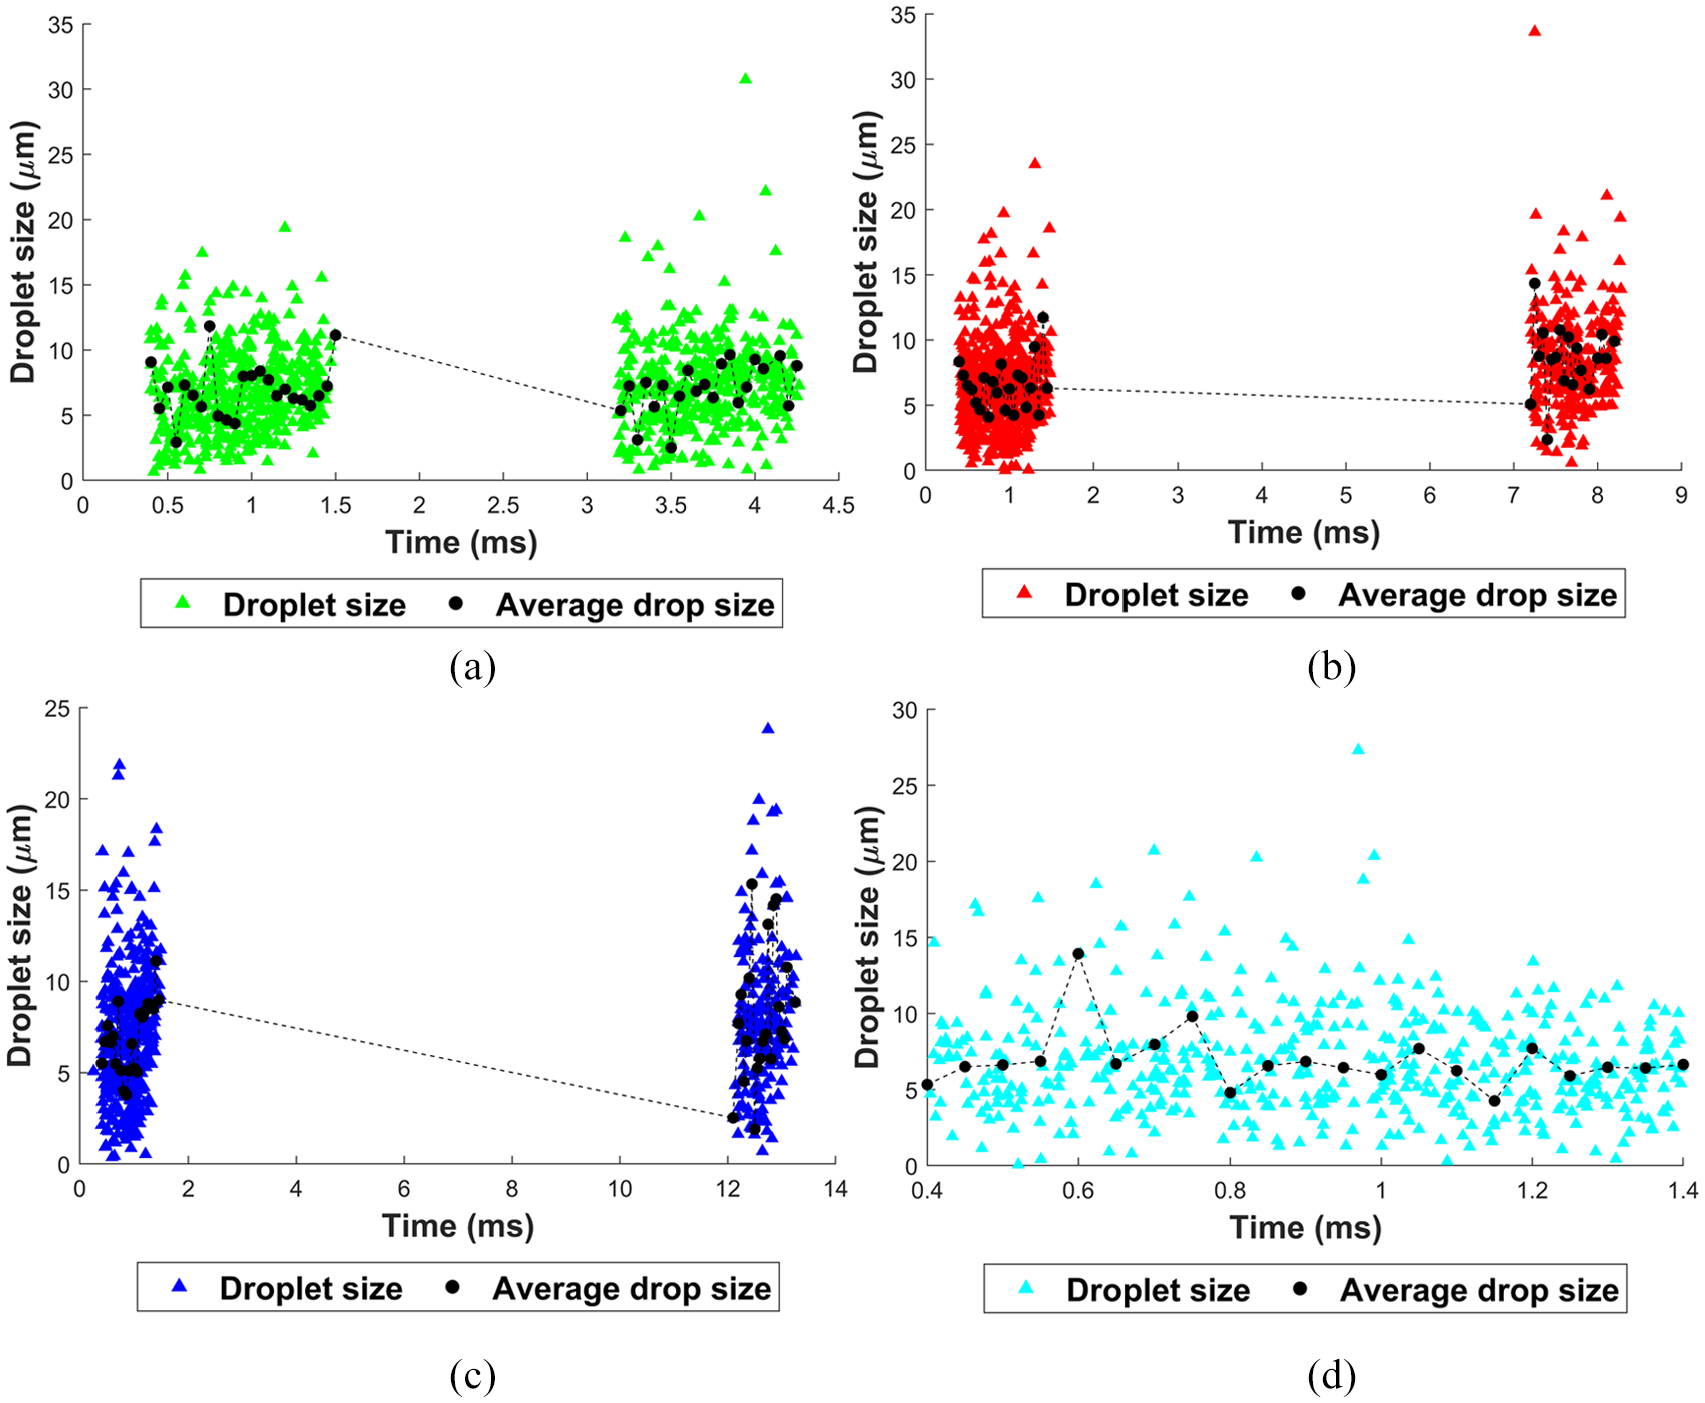
Transient trends of the droplet velocities measured 11 mm downstream of the injector for: (a) 2 ms dwell case, (b) 6 ms dwell case, (c) 11 ms dwell case, and (d) single injections. The PW combination is 0.8 ms–0.4 ms for the tested split cases and the PW for the single injection is 1.2 ms. The black trend line represents the average droplet velocities.
Table 8 shows higher average velocities for the second injections for all dwell times, compared to the first injections. These velocities, corresponding to the shorter second PW, are comparable to the average velocities observed with the first injections using 1:1 split ratio (Table 4). This suggests that 11 mm downstream, there are negligible effects of the larger first injection and dwell times on the velocities of the droplets from the second injections, as the measured velocities in the near-nozzle region are primarily driven by the high momentum region using the high injection pressure close to the injector.
The average velocities of the 0.8 ms PW in the first injection are lower when compared to the shorter PW of 0.4 ms. Observing the transient trends for all dwell times (Figure 16(a)–(c)) greater number of droplets in the low velocity region in the range of −20 to 20 m/s are detected throughout the first injection period. The fact that such a large number of droplets with the low velocities are observed in the first injection suggests that the larger the PW, (1) the larger the number of droplets travelling in the direction perpendicular to the plume and (2) greater the likelihood of recirculating droplets at the plume’s edges travelling back into the plume’s core. The latter is potentially caused by the greater resistive forces, resisting the propagation of the small droplets at the spray’s edges under ambient conditions. This would force some of the droplets at the edges to recirculate back towards the centre of the plume and toward the injector tip. The resistance forces seem to increase with both large injection pressure and large PW. This is possibly because of the momentum transfer between the large injection momentum and the surrounding flow field. The overall velocity range between the two injection events however, are comparable.
Furthermore, due to the larger first PW, the transient trend in velocity was expected to have less fluctuations in velocities after a certain time after start of injection once the steady state region of the spray was achieved. 38 The standard deviation errors are in fact comparable for all PWs tested at this elevation. The main source of the large errors is suspected to be the large pressure waves, increasing the shot-to-shot variability 38 and resulting in large fluctuations in the droplet velocities, independent of the PW.
Additionally, the error bar for the single injection case with a PW of 1.2 ms is 33.3 m/s, which is comparable to the split cases in both injection events. The transient trend of the velocity (Figure 16(d)) shows a consistent trend in velocities ranging between 0 and 120 m/s. The magnitude of this error bar is also comparable to that measured 11 mm downstream for the 0.8 ms PW in Figure 9, whose standard deviation error was 35.6 m/s. The similarity in the errors makes the transient steady-state region, typically achieved with large PWs, difficult to detect at least in the near-nozzle region, 11 mm downstream.
40 mm downstream of the injector, the average velocities decrease for all cases, along with the corresponding error (Figure 15). Table 9 provides the differences in the mean velocities, corresponding standard deviation errors and drop counts for the two injection events and the three tested dwell times at this elevation. Figure 17 provides the transient trends in velocities for the four tested injection cases, with the black dotted line indicating the average velocity.
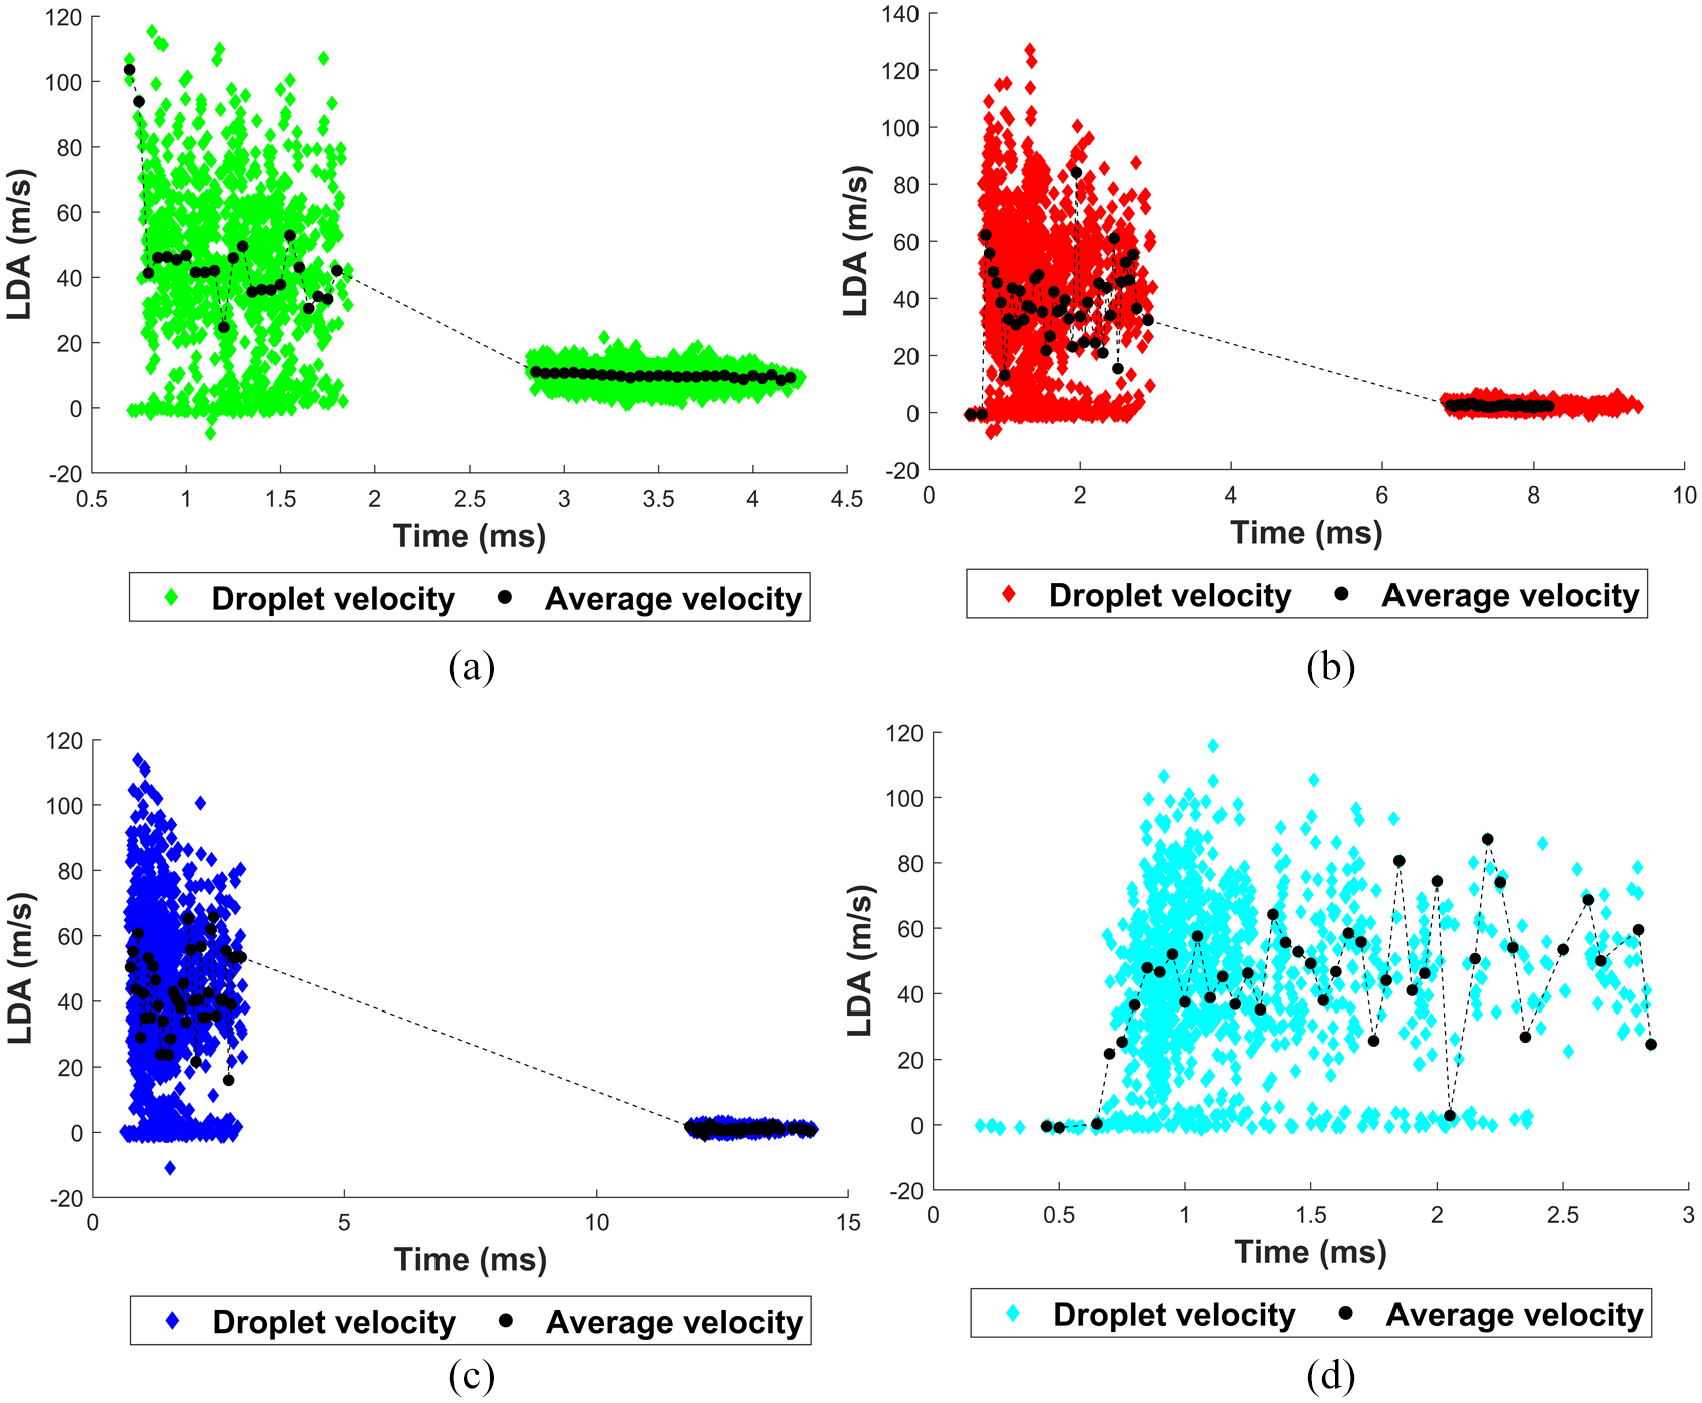
Average velocities, their corresponding standard deviation errors and drop counts measured at two injection events for dwell times of 2, 6 and 11 ms, 40 mm downstream of the injector of the injector for the 0.8–0.4 ms PW combination.
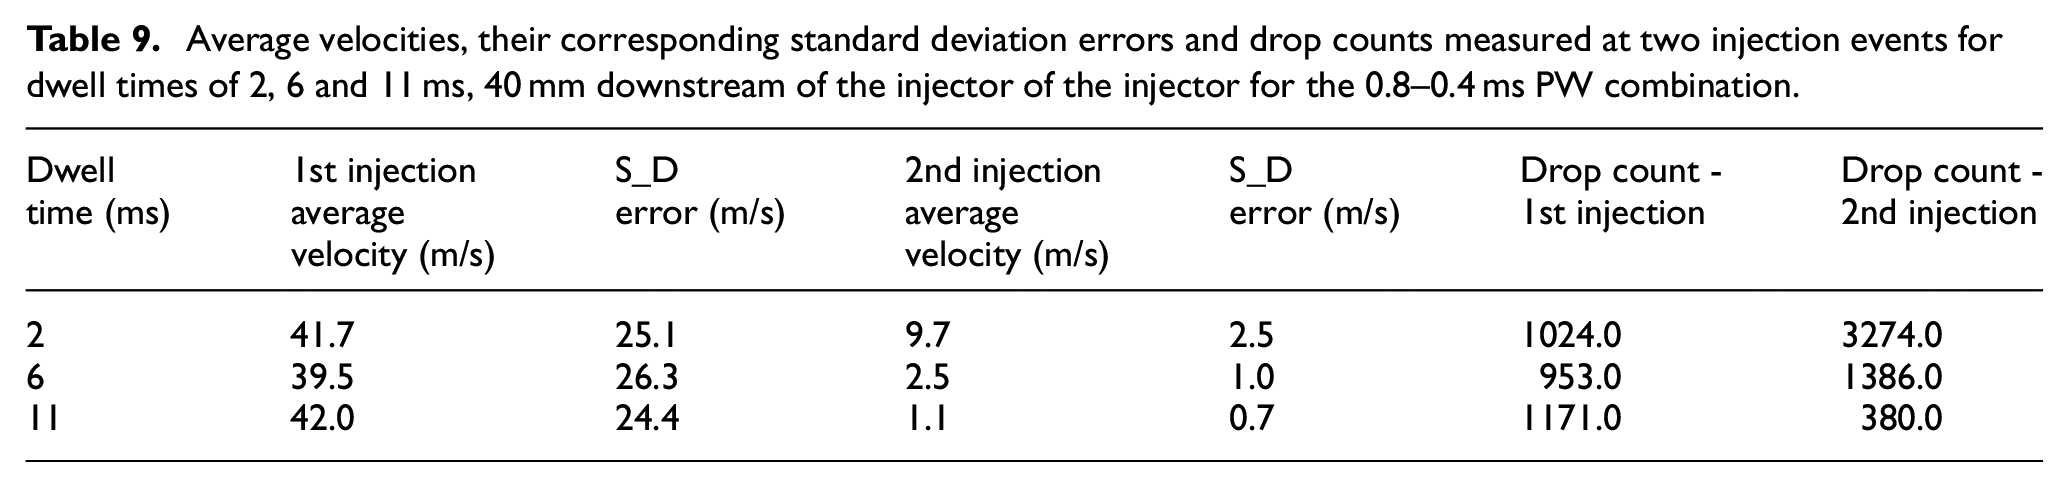
Transient trends of the droplet velocities measured 20 mm downstream of the injector for: (a) 2 ms dwell case, (b) 6 ms dwell case, (c) 11 ms dwell case, and (d) single injections. The PW combination is 0.8 ms–0.4 ms for the tested split cases and the PW for the single injection is 1.2 ms. The black trend line represents the average droplet velocities.
It is worth noting here that a distinctive band of low velocity droplets, in the transient velocity profiles of the first injections are observed throughout the injection durations. This band is more distinctive than the transient profile observed 11 mm downstream for this PW. A similar observation was made by Zhou et al., 24 using injection pressures of up to 10 MPa, and injection durations in the range of 0.56–0.8 ms. They stated that the variation in the liquid fuel distribution (which would also consist of large droplets) along the injection direction is greater than that perpendicular to the injection direction. With the downstream development of the spray, these variations in the spray edge increased and the variations perpendicular to the injection direction become more apparent. It is believed that the clear band of low velocity droplets observed in the first injection 40 mm downstream indicate a more obvious segment of droplets travelling in the direction perpendicular to the plume’s direction of travel.
At this elevation, the average velocities in the second injections generally reduce to stagnation. This indicates the furthest point at which the droplets propagate when injected at 0.4 ms PW. The calculated average penetration length of this PW was 40 mm, with a standard deviation error of ±1.5 mm.
Observing the drop counts 40 mm downstream in Table 9, the higher the dwell time, the lower the drop counts measured in the second injection event. This was also observed 11 mm downstream (Table 8). This confirms that the interaction of the droplets from the first injections reduce progressively with increasing dwell, as they have more time to propagate away from the vicinity of the flow field prior to the start of the second injections.
Analyses of the droplet sizes
Figure 18 represents the SMDs (D32) of the droplets across varying axial locations in the plume.
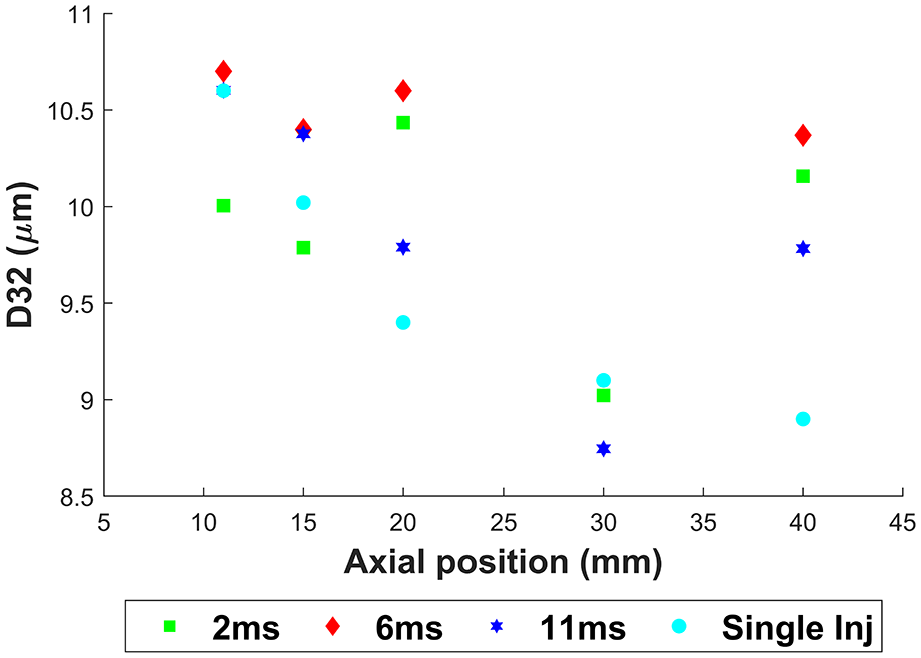
Axial trend in the SMD (D32) of the droplets inside the plume’s core, measured along various distances downstream of the injector. The PW combination is 0.8–0.4 ms for the tested split cases and the PW for the single injection is 1.2 ms.
Contrary to the axial trend in the SMD observed for the 1:1 split ratio, the SMDs for all cases injected using a 2:1 split ratio generally decrease with increasing distance downstream of the injector. The lowest rate of reduction in the SMD with increasing distance downstream, is associated with the split case with 6 ms dwell time. Near the injector, between 11 and 20 mm, the smallest SMD is associated with the 2 ms dwell time. In spite of the greater rate of interaction of droplets between the two injection events at the short dwell time, the rate of atomisation seems to be high.
The results 40 mm downstream indicate large increase in SMDs for the split cases, while the droplets from the single injection continue to decrease. Diminished radial and axial momentum here could increase the likelihood of the droplets’ coalescence between the two injection events or from the low-velocity vortices generated, especially since the ambient pressure is low.
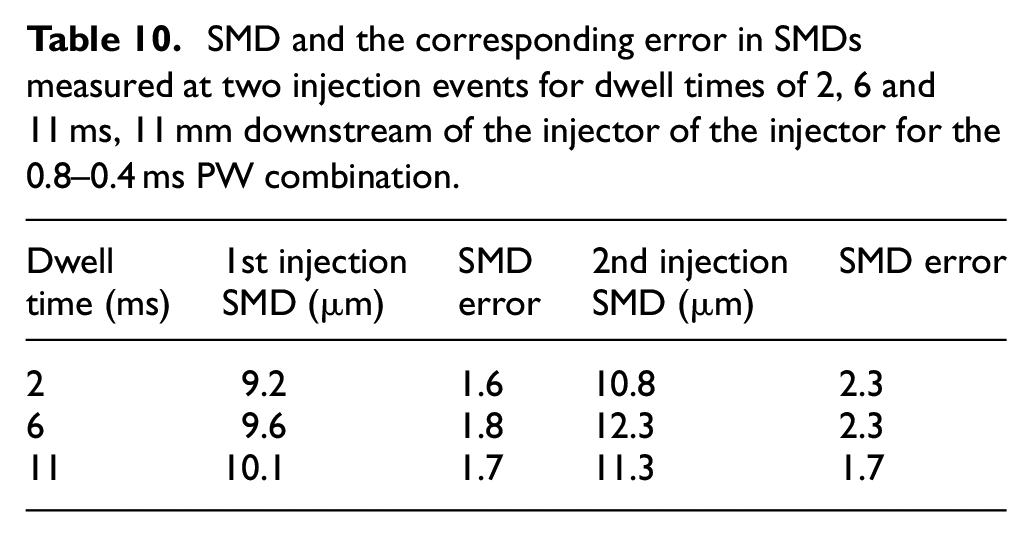
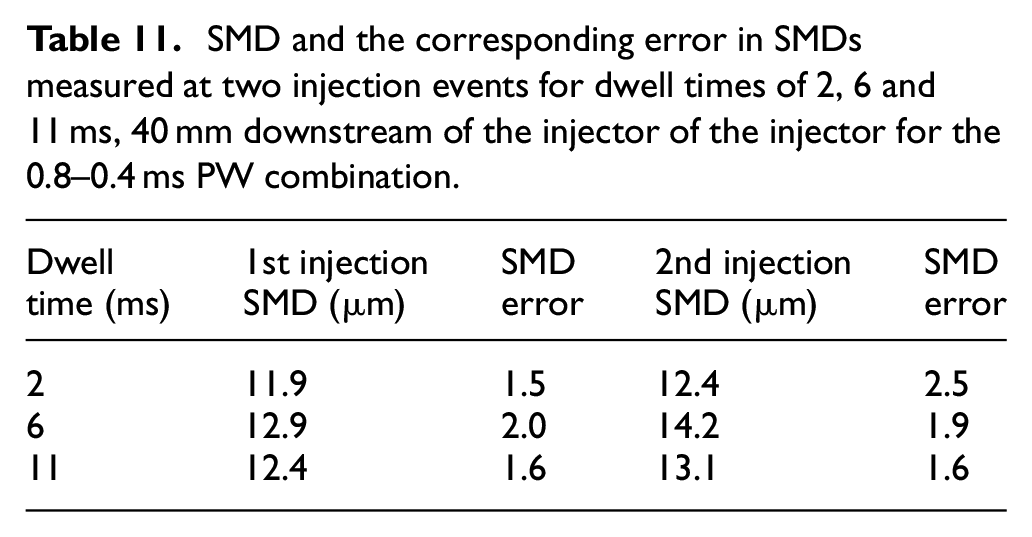
Table 10 and Figure 19 further provide the SMD for the two injection events and transient trends of drop sizes, respectively, 11 mm downstream. Upon a closer look at the differences in the SMDs between both injection events provided in Table 10, the SMDs measured in the second injections are larger than the first injection. This is also accompanied by larger error bars in the SMDs, with the exception of the 11 ms dwell time. These larger droplet sizes in the second injection are also characteristic of the 0.4 ms PW, as the sizes are similar to the SMDs measured in the first injection event with the 1:1 split ratio (Table 6). These features further confirm the effect of the closely spaced valve’s opening and closing times on the droplet sizes. The average drop sizes are seen to increase towards the end of the second injection, for all dwells tested, which indicates the effect of the valve closing event on the injected droplet sizes.
SMD and the corresponding error in SMDs measured at two injection events for dwell times of 2, 6 and 11 ms, 11 mm downstream of the injector of the injector for the 0.8–0.4 ms PW combination.
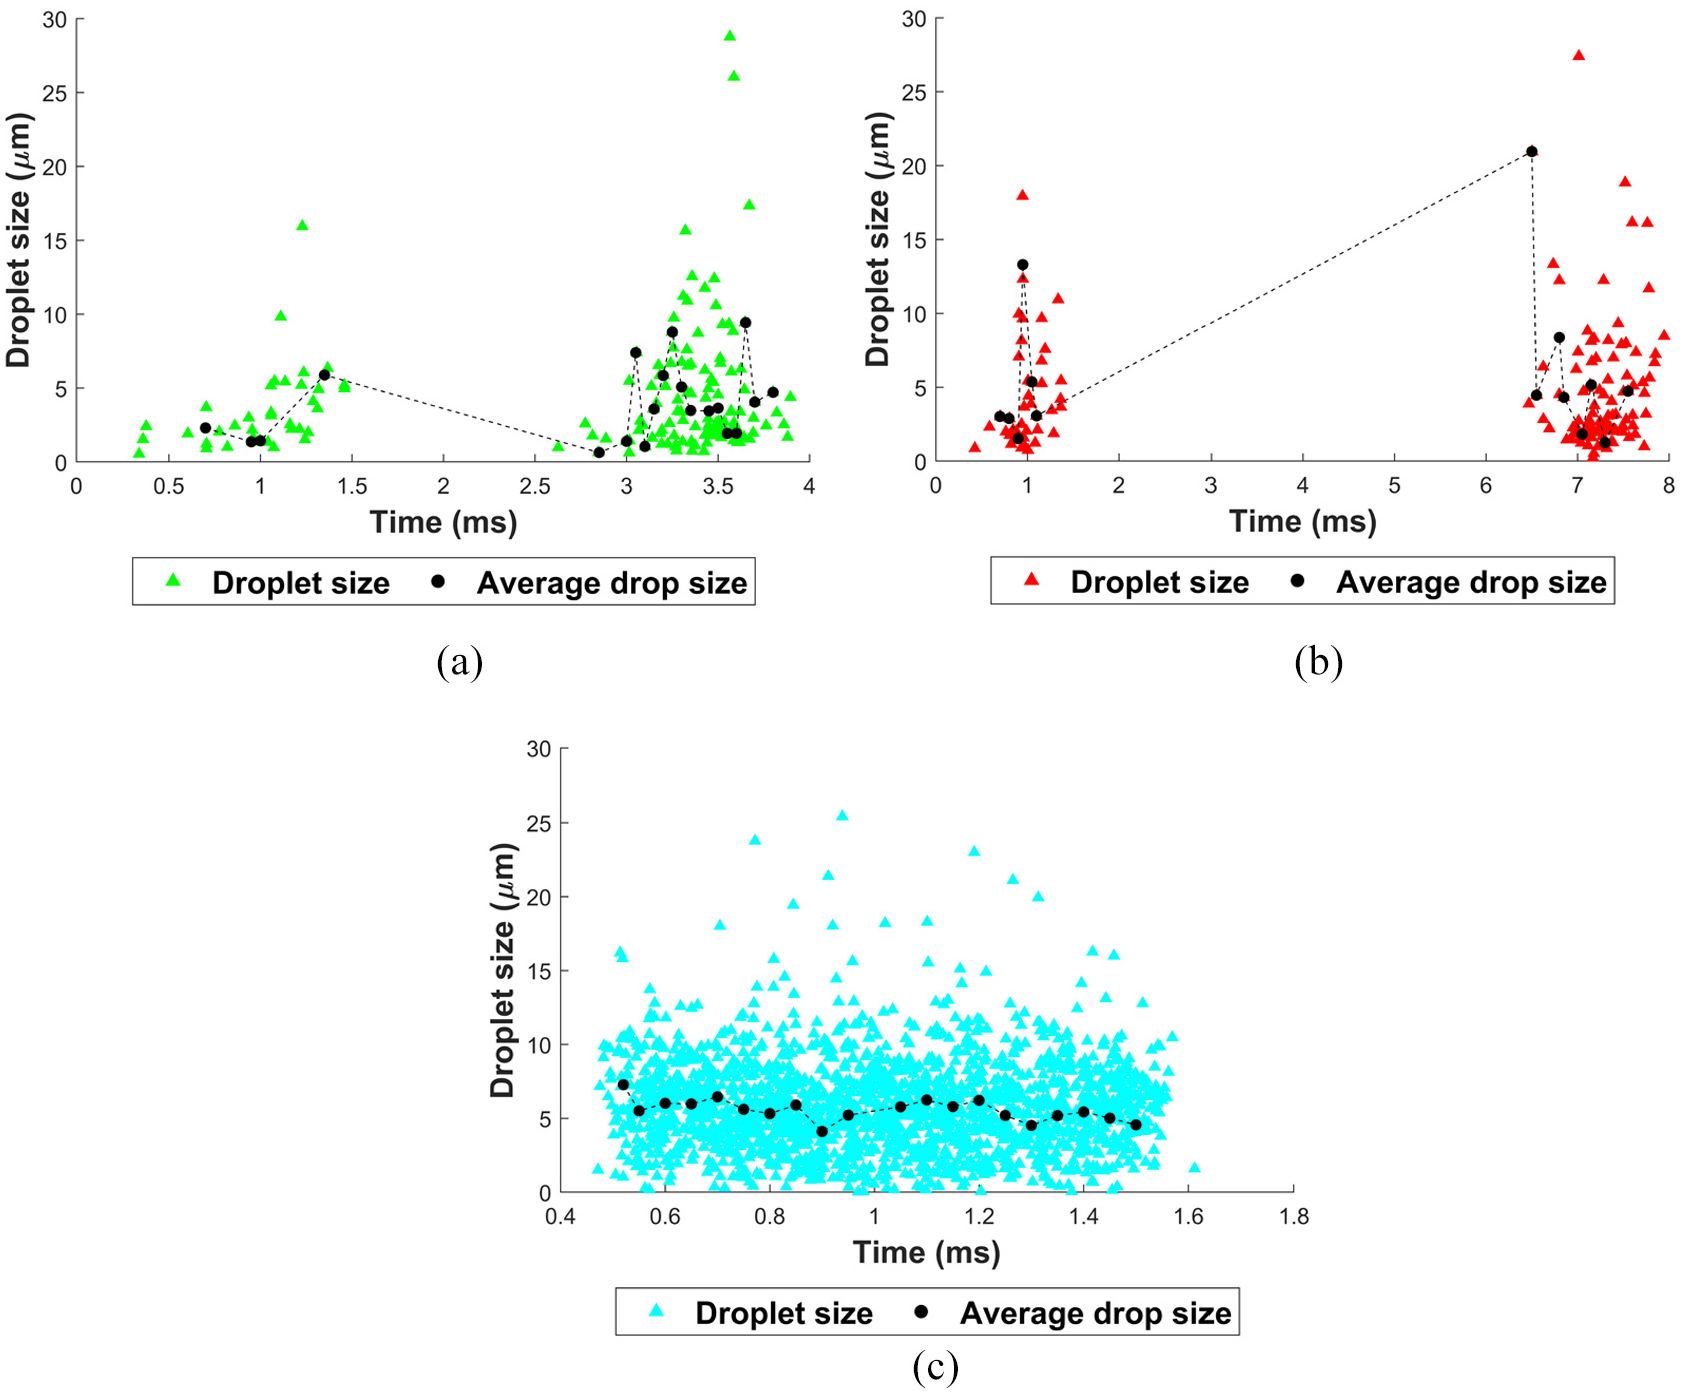
Transient trends of droplet sizes measured 11 mm downstream of the injector for: (a). 2 ms dwell case, (b) 6 ms dwell case, (c) 11 ms dwell case and (d) single injections. The PW combination is 0.8–0.4 ms for the tested split cases and the PW for the single injection is 1.2 ms. The black trend line represents the average droplet velocities.
Furthermore, the second injections exhibit greater number of droplets in the range of 15–35 µm. This variation in the drop sizes between the two different PWs further suggests that the droplets from the short PWs suffer from poorer atomisation, observed close to the injector tip, when compared to the larger PWs. This effect is owing to a combination of the operation in the ballistics zone, the sudden valve closing event and interaction with the recirculating droplets from the first injection.
The second injections’ SMDs 40 mm downstream (Table 11) are still larger than the corresponding first injections. These sizes have also superseded the SMDs measured 11 mm downstream for the second PW. Observing the transient trends in the droplet sizes for all the split cases, the average droplet size trend in the second injections increase with increasing time ASOI, in spite of the near-zero droplet velocities measured here (Figure 20(a)–(c)). This trend is in fact independent of the dwell times. When comparing the SMD between 2 and 11 ms (Table 11), the drop sizes increase for the second injection event to similar magnitudes, even though the drop counts in the second injections for the larger dwell time are reduced. The trends suggest that the droplet sizes increase owing to coalescence between the stagnated or low momentum droplets in the second injection events.
SMD and the corresponding error in SMDs measured at two injection events for dwell times of 2, 6 and 11 ms, 40 mm downstream of the injector of the injector for the 0.8–0.4 ms PW combination.
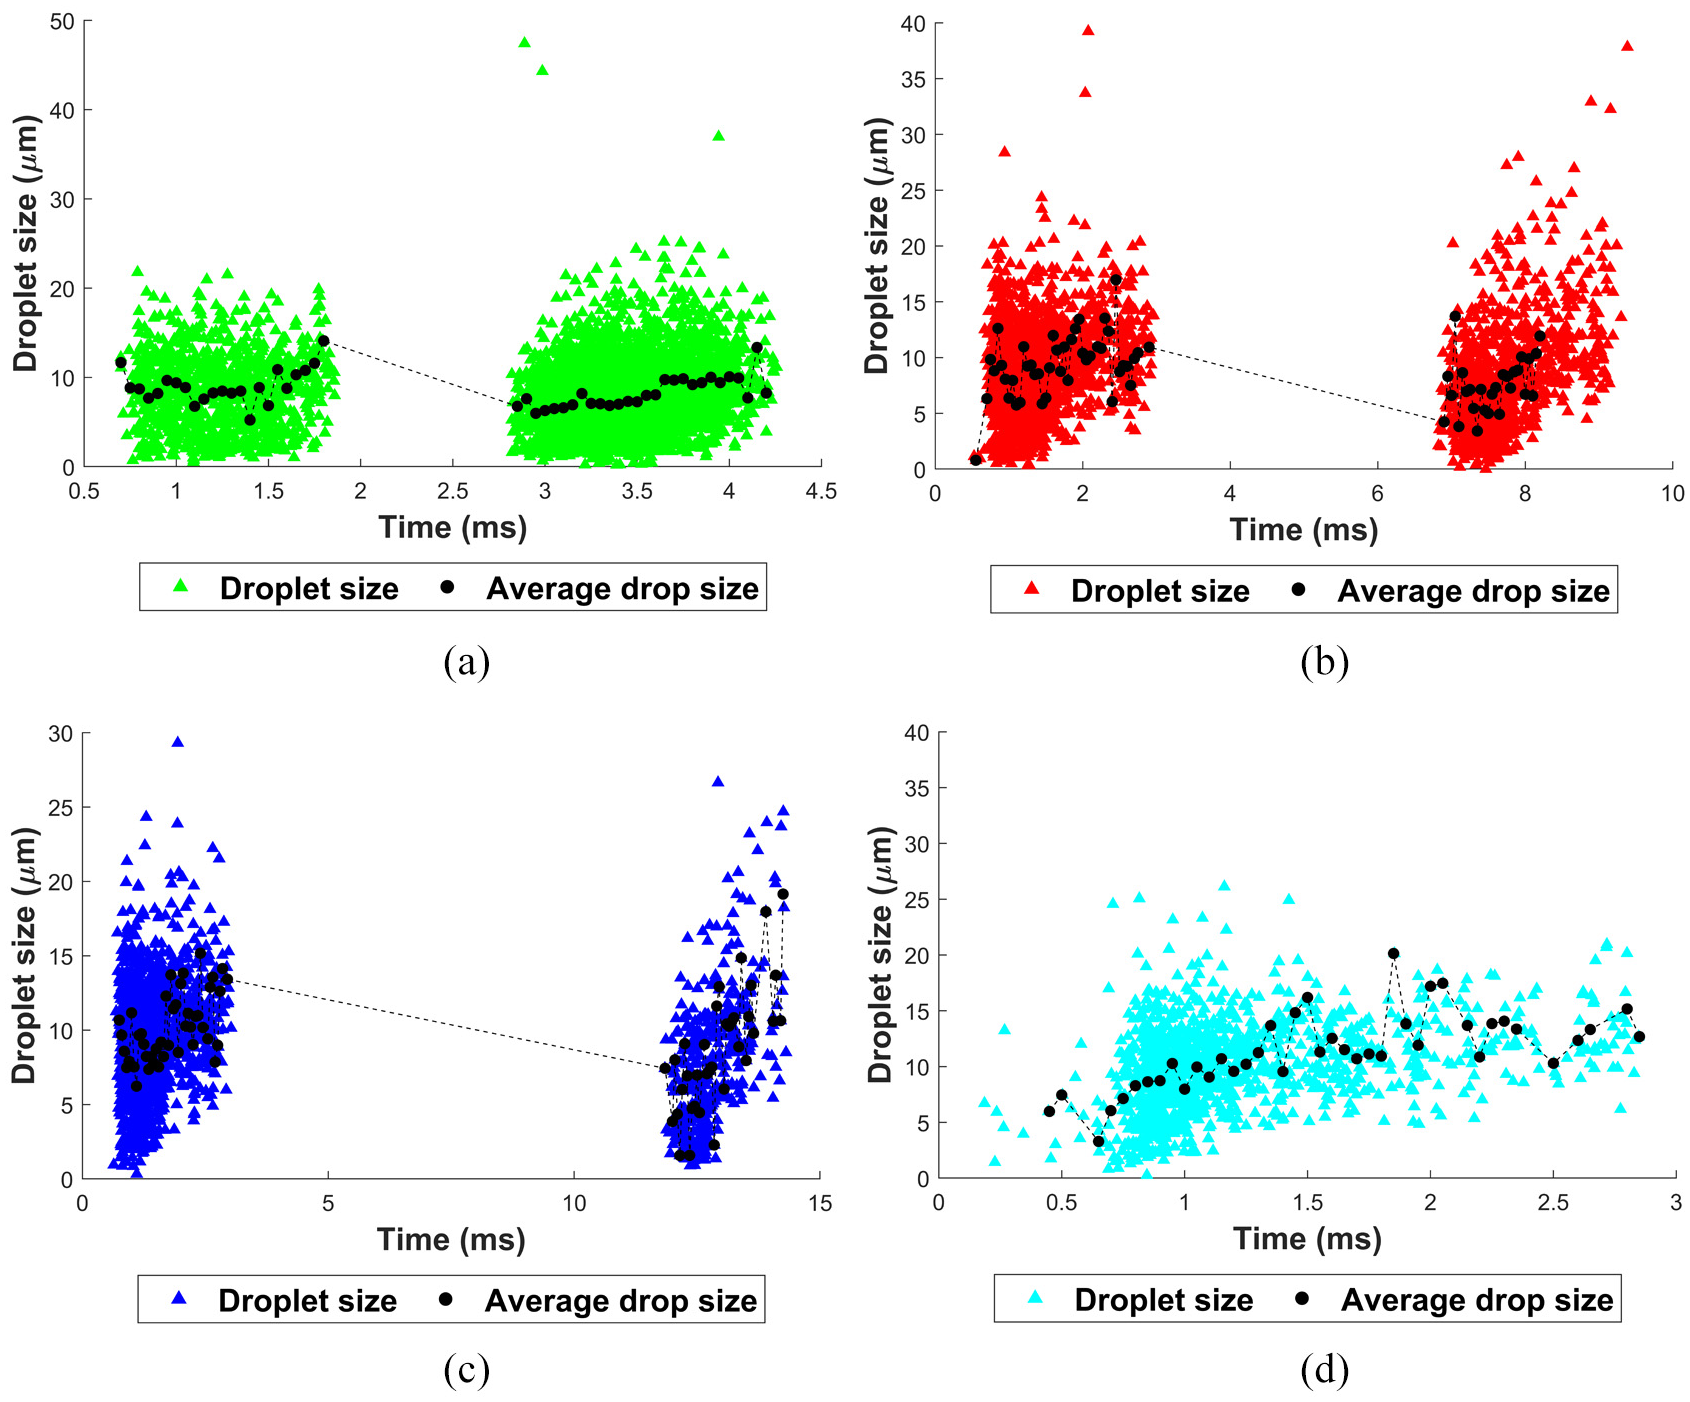
Transient trends of droplet sizes measured 40 mm downstream of the injector for: (a). 2 ms dwell case, (b) 6 ms dwell case, (c) 11 ms dwell case and (d) single injections. The PW combination is 0.8–0.4 ms for the tested split cases and the PW for the single injection is 1.2 ms. The black trend line represents the average droplet velocities.
The average drop size trend for the single injections 40 mm downstream shows a distinct increase in the average drop sizes towards the end of injection, when compared to 11 mm downstream. Observing the corresponding velocity trend (Figure 20(d)), there are large velocity fluctuations towards the end of the injection. These two trends suggest that during the valve’s closing period, the droplet velocities towards the end of injections are heavily affected. 40 mm downstream, where the droplets would have undergone maximum atomisation, the fluctuations in the velocities and droplet sizes indicate the possible effect of tip wetting, which would have generated the formation of ligaments and large droplets, but with low momentum, caused by the reduction in injection pressure during the throttling effects as the valve closes. This trend is not only observed with the single injections, but for all the PW combinations tested at this elevation (Figure 20(a)–(c)). As such, this far downstream, the valve closing effects on the droplet sizes particularly, become apparent.
This increase in the droplet sizes during the valve’s closing period was also reported by Hélie et al. 5 They observed systematic long and hollow liquid coronas during the valve’s closing event. Their observation of the evolution of these features showed a film collapse which generated big drops, mostly far from the nozzle. While tip wetting is not captured in the current high-speed images, the common observation of these phenomena reported by various literature discussed in this paper,4–6,37 suggests that the increasing drop sizes towards EOI could be affected by the nozzle closing period and the subsequent tip wetting. Additionally, it is suspected that the smaller droplets would have propagated away from the plume’s core, much closer to the injector’s tip. Majority of the large droplet sizes have stated to propagate axially with low momentum, 24 which is what has potentially been captured 40 mm downstream.
Conclusion
The spray characteristics of a split injection strategy was investigated using a Solenoid actuated, high-pressure DI injector. This was done in the efforts to help tackle the challenges faced with achieving ideal mixture formation, suitable for the stratified charge operation. The injection quantities for varying PW combinations and dwell times, at 35 MPa injection pressure, were analysed. PDA measurements were performed to compare the rear plume’s characteristics using the split injections with varying dwell times, and the corresponding single injections. The measurements were focused in the near-nozzle region (11 mm downstream) and at various axial locations downstream from the injector. The key findings of the study are as follows:
Highest quantity of the fuel was measured with the shortest tested dwell time of 2 ms. This was caused by the fuel prior to the start of the second injection being present in the vicinity of the injector and interacting with the tip of the second injection. These interactions had increased the droplet sizes. With low chamber pressures, the interactions between the droplets from different injection events, using short dwell times, can affect the atomisation rates and mixture formation and subsequently the emissions of particulates.
The highest relative peak in the injection quantity at 2 ms dwell was attributed to the short PW combination of 0.4–0.4 ms. High speed images revealed that the spray was attached to the injector tip for at least 100 µs after EOI. This was due to the high injection pressure resisting the sudden closing of the Solenoid valve, affecting the timely closing. This was particularly the case with the short PWs of 0.4 ms, whereby the spray was primarily operating in the ballistics region.
The average droplet sizes had increased towards the end of the injection for all tested cases. The corresponding droplet velocities had reduced. This was due to the valve’s closing effects, which has been reported to inject ligaments and large droplets with low momentum by a range of previous studies.
Upon the valve’s opening for the second time after 2 ms dwell, greater number of low velocity droplets were observed, particularly in the near nozzle region (11 mm downstream). This had occurred due to a combination of recirculating droplets and droplets with plume perpendicular velocities being captured. The former is stated to have been intensified by the high injection pressure, which could cause some droplets, particularly those at the edges of the plume, to travel upwards and close to the injector tip. This increases the likelihood of a fuel film being accumulated on injector tip as well as affecting the momentum of the injected droplets. This effect was alleviated with 6 ms dwell and had intensified with larger PW.
Slip stream effects were observed for the 1:1 split ratio further downstream from the injector tip, whereby the droplets from the second injections possessed higher velocities compared to first injections. The droplets from the first injection did not only form a region where the droplets from the second injection had accelerated through, but had also caused the angle of the second plume to reduce slightly, as was also reported in the former study of the campaign. 28
Large fluctuations in velocities observed with both short and large PWs were due to the high injection pressure generating large pressure waves, thereby increasing shot-to-shot variability.
SMDs for the shorter PW of 0.4 ms were generally larger than 0.8 ms PW. Droplets in this case are affected by closely spaced opening and closing events of the Solenoid valve.
While the current tests revealed interesting spray phenomena, it is important to remember that the spray variability in an operating engine increase. By realising the more stable and repeatable structures under ambient atmospheric conditions, appropriate injection strategies can thus be employed in the engine to reduce the relative spray variations and thereby fluctuations in IMEP and the peak in-cylinder pressure. Additionally, the gas-phase flow field within the cylinder is not simply overwhelmed by the spray events but can have a significant influence on the spray itself as well as on the vapor-phase fuel distribution.
The next stage of work is to employ the split injection strategies using the same injector, in a single-cylinder optical GDI engine. It is proposed that the interaction of droplets from the split injections could be alleviated inside the cylinder due to the higher in-cylinder pressure, which would encourage greater entrainment but also greater resistance against the propagating droplets. High-speed PIV measurements can help reveal these phenomena in order to realise the optimum stratified charge using a split injection strategy and a Solenoid-actuated injector.
Footnotes
Definitions and Abbreviations
Acknowledgements
The authors would like to thank EPSRC and Changan UK for their continued support on this project.
Declaration of conflicting interests
The author(s) declared no potential conflicts of interest with respect to the research, authorship, and/or publication of this article.
Funding
The author(s) received no financial support for the research, authorship, and/or publication of this article.