
Abstract
The present work describes a numerical methodology and its experimental validation of the flow development inside and outside of the orifices during a pilot injection, dwelt time and the subsequent start of injection cycle. The compressible Navier-Stokes equations are numerically solved in a six-hole injector imposing realistic conditions of the needle valve movement and considering in addition a time-dependent eccentric motion. The valve motion is simulated using the immersed boundary method; this allows for simulations to be performed at zero lift during the dwelt time between successive injections, where the needle remains closed. Moreover, the numerical model utilises a fully compressible two-phase (liquid, vapour) two-component (fuel, air) barotropic model. The air’s motion is simulated with an additional transport equation coupled with the VOF interface capturing method able to resolve the near-nozzle atomisation and the resulting impact of the injected liquid on the oleophilic nozzle wall surfaces. The eccentric needle motion is found to be responsible for the formation of strong swirling flows inside the orifices, which not only contributes to the breakup of the injected liquid jet into ligaments but also to their backwards motion towards the external wall surface of the injector. Model predictions suggest that such nozzle wall wetting phenomena are more pronounced during the closing period of the valve and the re-opening of the nozzle, due to the residual gases trapped inside the nozzle, and which contribute to the poor atomisation of the injected fluid upon re-opening of the needle valve in subsequent injection events.
Introduction
The level of emissions from internal combustion engines (ICE) has perplexed the relative industries for past few decades; the well-known soot-NOX trade off pauses a difficult problem for the simultaneous reduction of these pollutants; see selectively1,2 among many others. The advancements in ICE technology that have brought pollutant levels down a 1000-fold in past decades 3 now make particulate emissions from tire and brake wear a larger problem than engine emissions for both IC engine powered and electric vehicles. Today’s emission issues are mainly related to insufficient oxygen due to local improper mixing, nozzle and piston wall wetting and fuel dribbling at the end of injection. Dribbling and wall wetting can lead to accumulation of carbonaceous deposit formation on the internal and external walls of an injector resulting to increased emissions.4,5
Tremendous efforts have been made in the past three decades to study the flow inside and in the vicinity of the nozzle holes of diesel injectors both experimentally and numerically, as this is the key for further reduction of emissions. Overall, remarkable improvements in injection strategies, such as increasing the injection pressure to a range of 3000 bars,
6
controlling the injection-rate shaping and timing the injection,
7
split or multiple injections8,9 and improved orifice geometry and orientation
10
are now standard practices. Numerical simulations have shed light to the effect on multi-phase flow development in various nozzle configurations, see for example,11–17 while more recent investigation have quantified the needle valve motion using high energy X-rays18–22 and real size optical nozzles.23–26 Still, the flow phenomena taking place during the very short time scales (∼
High-speed Mie-scattering and shadowgraphy imaging techniques 27 studied the liquid-phase penetration and vapourisation during quasi-steady and transient conditions realised after EOI. They found that the liquid penetration length decreases after the EOI compared to quasi-steady conditions due to the reduction in mass flow rate. They also formulated a one-dimensional model to explain the formation of entrainment waves from the nozzle towards the jet after the needle valve closure. The formation of this wave was also observed in Kook et al. 28 , Musculus; 29 the liquid jet was found to reside towards the injector. In Eagle and Musculus 30 utilised high-speed digital cinematography to observe the spatial and temporal evolution of the dribble after the EOI. They identified three main types of dribble formation; immediate dribble, late-cycle dribble and blow-down dribble. They also discussed the effect of different parameters such as nozzle geometry, fuel type, ambient pressure and temperature, rail pressure, injection schedules on dribble formation. In Moon et al. 31 used X-ray phase-contrast imaging technique to study the needle dynamics and in- and near-nozzle flow characteristics associated with fuel dribble of a three-hole mini-sac type injector. They observed high shot-to-shot variations in dribble formation from the injector hole and inconsistent air ingestion which they attributed to the hole-to-hole flow variations. Two modes of dribbling process were reported, one with a faster breakup and short residence time, and the other one with a large residence time where the dripping of undistributed liquid columns is observed. It was concluded that there is a strong connection between ingested air and dribble formation and the major factor that influence the dribble formation is the needle closure velocity. In a recent study, the tip wetting from a gasoline direct injection nozzle was experimentally evaluated in Hélie et al., 32 while a novel 3D reconstruction algorithm for predicting the volume of the ligaments formed after end of injection was developed in Sechenyh et al. 33
So far, dribble formation from an injector nozzle has mainly been studied experimentally and only a few studies have included simulations. In Battistoni et al.
34
studied this process from a single-hole injector using a two-phase three-components mixture model to simulate cavitation while considering the presence of non-condensable gas. They used a Cartesian cut-cell grid generated during run time to incorporate the needle motion. To model the needle closure, they switched to two disconnected domains when the needle lift drops below
Several models and approaches exist in the literature for modelling wall-wetting; they typically come under the banner of droplets impact. A detailed review of the phenomena of droplet impact on the solid unheated and heated surfaces can be found in Jadidbonab et al.40,41, Strotos.42,43 Depending on the contact angle between the droplet and the surface, the degree of wettability changes. If the contact angle less than 90° then the surface is favourable for wetting, whereas a contact angle greater than 90° implies that the surface is less favourable for wetting. Recently, some experimental and numerical studies were carried out that focused on the wettability of the nozzle tip and the nozzle plate surface.44,45 However, a large majority of the numerical studies related to this topic is focused on droplet impact on solid walls. One of the major challenges in numerical modelling of this phenomenon is the implementation of the contact line between the gas-liquid and solid. The most simplistic approach is to specify a static 46 or dynamic 47 contact angle as a boundary condition to which the mean curvature of the surface of the droplets next to the wall will comply. There exist more advanced models that can handle moving interfaces 48 or models that can compute contact angle based on the net of forces acting on the free surface of the droplet on the fly instead of specifying a fixed or temporal evolution of the contact angle. 49
The present study aims to enhance this important, yet the less explored area of end of injection fuel dribbling from diesel injectors. For this purpose, an implicit VOF model with appropriate treatment for modelling surface tension and wall adhesion is used. A VOF model is used for predicting the liquid-gas interface while the immersed boundary method is used for simulating the moving needle; validation of these models can be found in the previous works of the authors Mithun et al.11,50,51, Koukouvinis et al. 52 respectively. The results presented here utilise the experimental data from a Delphi DFI 1.3, six-hole VCO nozzle, recently reported by the author’s in Gold et al., 5 in order to validate the current model. At the same time, simulations of the experiments recently presented in Manin et al. 53 are utilised for the first time for further validation of the developed model. This model considers both the in-nozzle and near-nozzle jet simultaneously using a fully compressible two-phase two-component model. 11 The model also considers a predefined axial and eccentric motion of the needle inside the VCO nozzle, using an immersed boundary approach (IBM). 51
The outline of the paper is as follows. In the next section, the numerical model consisting of the two-phase two-component VOF model, wall adhesion and the IBM used for simulating the needle valve motion are presented. Then a section regarding the limitations of the adopted methodology, the link to previous works and the present contribution is included. This is followed by a description of the problem including the meshing, operating and boundary conditions. After that, the result and discussions for the injection scenarios considered (start of injection, end of injection and the subsequent start of injection) are presented. The major conclusions from the study are highlighted in the final section.
Mathematical model
Governing equation
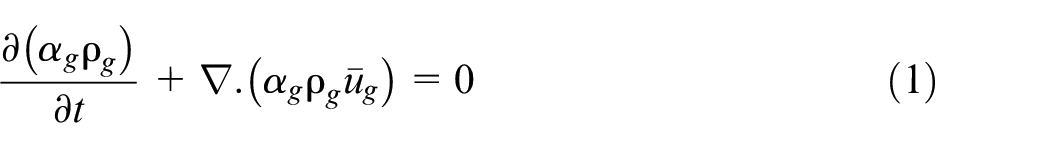
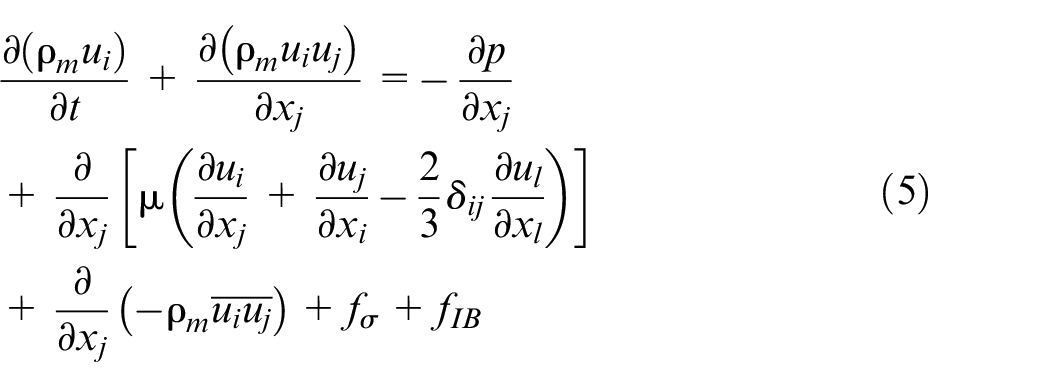
The fluid flow is governed by the mass and momentum conservation equations. The model assumes a barotropic fluid as the primary phase and non-condensable gas (NCG) as the secondary phase. A Reynolds averaged formulation is used for resolving turbulence. To track the interface between the phases, the continuity equation of the secondary phase (equation (1)) is first solved and then volume fraction of the primary phase is estimated based on the equation (2). The mixture properties such as mixture density and viscosity are then calculated using the mixing rule as given in equations (3) and (4). These properties are then used for the solution of the mixture momentum equation (equation (5)).


where
where
An implicit formulation for the volume of fluid (VOF) approach is used for modelling the two components. The volume fraction equation is discretised using the compressive scheme of Ansys,
55
which is a second-order reconstruction method, with slope limiter values ranging between 0 and 2. A slope limiter value of 2 is used in this study, which corresponds to the CICSAM scheme of Ubbink.
56
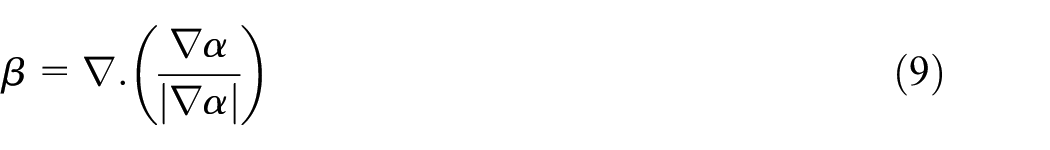
The continuum surface force (CSF) approach of Brackbill et al.
47
was used for modelling surface tension which is included as an additional source term (
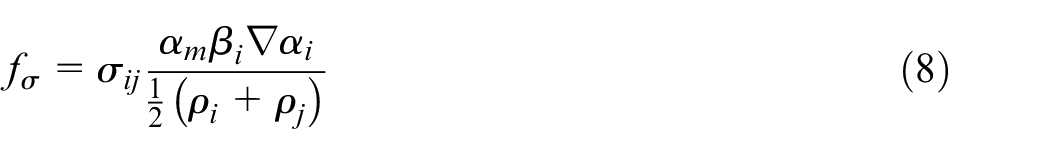
where
To model the droplet impingement on a solid surface, the wettability of the wall needs to be accounted for, an approach similar to the one presented in Brackbill et al.
47
is used. The contact angle that the fluid is assumed to make with the wall is used to adjust the surface normal in cells near the wall. The surface normal at the live cell next to the wall

where
Immersed boundary method
In an IBM, the presence of the body is represented using additional source terms in the governing equations. The IBM formulation used in this study corresponds to the continuous forcing approach,
57
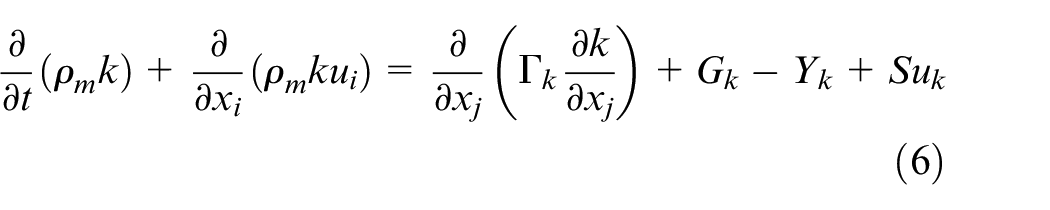
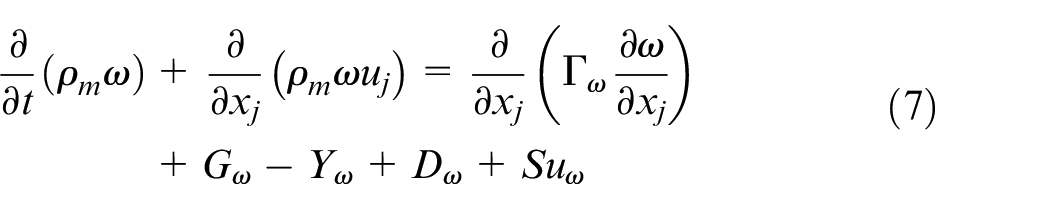
where the source terms are added to the continuous form of governing equations as given in equations (5)–(7). The term fIB in equation (5) is the term that forces the velocity field to follow the geometry boundaries. This force is proportional to the difference between the flow (
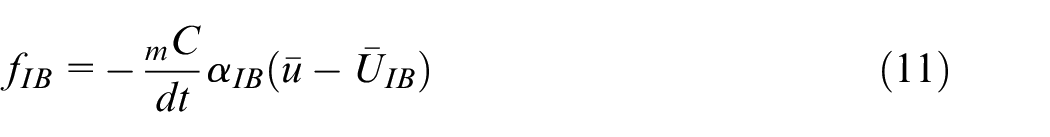
In the above equation, the strength of the immersed body velocity is tuned using the term C, which is an arbitrary value, dt is the time step size and

where
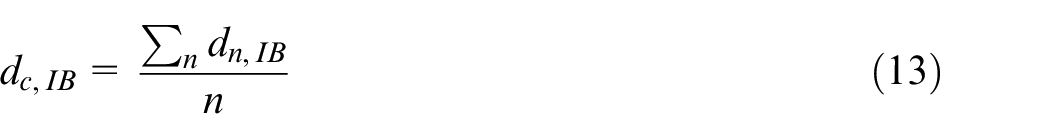
After estimating the distance function from equation (12), the mask function
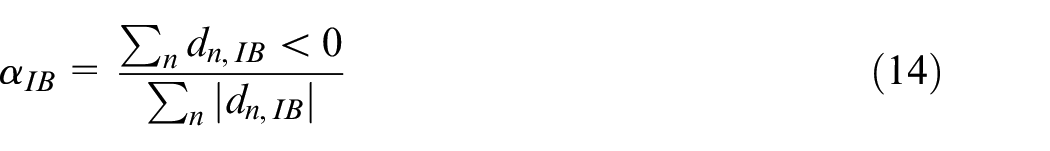
When the immersed body moves, the Eulerian cell velocities inside the body should have the same velocity as the body. This is ensured using equation (15).
where
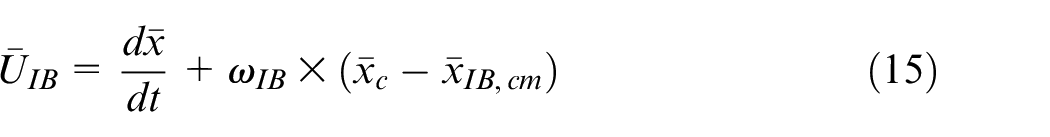
In the present study, the motion of the needle in three dimensions is pre-defined and its profile is shown in Figure 1. The data file with the time series is interpolated by the immersed boundary model to extract the location of the needle at any time instant.
(a) Needle lift profile and (b) eccentricity in x (dashed) and y (dotted) direction as reported in Gold et al. 5 Start of Injection (solid blue), End of Injection (solid red) and Subsequent Start of Injection (solid green).
Two component, cavitating model (liquid, vapour, air)
As described in the previous section, the two-component cavitation model used in this study was validated and reported by the authors in their previous work.
51
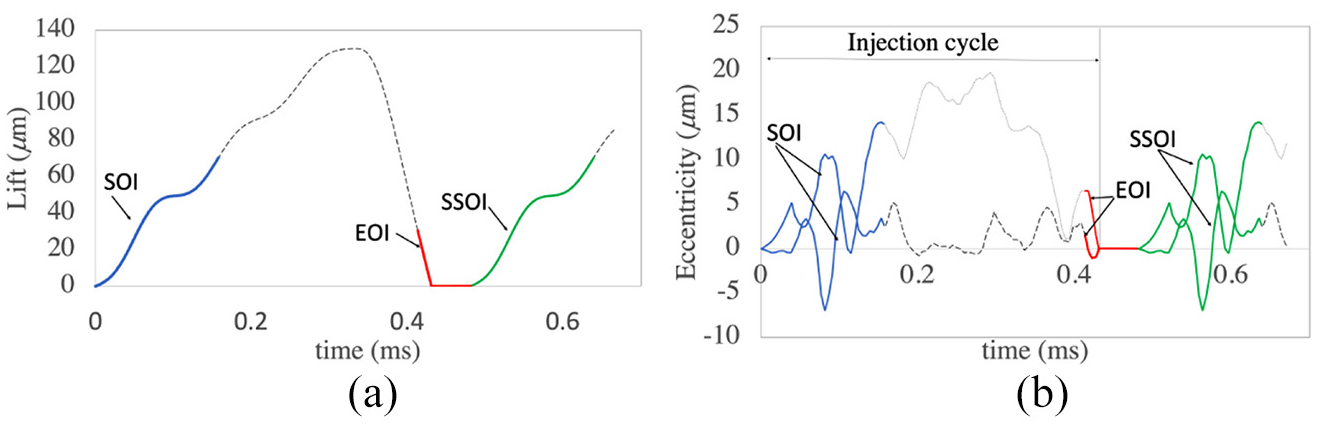
However, for the sake of completeness of this study, the final equation used is given in equation (16) without aiming to present their derivation, as this can be found in Mithun et al.
51
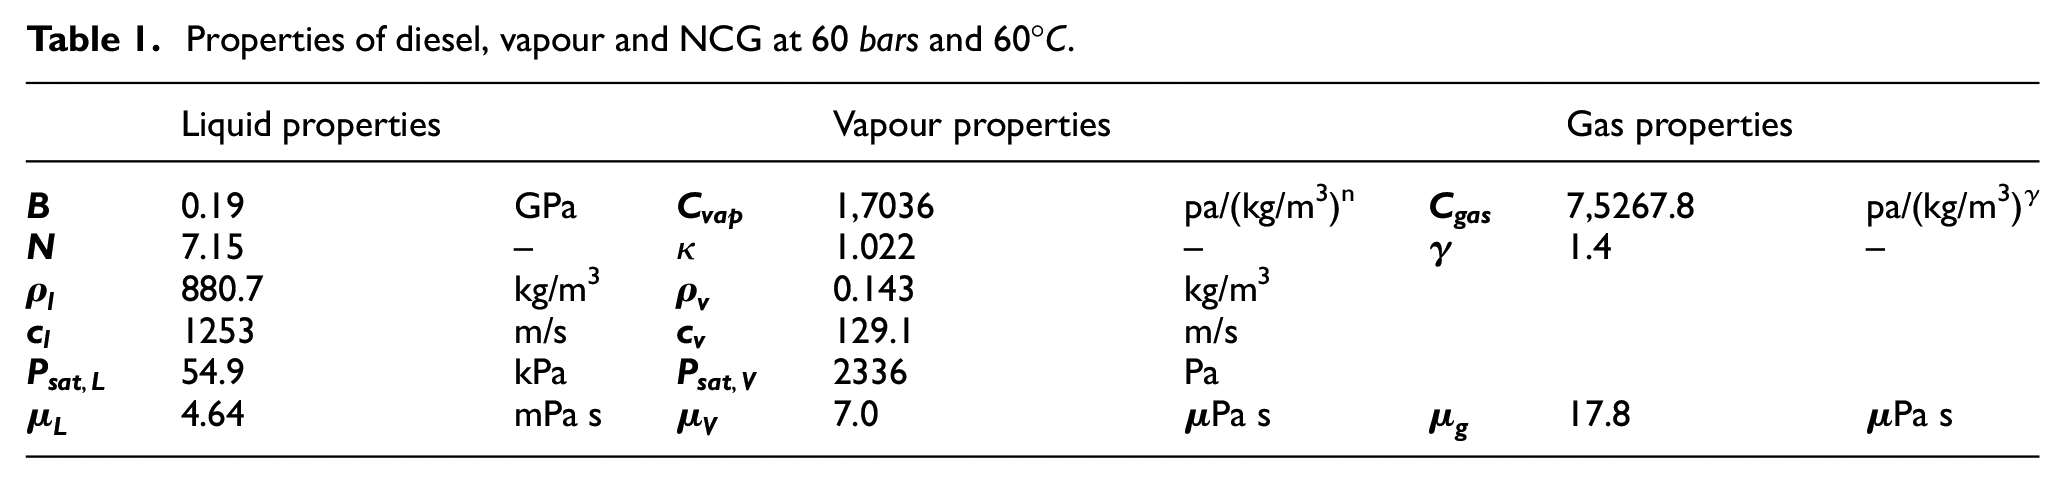
In this equation, the compressibility of the liquid diesel (
Properties of diesel, vapour and NCG at 60 bars and 60°C.
Limitations, link to previous works and present contribution
As already mentioned, the present work builds upon earlier and on-going studies published by the authors on simulation of nozzle flows and sprays. To the best of authors knowledge, this is the first study to simulate wall-wetting phenomena in diesel injector nozzles occurring during the opening, closing and dwelt time of the needle valve. More specifically, these are linked one hand with the wave dynamics developing during the closing of the needle valve that induces air entrainment inside the nozzle promoting fuel dribbling, while on the other hand, its eccentric motion further contributes to the development of swirling flow that promotes splashing of the low velocity fuel dribbling from the injector, onto the surfaces of the nozzle.
Before proceeding to the presentation of the results, the limitations arising from both the validity of the models utilised and the selection of the specific conditions investigated, are summarised and evaluated. More specifically, these include: (1) the lack of detailed quantitative validation against experimental data; (2) the assumption of local mechanical and thermal equilibrium under the framework of the homogeneous equilibrium model adopted and (3) the omission of the dependency of fuel properties on pressure and temperature.
(1) With regards to the lack of quantitative experimental validation for the conditions tested, several comments and reference to prior works can be made. Predictions obtained in an enlarged single-hole nozzle utilising a similar barotropic model 58 as the one used here, have been compared against the 3D distribution of cavitation vapour volume fraction derived using X-ray micro computed tomography X-ray; ±7% deviation between simulations and experiments has been reported, considering the detailed quantification of both numerical and experimental uncertainties. Further validation has been obtained for the flow field distribution, cavitation frequency shedding and turbulent velocities in the same single-hole nozzle against high energy X-ray phase contrast imaging (XPCI) measurements for conditions covering a range of cavitation regimes (incipient, fully developed and vortex/string cavitation).21,22 Additionally, validation against Laser Doppler Velocimetry (LDV) measurements has been also reported in Koukouvinis et al. 59 with deviations within the experimental error. These comparisons give confidence that the barotropic model is performing relatively well for similar cases as those studied here. With regards to validation of the models for realistic nozzle geometries, past studies exist for VCO nozzles;2,14,60,61 still focus was placed on sprays using a Lagrangian methodology, which cannot predict fuel dribbling. Currently, the data of the ECN represent the most comprehensive database for fuel sprays; relevant predictions have been recently reported; 60 still, effects occurring upon the needle valve closing and the dwelt time between injections have not been studied, while the flow in the single-nozzle considered is a simplification compared to the complex flow distribution in the VCO nozzle studied here. Finally, the recent work14,39,60,61 provides qualitative validation of a barotropic model against images obtained inside a transparent real-size sac-type nozzle operating at pressures similar to those tested here; this study provides further confidence that the model can capture the co-existence of cavitation vapour and air entrainment during the closing phase of the needle valve and during the dwelt time. As already mentioned, the present manuscript includes further qualitative comparison of the model predictions against the experimental data reported recently by the authors in Gold et al. 5 and also the work of Manin et al. 53
(2) One of the main assumptions in the described methodology is the mechanical and thermodynamic equilibrium between the liquid, vapour and air. With regards to the mechanical equilibrium assumption, the recent studies from the authors using a two-fluid model have confirmed that differences between liquid and vapour velocities are less than 10% and only in localised locations of the flow,62,63 while they do not affect the overall growth rate and production of vapour. With regards to thermodynamic equilibrium assumption, a metastable, that is, non-thermodynamic equilibrium, state occurs when the pressure of the liquid drops below the saturation pressure and no vapour is formed due to the rapid expansion of the liquid.64,65 In the literature, the well-known Schnerr and Sauer, 66 Singhal et al. 67 and Zwart et al. 68 non-thermodynamic equilibrium (mass transfer rate) models are widely used. Such models can tend towards equilibrium by using large mass transfer terms, that is, increasing the evaporation/condensation coefficients.21,69 To estimate the time scales of such phenomena relative to the residence time of the fuel through the injector, the relaxation time of the tensile stresses, that is, those acting in the metastable state, has been numerically estimated to be of the order of 10 ns for a vertical tube filled with liquid, impacted vertically, suddenly and producing an expansion wave of 30 MP. 70 The residence time of the fluid in the injection hole is of the order of ∼1.5 µs, for an injection pressure of 160 MPa case; thus, the time to reach equilibrium would be, at least, 150 times faster. As a result, predictions obtained using homogeneous mixture models59,71 exhibit very similar performance to those obtained using large mass transfer rates.
(3) Finally, the present study assumes isothermal flow and adiabatic nozzle walls; thus, it neglects the dependency of fuel properties on pressure and temperature and heat transfer on the nozzle walls. This is justified by the fact that the injection pressure of ∼160 MPa utilised in pilot injection events, as those tested here, result to temperature difference of less that ∼20°C; see selectively72–77 for fixed needle lift and transient needle lift studies in Salemi et al., 78 Strotos et al. 79 At the same time, recent measurements for the diesel fuel properties have been reported and modelled using advanced equations of state, such as the PC-SAFT.60,80–82 For the pressure range investigated here, it can be estimated that the variation of fuel properties is practically negligible and renders the additional complexity of such approaches out of the scope of the present work. Moreover, the time it takes for the liquid wetting the nozzle walls to heat up and gradually vapourise, is orders of magnitude longer compared to the short time interval simulated here;42,43 thus, the assumption of adiabatic nozzle wall is justified.
Problem description
The numerical models developed are implemented into Ansys Fluent using user defined functions. The geometry of the six-hole valve covered orifice (VCO) nozzle and the details about the computational domain and numerical grids are shown in Figure 2. The computational domain is extended at the outlet body of the injector in order to model the combustion chamber in the vicinity of the nozzle exit; this is initialised with 100% NCG at the beginning of the simulation. The inlet and outlet boundaries are applied with a constant absolute pressure of
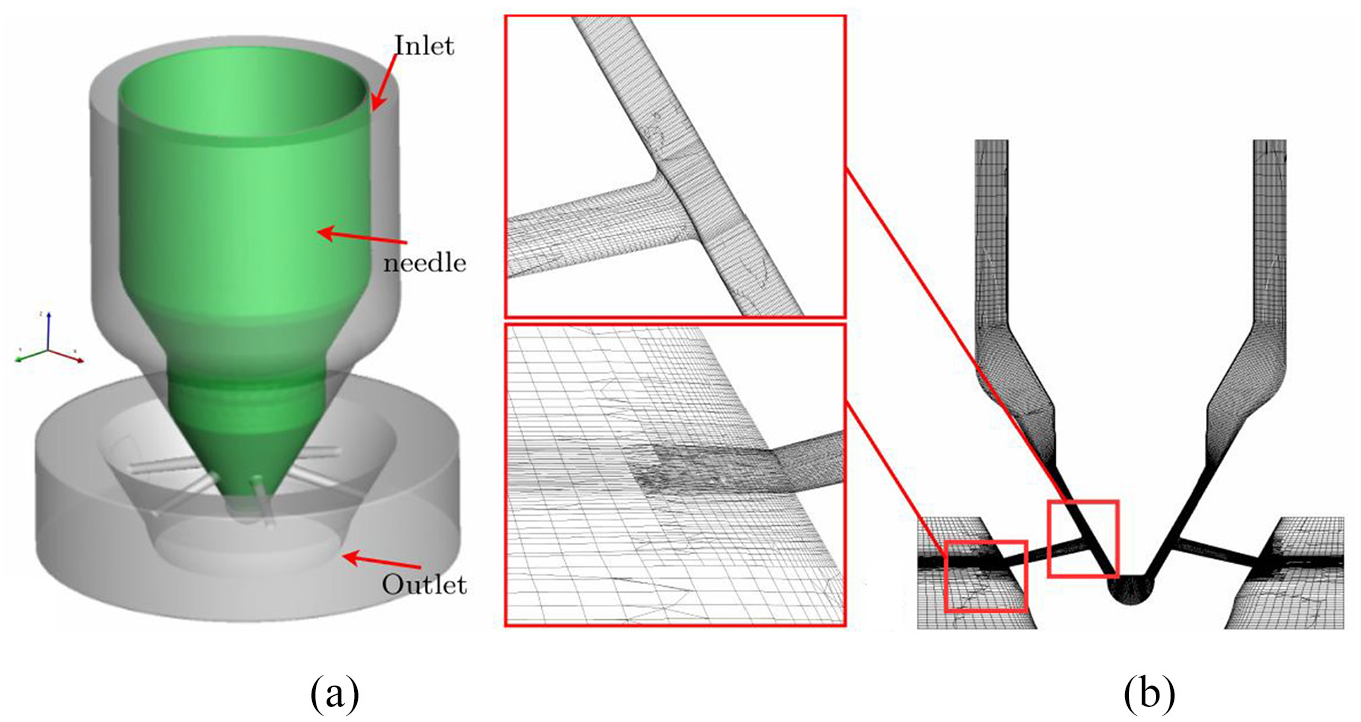
(a) VCO geometry and (b) cross-section of the hexahedral mesh highlighting the mesh details near orifice entrance and exit. Telescopic refinement near the wall to ensure
Validation of the model
One of the biggest challenges in validating the numerical models such as the one presented in this work is the absence of more rigorous physical validation measurements. In the absence of such quantitative data, qualitative comparisons such as flow structures, ligaments, etc., is a good and interesting first approach. In Figure 3, the flow structures predicted by the current numerical model shows a good match with the experimental observations. In addition to that, the applicability of the numerical model with moving geometry is further validated against the experimental data obtained for a single hole nozzle;
53
these correspond to a modified single-hole transparent nozzles manufactured with the same hole inlet radius and diameter as in Engine Combustion Network (ECN) Spray D nozzle, while the body and needle geometry correspond to that of the ECN Spray A nozzle; this is shown in Figure 4. The nozzle is imposed with an upstream pressure of
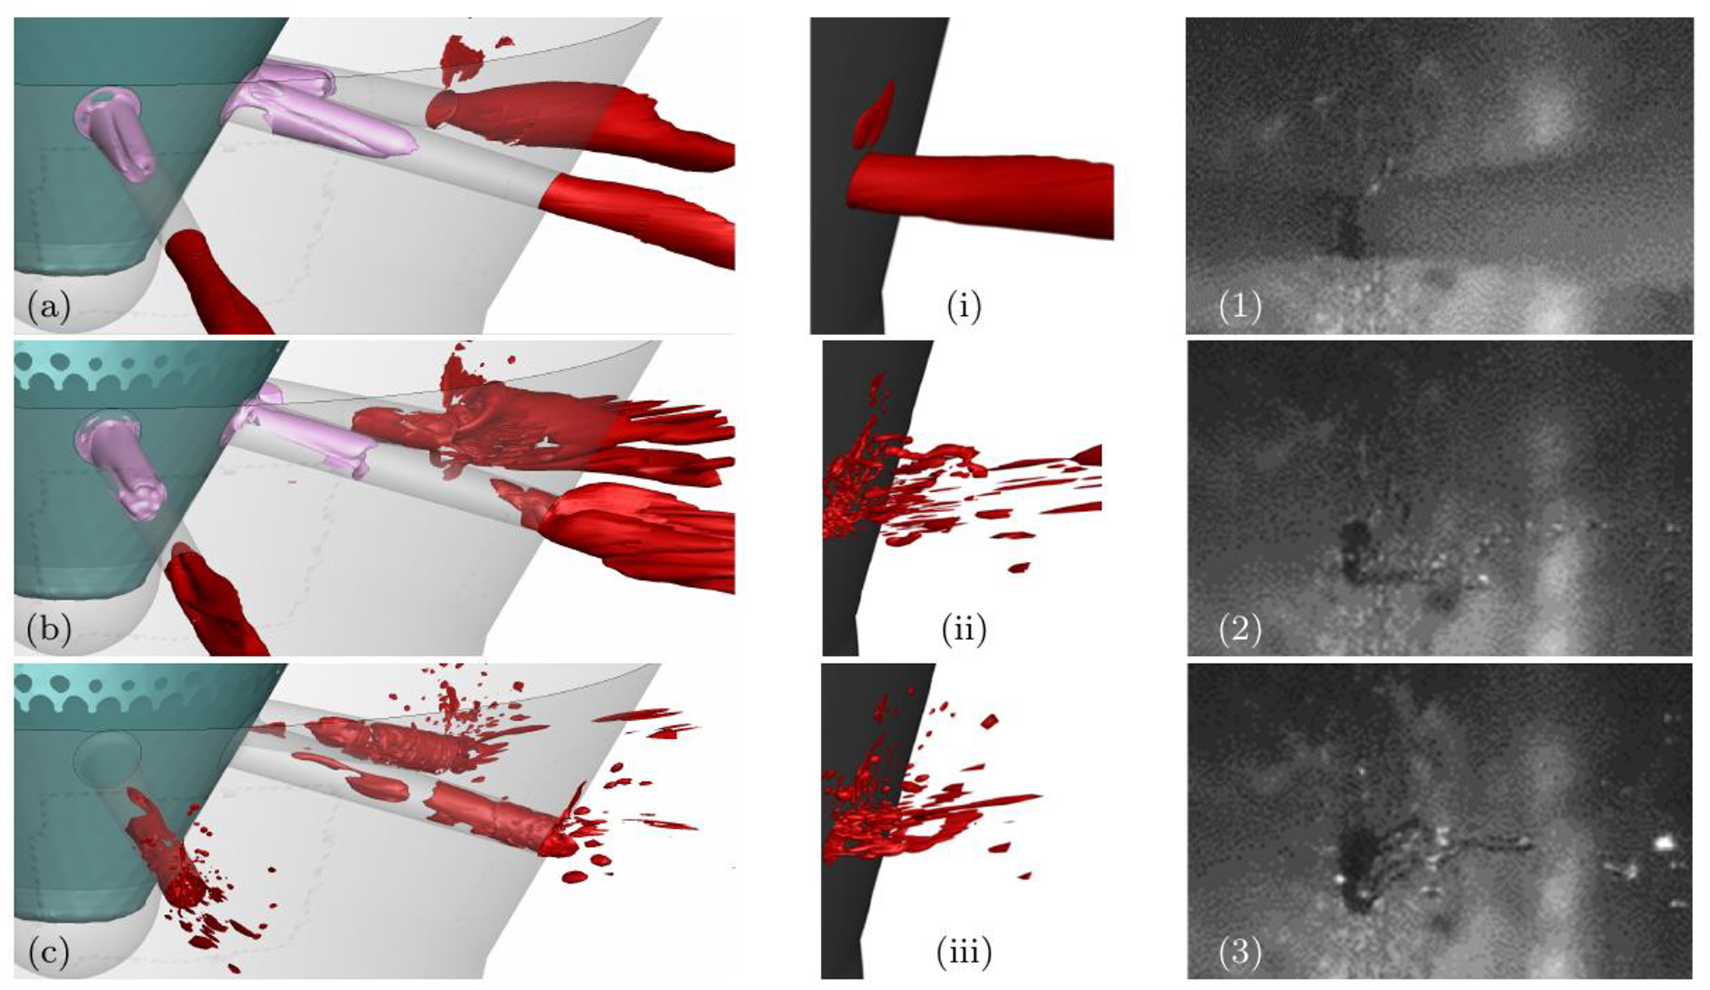
Validation of the numerical model showing the liquid jet break-up during end of injection. (a–c) and (i–iii) are the results from current simulation matching the experimental visualisation, (1–3) are the experimental results from Gold et al.
5
at 800 µs ASOI, 1000 µs ASOI and
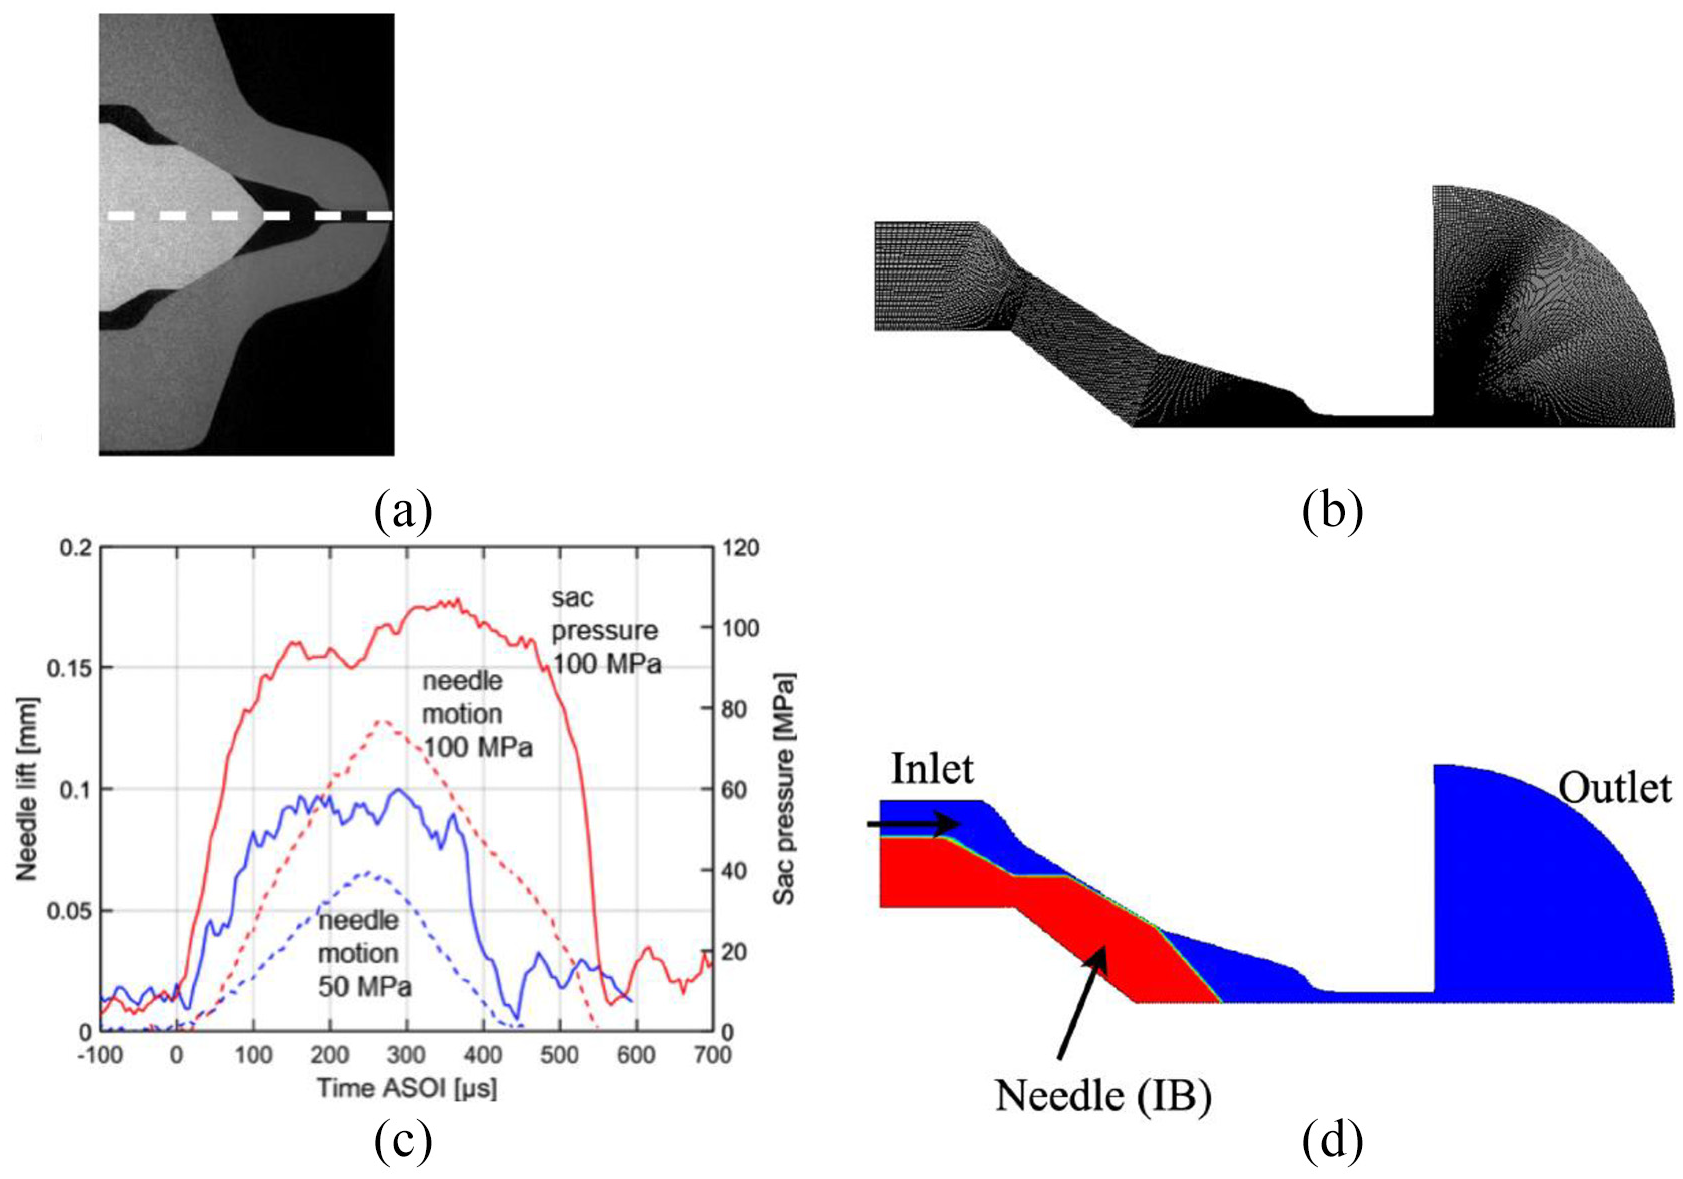
(a) Single hole ECN Spray D nozzle. (b) Needle motion profile as obtained from Manin et al. 53 for different injection pressure. (c) The hexahedral numerical mesh showing the extended circular chamber. (d) IBM representation of the needle (in red).
The qualitative validation of the events during the start and end of injection shown in Figure 5. Figure 6 is in good match with the experimental results. The numerical model predicts the retraction of the liquid and the formation of the leading-edge umbrella during the start of injection (Figure 5), and the bulk cavitation and gas pull back during end of injection (Figure 6) as observed in the experiment.
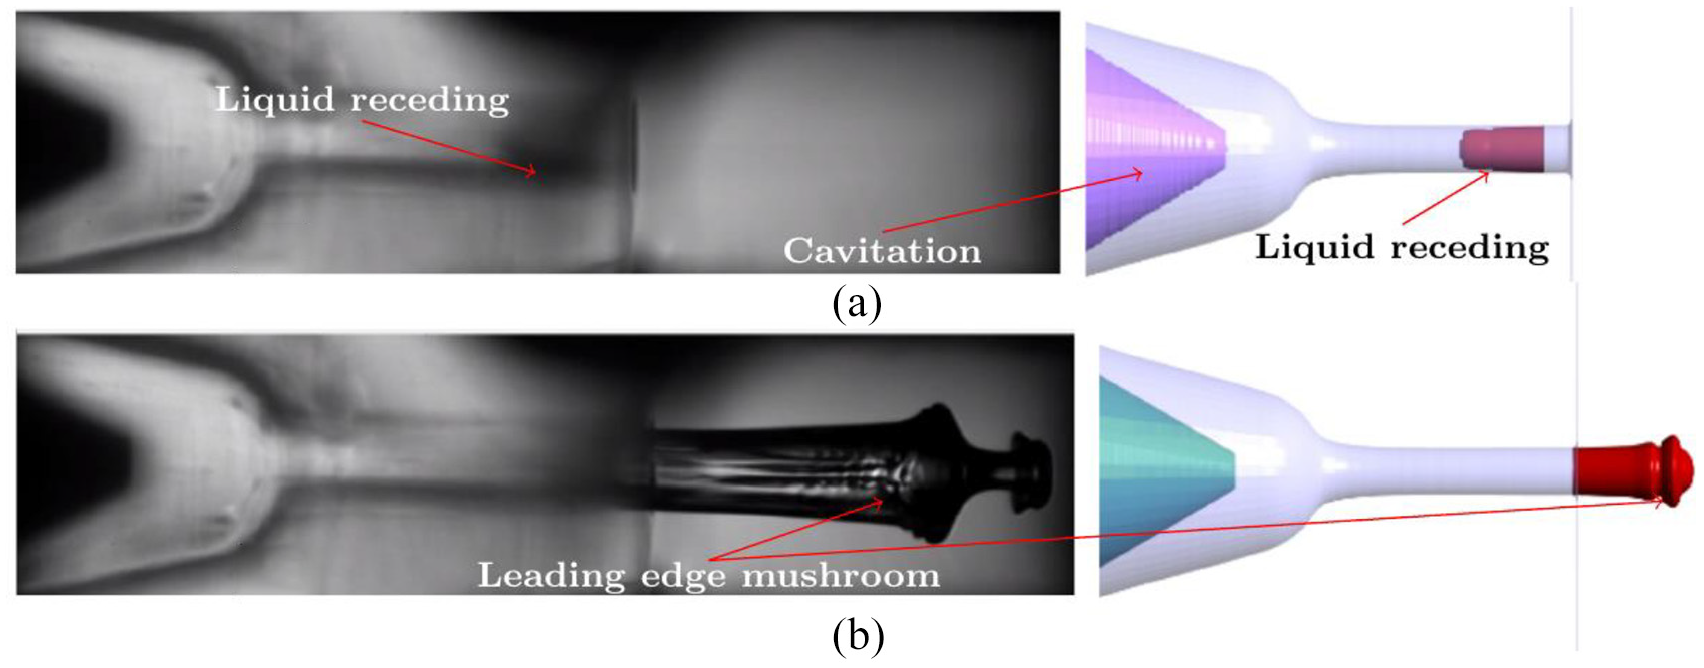
Validation of the numerical model with the experimental results from Manin et al. 53 during the start of injection event.
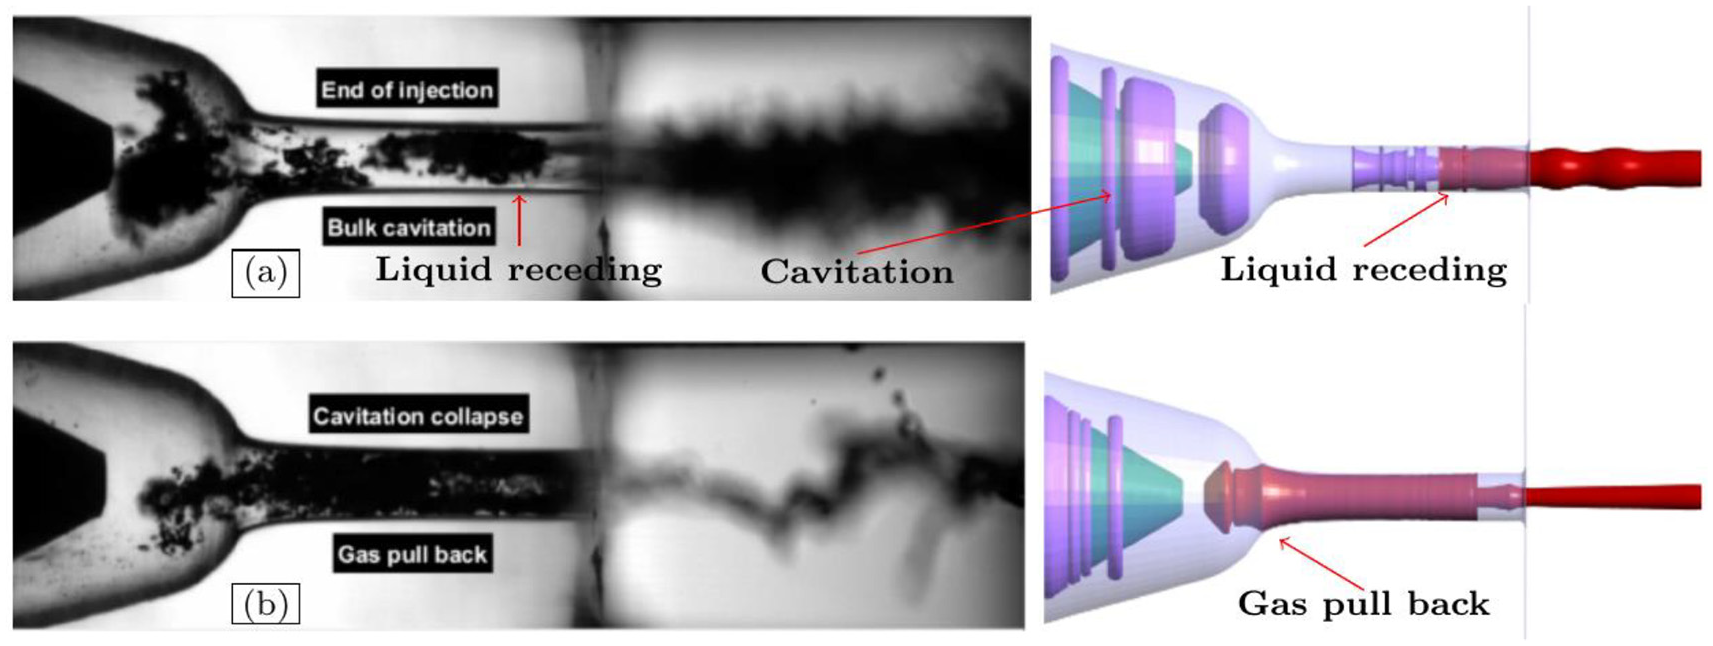
Validation of the numerical model with the experimental results from Manin et al. 53 during the end of injection event.
Results and discussion
In this section, the results obtained are presented for the two phases considered during the operation of the injector nozzle. The dynamics of the flow inside the orifices and the development of the spray during the start of injection from a fully filled with liquid nozzle is presented first. The flow during the end of injection and after the needle closure (dwelt time period), which shows the near-nozzle fuel dribbles is presented next, followed by the simulation of the subsequent start of injection.
Start of injection transients
In this section, the flow development inside and outside the nozzle orifice during the start of injection is presented. During the start of injection, the nozzle orifice is assumed to be filled with diesel and the gas is present only in the engine chamber. The needle rests on its seat sealing the flow between the inlet and outlet. The Start of injection transients (SOI) simulation is performed for a needle lift up to
When the needle lifts from its closed position, the suction created due to the sudden acceleration of the needle pulls in a small amount of air from the combustion chamber into the orifice (Figure 7(a)), forming a concave liquid front inside the orifice. The sudden opening of the needle also produces local counter-rotating vortices just below the needle valve, resulting in the formation of cavitation bubbles at this location, also shown in Figure 7(a). With the further lifting of the needle valve, the fuel slowly recedes into the orifice. The backward flow of the air stops and the forward motion of the fuel towards the orifice exit starts when the needle lift reaches approximately
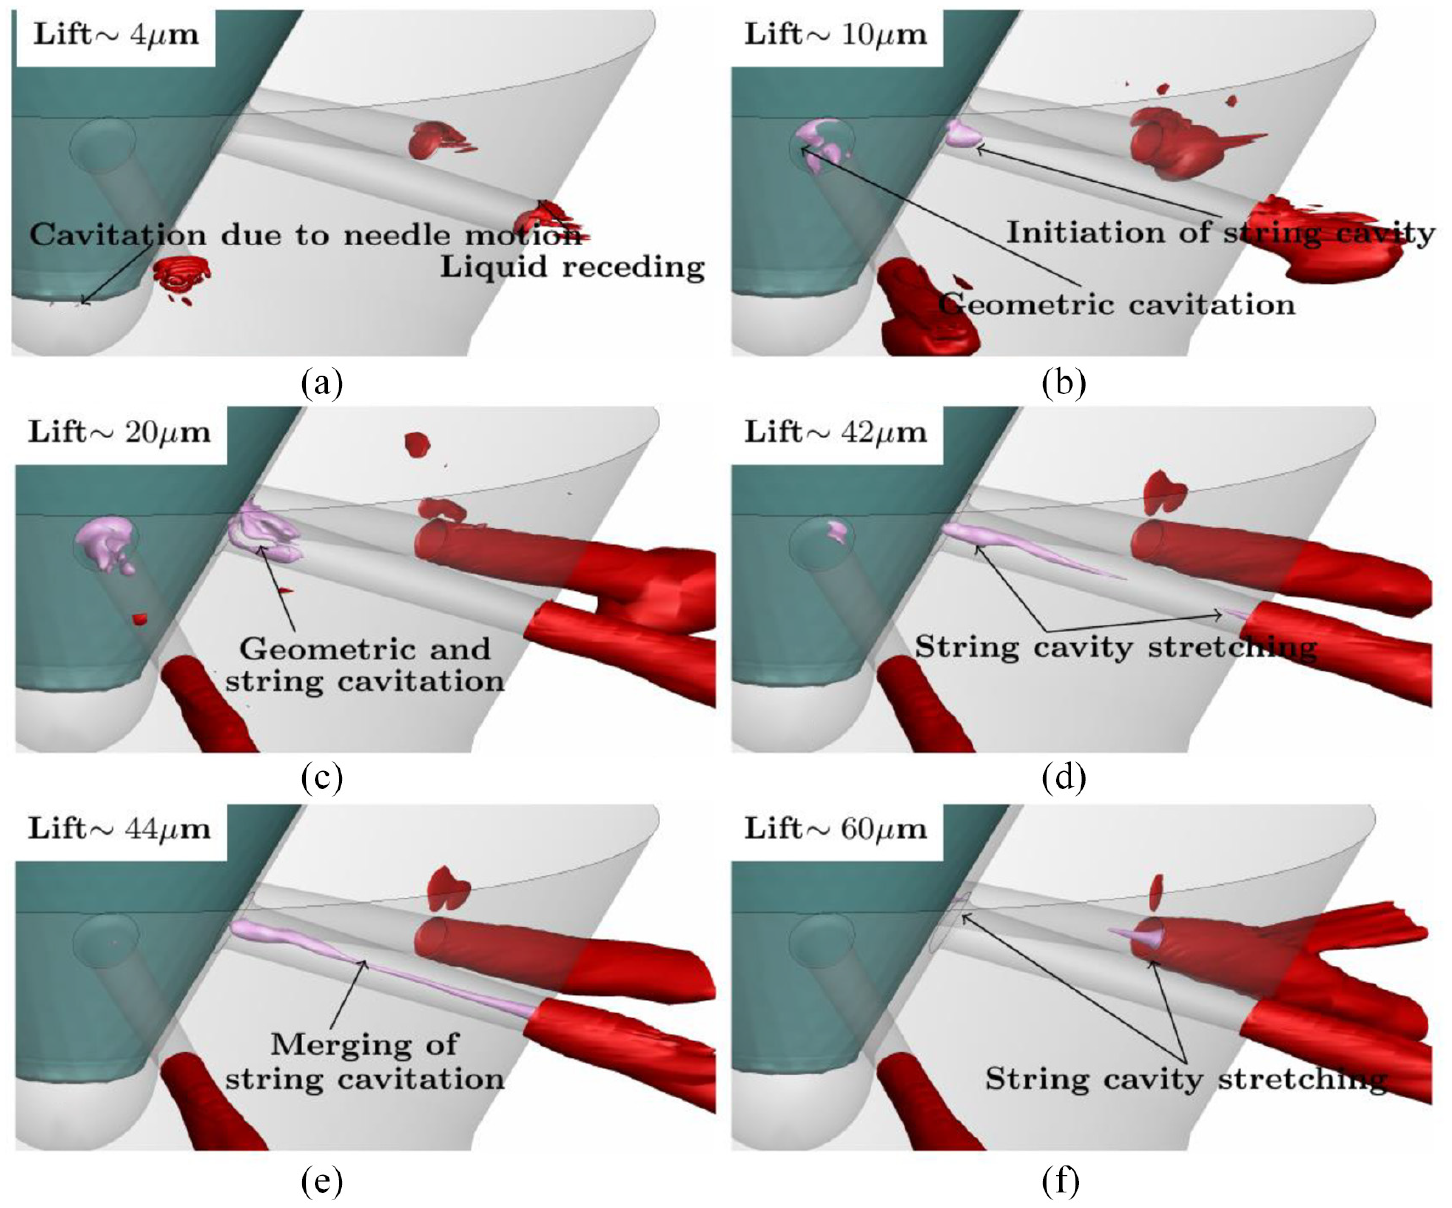
Evolution of diesel jet and formation of cavitation during start of injection showing the development of geometry-induced cavitation and the stretching of string cavitation during the needle opening is shown at selected needle lifts (a–f). Isosurfaces of 90% gas volume fraction (red) and 50% vapour volume fraction (pink) is shown.
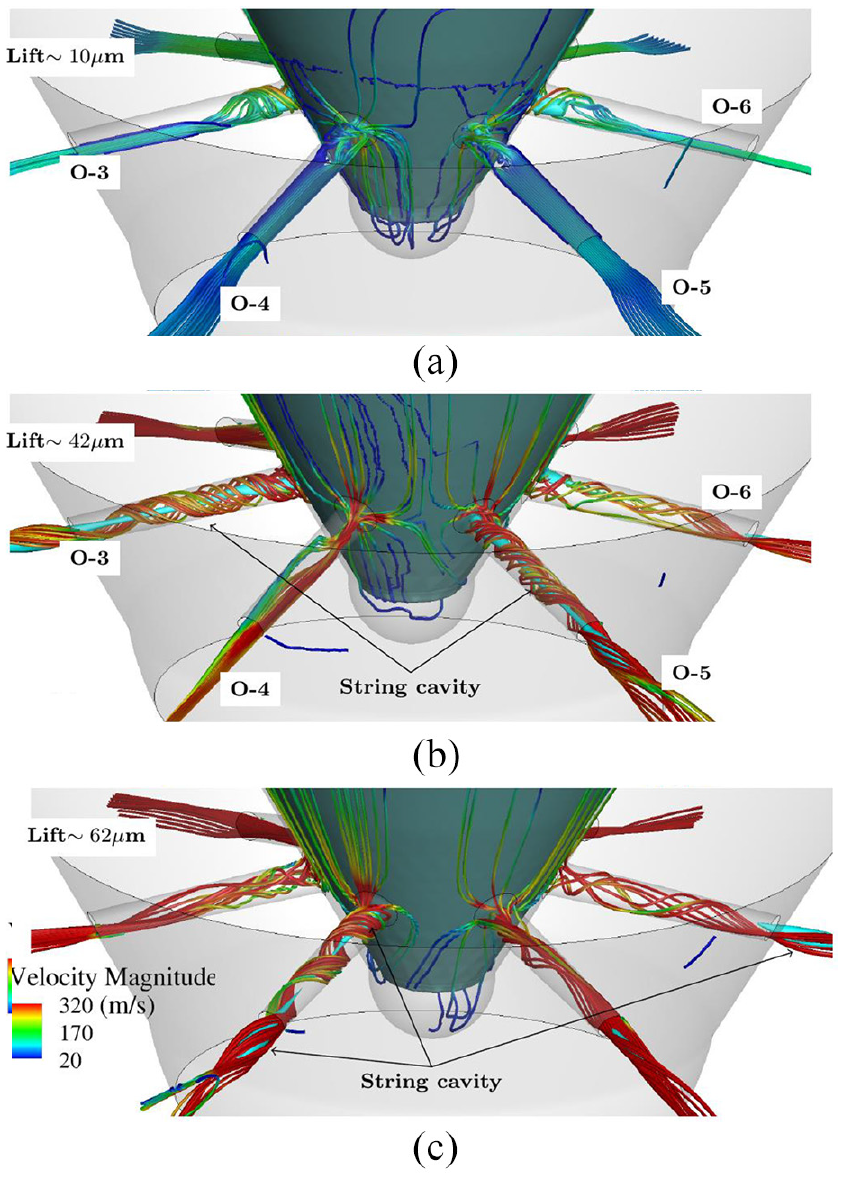
Detailed view of swirling flow and string cavitation at selected needle lifts during SOI (a–c). Streamlines coloured with velocity magnitude and the isosurface of 50% vapour volume fraction shown in cyan.
Focusing on the flow outside of the nozzle, when the needle lifts-off from its seat, the high injection pressure at the inlet forces the diesel fuel to flow out of the orifice into the combustion chamber. As the flow progresses, the diesel jet forms a leading-edge umbrella with surface instabilities in the form of spike-like structures emanating from the head of the umbrella, as it can be seen from Figure 9(i). The downward inclination of the orifices (see the subset of Figure 9(a)) induces higher acceleration at the upper half of the orifice compared to the lower half, causing an umbrella front to be stretched more in the upper half. As the needle valve lifts further, allowing more flow into the nozzle, the diesel jet penetrates into the chamber against the air, forming large ligaments and droplets from its periphery. The initial droplets formed are larger in size and non-spherical in shape. It is observed that some of these initial droplets formed lose their momentum and tend to stick to the nozzle wall, due to wall adhesion, as shown throughout in Figure 9. When the slow-moving liquid droplets come in contact with the oleophilic surface of the nozzle, the surface tension causes them to contract and leave them in the near nozzle region leading to surface wetting. Sticking of these droplets to the wall is observed near all six orifice exits. However, the number of droplets sticking, and the duration of their existence are different for each orifice, due to hole-to-hole variations in the flow. These droplets remain as a residual fuel from the injection and act as a locally rich mixture near the wall.
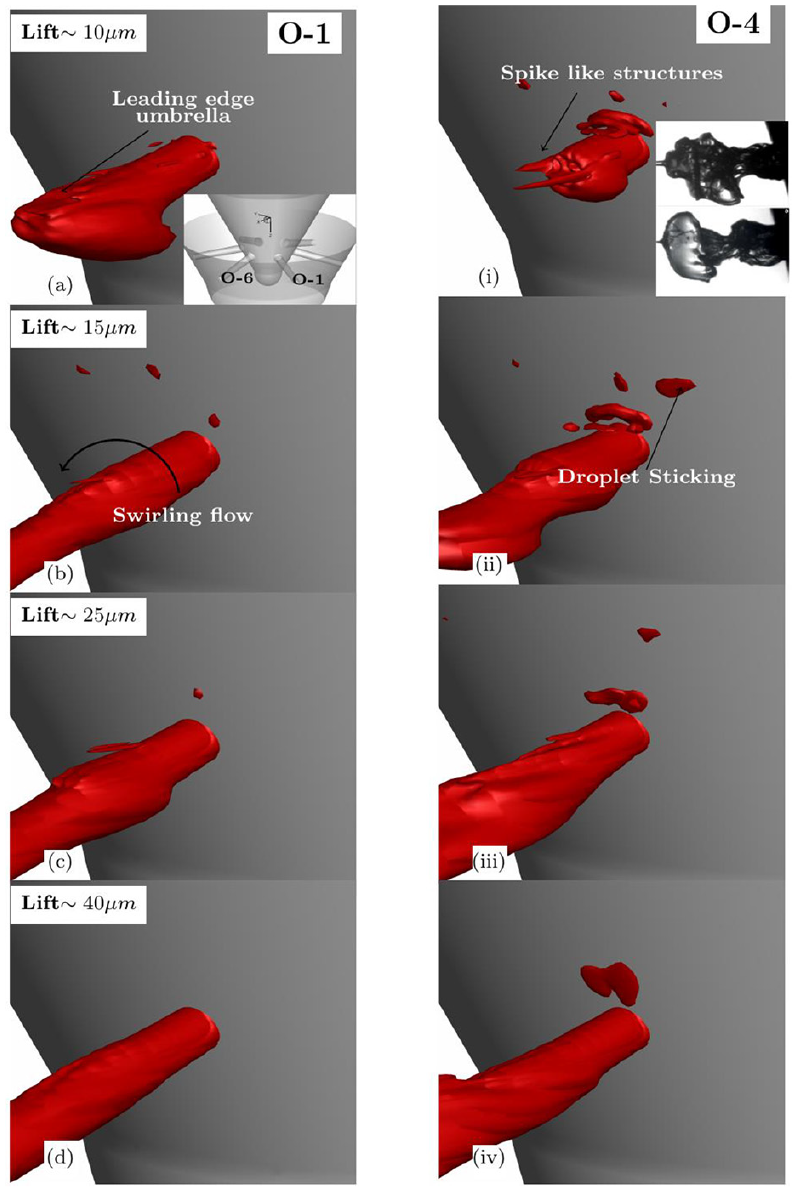
Dribble formation during start of injection from a nozzle filled with diesel. Correlation with the experimental observation from Gold et al. 5 shown in the subset of (i). Isosurface of 90% gas volume fraction is shown in red. Figures are shown selectively for (a–d) Orifice 1 and (i–iv) Orifice 4.
End of injection transients
The red solid lines in the profile shown in Figure 1 represents the region for which the end of injection simulation is performed. The downward motion of the needle is performed until its complete closure; the simulation further is continued for
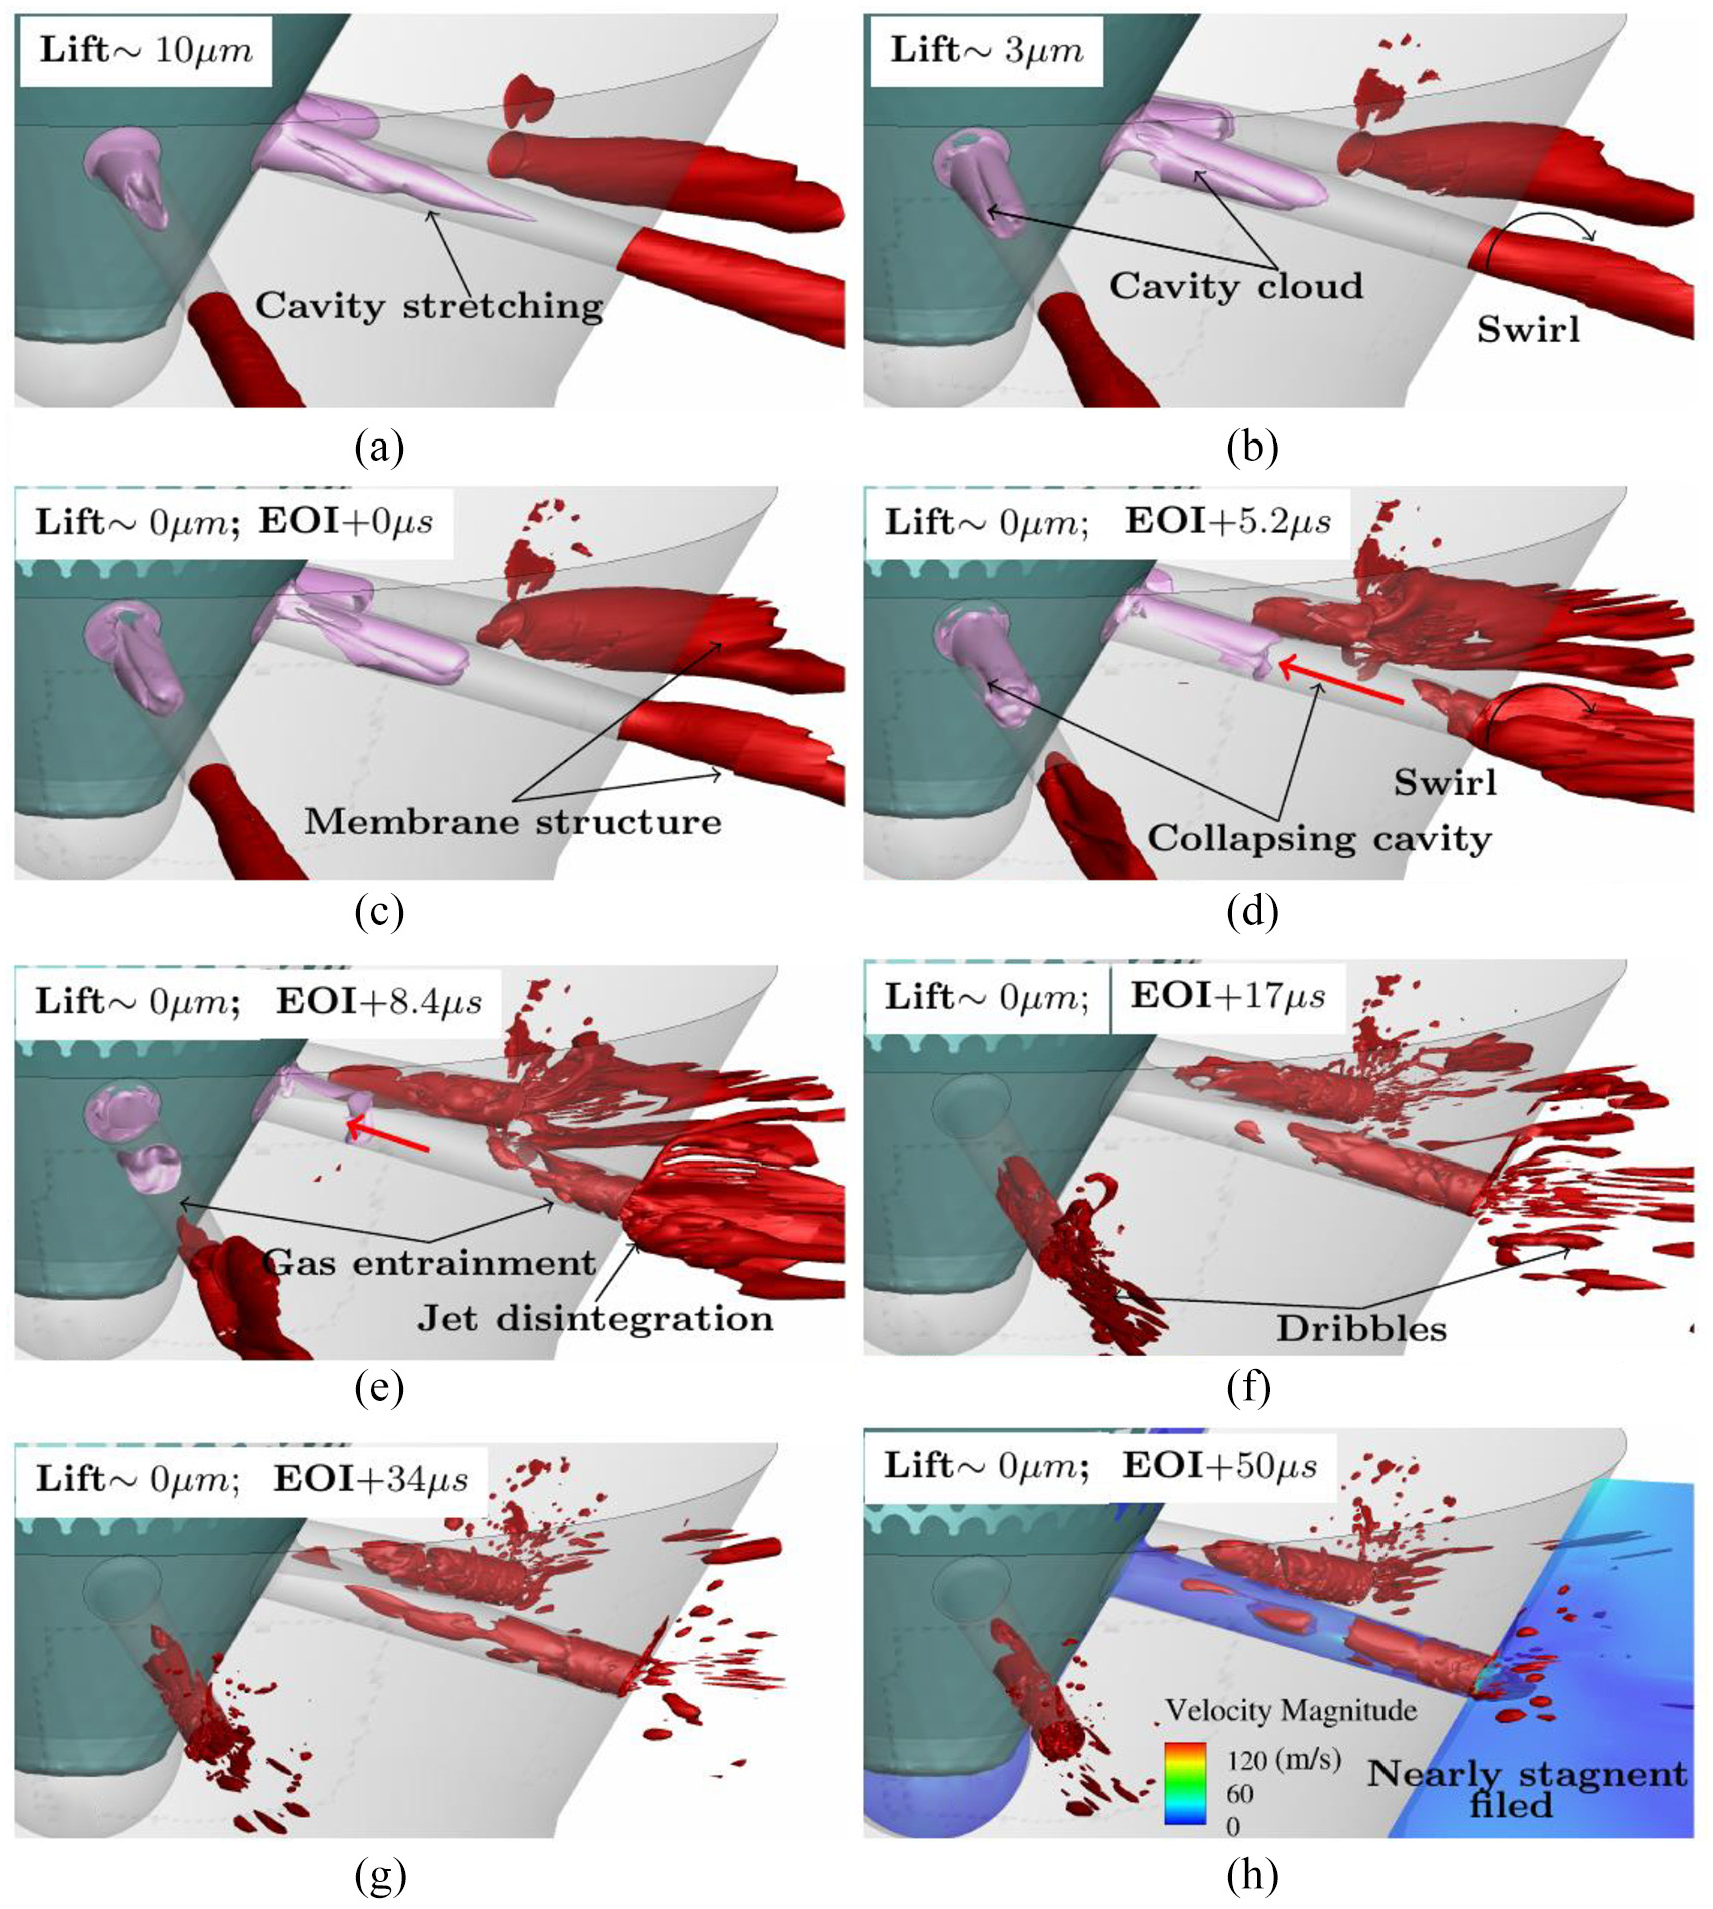
Break-up of diesel jet and cavitation formation inside the orifice during end of injection. The sequence (a–h) shows the cloud cavity stretching and the entrainment of gas after the needle closure. Isosurface of 90% gas volume fraction (red) and 50% vapour volume fraction (pink) is shown.
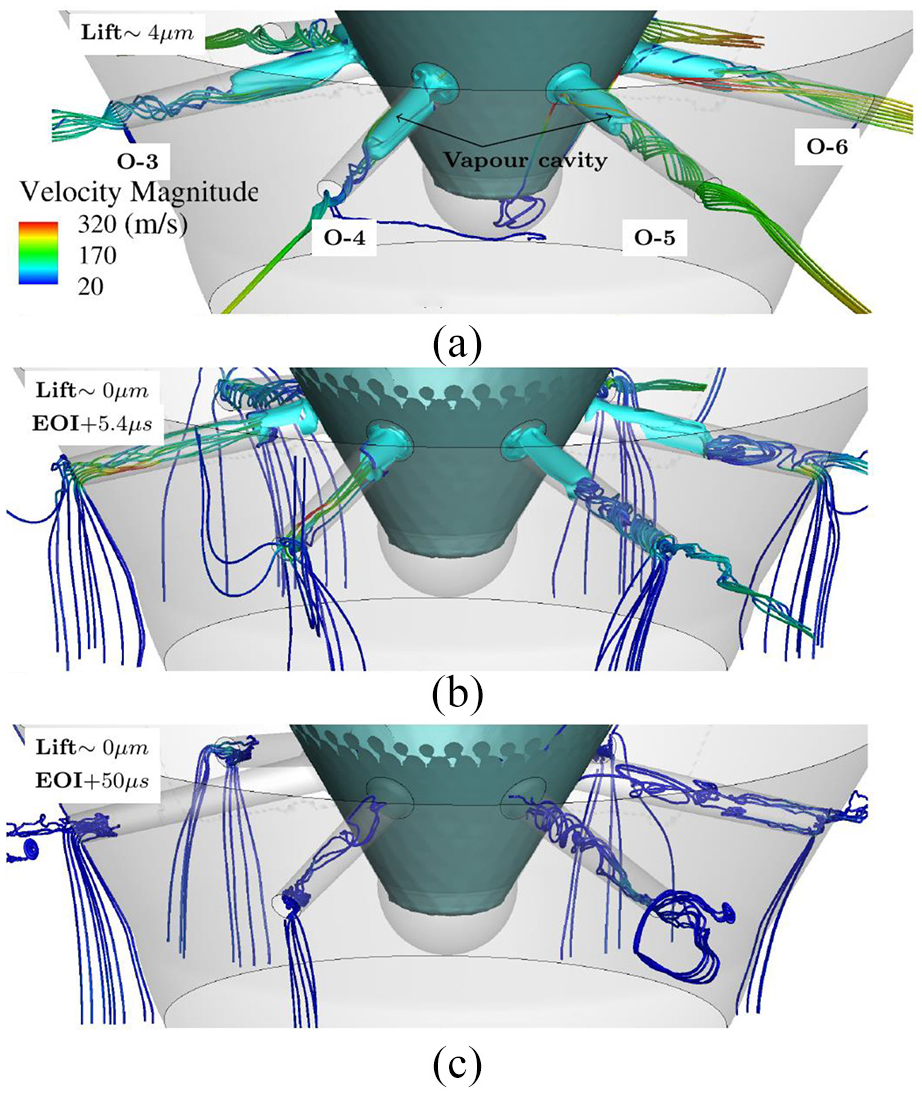
Detailed view of swirling flow and string cavitation at selected needle lifts (a–c) during EOI. Streamlines coloured with velocity magnitude and the isosurface of 50% vapour volume fraction shown in cyan.
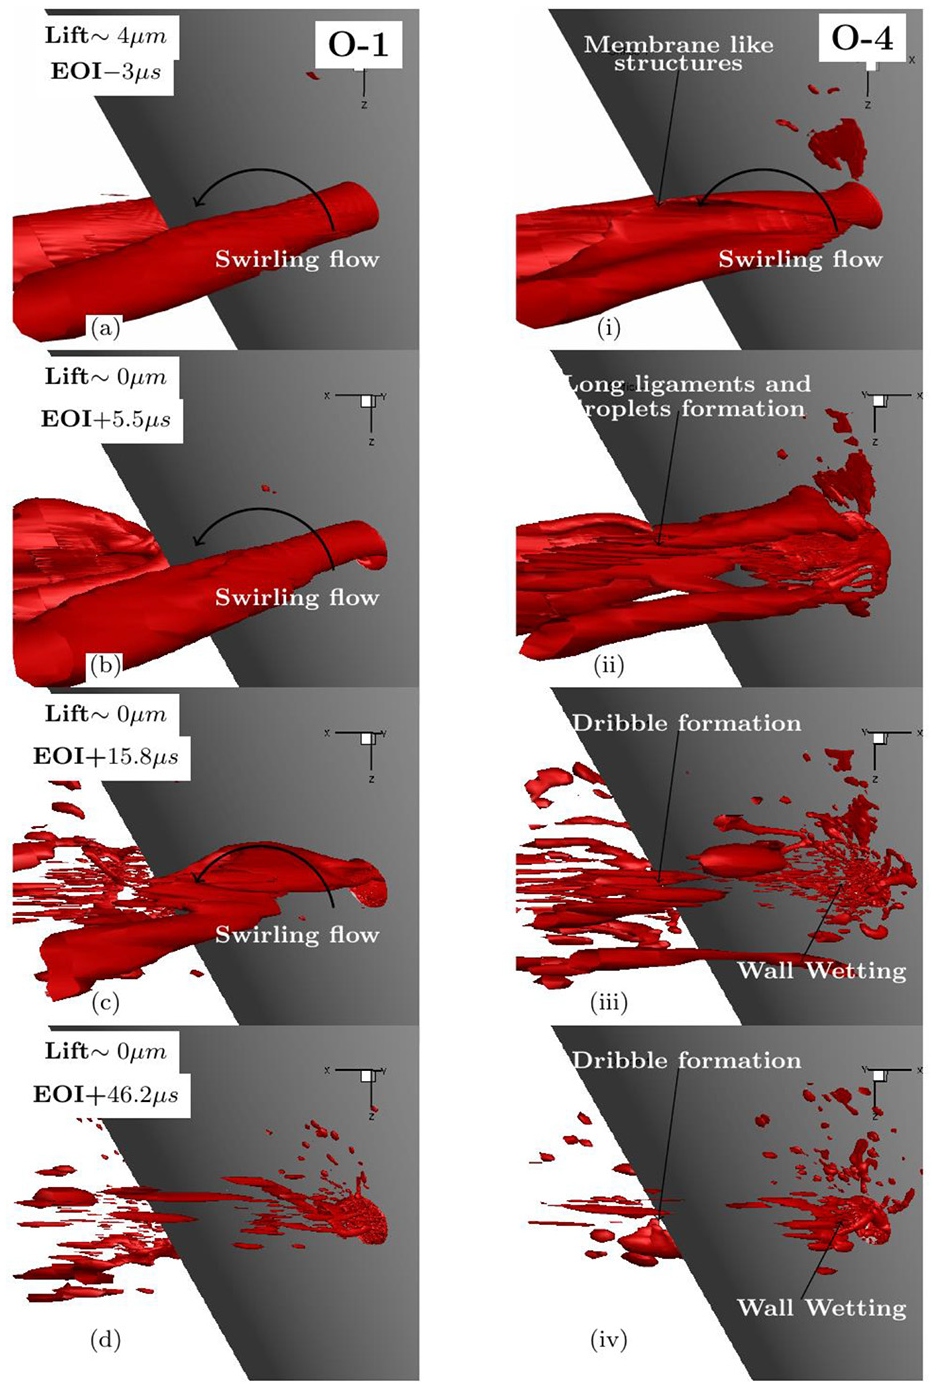
Isosurface of 90% gas volume fraction showing the disintegration of diesel jet during and after the needle closure. The swirling motion creating a membrane like structure and the formation of large ligaments and droplets later causing wall wetting is also shown. Figures are shown selectively from (a–d) Orifice 1 and (i–iv) Orifice 4.
Subsequent start of injection
The subsequent injection after the end of the previous injection cycle starts from a completely closed needle position where the liquid droplets are shown with the solid green lines in Figure 1. At the SSOI, the orifice is partially filled with gas from the previous injection. The eccentricity in needle motion causing the orifices in the upper half being partially covered is evident from Figure 13(a). The formation of cavitation under the needle valve created due to vortices generated during the sudden opening of the valve can also be seen in Figure 13(a). As the needle lifts-off from its seat, the suction created by the needle motion pulls some gas that is already present inside the orifice further towards the needle valve and also into the sac volume. By comparing the instances shown in Figure 13(a) and (b), the ingestion of the gas into the sac can be traced. The presence of gas inside the sac volume during the start of injection was also observed by Swantek et al.,
4
Mitroglou et al.
24
in their experimental studies. The suction of the gas into the sac continues until about
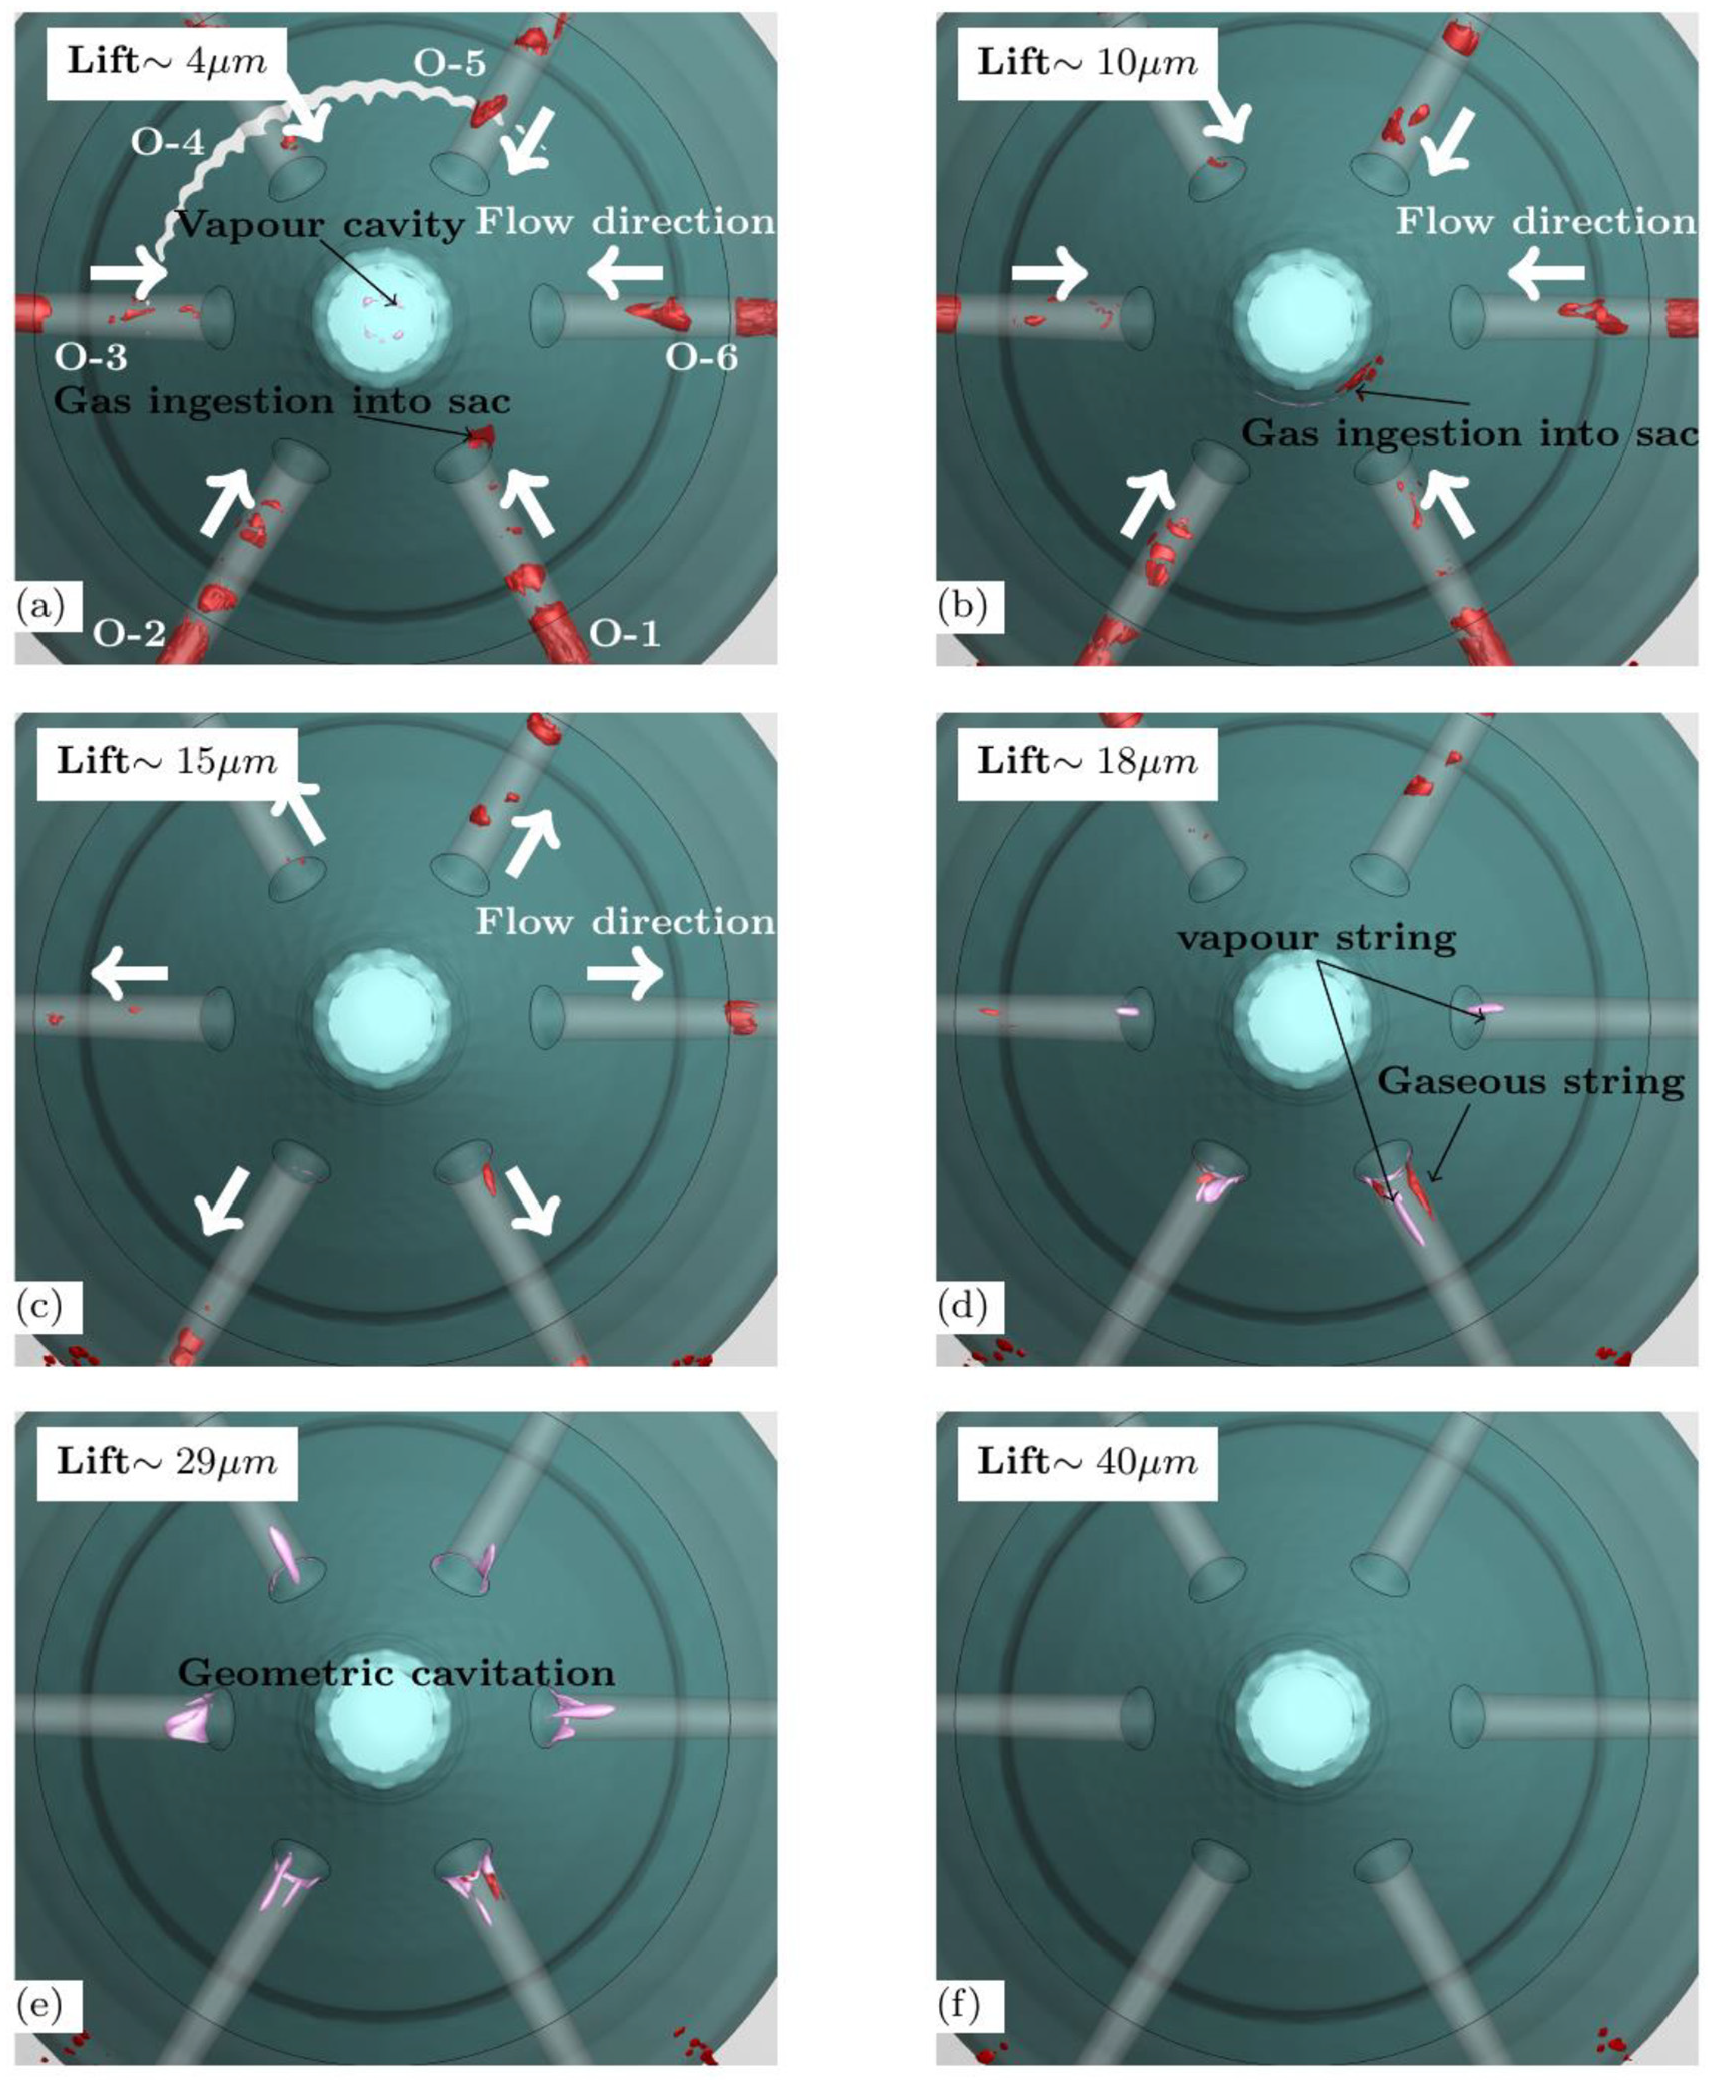
Evolution of diesel jet and formation of cavitation during subsequent start of injection shown using a view from the bottom of the injector (a–f). The presence gas bubbles inside the orifices and the ingestion of gas into the sac volume is depicted using iso-surface of 90% gas volume fraction (red) and 50% vapour volume fraction (pink).
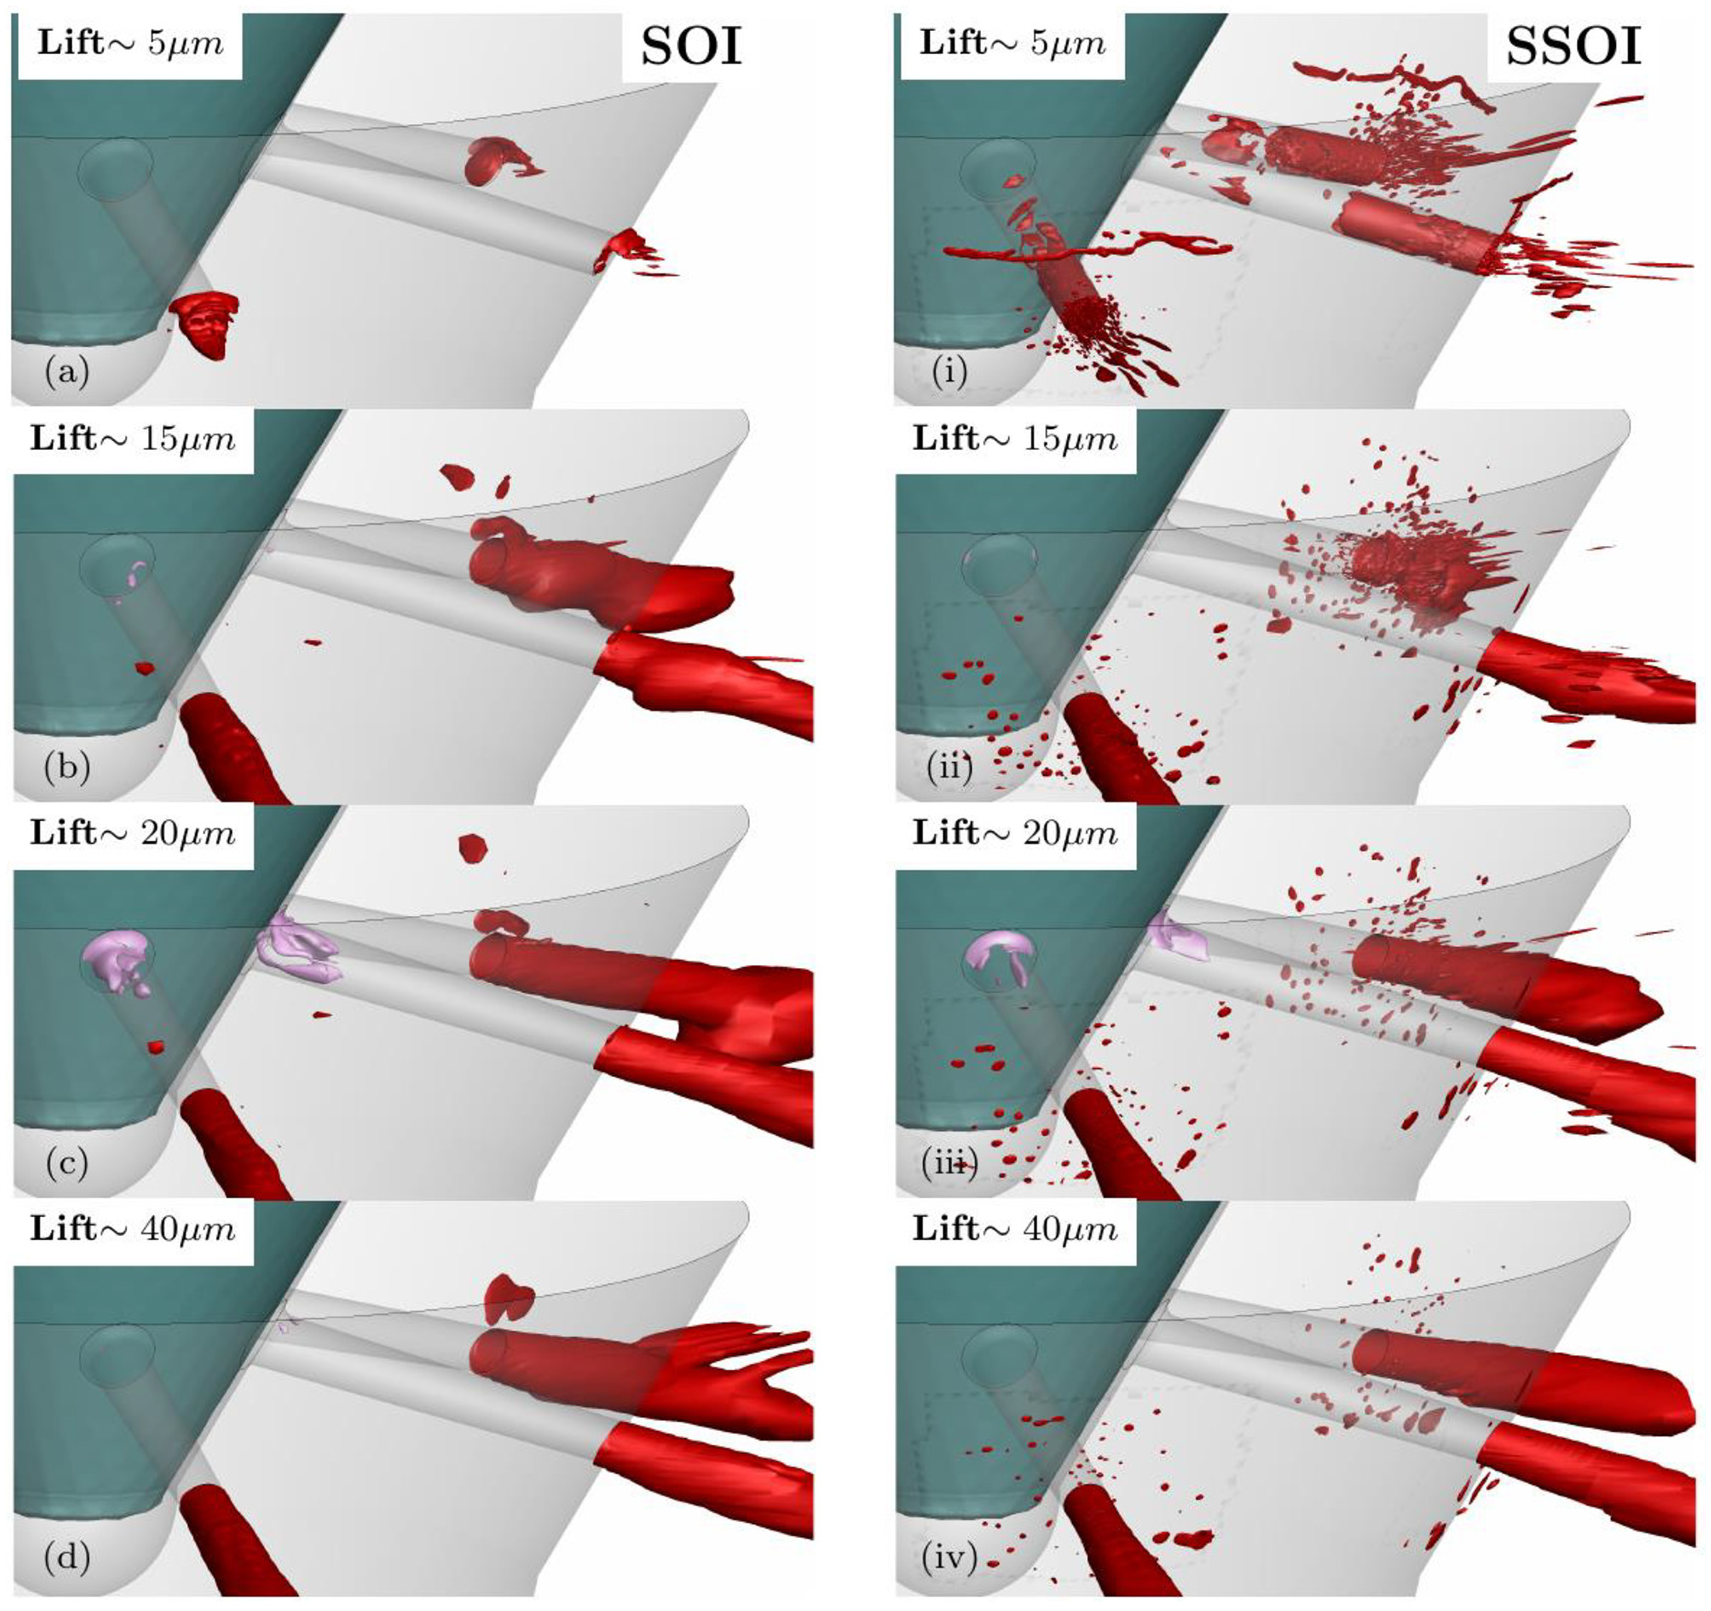
Comparison between (a–d) SOI and (i–iv) SSOI at different needle lift showing the delay in jet formation due to the presence of entrained gas in the orifice. Iso-surfaces of 90% gas volume fraction shown in red and 50% vapour volume fraction shown in pink.
On the nozzle wall surface, which is in contact with the combustion chamber, the number of droplets sticking is much higher compared to that seen during SOI situation. This is primarily due to the residue from the previous injection being present inside and near the orifice exit. As the needle lifts-off from its seat, the swirling flow forces more droplets onto the wall as liquid dribbles and agglomerates, forming larger droplets and ligaments; this can be seen in Figure 15(a, i) along with the formation of the spike-like structure at the periphery of the diesel jet. A delay in the formation of diesel jet can also be observed while comparing the orifices O-1 and O-4 in Figure 15(b, ii) which is influenced both by the eccentricity as well as the entrained gas. With the further lifting of the needle valve, the flow from all orifices becomes established and the droplets and ligaments formed at its periphery continue to stick to the wall as before causing wall-wetting. The diesel jet becomes fully established above ∼
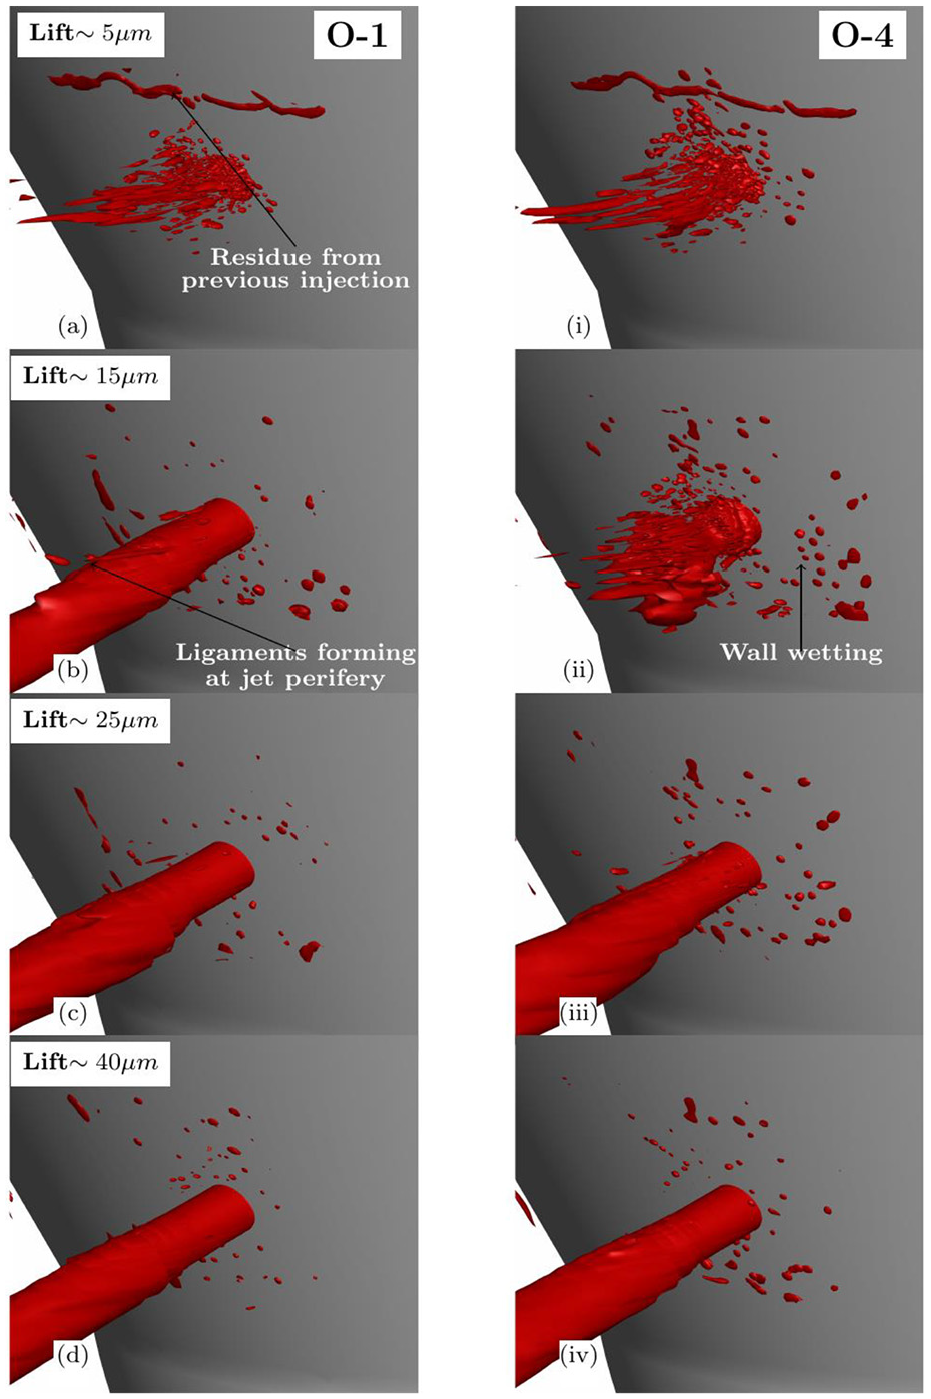
Isosurface of 90% gas volume fraction showing the residual droplets and the newly formed droplets sticking to the wall due to adhesion during subsequent start of injection. Figures are shown selectively from (a–d) Orifice 1 and (i–iv) Orifice 4.
Conclusion
Fuel dribbling and external nozzle wall wetting occurring during the opening, closing, dwelt time of the needle valve of a diesel injector nozzle have been simulated numerically by solving the Navier-Stokes equations, utilising a fully compressible two-phase two-component barotropic model; the barotropic fluid was assumed to be in thermal and mechanical equilibrium with the air, while an additional transport equation coupled with the VOF interface capturing method has been utilised to resolve the liquid-gas interface. The six-hole VCO injector nozzle has been simulated imposing realistic conditions of the valve movement and considering in addition to its axial motion, a time-dependent eccentric motion. The valve motion has been simulated utilising the immersed boundary method; that has allowed for predictions to be obtained at zero valve lift during the dwelt time between successive injections, where the needle remains closed. The model predicted the formation of vortex (or so-called string) cavities stretching from the needle surface till the orifice exit, along with the formation of small droplets and ligaments at the near nozzle exit region. The eccentric needle motion was found to be responsible for the formation of strong swirling flows inside the orifices, which not only contributes to the breakup of the injected liquid jet into ligaments but also to their backwards motion towards the external wall surface of the injector. After their splash, the liquid fragments have been found to splash and stick to the nozzle walls. Model predictions have been qualitative compared against images of the near-nozzle spray as well as cavitation and air entrainment obtained in both the VCO six-hole nozzle and the ECN single hole injector and found in reasonably good agreement. It is found that wall wetting phenomena are more pronounced during the closing period of the valve and fuel injection in subsequent injection events, due to the residual gases trapped inside the nozzle, which contribute to the pure atomisation of the injected fluid.
Footnotes
Declaration of conflicting interests
The author(s) declared no potential conflicts of interest with respect to the research, authorship, and/or publication of this article.
Funding
The author(s) received no financial support for the research, authorship, and/or publication of this article.