
Abstract
The use of biofuels to replace fossil fuels as well as more stringent emission regulations for internal combustion engines cause a challenge for the engine manufacturers to build engines that can cope with a wide range of fuels, but still offer low exhaust emissions with no detriment to performance. In this work a test bed with a compression ignition engine has been used to measure emissions when using a ternary fuel blend between diesel, biodiesel and ethanol together with exhuast gas recirculation (EGR) and different fuel delivery techniques. EGR with biofuels have the potential to significantly reduce NOx over conventional diesel combustion. The fuel used, B2E9 achieves a 10% renewable content as set out in the UK government’s Renewable Energy Directive. Most studies reported in the literature evaluates emissions reduction technologies by only changing one factor-at-a-time at steady state conditions. This paper addresses these issues and presents a methodology utilising a Central Composite Design (CCD) analysis to optimise four engine parameters which include EGR percentage, main injection SOI, pilot injection SOI and pilot injection open duration over a transient drive cycle (WLTP) which makes the results more applicable to real world driving conditions. The optimisation of the CCD showed that NOx emissions decreases by 25% when the maximum exhaust gas recirculation is set to 45%, the main injection is retarded by 2 CADs, the pilot injection dwell time is set to 21 CADs and 24% of the fuel is delivered through the pilot injection. CO emissions increase by approximately 47% as a result of the decrease in NOx emissions.
Introduction
The European Union (EU) has implemented emission standards to reduce the environmental impact of road transport. These measures include the Euro 6 legislation, which enforces limitations on harmful gasses in vehicle exhaust. Viable after-treatment systems are available to meet the new emission limits, but higher costs, durability issues, fuel economy penalties and ever-increasing space requirements limit the widespread adoption of the devices. As a result, improvements to in-cylinder strategies to further reduce the engine-out emissions to decrease the burden put on after-treatment systems, are of great interest. 1 Lowering NOx emissions with exhaust gas recirculation (EGR) is a promising combustion concept that can result in the significant reduction in after-treatment dependencies. 2 Exhaust gas recirculation (EGR) dilutes the combustion materials in the cylinder by either ensuring the mixture is lean or that there is a moderate level of exhaust gas present. The exhaust gas increases the heat capacity of the combustion mixture, thus reducing the combustion temperature.3,4 The application of EGR (usually <50%) reduces the volumetric efficiency of the engine due to the rise in inlet charge temperature with less dense, hot exhaust gas replacing cool inlet air. The oxygen content of the combustion mixture is also reduced when using EGR. As a result, the local flame temperature during combustion is reduced, which reduces the formation of NOx gasses.3,5 Unburned hydrocarbons (UHC) and CO emissions also increase with increasing use of EGR. To try and reduce HC, CO and PM/PN emissions, increasing the fraction of the combustion mixture that burns in the premixed phase can decrease these emissions. For blends with high oxygen content, Huang et al. 6 found that the high volatility and low cetane number enhances the mixing of the air and fuel which results in a more homogeneous mixture, which promotes complete combustion as the presence of oxygen can promote the particle oxidation process. Also, longer ignition delay periods and larger proportions of premixed combustion can be a reason for lower PM emissions of higher alcohol fuel blends. Soot forms in the fuel-rich areas of the combustion zone and by increasing the premixed burn fraction, can reduce or eliminate fuel-rich zones. Multiple fuel injections can also be used to achieve an increase in the premixed combustion fraction. Plamondon and Seers 7 found that while the addition of 20% waste cooking oil biodiesel to a binary blend increased PM emissions and decreased NOx emissions with respect to diesel, a pilot and main injection strategy decreased both pollutants below the level observed with a single injection. Most engines currently incorporate the pilot main (P-M) injection strategy. Biswas et al. 8 investigated the use of different multiple injection scenarios which include pilot, main and after injections (P-M-A) and early, pilot, main and after injections (E-P-M-A). The results show that adding an early injection to a P-M-A strategy lowers the NOx, CO and THC emissions, while keeping PM emissions the same. The early injection promotes the mixture of the fuel with the air in the cylinder and as the piston reaches top dead centre (TDC) it creates an almost homogeneous environment. Carlucci et al. 9 found that the duration and timing of injections such as the pilot injection have an effect on the formation of NOx and PM emissions. By advancing the pilot injection timing, PM emissions can be reduced, as the pilot injection increases the main injection delay which results in the reduction of diffusive combustion. Zhang et al. 10 also reported a reduction in CO and PM emissions by advancing the pilot injection. The pilot injection duration was shown to have a major effect on the formation of NOx. By increasing the injection duration, cylinder temperatures will increase, resulting in an increase in NOx emissions. The increased duration of the pilot injection also decreases the main injection delay, which reduces NOx formation. Mathivanan et al. 11 compared combustion of diesel using only a main injection with the emissions from combusting diesel using multiple injections. Multiple injections reduced the engine out NOx emissions from approximately 381 ppm to 17 ppm. Mathivanan et al. 11 also reported that decreasing the duration of the pilot injection will result in the retarded combustion of the main injection, which decreases the formation of NOx gasses. The use of multiple injections such as the E-P-M injection strategy can ultimately reduce both PM emissions and NOx emissions.
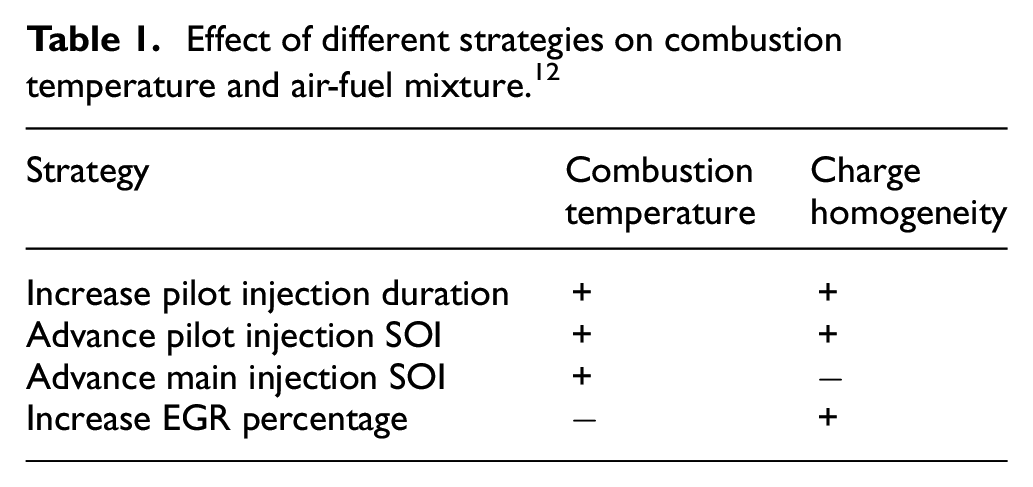
For the purposes of this research, the change of different engine operating parameters will be categorised into two groups, parameters that can reduce combustion temperature and parameters that can increases the homogeneity of the air-fuel mixture. Table 1 summarises the effects that the change of the engine parameters have on combustion temperature and charge homogeneity. The + sign indicates an increase in value and the − sign indicates a decrease in value. The change in these engine operating parameters has contrasting effects on cylinder temperature and air-fuel mixture. This research aims to optimise the different engine operating parameters identified in Table 1 to ensure their opposing and complimentary effects on the combustion temperature and charge homogeneity result in emissions reduction.
Effect of different strategies on combustion temperature and air-fuel mixture. 12
DoE allows for the investigation of multiple factors and their effect on engine emissions. The levels of the factors are changed simultaneously, rather than one at a time. This contributes to a cost and time saving.13,14 The use of DoE is appropriate as other studies have used it successfully to investigate the effects between injection timing, injection pressure and nozzle tip protrusion on emission characteristics, 15 to analyse the role of the injection system parameters on engine emissions, noise and fuel consumption 16 and to determine the optimum composition of a ternary fuel blend that will reduces emissions when tested over the WLTP. 17
The use of biofuels together with EGR can also be beneficial in reducing engine emissions further. 18 He et al. 19 and Huang et al. 6 concluded that adding alcohols to the fuel blend dilutes the aromatics content of the fuel which tends to decrease the soot precursors. Although using biodiesel and ethanol increases the NOx emissions due to higher in-cylinder temperatures, this can be mitigated using EGR. Mofijur et al. 20 reviewed the available literature and suggested that the NOx emissions can be countered with the use of exhaust gas recirculation.3,5,21 Zhang et al. 10 reported that even though high percentages of EGR can inhibit mixing between air and fuel, thus increasing PM and CO emissions even more, 22 the oxygen content of biodiesel and ethanol permits increased use of EGR, resulting in less PM and CO emissions than that of petroleum diesel. Zheng et al. 3 also showed that high percentages of EGR together with neat biodiesel can result in a decrease in NOx emissions as well as soot emissions. High percentages of EGR are able to counter the negative effect that neat biodiesel has on NOx emissions. Mofijur et al. 20 also found that EGR can reduce the NOx emissions when using biodiesel blends while still getting a reduction in CO, PM and HC emissions.
This research will use a ternary blend B2E9, which achieves the required renewable content target as set out by the European Union. 23 By using a statistical tool such as the Central Composite Design DoE during transient engine test conditions, this research will demonstrate the ability to significantly reduce in-cylinder NOx emissions with the use of renewable fuel and optimised emission reduction strategies.
Materials and methods
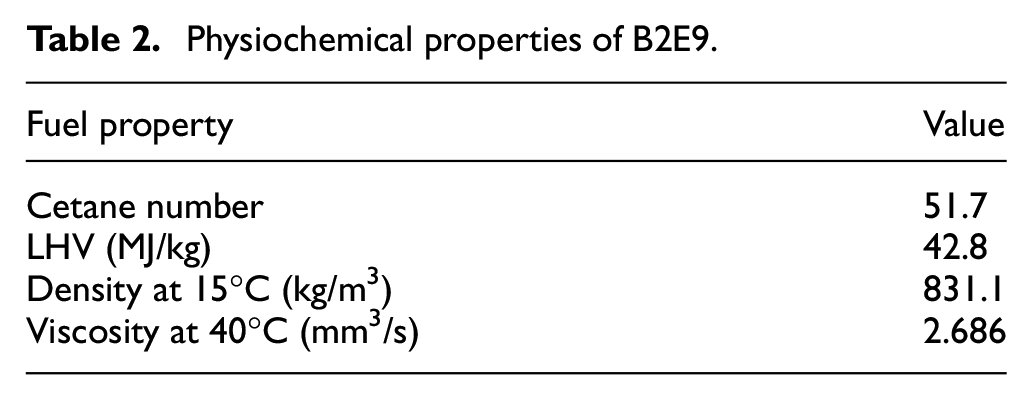
The following subsections explore the set-up of the experimental equipment as well as of the Response Surface Method (RSM). The physiochemical properties provided by the fuel supplier of B2E9, are listed in Table 2.
Physiochemical properties of B2E9.
Experimental set-up
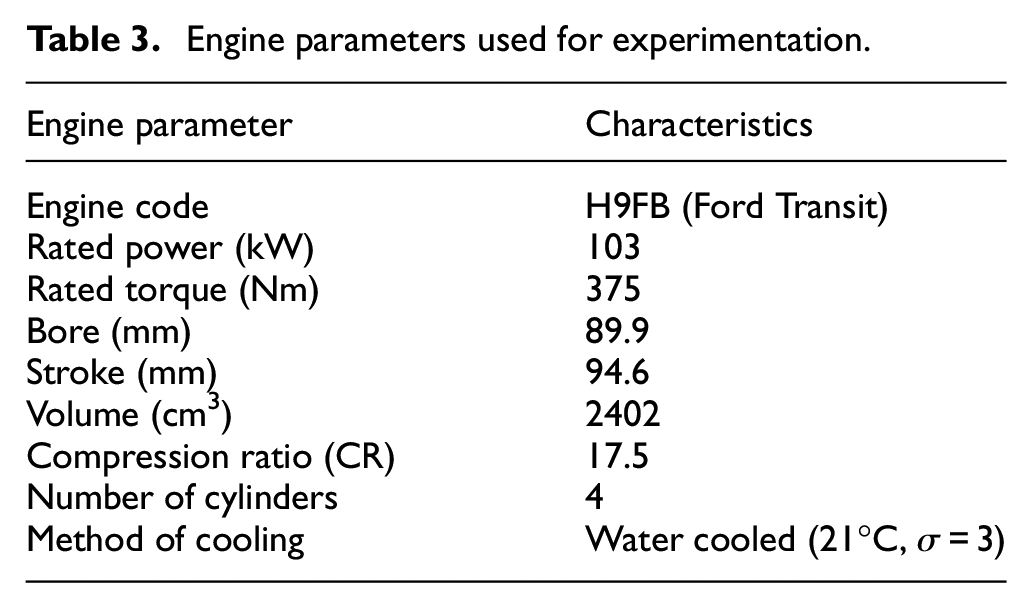
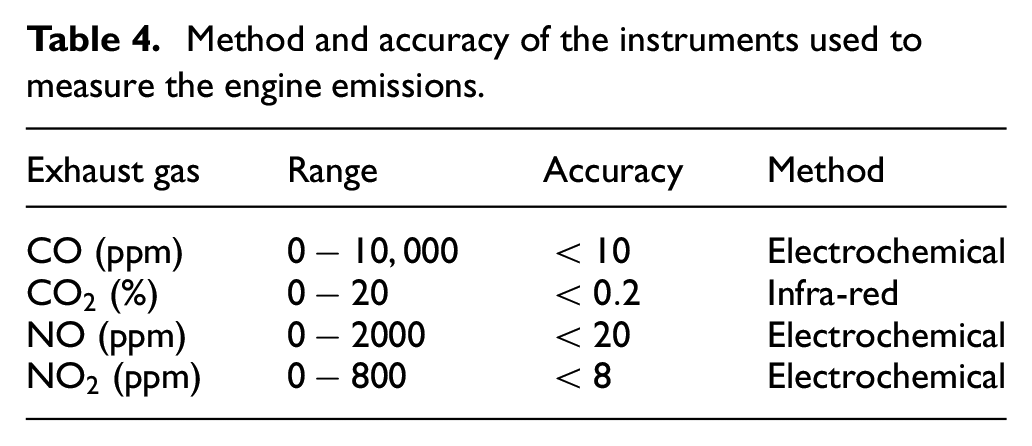
A 2.4 L Euro IV compression ignition (CI) engine with a programmable after-market ECU was used as the test engine to collect the data. Figure 1 shows a schematic of the CI engine testing facility that was used for studying the engine emissions. The engine, with specifications listed in Table 3, was connected to a Froude FO271 dynamometer which is capable to absorbing a maximum of a 1000 kW and 4000 Nm. Three exhaust gas analysers were used; one (NOVA 7466K) for measuring NOx emissions, (TESTO 350) for measuring CO emissions and a Pegasor M-sensor for measuring the PM and PN emissions. The use of different gas analysers ensured the highest accuracy in the measurement, as the NOVA and TESTO gas analysers have different accuracy levels for different exhaust gasses. All the gas analysers were located upstream of any exhaust after treatment systems. A summary of the analysers is presented in Table 4. The factory fitted mass airflow sensor (part number 6C11-12B579-AA), calibrated with a Superflow SF-120 flow bench, was used to measure the intake mass air flow in kg/s. Data such as engine speed, throttle position, cooling water temperature and oil sump temperature were recorded from the ECU as well as from the dynamometer control system.
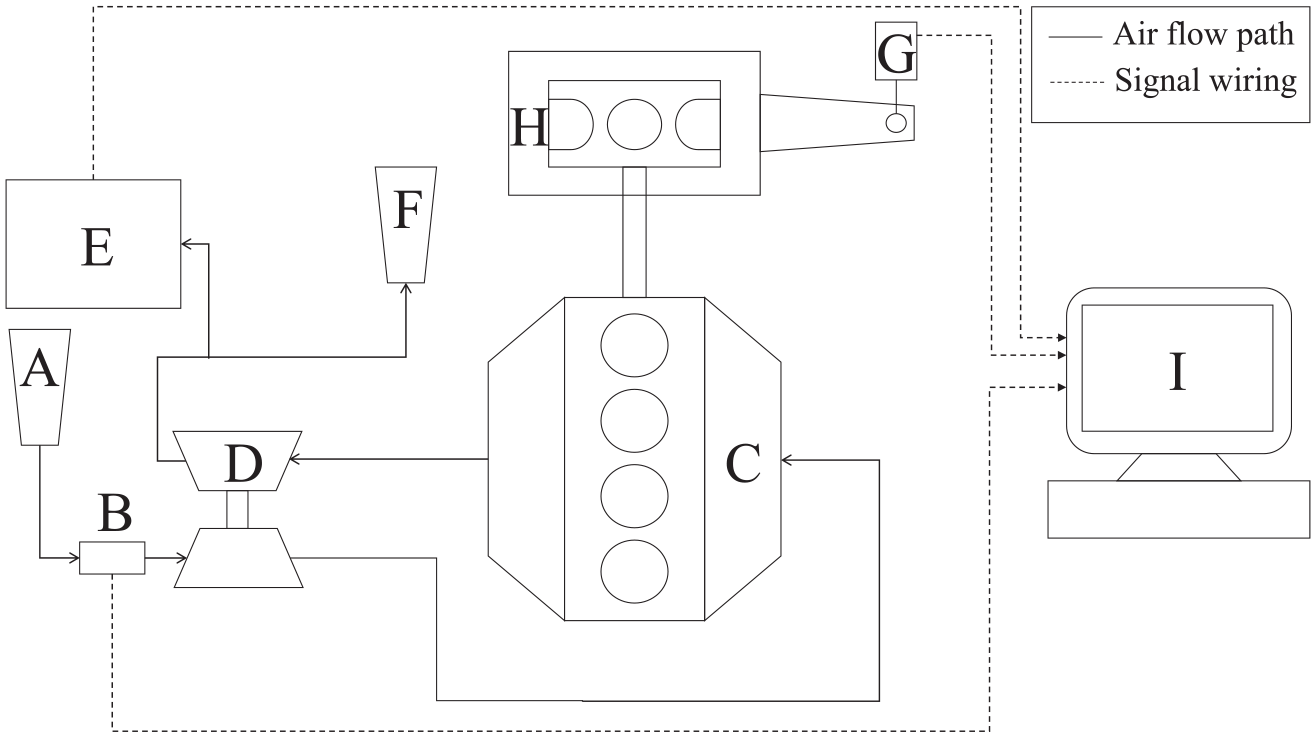
Layout of the engine test cell together with measuring equipment; A: air filter; B: Mass airflow sensor; C: engine; D: Turbo charger; E: gas analyser; F: exhaust outlet; G: load cell; H: dynamometer; I: DAQ.
Engine parameters used for experimentation.
Method and accuracy of the instruments used to measure the engine emissions.
Experimental design
Four engine operating variables were considered for this study. They include EGR percentage, main injection start of injection (SOI), pilot injection SOI and pilot injection duration. The engine responses include CO emissions, CO2 emissions, NOx emissions and particulate mass (PM) and particulate number (PN). A

where N is the number of experimental runs, k is the number of independent variables, and
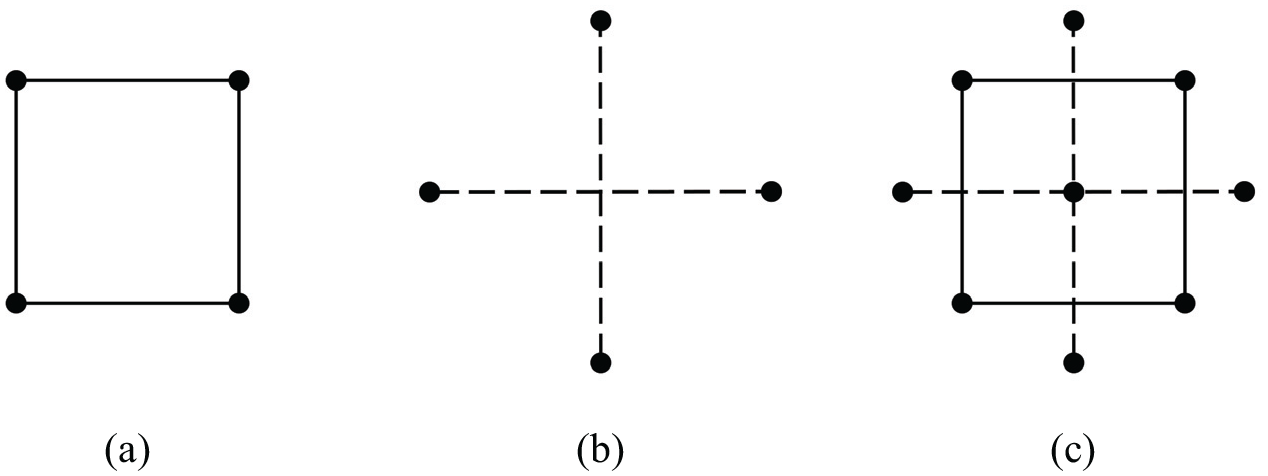
Central composite design.
14
(a) Factorial experimental points. Factors on the cube corners are coded
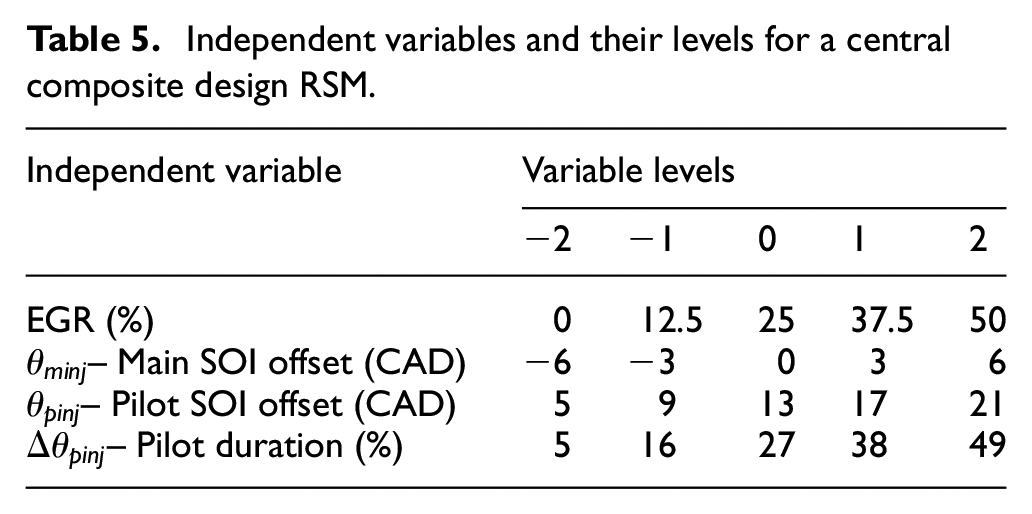
The minimum and maximum ranges of independent variables were considered and the full experimental plan with their values in un-coded and coded forms is listed in Table 5. The values for the EGR percentages shown in Table 5 indicate the maximum EGR percentage of the operating map. Examples of EGR maps that were generated for 12.5% and 50% EGR percentages can be seen in Figures 3 and 4, respectively. The maximum operating point of 50% was chosen as that was the maximum amount of EGR employed by the engine’s ECU before testing started. Other published literature also investigated values of EGR in the region of 50%.3,4,24 Zheng et al. 3 found that increasing the EGR percentage above 65% for steady-state tests on a single cylinder engine, results in cycle-to-cycle variability. Asad and Zheng 4 also concluded that the use of high percentages of EGR and high boost pressures are challenging. Engines with conventional turbochargers struggle to produce high boost and high EGR at the same time, especially at low loads. Higher boost levels require more of the exhaust to be diverted to the turbine. However, higher EGR percentages require more of the exhaust gases to be re-introduced into the intake manifold. As such, low diesel exhaust temperature at low loads places limits on the practically achievable boost pressure. Also, by investigating higher values of EGR would influence the operation of the turbocharger and ultimately influence the repeatability of the tests on the engine test cell. The limitation of the maximum EGR percentage to 50% and using the layout of the default ECU map for the EGR operation is thus acceptable.
Independent variables and their levels for a central composite design RSM.
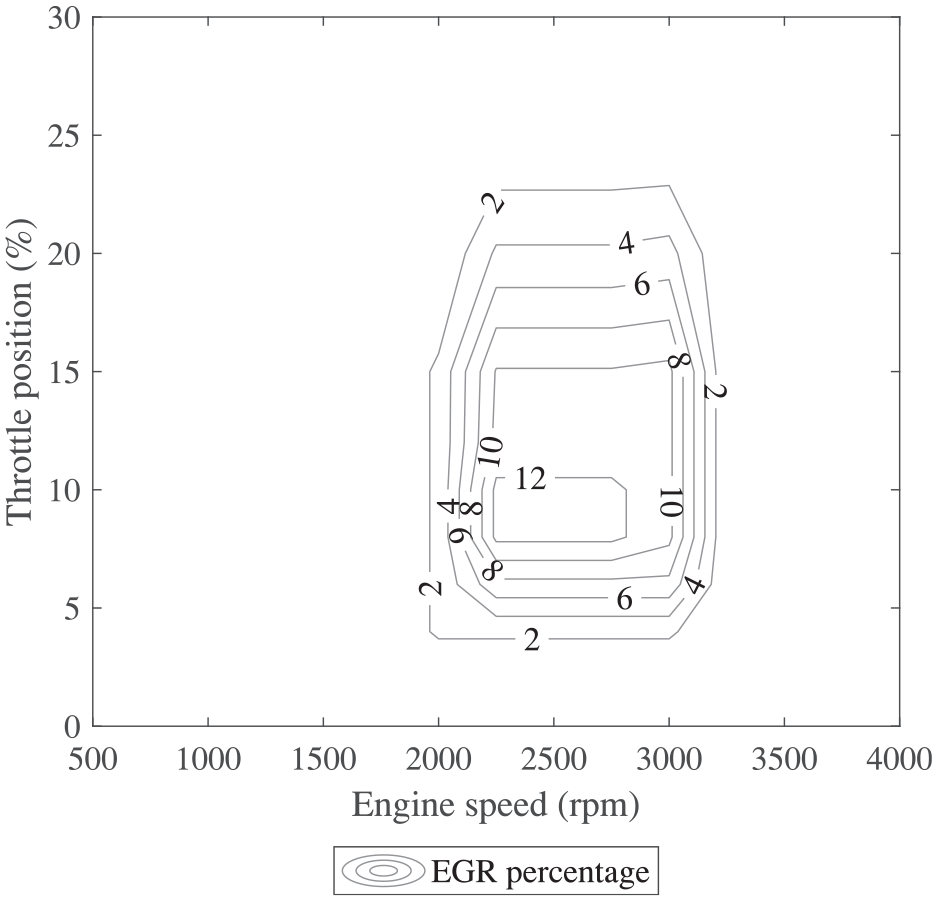
ECU map for a maximum EGR percentage of 12.5%.
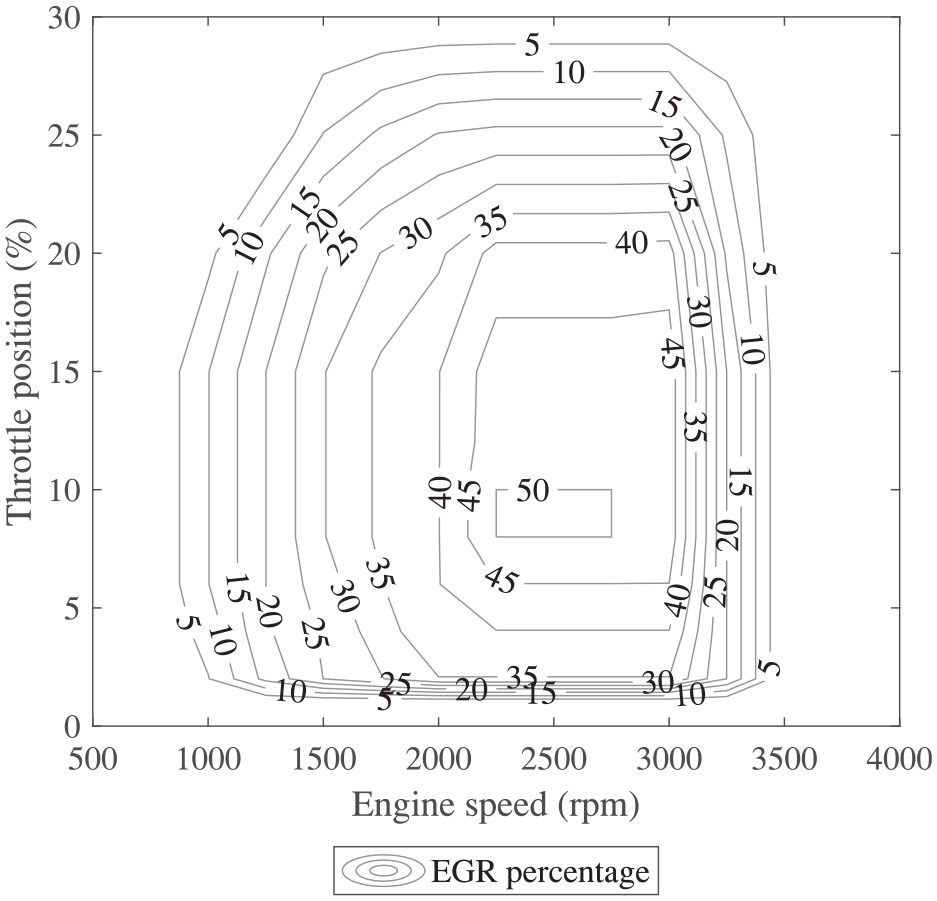
ECU map for a maximum EGR percentage of 50%.
The current ECU map for the main injection start of injection (SOI) will be used to investigate the effect of changing the SOI of the main injection. The ECU map can be seen in Figure 5. The main injection SOI map shown in Figure 5 will be changed according to the values shown in Table 5. By adding values to the main injection SOI map, the main injection SOI will become more advanced and by subtracting values from the map, the main injection SOI will become more retarded.
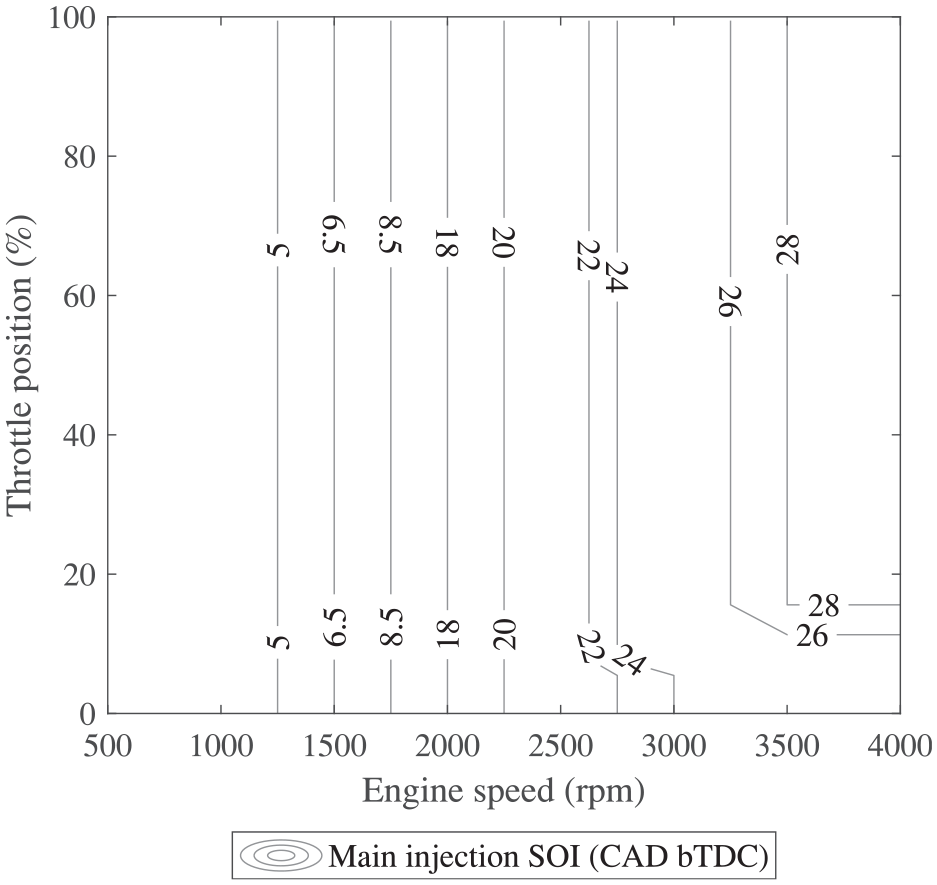
Baseline ECU map for the main injection SOI.
The operating map that will be used for the pilot injection SOI will be generated using the main injection SOI and offsetting it with the values indicated in Table 5. This can be calculated with the following equation:

where
The pilot duration in Table 5 is shown as a percentage of the total fuel being delivered to the engine. As the percentage of fuel introduced with the pilot injection increases, the fuel delivered through the main injection decreases accordingly. This is to ensure that the total amount of fuel entering the cylinders stay the same. The total injector open time for the whole operating envelope of the engine as a function of throttle position and engine speed was determined by adding the default ECU maps for the main injection duration and the pilot injection duration together. The summation is shown in Figure 6. The pilot injection duration (in µs) is calculated from the the map shown in Figure 6 with the following equation:

where

Expressing the fuel amount as a percentage of the total fuel delivered has been done in other research as well10,26,27 where multiple injections were tested and the amount of fuel delivered by each injection was expressed as a percentage of the total fuel. A visual representation of the parameters used in the central composite design can be seen in Figure 7.
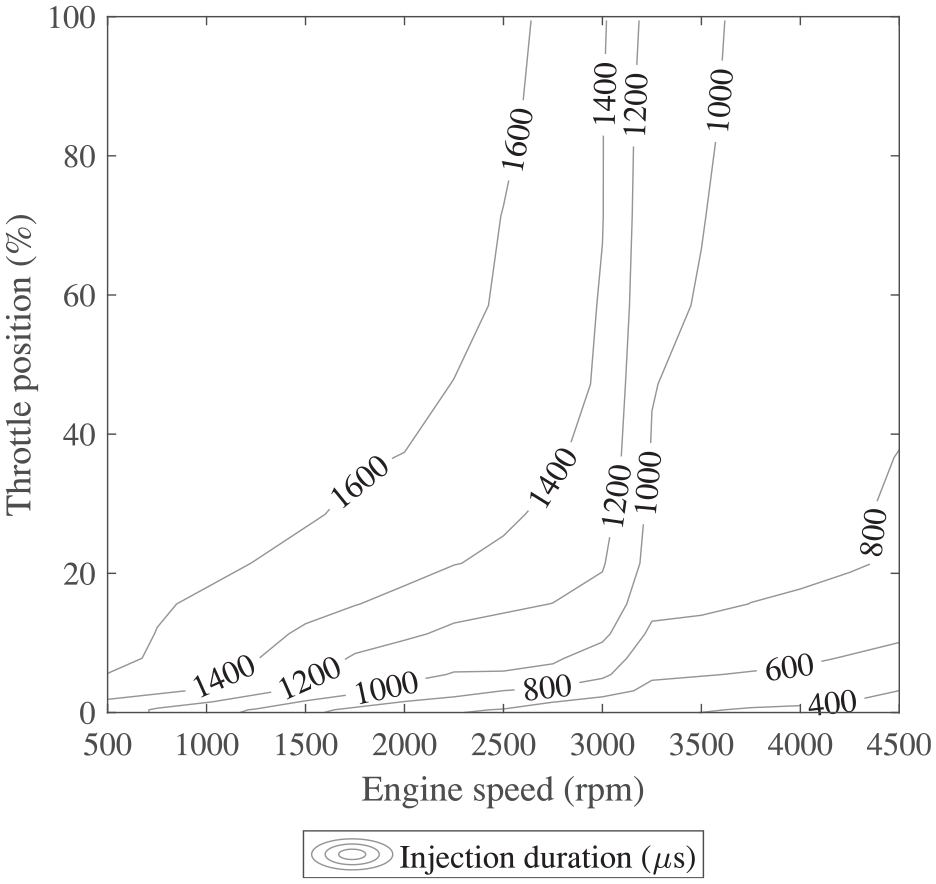
Total fuel delivered to the engine.
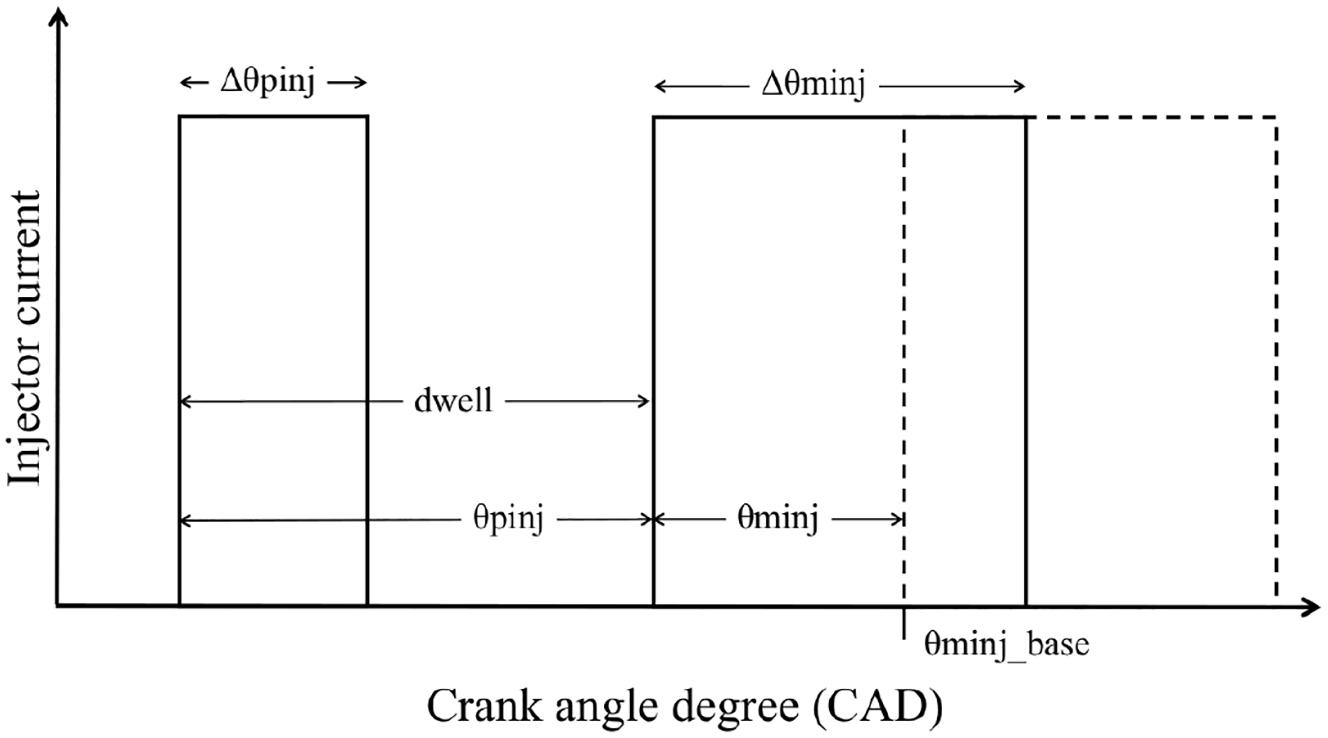
Visual representation of the parameters listed in Table 5.
Optimisation of DoE
The optimisation of the engine operating parameters is dependent on more than one engine response which include CO emissions, NOx emissions and PN/PM emissions. The desirability approach was used for the optimisation of the engine operating parameters (EGR,
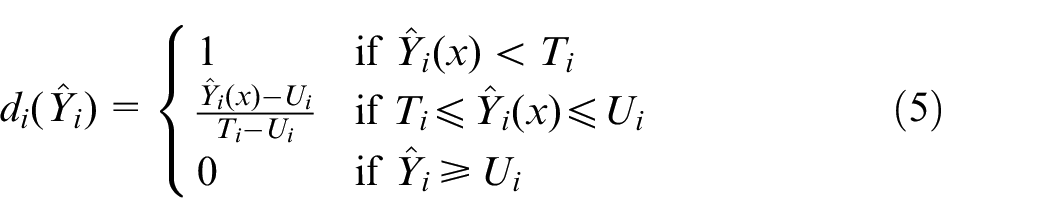
where

It is noticeable that if any response
Data collection
The engine was run on the WLTP as shown in Figure 8. The WLTP shows the variation of vehicle speed with time. Since only the engine and not the whole vehicle was tested it is necessary to relate the vehicle speed to the engine speed and load, based on the vehicle characteristics such as gear ratio etc. The method used is presented elsewhere. 29
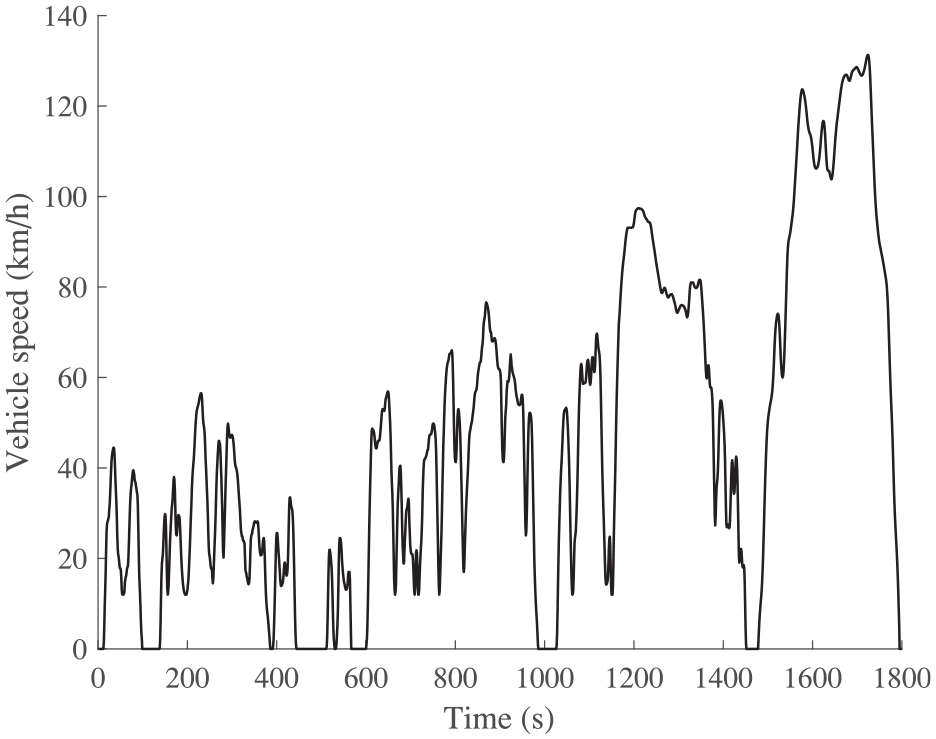
The World Harmonised Light Vehicle Test Procedure used in the type approval of new vehicles as per EU regulation 2017/1151. 30
Results
In this section, the effects of changing different engine operating parameters on different engine responses were considered. These engine operating parameters include exhaust gas recirculation (EGR) percentage, main injection SOI (
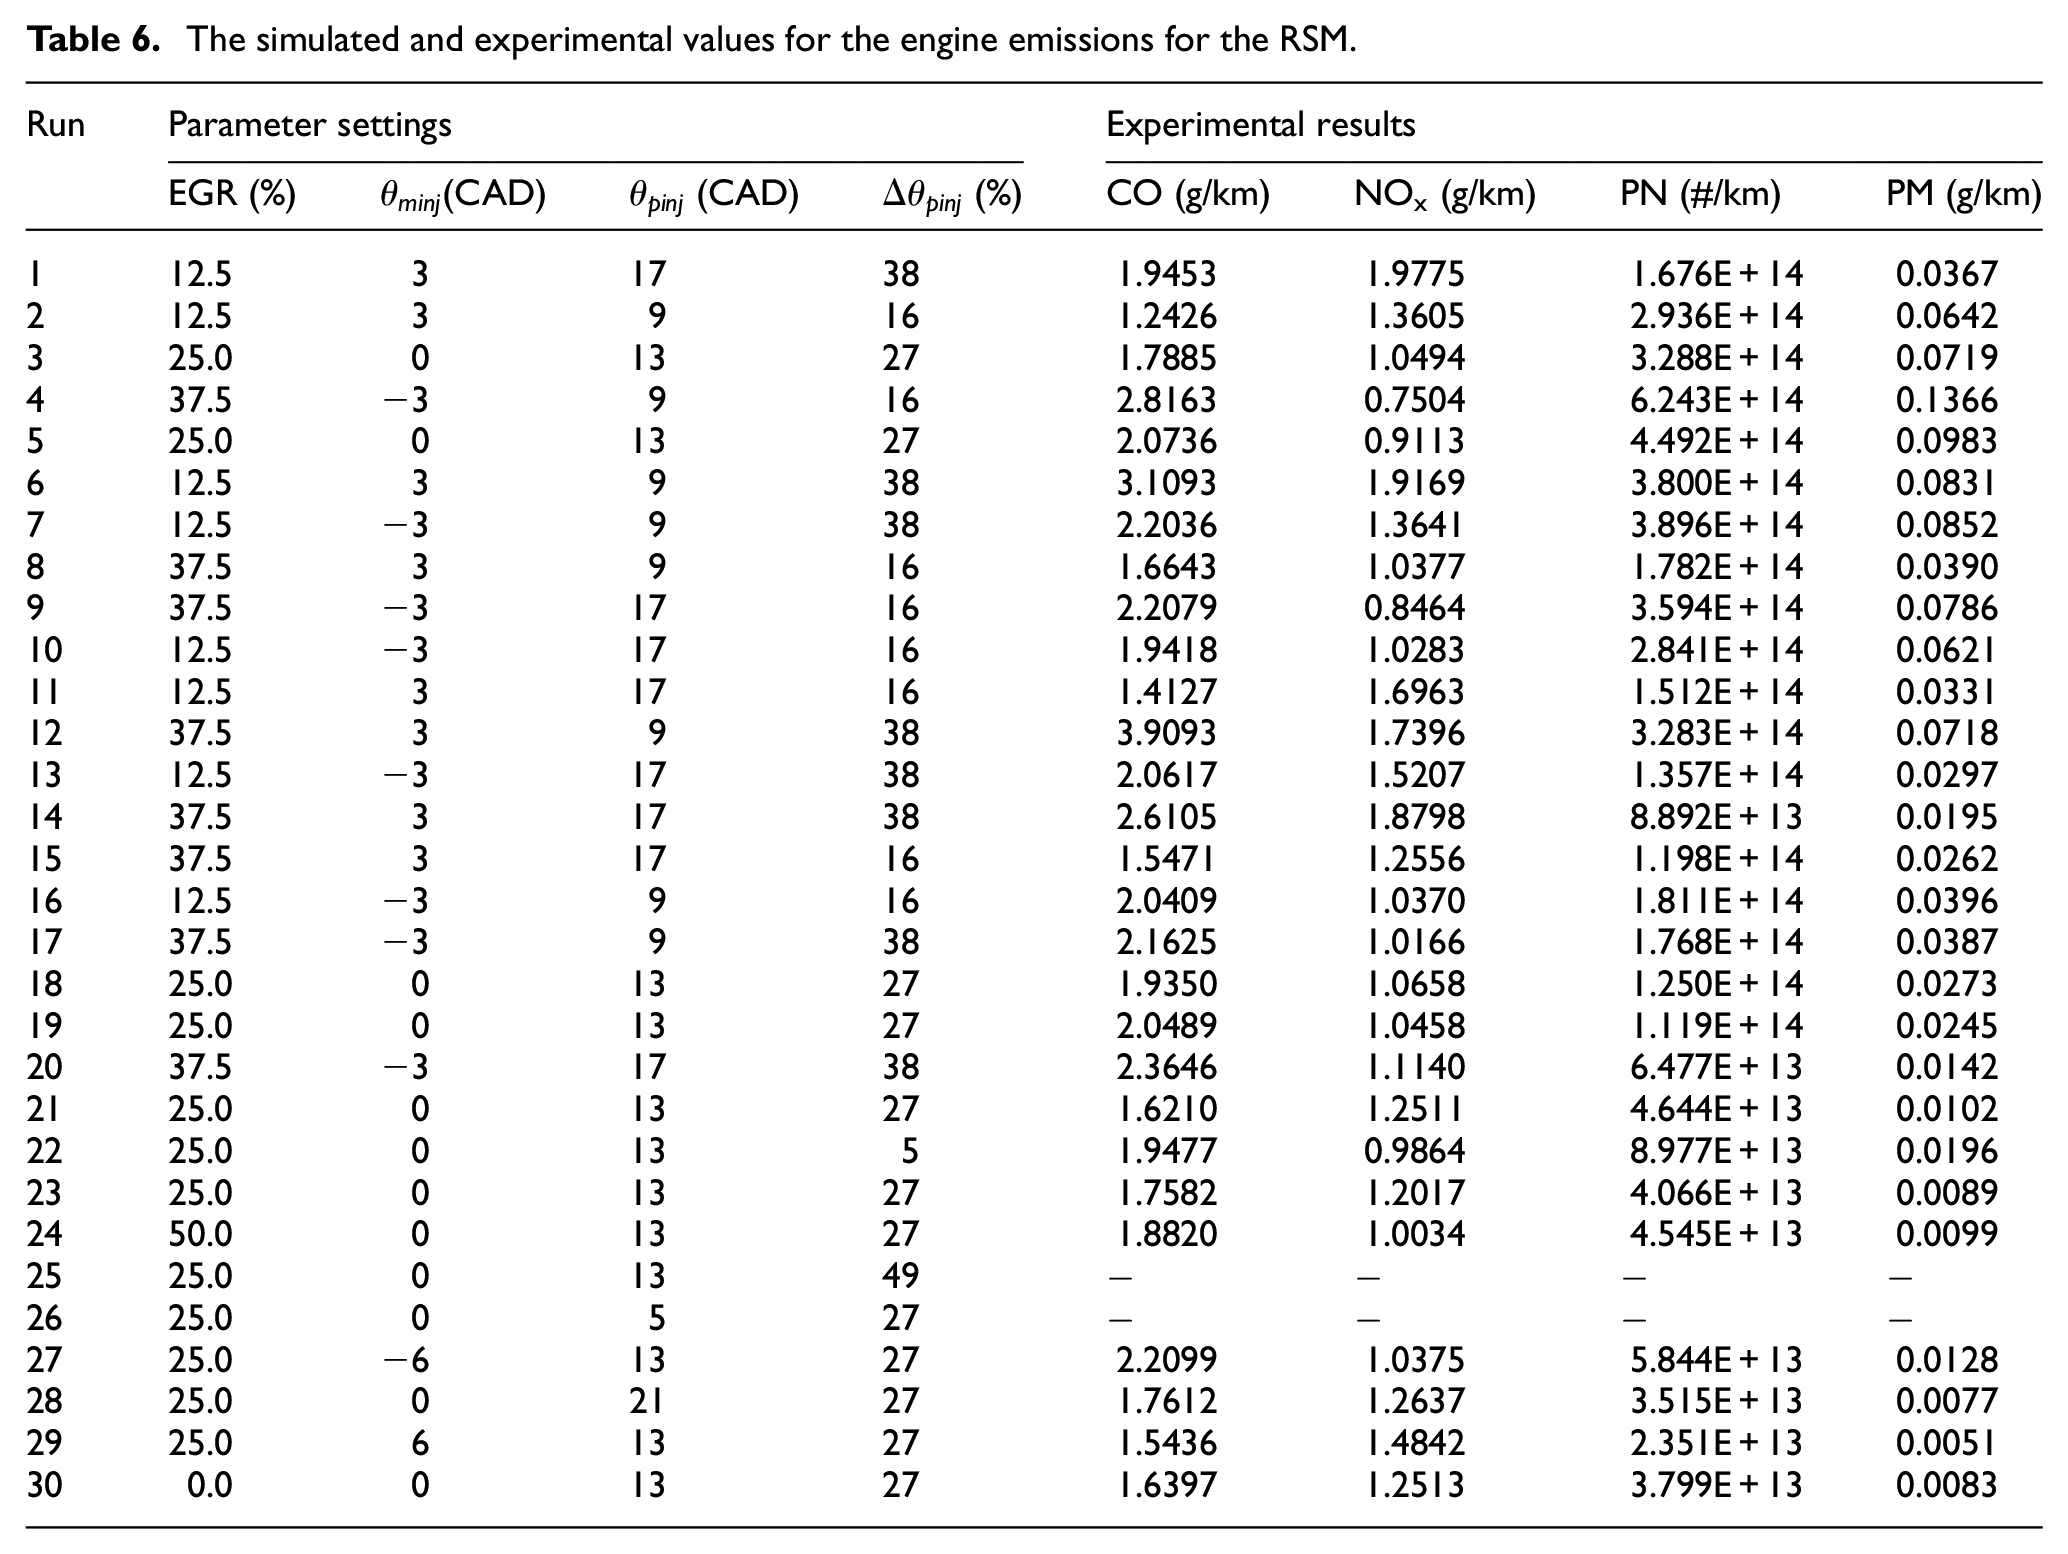
The simulated and experimental values for the engine emissions for the RSM.
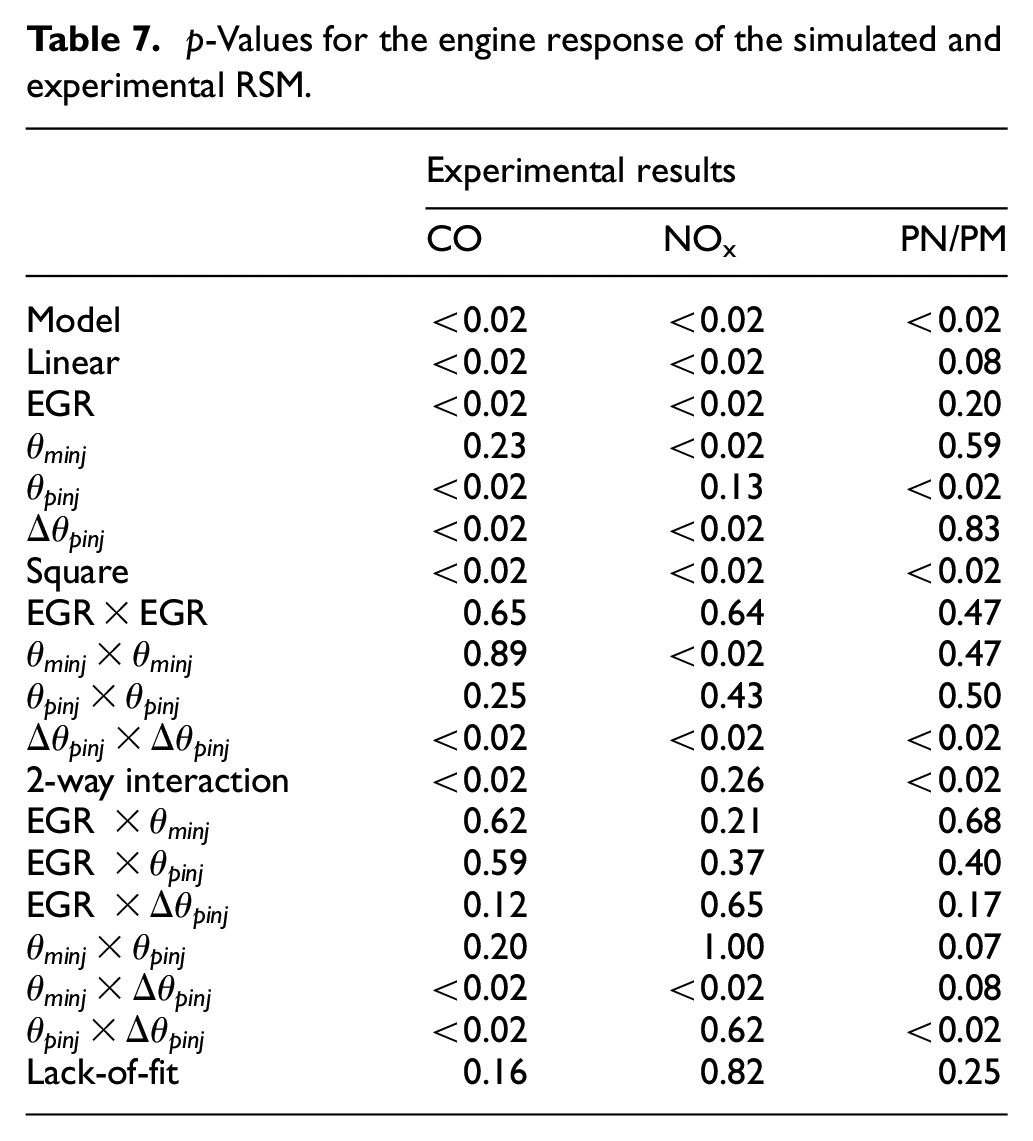
p-Values for the engine response of the simulated and experimental RSM.
CO emissions
The quadratic model developed for the CO emissions as fitted based on the RSM design corresponds to:
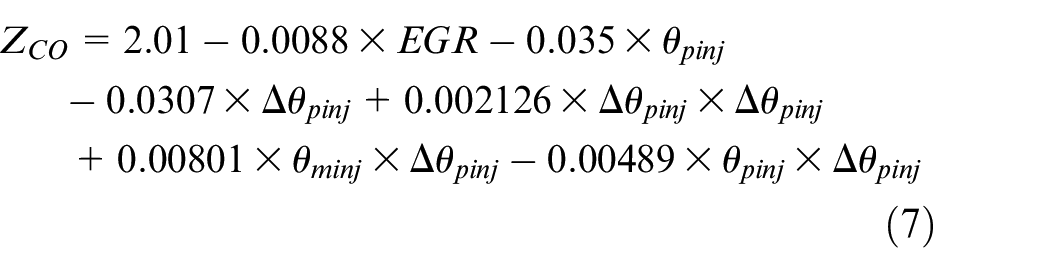
where ZCO is the CO emissions in the exhaust gas of the engine in grams per kilometer. High values of
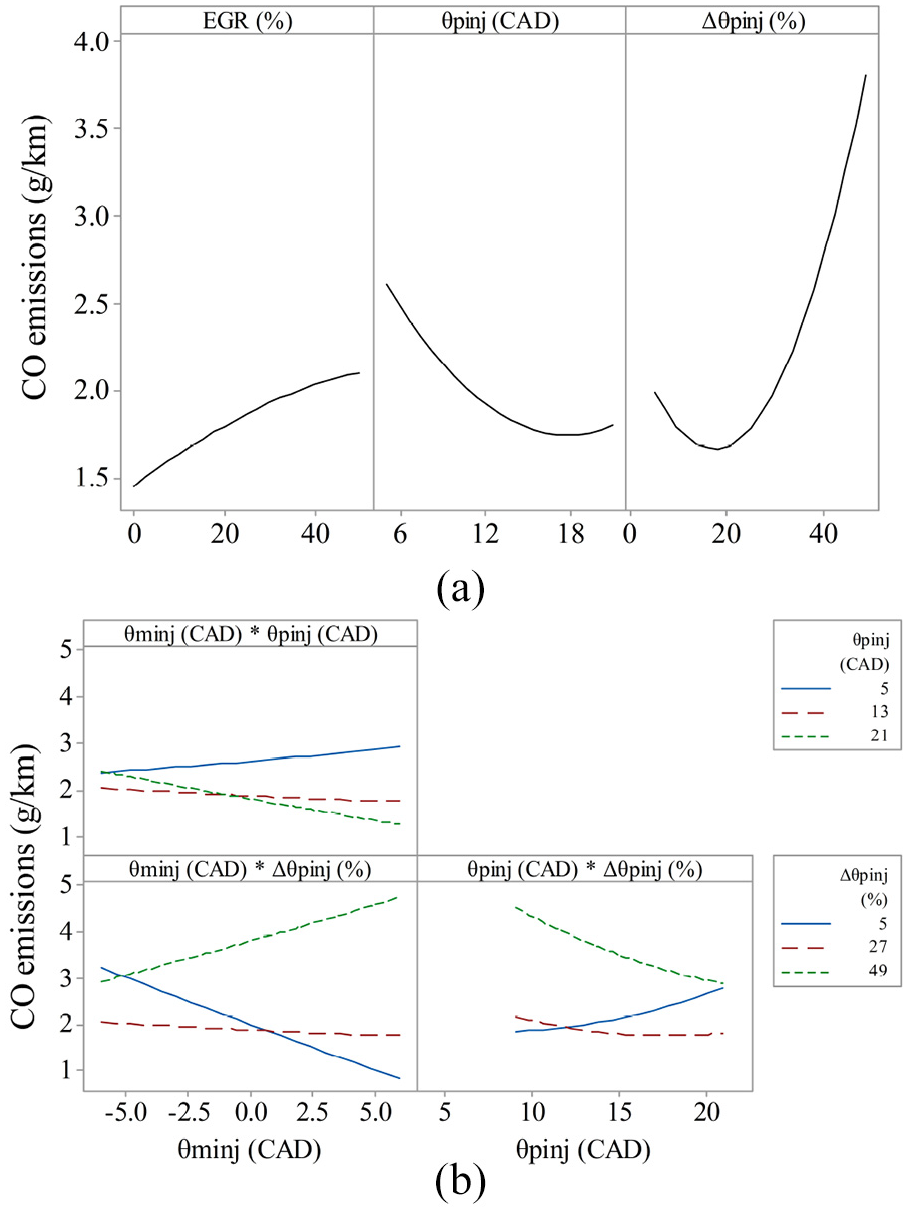
Response plots for the experimental CO emissions when engine operating conditions are varied. (a) Main effects plot for experimental engine CO emissions. (b) Interaction effects plot for the experimental engine CO emissions.
Figure 9(a) shows that CO emissions decrease by increasing
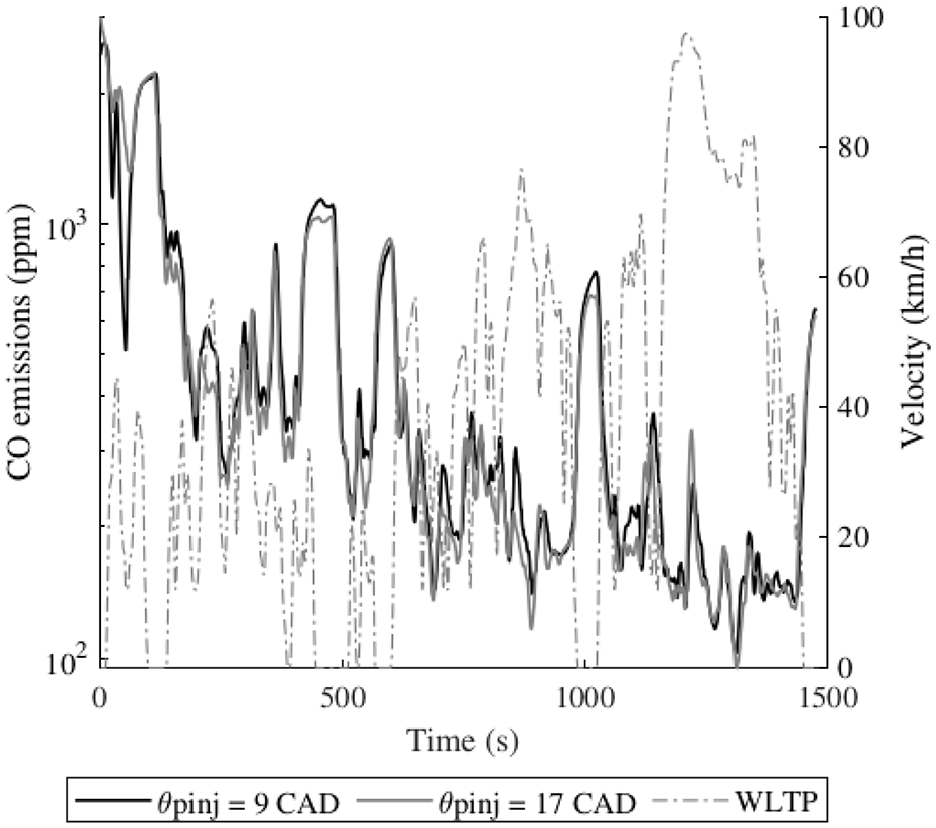
CO emissions comparison with
The percentage fuel delivered through the pilot injection also significantly influences the formation of CO emissions. Engine CO emissions can be kept to a minimum if approximately 20% of the total fuel is delivered through the pilot injection. The increase in fuel delivered through the pilot injection, increases the amount of fuel available to mix with the intake air, before combustion occurs and thus increases the fraction of fuel burned in the premixed combustion phase. Figure 9(a) also shows that by increasing the amount of fuel delivered by the pilot injection past 20%, increases the CO emissions generated by the engine. Carlucci et al. 9 reported a similar phenomena where a certain percentage of the fuel delivered through the pilot injection, promoted the homogeneity of the air fuel mixture prior to combustion. For small percentages of fuel delivered through the pilot injection, the mixture is too lean for autoignition to occur even with the increased pressure and temperature produced by the compression stroke of the engine. When the percentage of fuel increases past a certain point, autoignition of the fuel injected through the pilot injection can occur and this reduces the ignition delay of the main injection, due to increased temperatures and pressures. The reduced ignition delay causes the majority of the fuel delivered through the main injection to burn in the diffusion combustion phase which increases the formation of CO emissions. 3 If more than 40% of the fuel is delivered through the pilot injection, it can also start influencing the performance of the engine with an increase in incomplete combustion which also results in an increase of CO emissions.
The interaction effects between
The interaction effects between
NOx emissions
The quadratic model developed for the NOx emissions as fitted based on the RSM design corresponds to:
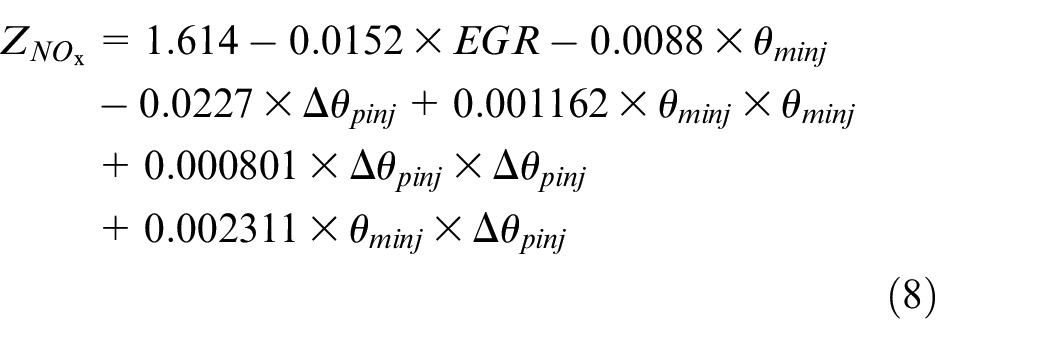
where
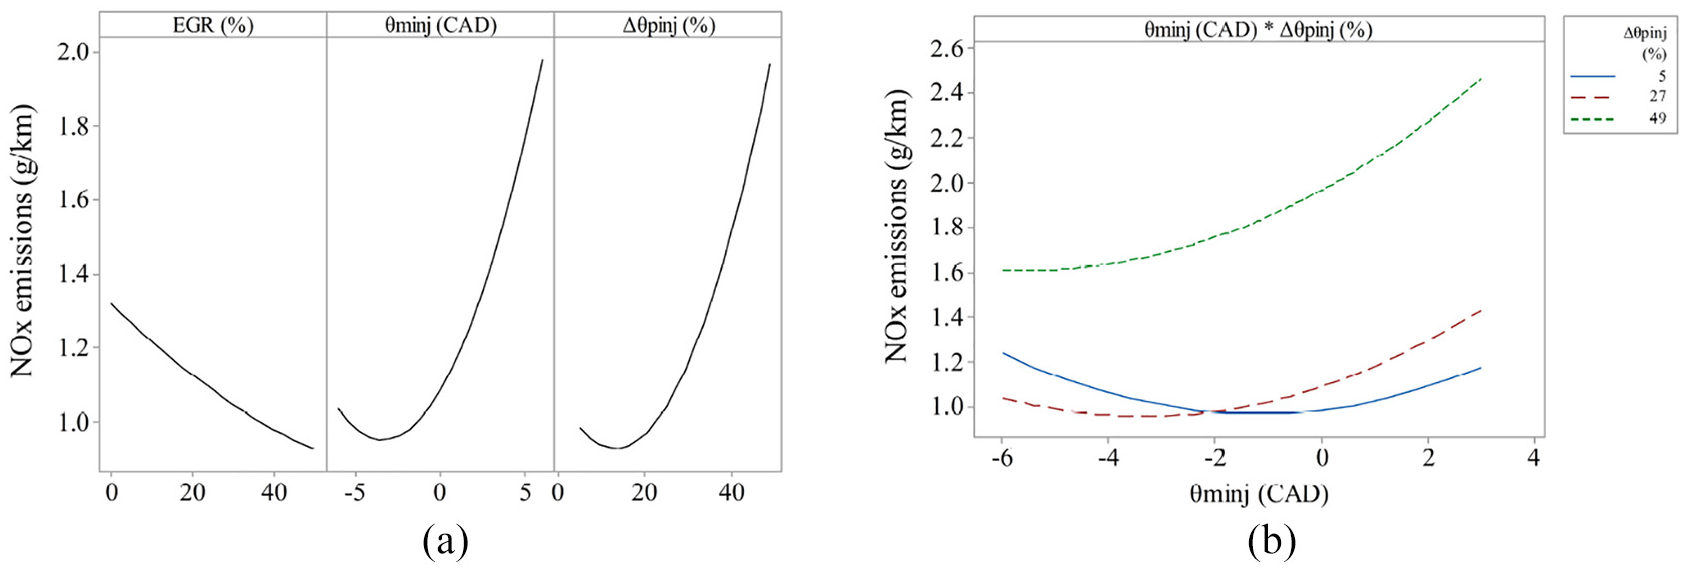
Response plots for experimental NOx emissions when engine operating conditions are varied. (a) Main effects plot for the experimental engine NOx emissions. (b) Interaction effects plot for the experimental engine NOx emissions.
When considering the effects of the changing engine parameters under investigation, NOx emissions decrease with an increase in EGR percentage. Figure 12 shows a time series plot for NOx emissions of test 2 and test 8, which have different EGR percentages with the WLTP drive cycle shown in dashed lines. Throughout the drive cycle, the NOx emissions generated by the test with an EGR of 37.5% is lower than the test with an EGR of 12.5%. The difference is more pronounced at lower drive cycle speeds. The effect of EGR percentage on NOx emissions are also deemed significant by the statistical model which is in line with the majority of research discussed.
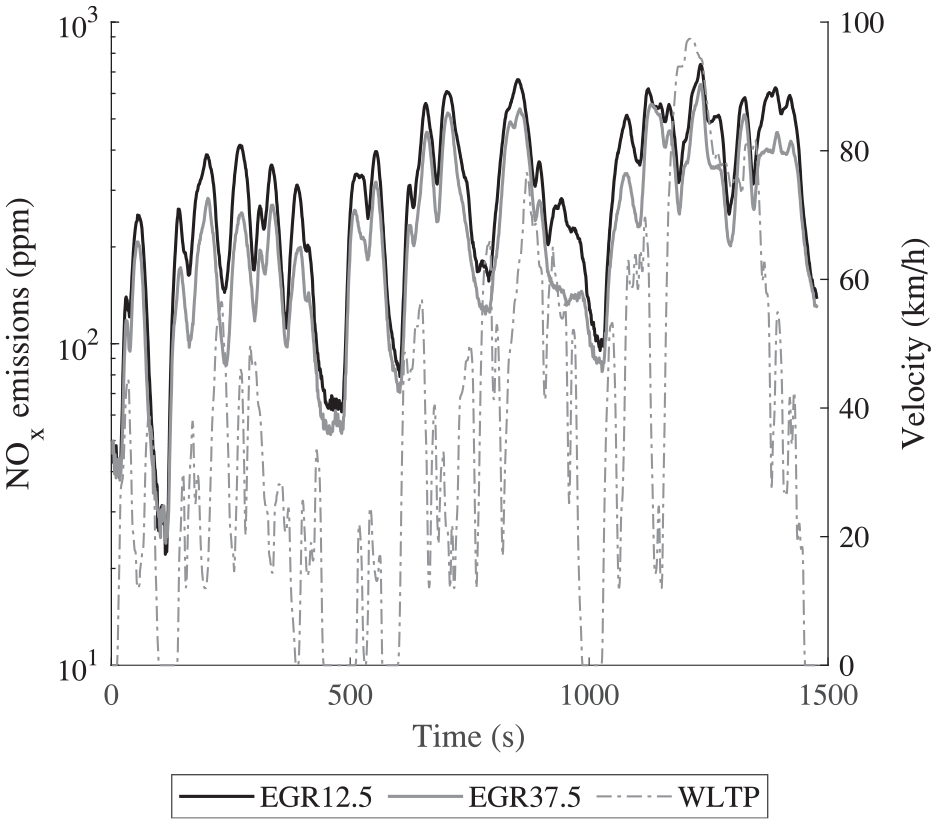
NOx emissions comparison with EGR at 12.5% and 37.5% (test 2 and 8).
The NOx emissions exhibit an increase when the main injection SOI is advanced and a minimum when retarding the main injection SOI map by approximately 3 CADs. Bohl et al. 33 investigated the effects of the main injection SOI on NOx emissions when using HVO fuel and concluded that the advanced injection causes the peak pressure to be closer to TDC and therefore cylinder temperature is increased.
The increase in pilot injection duration increases the NOx emissions. As more fuel is introduced through the pilot injection, a bigger proportion of the total fuel will burn in the premixed combustion event, thus increasing the combustion temperature as well as the NOx emissions.
The interaction effects between
PN/PM emissions
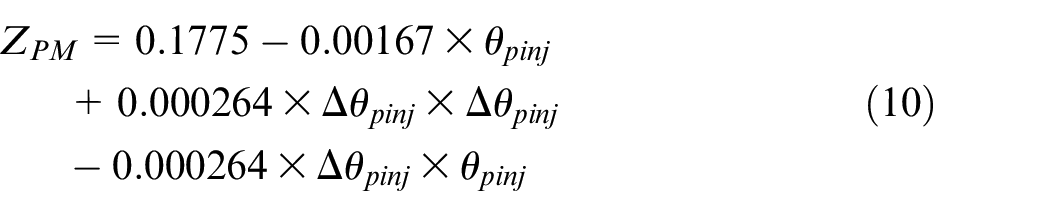
PN emissions and PM emissions are discussed jointly, as the voltage trap signal of the Pegasor M-sensor is converted by separate coefficients for PN and PM emissions. The quadratic models developed for the PN emissions and PM emissions as fitted based on the RSM design correspond to:
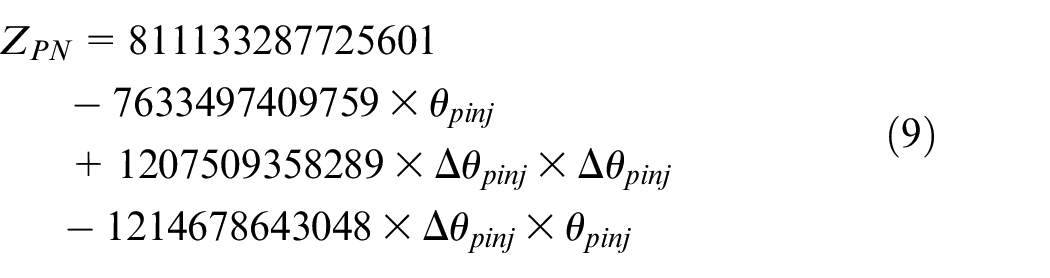
and
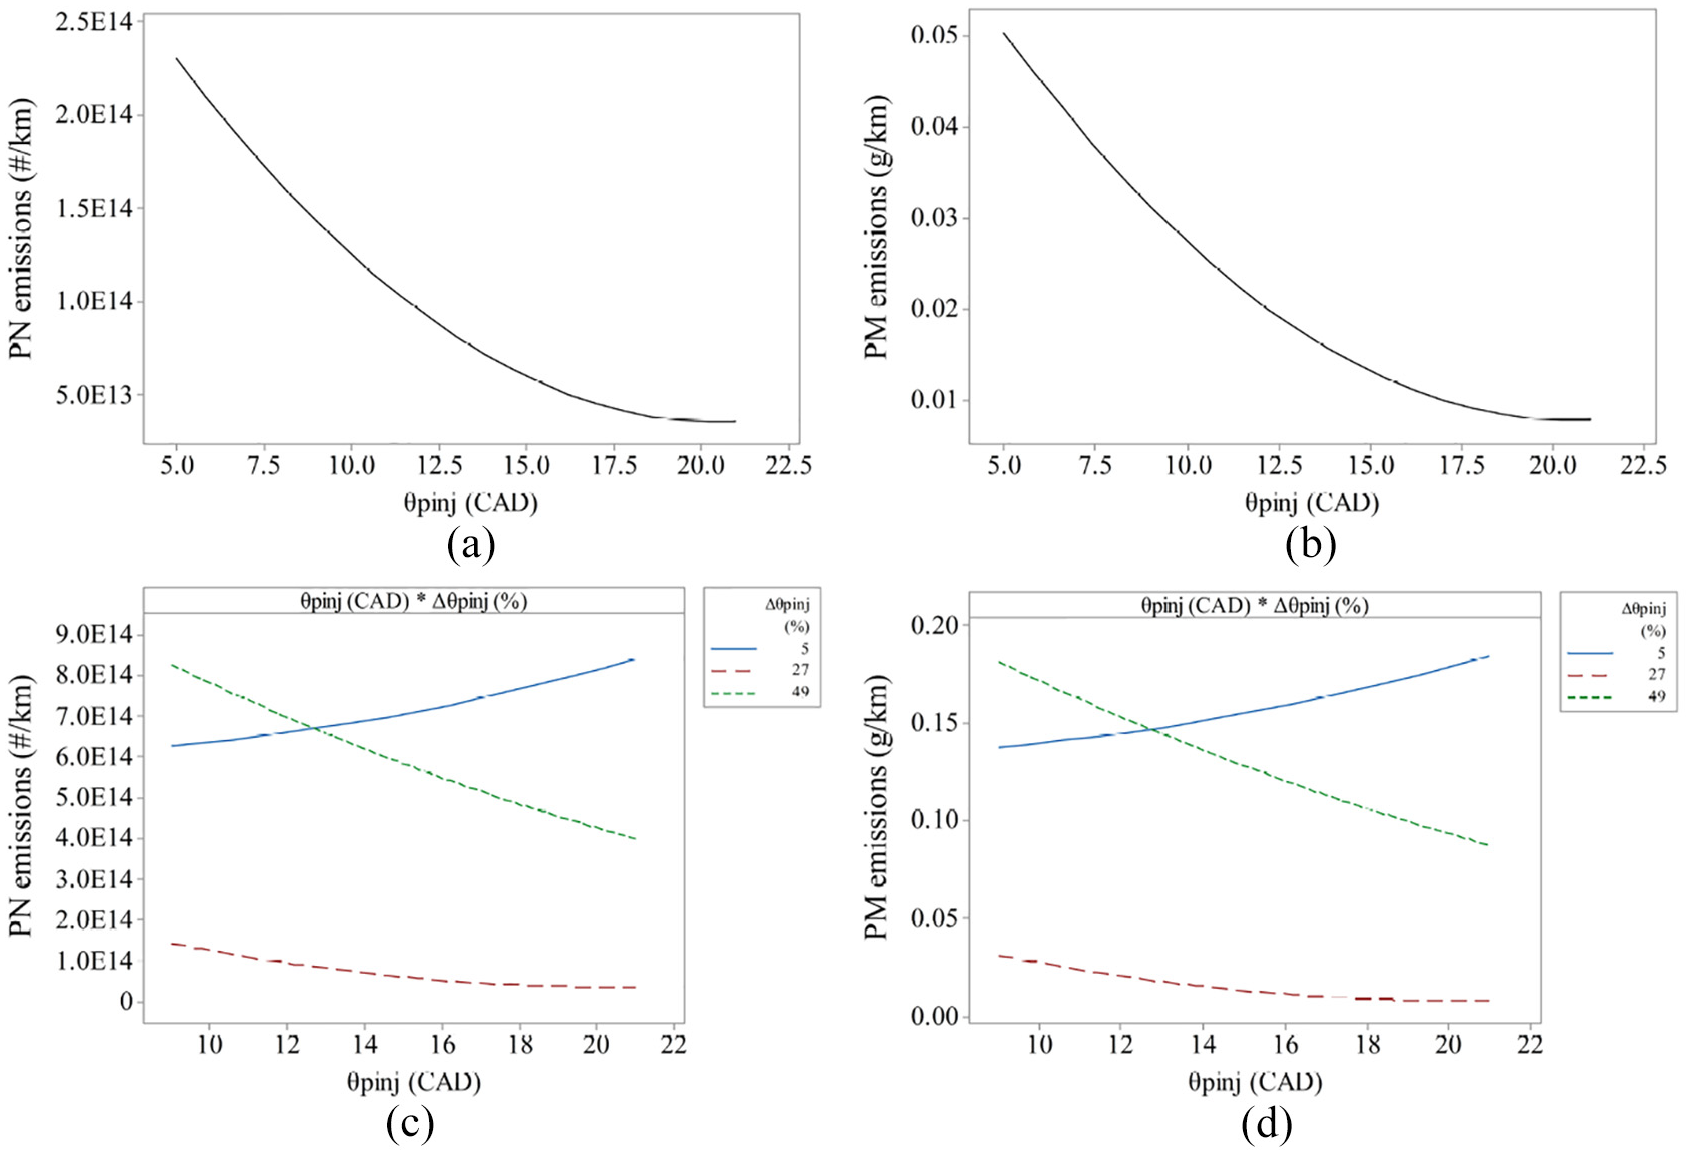
Main and interaction plots for PM/PN emissions when engine operating conditions are varied. (a) Main effects plot for engine PN emissions. (b) Main effects plot for engine PM emissions. (c) Interaction effects plot for engine PN emissions. (d) Interaction effects plot for engine PM emissions.
Optimising engine parameters
As there is more than one engine emission response to be optimised, it is necessary to set requirements for each response, that the optimisation tool will optimise towards. The desirability approach was used to minimise all engine out emissions. Figure 14 shows the desirability plot when minimising all engine emissions. The plotted lines are known as the prediction lines of the different engine emissions. The vertical solid lines for each variable is the current engine operating parameter setting. By changing the vertical solid line for each engine operating parameter, the horizontal dashed lines were updated by re-computing the predicted engine emissions for the new values of exhaust gas recirculation (EGR) percentage, main injection SOI (
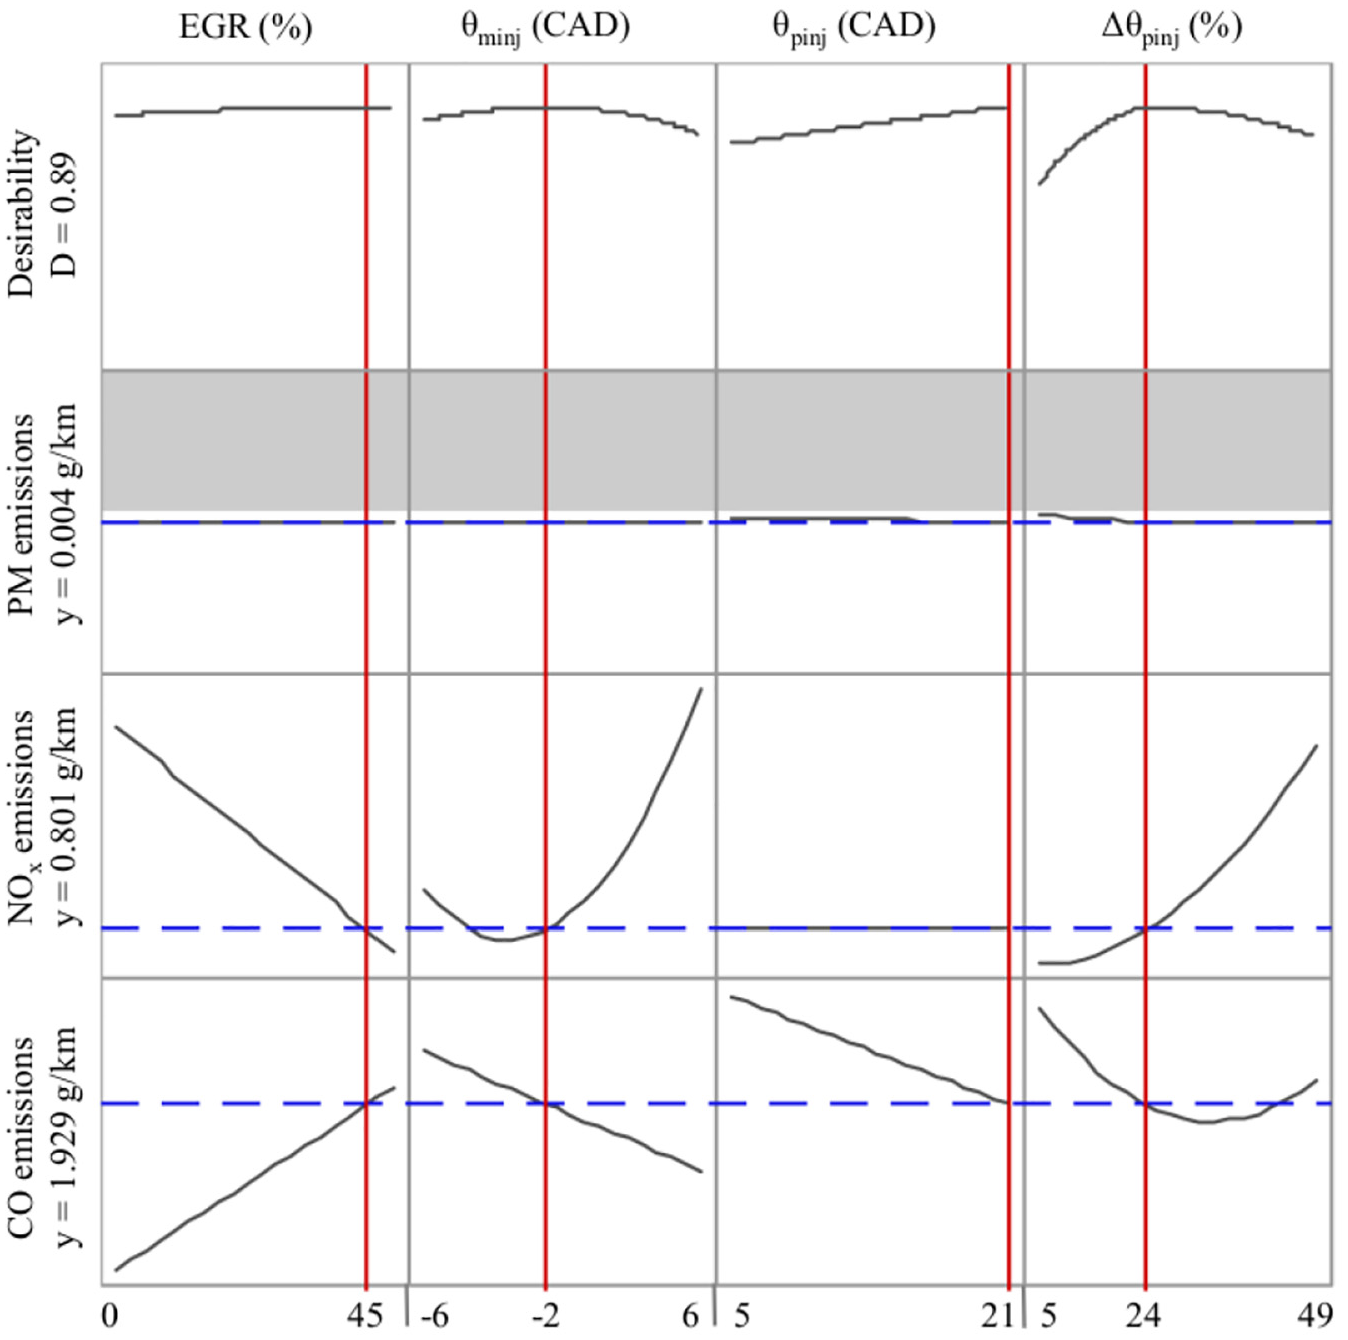
Optimisation plot for the engine emissions RSM.
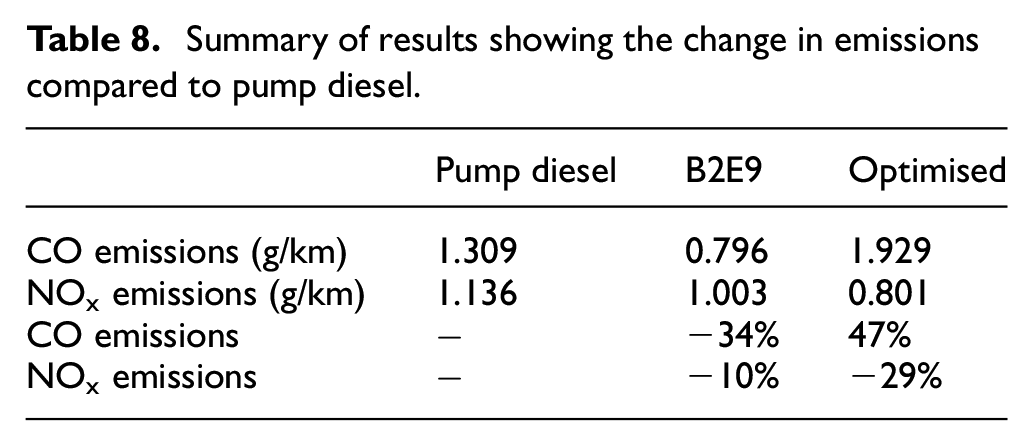
Summary of results showing the change in emissions compared to pump diesel.
Conclusion
This study investigated the effects of engine operating parameters on the emission characteristics of a compression ignition engine fuelled with a ternary blend, B2E9. The engine was tested over the World Harmonised Light vehicle Test Procedure (WLTP). Based on a RSM DoE, 30 runs were formulated which included 6 replicates of the center point to evaluate the reproducibility and the lack-of-fit of the derived models. The main conclusions are:
By using a statistical tool such as the RSM DoE during transient engine test conditions, this research demonstrated the ability to significantly reduce in-cylinder NOx emissions with the use of renewable fuel and optimised emission reduction strategies.
NOx emissions can be reduced by approximately 29% by using a maximum of 45% EGR, retarding the main injection SOI by 2 CADs, setting the dwell time of the pilot injection to 21 CADs and injecting 24% of the total fuel through the pilot injection.
Even though the fuel delivery was optimised to minimise all emissions, there was still an increase in CO emissions of approximately 47% compared to a vehicle running on pump diesel. This is due to the trade-off between NOx emissions and CO emissions.
EGR can be used to reduce NOx emissions by approximately 34% when the EGR percentage is increased from 0% to 50%. The opposite occurs for CO emissions, which increases by approximately 32% when EGR is increased to a maximum of 50%.
By advancing the main injection SOI, NOx emissions increase and CO emissions decrease as a result of the start of combustion occurring closer to TDC, thus increasing the combustion temperature and combustion pressure.
An increase of the dwell time of the pilot injection to approximately 21 CADs can decrease CO emissions by approximately 17%, as the increased dwell time promotes the mixing of the fuel and air which causes an increase in the premixed combustion phase. A more homogeneous mixture also promotes the particle oxidation process which reduces the total PM/PN emissions.
By injecting more fuel through the pilot injection a higher percentage of the fuel mixes with the air before combustion commences. This increases the portion of fuel being burned in the premixed combustion phase and increases combustion temperatures. As a result NOx emissions increase and CO emissions decrease.
This work demonstrated that the RSM DoE is a useful tool to quantify the effect of different engine operating parameters on the engine’s emissions response. It is also useful to determine the optimum operating configuration that will meet the researcher’s criteria.
Footnotes
Acknowledgements
The authors would like to thank the University of the West of England for the use of the laboratory equipment to conduct this research.
Declaration of conflicting interests
The author(s) declared no potential conflicts of interest with respect to the research, authorship, and/or publication of this article.
Funding
The author(s) received no financial support for the research, authorship, and/or publication of this article.