
Abstract
To isolate the effect of flame–wall interaction from representative operating conditions of an internal combustion engine, experiments were performed in a constant-volume pre-burn vessel. Three different wall geometries were studied at distances of 32.8, 38.2, and 46.2 mm from a single-hole 0.09-mm orifice diameter fuel injector. A flat wall provides a simplified case of flame–wall interaction. To mimic the division of a jet into two regions by the piston bowl rim in an engine, a two-dimensional confined wall is used. A third, axisymmetric confined wall geometry allows a second simplified comparison to numerical simulations in a Reynolds-averaged Navier–Stokes framework. As a limiting situation for a free jet, the distance from the injector orifice to the end wall of the chamber is 95 mm. Thermocouples installed in the end wall provided insights into local heat losses for reference cases without a wall insert. The test conditions were according to the Engine Combustion Network Spray A guidelines with an ambient temperature of 900 K and an ambient density of 22.8 kg/m3 with 15% O2. Flame structures were studied using high-speed OH* chemiluminescence with integrated single-shot OH PLIF and combined with pressure-based apparent heat release data to infer combustion progress and spray behavior. Soot was studied in a qualitative manner using high-speed natural luminosity imaging with integrated high-speed laser-induced incandescence. Overall, increased mixing upon interaction with the surfaces is observed to increase early heat release rate and to significantly reduce soot, with the nearest wall distance showing most effect. The flat wall gives rise to the most significant effects in all cases.
Keywords
Introduction
In a contemporary automotive-size compression-ignition engine with high-pressure diesel sprays, the interaction of a spray flame with the combustion chamber wall is inevitable. The piston bowl rim is typically targeted in internal combustion engines, which gives rise to a number of interesting opportunities for optimization of the piston design.1–6 In several of these options, the piston shape is adjusted such that the sprays are redirected with the intention to promote engine efficiency and to gain emission benefits. The fixed spray orientation of high-pressure fuel injection equipment complicates these optimization procedures, especially in combination with split injection strategies.7–10 For a piston design which divides the spray between the piston bowl and the squish region (e.g. the designs discussed by Busch et al. 2 ), injection strategy and timing have a significant influence on the amount of fuel that is dispersed into a specific region. For a piston design that redirects the sprays in a radial direction, the constraints on the injection window are more relaxed.5,6,11
While detailed experiments are crucial in understanding the processes of wall interaction and injection timing, computational fluid dynamics typically provides additional insights into some of the details at play. Furthermore, computer simulations are becoming increasingly comprehensive and reliable in terms of predictability, which can speed up the design process of new generations of internal combustion engines. 12 Ideally, the development of models for spray, engine combustion, and the full engine relies on experimental data acquired in a representative internal combustion engine. This way, physical system details are as close as possible to the environment that the models are simulating. However, the level of experimental detail required for in-depth understanding of the processes involved is difficult to achieve in realistic engines. For this purpose, dedicated constant-volume combustion vessels are more appropriate.
To provide optical access to a reacting fuel spray at ambient conditions representative of an internal combustion engine, several strategies exist. 13 In the case of studying flame–wall interaction, wall temperatures on the order of 500 K would be considered characteristic and realistic for an internal combustion engine operating range.14,15 Using a quartz piston to make an engine optically accessible has a significant impact on the heat transfer, due to the reduced thermal conductivity of the material, although this may be partially compensated for by operating the engine in skip-fire mode. 16 In case of a constant-pressure facility or hot chamber in which the temperatures are high for a long period of time, wall temperatures will approach the ambient gas temperatures, unless a cooling system actively reduces the temperature of a wall insert. However, when ambient conditions are achieved through the combustion of a pre-burn mixture, the wall insert temperature is only elevated above the quasi-steady value of the combustion vessel during the pre-burn event. Via the pre-burn peak temperature and the quasi-steady vessel temperature, some indirect control over the wall temperature can be exerted. Therefore, a constant-volume combustion chamber may be the most convenient test rig to study flame–wall interaction.
In a previous publication, flame–wall interaction was studied using a single hole large-orifice injector (0.205-mm diameter) with two different wall designs. 17 Apart from a simplified flat wall design, a second design was used that mimics the piston bowl rim which divides the spray between the piston bowl and the squish region. Rather than using a true piston segment, a symmetric design that neglects the curvature of the cylinder was used to provide a simplified geometry with optical access for model validation. From the apparent heat release rate (AHRR) analysis it followed that both wall designs increased the amount of heat released upon wall interaction compared to a free jet. The increased AHRR was sustained during injection, and the burn-out duration after the end of injection was shortened. In close collaboration with modeling efforts, it was shown how the increased AHRR for the wall-interaction cases was not the result of an increase in air entrainment. However, similar to an experimental study by Bruneaux, 18 it was noticed how the mixture homogeneity is significantly enhanced due to the wall interaction, which did facilitate an increased numerical AHRR. Although the two-dimensional (2D) confined wall in previous work was not studied numerically, 17 experimental results show that the flat wall has a bigger impact on the heat release.
Although simplified when compared to a realistic piston segment, the confined wall from the previous study does not allow for a fully axisymmetrical mesh in Reynolds-averaged Navier–Stokes (RANS) simulations. Therefore, a second confined wall is introduced in this study with the same curvature, but now fully axisymmetrical. The wall is therefore more similar to a full, conventional, re-entrant piston. 2 The difference here, however, is that the fuel jet is directed into the bowl, rather than onto the piston bowl rim. Once the spray interacts with the surface, it is dispersed in the radial direction, first moving away from the spray axis and then gradually redirected back toward the injector. Despite the fact that this does not have any physical relation to an internal combustion engine, it does provide the ability to simulate the spray with a wedge-shaped mesh that has a thickness on the order of the cell size.
Contrary to the large orifice (0.205 mm) used in the previous study, a more frequently studied 0.09-mm orifice injector is used in this work. 19 In addition to the three different wall shapes, three different distances between the wall and injector tip are tested. To study the interaction of the spray flame with the wall inserts, high-speed OH* chemiluminescence, single-shot OH PLIF, high-speed natural luminosity, high-speed laser-induced incandescence (LII), and pressure-derived AHRR were all recorded simultaneously. Naturally, the shape of the confined walls does not permit proper access of the laser sheet into the curved region.
Materials and methods
To study flame–wall interaction at boundary conditions representative of an internal combustion engine, an optically accessible constant-volume pre-burn vessel is used. 13 Target ambient conditions are achieved by burning a lean pre-mixed charge consisting of acetylene, argon, nitrogen, and oxygen. The pre-burn mixture is admitted to the vessel sequentially via an intake port located in one of the eight corner diagonals of the cubical vessel. The other diagonal ports contain an internal mixing fan, a high-speed pressure transducer, a pressure burst disk, automotive spark plugs, and the outlet valve. At the time the fuel is injected into the 1260-cc volume, the core temperature of the vessel is 900 K, with an ambient density of 22.8 kg/m3 and an oxygen percentage of 15%. Full details of the ambient boundary conditions correspond to the Engine Combustion Network (ECN) Spray A and are given in Table 1. 19 For every boundary condition, 10 experiments are conducted and all results in this work are based on ensemble-averaged data. The fuel injector is a solenoid-activated Bosch common rail unit with an orifice diameter of 0.09 mm and a k-factor of 1.5, installed in one of the four side ports. All other main ports of the setup can be fitted with metal blanks, fused-silica windows (deep ultraviolet (UV) transparency), or sapphire windows (high strength). Three fused-silica windows were installed for this experimental campaign; two windows to image the reacting fuel sprays from the sides, and an additional window in the top to provide laser access (Figure 3).
Details of the boundary conditions for this work.
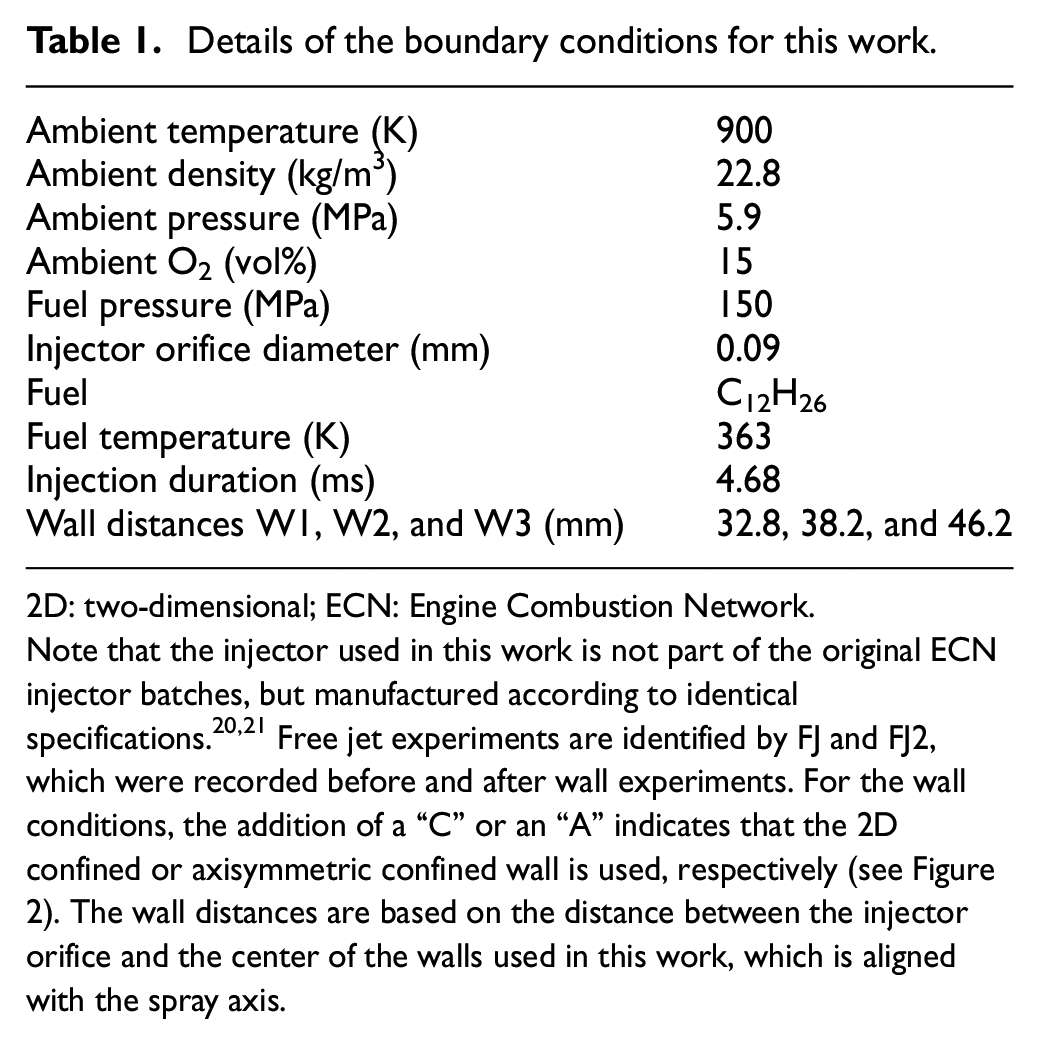
2D: two-dimensional; ECN: Engine Combustion Network.
Note that the injector used in this work is not part of the original ECN injector batches, but manufactured according to identical specifications.20,21 Free jet experiments are identified by FJ and FJ2, which were recorded before and after wall experiments. For the wall conditions, the addition of a “C” or an “A” indicates that the 2D confined or axisymmetric confined wall is used, respectively (see Figure 2). The wall distances are based on the distance between the injector orifice and the center of the walls used in this work, which is aligned with the spray axis.
The window opposite to the injector was used to mount the wall inserts or a metal blank containing thermocouples. The latter was used for free jet experiments without wall interaction, which were recorded before and after various wall interaction cases. The distance from the injector orifice to the end wall of the chamber is 95 mm. As even the Spray A flame will interact with the end wall at some point in time, the metal blank was fitted with internal 0.5-mm sheathed type-K thermocouples to measure the local temperature for a spray flame that does not impinge on a wall insert. Seven thermocouples were placed at different distances from the inner surface of the combustion vessel, as depicted in Figure 1. The most shallow thermocouple is at a distance of 1 mm from the vessel interior and placed in the center of the metal blank. Radially outward in opposite directions, three more thermocouples—separated by 2 mm—are placed at depths of 2, 3, and 4 mm from the inner surface.
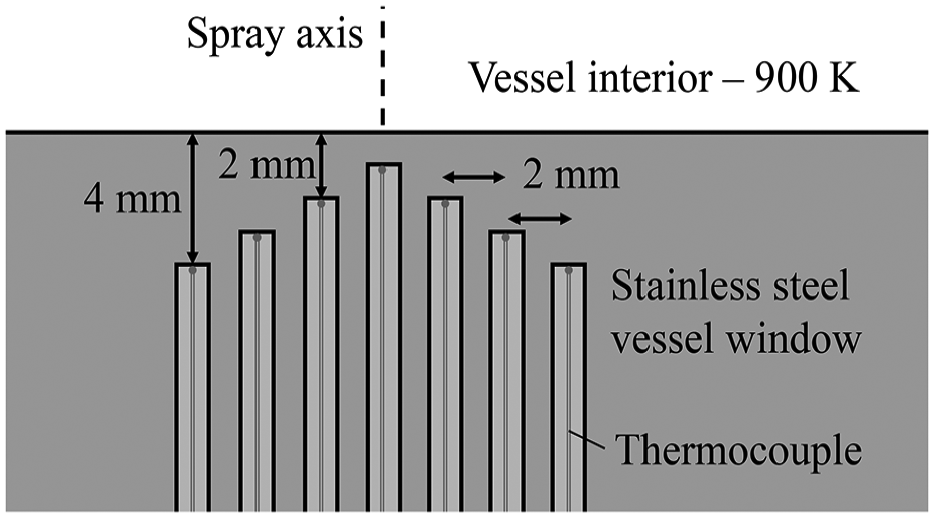
Schematic overview of the thermocouple window to measure the interaction of a free jet with the end wall of the combustion vessel. The spray approaches the window from the top in this overview. Several distances are indicated, see text for additional details.
Wall configurations
Three different stainless steel wall designs were used to study flame–wall interaction in this work. In a previous publication, it was found how the wall inserts did not affect the ratio between the bulk and the core temperature inside the combustion vessel. 17 The most simplified flame–wall interaction case is a circular flat wall design with a diameter of 50 mm, which is mounted on two support posts as depicted in the left-most panel of Figure 2. To mimic the interaction with the piston bowl rim where the fuel spray is partially directed into the piston bowl and partly toward the squish region, a smooth 2D confined extrusion is used. This confined wall will be indicated with a “C,” as mentioned in Table 1 and depicted in the central panel of Figure 2. By neglecting the curvature of the cylinder that a true piston segment has, the confined wall provides proper optical access for the diagnostic techniques which do not require orthogonal laser-light access. Note that this 2D confined wall requires at least a quarter segment simulation in an RANS framework. To provide an easier reference case for 2D numerical simulations, a third, fully axisymmetrical confined wall design was employed which is shown in the rightmost panel of Figure 2 and will be indicated with an “A.” In the direction of the curvature, the axisymmetric confined wall is identical to the 2D confined wall geometry. (That is, there is a cone in the center, not visible in Figure 2.)
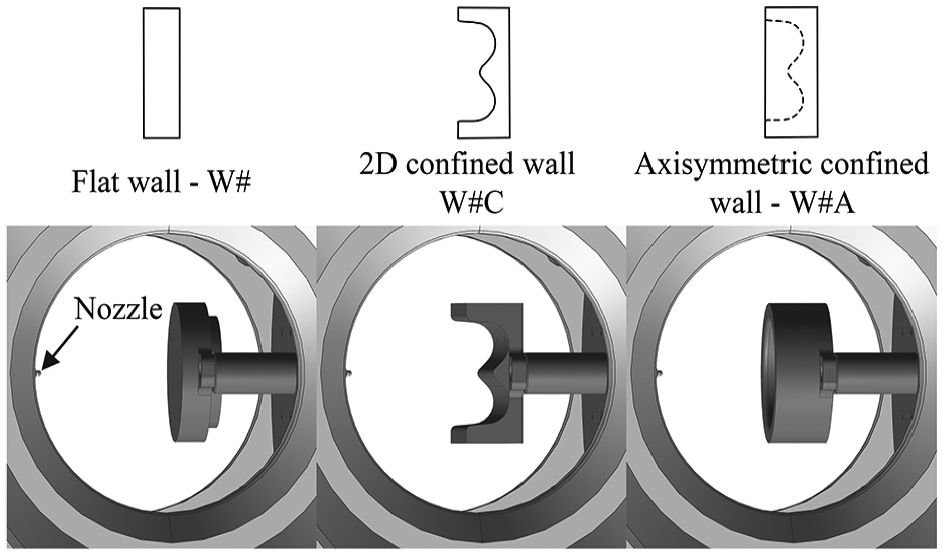
Comparison of the different wall shapes used in this work. From left to right: flat wall (W#), 2D confined wall (W#C), axisymmetric confined wall (W#A), where the number sign is an integer that indicates the wall distance.
All three walls have the same volume to maintain the inner volume of the vessel for all inserts, and all walls are mounted on the same posts. To change the distance between the wall and the injector nozzle, different posts—again with the same volume—are used to get the values listed in Table 1. These numbers refer to the distance between the injector orifice and the wall surface on the spray axis. For the 2D confined and axisymmetric confined walls, the spray can penetrate a little further into the confinement before it is redirected outward and back toward the injector. Liquid fuel impinging on the wall does not occur in any case, as the nearest wall distance is about three times larger than the liquid length for these conditions.19,22 Based on previous experiments with type-K thermocouples, the wall temperature is about 500 K (±25 K) at the time of fuel injection. 17
Pressure-based heat release
Pressure inside the pre-burn vessel was measured at a rate of 50 kHz using a Kistler 6041A piezoelectric pressure transducer placed in an upper corner near the injector. The pressure decay before and after the fuel injection is used to correct the signal such that the effect of the liquid fuel injection event is isolated. Furthermore, a correction is made for the local speed of sound in the vessel, using the flame-lift-off location as the ignition spot. 17 To smoothen the pressure signal prior to calculating the AHRR, a low-order filtering procedure is used. 23 Further reduction in the periodic ignition-induced pressure oscillations is done via additional low-order filtering after the initial pressure rise is detected.
Optical diagnostic techniques
A combination of optical diagnostic techniques was used to study flame–wall interaction and to complement the information inferred from the heat release analysis. In this study, high-speed OH* chemiluminescence combined with single-shot OH PLIF and high-speed LII combined with high-speed natural luminosity were applied and will be discussed below. A Helium–Neon (HeNe) laser at 632.8 nm passes through the setup, right in front of the injector nozzle tip at a distance on the order of a millimeter. This laser beam traverses the vessel diagonally, such that it does not interfere with cameras on either side of the vessel (Figure 3). The beam is focused at the location of the fuel spray, and light is collected through a 632.8-nm laser line filter (10 nm full width at half maximum (FWHM)) by a large-area silicon photodiode (Thorlabs SM1PD1B). The photodiode signal is amplified and logged by the high-speed data acquisition system at 50 kHz. When fuel is injected, the photodiode signal decreases by several volts due to light extinction, which is used to accurately determine the hydraulic injection duration.
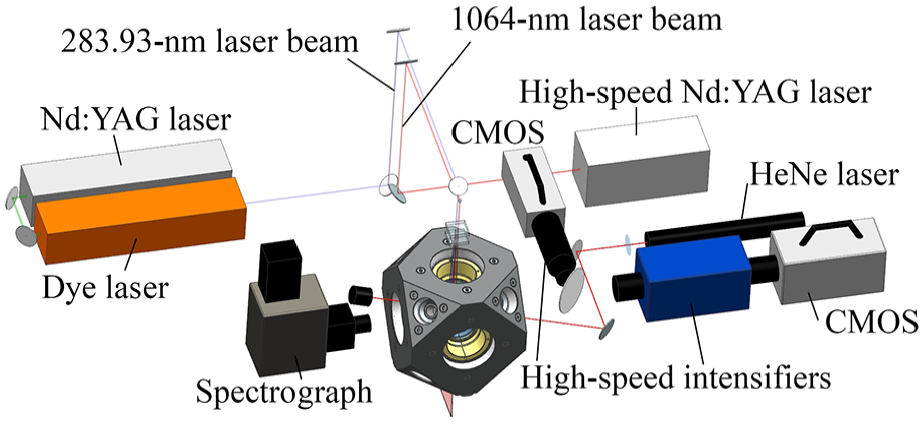
Schematic overview of the combustion vessel with the simultaneous recording of high-speed OH*, OH PLIF, and high-speed LII with natural luminosity (<450 nm). The HeNe extinction setup provided the hydraulic injection duration listed in Table 1, while results from the spectrographic imaging (similar to previous work) 17 are not included in this work.
High-speed OH* and single-shot OH PLIF
The high-temperature flame front was imaged using a high-speed CMOS camera (Photron SA-Z) lens coupled to a high-speed image intensifier (S20 photocathode, LaVision) equipped with a 100-mm UV objective (f/2, Bernhard Halle Nachfl.). The light was collected through a UV beam splitter with 70% transmission, and a Semrock filter pack consisting of a narrow-band filter and a second band-pass filter. The narrow-band filter is centered close to the OH* chemiluminescence emission peaks at 315 nm (20 nm FWHM), and the second band-pass filter at 300 nm (80 nm FWHM) is included to suppress soot incandescence. The chemiluminescence (polluted with soot) 17 signal was recorded at 20 kHz, using the full CMOS sensor size because of the flame–wall interaction. The intensified camera system was translated during the campaign such that the walls are imaged at the same location on the camera sensor for all the flame–wall interaction cases. A long exposure time of 49 µs was used in this work with low intensifier gain, to have a high-duty cycle. The reason for this approach is to have a 98% chance to include a 283.93-nm laser pulse from a Nd: YAG pumped dye-laser operated on Rhodamine 6G that probed the ground state OH radicals at exactly 1.5 ms after the start of injection. This chance is significantly lower with a short exposure time because the high-speed camera runs on its own internal clock as it is being triggered simultaneously with the injector driver. Using two cylindrical lenses, a light sheet of approximately 25 mm × 0.5 mm was created at the location of the spray. Off-resonant correction images such as those used in a previous study with an ICCD camera were not recorded, 24 and the images feature an increased background signal due to the long exposure. However, with the availability of the high-speed recording, images before and after the PLIF frame with similar background levels are averaged for a background correction in each individual image sequence.
High-speed LII and natural luminosity
High-speed LII was performed in a very similar way to the implementation used by Bakker et al. 25 A high-speed CMOS camera (Photron SA-X2) was operated at 20 kHz with the reflection off the UV beam splitter and a 450 nm short-wavelength pass filter. Light was collected through a 105 mm f/2.8 Nikon lens mounted on a high-speed image intensifier (GaAsP photocathode, Lambert HiCATT) with an exposure time of 25 ns. A diode-pumped solid-state Nd:YAG laser (Edgewave IS8I-E) was operated at 70 W and its fundamental wavelength of 1064 nm with a 5-kHz repetition rate. A laser sheet of approximately 25 mm × 0.5 mm was created using the same cylindrical lenses that are used for the OH PLIF laser beam, resulting in a fluence of 0.11 J/cm2. This is again similar to the values used by Bakker et al., 25 and more details can be found in their work. The high-speed LII laser beam passed right next to the UV prism that was used to direct the 283.93-nm laser beam through the lenses. Due to the 20-kHz repetition rate of the camera, there are always three consecutive images without LII. The total signal intensity of the images is integrated to get a signal which has an LII spike in every fourth frame. In post-processing, these spikes are identified and a reference intensity based on the average between the preceding and subsequent frame is calculated. Using this reference, a total natural luminosity profile as a function of time can be created (similar to what a photodiode would record). In addition, this natural luminosity profile can be used to calculate the time-dependent net total LII signal. The purpose of the LII and natural luminosity experiments in this work is mainly to illustrate the efficacy of flame–wall interaction to reduce the amount of soot in these particular spray flames, which is expected based on the results by Pickett and López. 26 For the LII system, the camera was not translated like the OH* chemiluminescence system. Because of the relatively large diameter of the wall insert, some vignetting of the field of view close to the wall surface could not be avoided. Based on the working distance of about 50 cm and the 105-mm (f/2.8) lens used, we expect vignetting to be hardly noticeable for the largest wall distance (W3, 46.2 mm). For the smallest wall distance (W1, 32.8 mm), the wall was in the center of the image, which resulted in some vignetting of the image parts closer than 1 mm to the wall surface. Based on these numbers, it is unlikely that this changes the qualitative trends observed from LII and natural luminosity results.
Results and discussion
The results of this flame–wall interaction investigation are presented in three parts. First, the pressure-based heat release rate is analyzed, and thermocouple measurements are used to explain some of the spray behavior. Next, flame structures of all different wall interaction cases are discussed, based on high-speed OH* chemiluminescence data and single-shot OH PLIF images. Finally, the efficacy of reducing soot using flame–wall interaction is demonstrated.
Heat release analysis
The ensemble-averaged heat release analysis results are presented in Figure 4 for the two free jet cases (FJ and FJ2) and all different wall cases. Different colors correspond to different distances between the wall and the injector orifice, while the black and gray lines represent the free jet experiments before and after the wall studies, respectively. Since the results from the free jet experiments before and after the wall studies should be the same, they can be regarded as a measure for the spread of the lines in this figure. The shaded area represents a 95% confidence interval for the second free jet case (based on at least 10 experiments). Some uncertainties remain and are acknowledged, but the similarity during ignition and just before the first wall contact warrant the following analysis. The solid, dashed, and dotted line styles correspond to the flat wall, 2D confined wall, and axisymmetric confined wall, respectively. Similar to the analysis performed with a 0.205-mm orifice injector in a previous study, the first observation from Figure 4 is that the AHRR curves of the flat wall experiments start to increase as soon as the flame interacts with the wall. The moment of wall contact—derived from the high-speed OH* movies—is indicated for the different wall distances in their corresponding color with a vertical dashed line in Figure 4. With respect to the steeper AHRR rise directly after wall contact, again the flat wall shows the most significant change compared to the free jet. The 2D confined wall and the axisymmetric confined wall show very similar AHRR behavior until about 1.5 ms after Start of Injection (SOI). Contrary to the heat release rate results from the 0.205-mm orifice injector in previous work, 17 the 0.09-mm injector results with a free jet show the highest quasi-steady AHRR values. With an AHRR difference between free jets and wall-impinging cases that approaches 10% for the 0.09-mm injector, the effect is quite significant. In that study, it was shown how enhanced mixing resulting from the wall interaction improves the heat release rate during the lifetime of the reacting fuel spray.
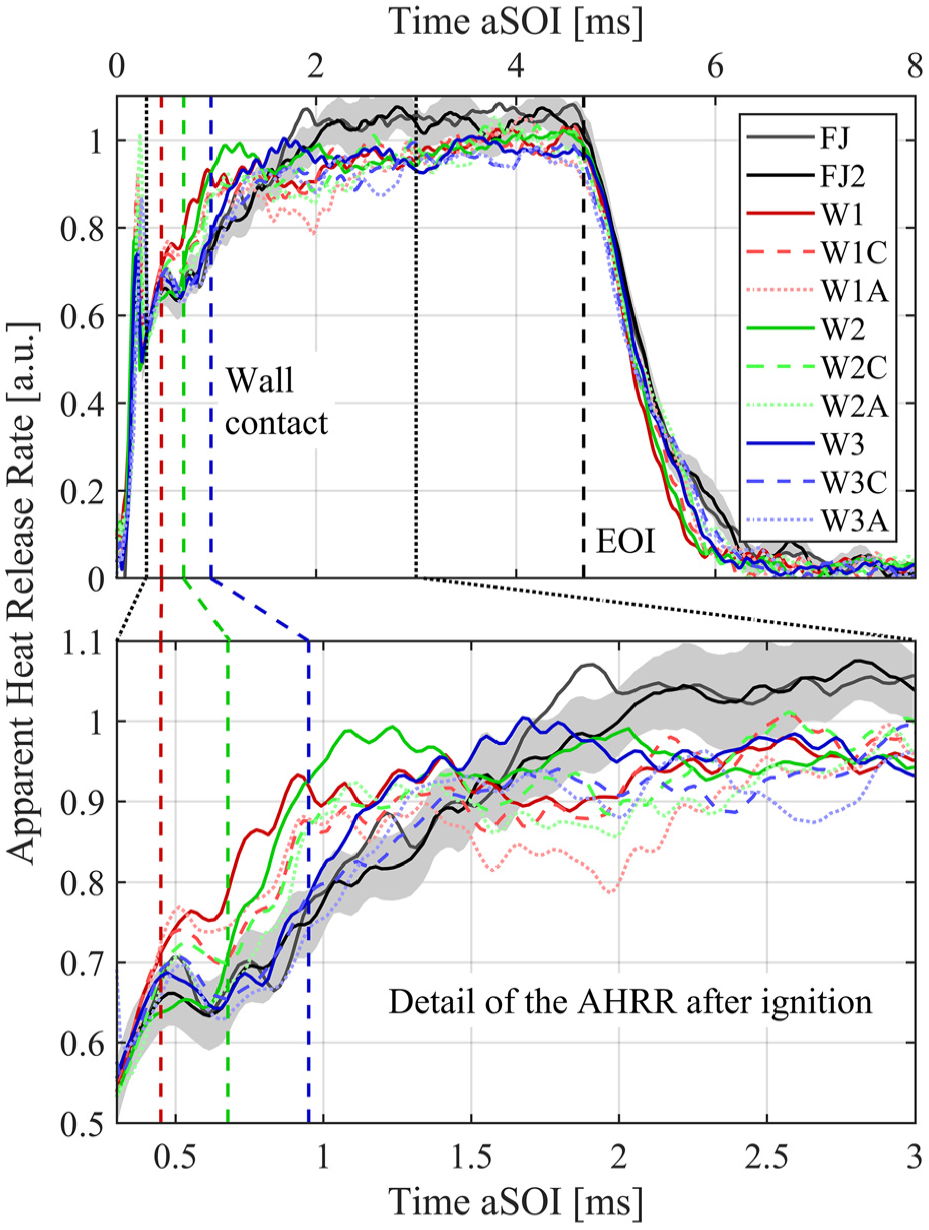
Filtered apparent heat release rate traces for the two free jet data sets and all flame–wall cases.
The heat release rate of free jets and wall-impinging jets are hypothesized to be depending on the following processes:
Heat release rate may increase due to better mixing when jet–wall interactions take place.
Entrainment effects may decrease the heat release when the jet starts to interact with or is confined by the wall. In contrast, air entrainment will increase as soon as the jet leaves the wall again.
Owing to the high-temperature flame and a relatively cool wall, heat will dissipate into the wall, effectively increasing the wall temperature.
Similar to the previous point, the flame may quench due to the flame–wall interaction, resulting in unburnt hydrocarbons and a lower AHRR.
When the free jet reaches the end of the setup, it will interact with the end wall where heat can dissipate into the stainless steel window blank.
Important for the heat dissipation into the end wall of the setup is that this heat is essentially “lost” from the system. This gives rise to a lower apparent combustion efficiency when evaluating the energy balance with the amount of injected fuel. In this case, the fitting procedure that uses the global cool-down behavior of the combustion vessel after the pre-burn does not pick up the local heat dissipation effect of the aforementioned point (5), as the energy may leave the system in a brief period of time at that location. In contrast, the heat that dissipates into the wall inserts due to flame–wall interaction can only exchange heat with the ambient and may therefore be picked up by the cool-down behavior of the combustion vessel after fuel injection.
In the time frame between approximately 1.5 and 3 ms of Figure 4, the axisymmetric confined wall shows a generally lower AHRR, although the uncertainty based on the confidence intervals is relatively high at this time. The reduced AHRR in this time frame is the most obvious for the W1A line at first, and then for the W3A curve when approaching 3 ms. In all cases, the decrease first occurs around the time that the jet is approximately half-way through the bowl shape. Once the head of the jet leaves the bowl, the AHRR starts to recover again. Since the injection mass flow is constant throughout these processes, a decrease in heat release rate can most likely be ascribed to flame quenching (extinction) and/or heat dissipation into the wall. Compared to a 2D confined wall, a larger area is covered by the flame due to the additional axisymmetry, which potentially reduces velocities to the extent that mixing is degraded, despite the initially higher AHRR.
Because of the accurately determined injection duration from the HeNe extinction measurements, it is revealed how the heat release rate starts to decrease right before the End of Injection (EOI), which is in accordance with a quickly decreasing mass flow when the injector needle starts to close. After the end of injection, the burn-out duration of the wall interaction cases is shorter compared to the free jet cases. The flat wall case with the shortest distance to the nozzle (W1, 32.8 mm) has the shortest burn-out, which can be attributed to enhanced mixing and/or flame quenching at the wall. The second flat wall distance (W2, 38.2 mm), first confined wall (W1C), and third flat wall (W3, 46.2 mm) follow shortly after the W1 case. As the quasi-steady heat release rate right before the EOI is similar for the different walls and wall distances, the contribution of various processes to the quasi-steady heat release and burn-out phase can be assessed. It is reasoned here that mixing and air entrainment do not influence the AHRR in the quasi-steady phase; even if mixing and entrainment take more time, the heat will be released at some point. Therefore, heat loss to the wall and flame quenching must be similar for all the flame–wall interaction cases in the quasi-steady phase. Interaction with a vessel wall is presumably negligible as well, as the spray velocities are reduced when it is redirected and radially redistributed. Furthermore, the distance to the end wall is increased in these cases as the spray is redirected inside the vessel, while the flame has a finite length. This means that only flame quenching and heat dissipation into the wall insert are significant in the quasi-steady phase, and responsible for the 5%–10% difference in heat release between the free jet baseline and wall interaction cases. If interaction with the end wall is increased for the free jet, heat release will decrease, which is expected to be the case with the experiments presented in a previous publication with a 0.205-mm injector nozzle. 17 Coupling these observations to the faster burn-out at the shortest wall distance indicates that enhanced mixing is still the primary explanation for the differences observed after the end of injection. This is because it is unlikely that the similarity in heat loss to the wall and flame quenching are suddenly changing after the end of injection. The slight but steady increase in AHRR between 2 ms after SOI and the EOI may then be caused by a small wall temperature increase, reducing the heat losses to the insert and quenching effects over time.
To confirm the aforementioned hypothesis (5), dedicated temperature measurements were carried out with the free jet experiments in this study. In addition to the 0.09-mm injector, pre-burn events without subsequent fuel injection and a number of reference experiments with a 0.205-mm orifice diameter injector used in a previous study were performed. Using a large orifice injector increases the flame size, and therefore the interaction with the end wall. For the pre-burn events that are not followed by a fuel spray, the global heat loss to the wall is responsible for a gradual temperature increase. As described in section “Materials and methods” (Figure 1), thermocouples were placed at different distances from the spray axis, and at different depths, which is reflected with the colored numbers in the top of Figure 5. The time axis in this figure corresponds to the time of a full pre-burn and cool-down event, which is initiated with a spark at t = 0. Approximately 1.93 s after ignition, the ambient core temperature of 900 K is reached and fuel is injected. It takes about 5.5 ms for the free jet flame to reach the wall, and between 40 and 60 ms before thermocouple 4, placed on the spray axis and the closest to the inner vessel boundary (2 mm from the surface), notices a temperature increase. For the large orifice injector, it takes only 2 ms to reach the end wall, but such differences are hard to notice on this time scale.
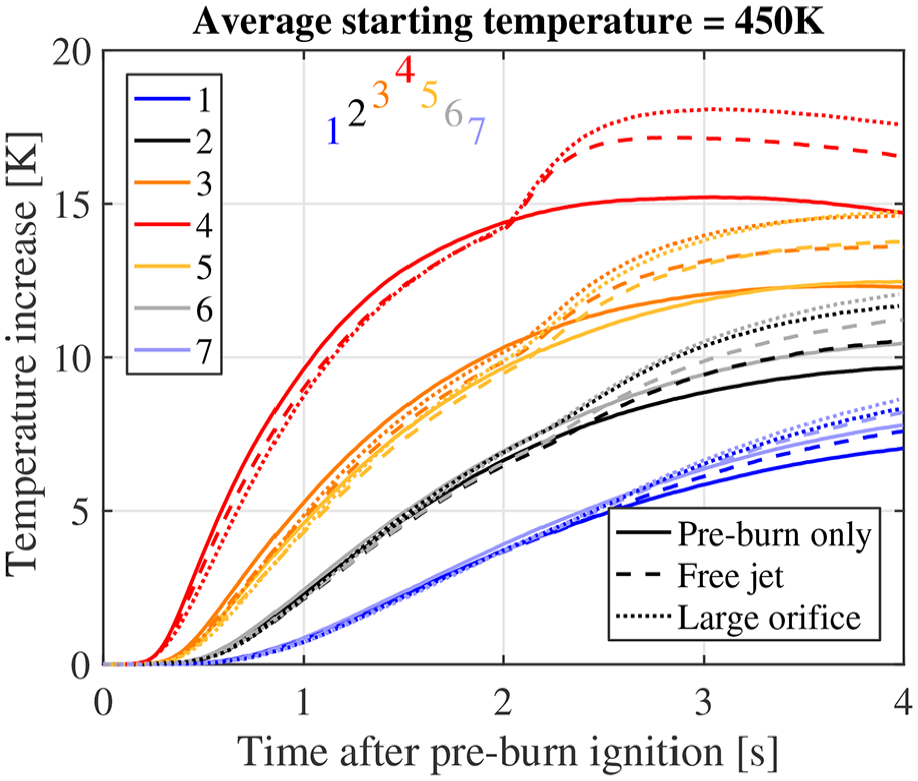
Temperature increase due to the “free jet” interaction with the end wall of the combustion vessel. For these experiments, fuel is injected around 1.93 ms SOI for the free jet experiments, which is right before the temperature increase measured by thermocouple 4.
The vessel has a temperature stratification with higher ambient temperatures in the upper part of the chamber due to buoyancy effects. Thermocouples 3 and 5, 2 and 6, and 1 and 7 have a very similar behavior in this case; however, since the thermocouple window was aligned such that all measurement points were aligned in the horizontal plane. The fact that thermocouple 4 shows the highest temperature increase—approximately 2° for the 0.09-mm injector—is expected to be primarily caused by the shallowest thermocouple location. This is since the thermocouples are separated by a relatively short distance in the radial direction (2 mm), while the core of the jet may actually be a bit cooler compared to the periphery once the flame has established contact with the wall. For the 0.205-mm injector, the injection duration was 1 ms shorter than for the 0.09-mm injector. With an injected mass of 49 mg (compared to 12.7 mg for the 0.09-mm injector), the temperature rise is approximately 1° higher. This shows that the increased amount of fuel, and flame size, results in more local heat loss from the system and may therefore cause relatively reduced quasi-steady heat release rate.
To ensure that the measured temperature increase after injection is not the effect of a global temperature increase caused by the fuel injection process, reference experiments were carried out as well. Although not shown here, in this case the thermocouple-instrumented window was placed in the upper access port of the combustion vessel. Pre-burn events with and without fuel injections proved that the global temperature was not responsible for the temperature increase shown in Figure 5, as the curves nearly coincided. Therefore, the heat that leaves the system via the window opposite to the injector needs to be incorporated when assessing quantitative heat release values.
Flame structures in wall-interaction experiments
Flame development of free jet experiments and wall-interaction cases was studied with high-speed OH* chemiluminescence recordings and single-shot OH PLIF experiments. Note that, based on the spectral analysis described in a previous study, the signal downstream of 40 mm from the injector orifice for a free Spray A flame is mainly ascribed to soot luminosity. 17 For the wall interaction data discussed here, this means that the signal at the wall is expected to be primarily originating from incandescence.
For the 2D confined and axisymmetric confined wall inserts, the flame is gradually redirected and it stays completely within the field of view of the camera. Based on the high-speed image sequences, all the studied cases have a fully quasi-steady phase between 4 and 4.5 ms after SOI. In Figure 6, ensemble-averaged results for all the wall-interaction cases are shown, based on a time-average between 4 and 4.5 ms after SOI. The left column in this figure corresponds to the flat wall, the central column shows the 2D confined wall results, and the right column contains the axisymmetric confined wall data. From top to bottom, the wall distance on the spray axis location increases from 32.8 to 38.2 mm and to 46.2 mm. All images have the same false-color scale, which shows from the nearly identical lift-off region representation in the left- and central panels.
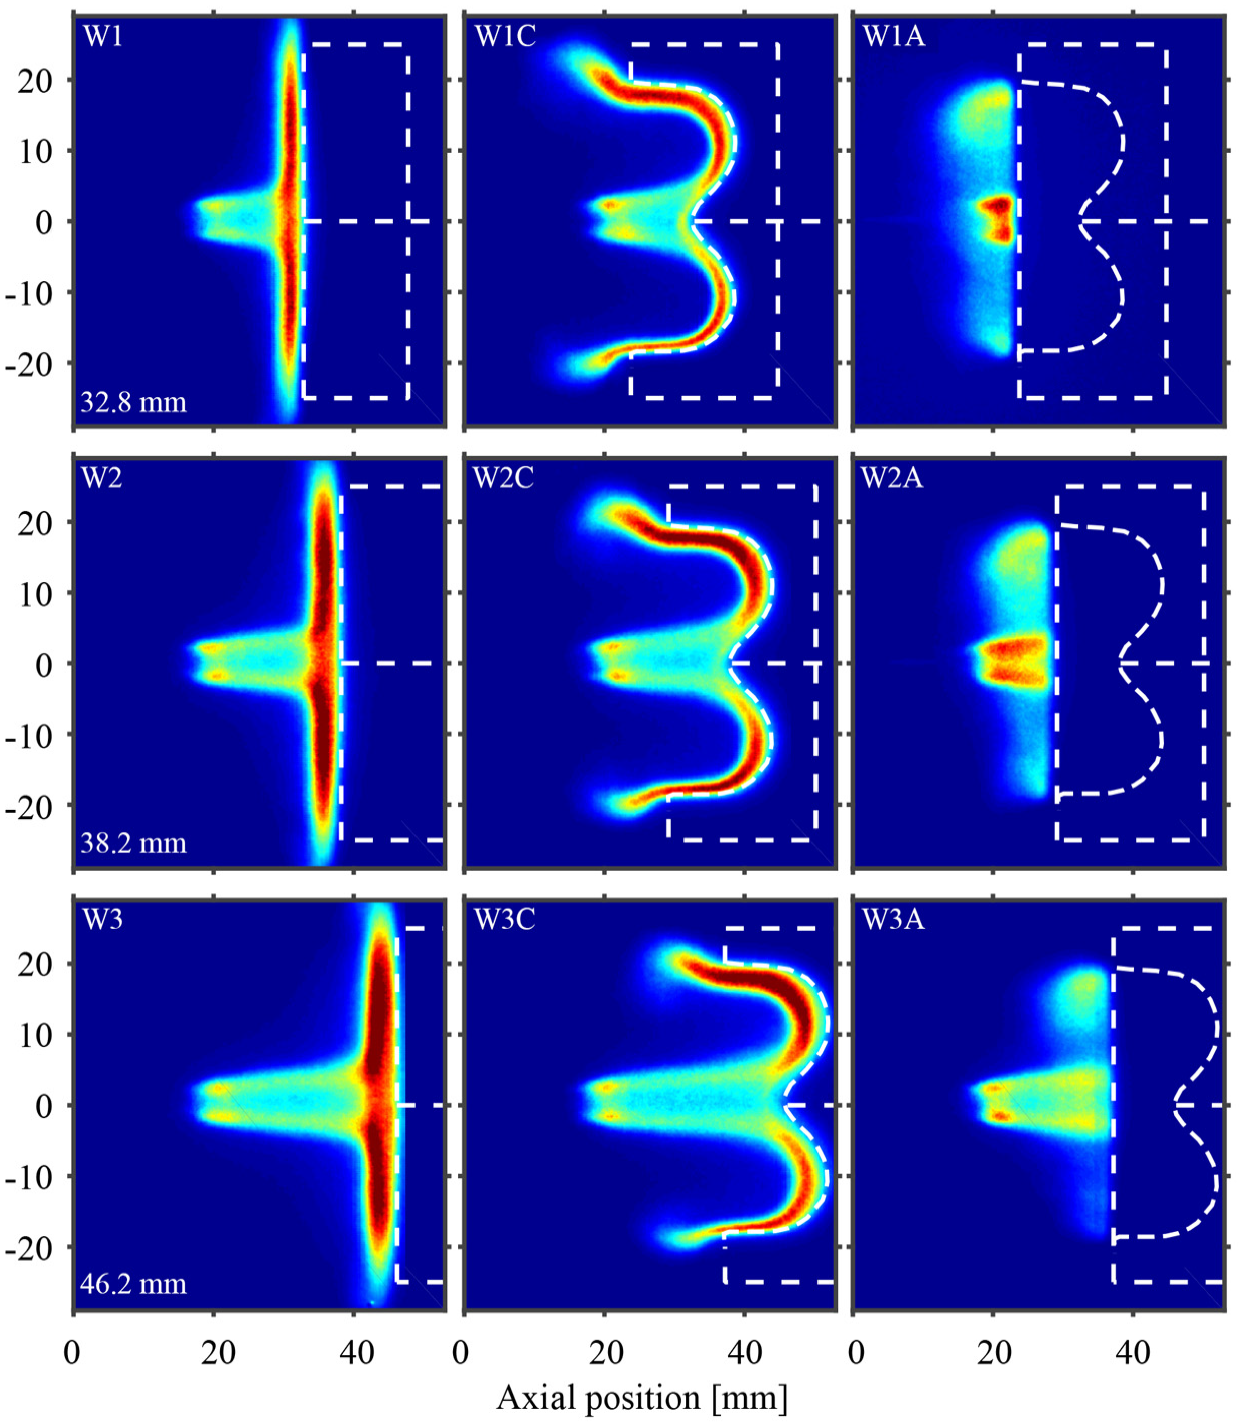
Ensemble-averaged OH* results for all wall-interaction cases in a false-color scale, time-averaged in the quasi-steady phase between 4 and 4.5 ms after SOI. The straight outlines of different wall inserts are indicated by dashed lines. In addition, the location on the spray axis where the flame will first impinge on the wall is similarly indicated as well to guide the eye, especially in the axisymmetric confined wall case.
When moving the flat wall further away from the injector orifice, it is observed how the maximum intensity and the thickness of the flame at the wall increase. It is expected that the flame thickness at the wall is larger when the jet is further developed and therefore has a larger radial width initially. However, the thickness does not seem to expand further after impinging on the insert. Moreover, all three jets have a flame length that does not extend far beyond the wall at a radial distance of 25 mm. This means that the total flame length of the case with the furthest wall position is about 13 mm longer overall. Based on Figure 4, there is no significant difference in AHRR between these three wall distances in the quasi-steady phase, while the total flame area is significantly smaller in the W1 case. Therefore, it is expected that the shorter wall distance improves fuel–air mixing more than the two other cases, which would potentially reduce the flame area and net soot production, corroborating previous observations based on the AHRR.
Most of the flame structure features at a flat wall remain when using the 2D confined shape. Again, the flame length, thickness at the wall, and the observed signal strength increase with the distance between the injector orifice and the impingement surface. For this wall shape, the jet is preferentially directed upward and downward rather than being distributed over all directions. The flame manages to travel further from the end of the 2D confined wall shape compared to the flat surface, and the signal strength is lower at the location where the jet first impinges on the wall because of the reduced line-of-sight integration. Interaction between combustion products and the lift-off is negligible, judging from the large area with low signal strength in between these regions. Furthermore, the lift-off location stays the same for all the wall-interaction cases. The fact that the upper part of the spray is always brighter may be related to buoyancy, but it might as well be the result of a small misalignment of the spray axis with the wall insert.
The axisymmetric confined wall obscures most of the signal that would otherwise be detected by the high-speed intensified camera, but some conclusions can still be drawn based on the limited field-of-view and trends described earlier. As the curvature is identical to the 2D confined wall—but now with a jet that is allowed to travel in all radial directions similar to that of the flat wall—similar behavior is expected. The most obvious feature in these images is a much higher intensity at the lift-off location, especially for the shortest wall distances. From the 2D confined wall panels, it is argued how interaction of combustion products with the lift-off region is unlikely because of the distance. In this case, the fully symmetric shape does guide the flame into the direction of the camera as well, meaning that some of the signal is captured because of the line-of-sight. Indeed, the bottom right image shows that the region between 30 and 37 mm from the injector orifice is now brighter compared to that region in the other two wall-interaction cases at 46.2 mm, because of the line-of-sight integration. Again similar are the distances traveled by the flame after detaching from the wall surface irrespective of the wall distance, and the observation that the upper part of the flame is brighter.
The single-shot OH PLIF results that are extracted from the high-speed OH* movies, 1.5 ms after SOI are shown in the left panels of Figure 7. White triangles in the top of each panel show the extent of the laser light sheet. For the wall interaction cases, a dashed line represents the wall location. The right panels show the average of OH* chemiluminescence results between 1.45 and 1.55 ms after SOI, which is what was used to subtract the background in the OH PLIF results in the left panels. OH PLIF boundaries corresponding to 2.5% of the maximum signal are shown with a white contour in the right panels to illustrate the relationship between chemically excited OH* radicals and OH in the electronic ground state. The results here agree with those of a joint ECN study and several features can be recognized. 24 In all OH PLIF panels, the signal strength is higher in the upper part of the spray, caused by the laser light attenuation of the spray when the laser approaches from the top. Signal is primarily found at the periphery of the jet, as the spray core is presumably too rich and too cold to reach high-temperature combustion. When comparing the OH PLIF signal with the OH* results in the right panels, it shows how OH is found at an increasingly greater radial distance from the spray axis when moving downstream. This feature seems to persist as the flame moves along the wall. As combustion progresses, water vapor is formed, and OH ground state radicals may be produced by the thermal dissociation of water at these locations. In addition to this, the lifetime of OH is larger than that of OH*, while both start to be formed at the flame front. 24 From the OH PLIF results with flame–wall interaction, a vortex structure seems to be visible in the upper part of the panels, which is not directly observable from the line-of-sight OH* images.
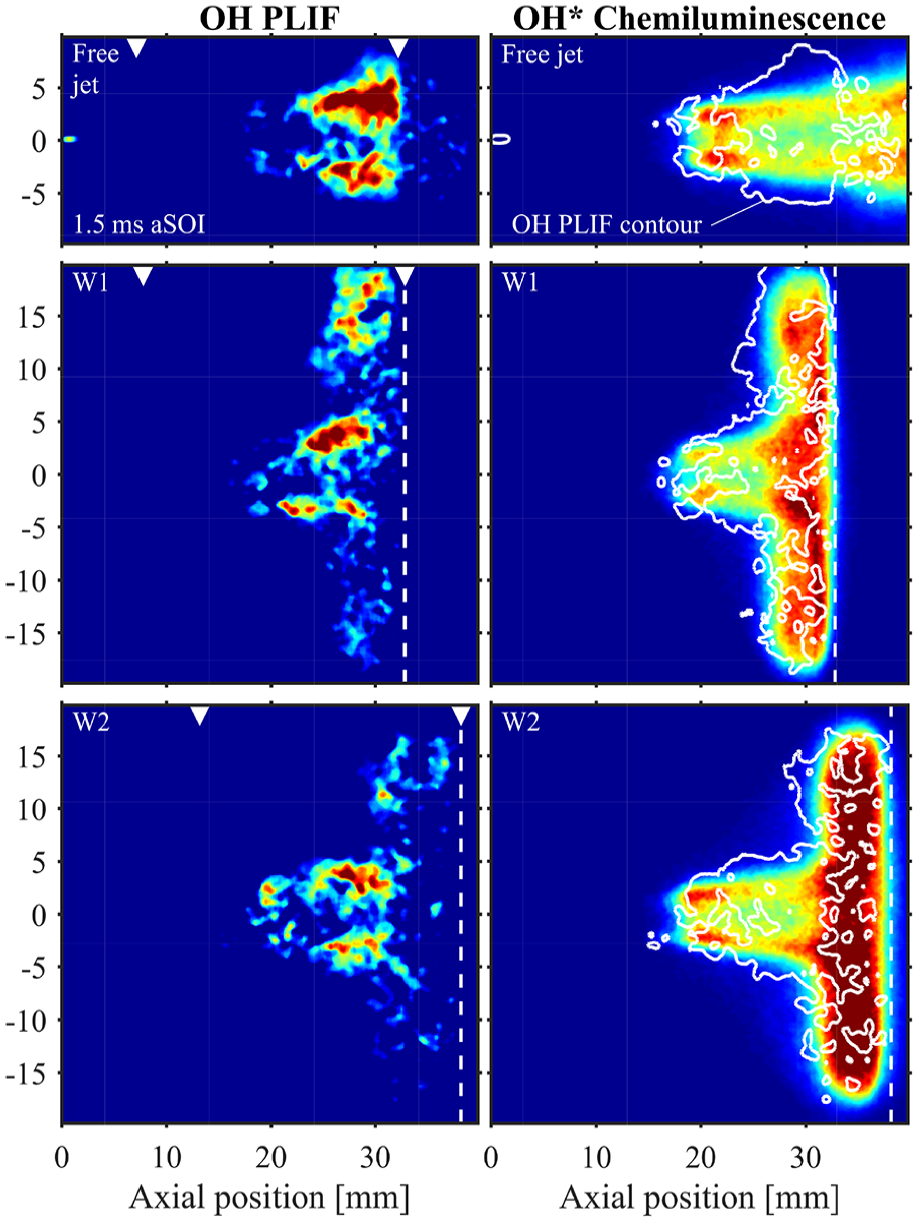
OH LIF (left) and OH * results with a white PLIF-contour (right) compared for the free jet experiments, and two-out-of-three flat wall cases. The OH PLIF contours are based on a 2.5% threshold of the maximum signal, and all results are acquired around 1.5 ms after SOI.
Soot trends in wall-interaction experiments
The total natural luminosity trends of all cases studied in this work are shown in the top panel of Figure 8. Despite the 450-nm short-wavelength pass filter, it is expected that the signal shown here at least correlates with the amount of soot.27,28 Although different in absolute magnitude, the two free jet curves show very similar behavior and the highest overall signal strength. Note once more that the axisymmetrical confined wall cases do not provide optical access to the bowl region, meaning that a large part of the spray is not visible to the high-speed camera. This explains why the signal strength stays low until the most heavily sooting part of the spray reappears from the bowl, which is observed for W1A, W2A, and W3A between 2 and 3 ms after SOI. Full optical access is available for the flat- and 2D confined wall inserts, although some of the light from the furthest part of the spray may be attenuated along the line-of-sight as was the case with the laser light for the aforementioned OH PLIF results.
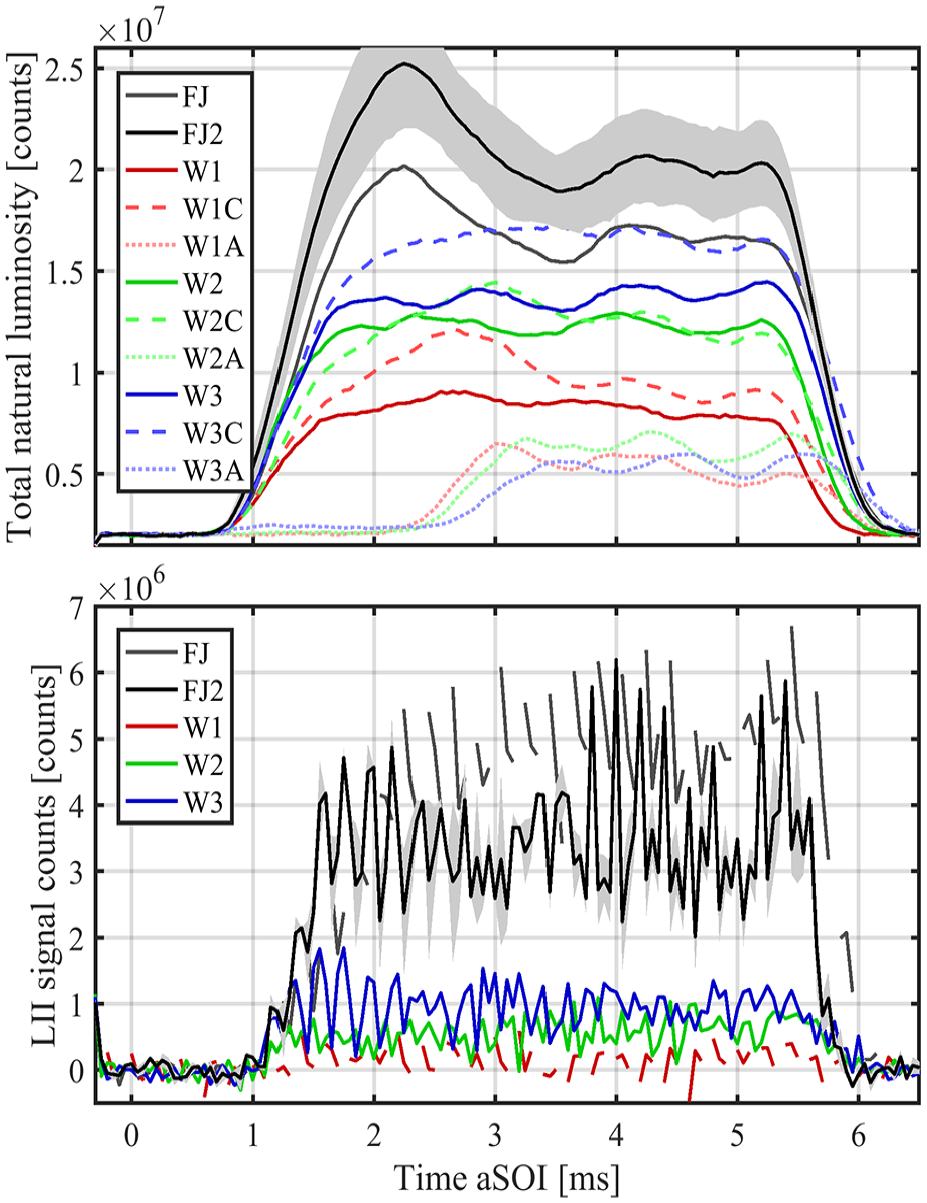
Top panel: integrated high-speed natural luminosity data for all cases as a function of time. The shaded area represents a 95% confidence interval for the second free jet case. Bottom panel: net high-speed LII signal for the free jet and flat wall cases. Again, a 95% confidence interval is shown only for the second free jet case and limited to the data points that correspond to multiple recordings.
When comparing the free jet results with the flat- and 2D confined wall inserts, the following three observations are made:
An increased signal strength between 1 and 3 ms after SOI, corresponding to the soot-laden head of the jet is avoided when flame–wall interaction is studied.
With decreasing distance between the injector orifice and the wall insert, the total natural luminosity decreases.
Similar to the effect on AHRR, the flat wall shows a more significant change in natural luminosity compared to the confined wall shape.
For the first observation, it appears that the spray is redistributed enough for all wall distances and both shapes, such that a region with high-soot concentration in the head of the jet is avoided all together. When comparing the free jet with the nearest flat wall results, more than a factor of two in signal strength is revealed. Still, soot luminosity may scale with high powers of temperature, 29 and part of the observed signal decrease could be related to a temperature decrease due to the interaction of the spray with a relatively cool wall. While the shortest wall distance may show more vignetting effects because of the fixed camera system, the trends qualitatively agree with the observations from the OH* recordings where differences in vignetting were avoided.
The bottom panel of Figure 8 shows the total high-speed LII signal for a selected number of cases. As the high-speed laser was coupled to the clock of the high-speed camera, the generation of the laser pulses is repetitive, but randomly starting in one of the first four camera frames. For the first free jet case and the shortest wall distance, parts of the line are missing because those frames (in a 20-kHz signal) never contained a laser pulse. The fact that most of the lines are rather noisy is caused by the same reason; spikes may correspond to a single experiment with higher overall LII signal. Interestingly, the LII signal for the first free jet data set is higher than for the second free jet data set (FJ2), while the natural luminosity data showed the opposite. Possibly, the initial temperatures in these data sets are slightly different. If the soot particle temperature is higher for the second free jet cases, the natural luminosity signal may be higher because of that. When the LII laser heats the particulate matter further, however, the soot may be more easily sublimated.
The wall-interaction cases that are not shown here had non-significant signal strength, which can be partially ascribed to the limited laser light access for the 2D confined and axisymmetric confined wall shapes. Otherwise, the 2D confined and axisymmetrical confined cases were expected to have slightly more soot, based on the natural luminosity signal strength and observed flame thickness in Figure 6. The shown cases, however, prove that interaction with the wall easily influences the sprays to the point that soot levels fall close to, or below the detection limit of the system. For the shortest wall distance, no significant LII signal remains.
Summary and conclusion
In this study, the influence of flame–wall interaction is investigated using three different wall shapes at three different distances from the injector orifice. As a reference, free jet experiments were conducted before and after the wall-interaction data sets. High-speed pressure-based heat release rate data, temperature measurements, and various optical diagnostic techniques were used to draw a number of conclusions including:
Wall interaction results in a faster increase in the AHRR, which we attribute to improved mixing, corroborating previous work. The effect is largest with the flat wall, followed by the 2D confined and axisymmetrically confined walls.
In all studied cases, a shorter distance between the injector orifice and the wall surface improves mixing further.
The analysis indicates that improved mixing after the EOI may still be the primary cause for a decreased burn-out phase duration.
Using a thermocouple-instrumented dummy window as an end wall of the combustion vessel—opposite the injector—showed how heat locally leaves the system. This heat loss channel gives rise to a reduced pressure increase for a free jet and becomes more significant for larger flames. For an accurate energy balance with the injected fuel, these losses need to be taken into account.
Overall, a shorter flame length and smaller area with reduced signal intensity is observed for a shorter wall distance in high-speed OH* chemiluminescence images. Again, the flat wall seems to improve mixing in the most significant way to facilitate this.
Simultaneous OH* and OH PLIF imaging was applied using a single high-speed-intensified camera system with a long exposure time. Ground state OH is found outside of the luminous flame region when moving downstream, in accordance with previous studies of non-impinging fuel sprays. From the observations in this study, main flame structure features appear to stay intact when moving from well-studied free spray flames to wall-interaction cases.
An initial peak intensity in natural luminosity recordings is not observed for the wall-interaction cases in this study. As the flame is dispersed, cooled, and quenched by the wall surface, a fuel-rich and heavily sooting spray head giving rise to the initial peak is presumably not formed.
High-speed LII results show how flame–wall interaction rapidly decreases soot when moving the surface closer to the injector orifice.
Footnotes
Authors’ note
Experiments were conducted at the Power and Flow laboratory of the Eindhoven University of Technology.
Declaration of conflicting interests
The author(s) declared no potential conflicts of interest with respect to the research, authorship, and/or publication of this article.
Funding
The author(s) disclosed receipt of the following financial support for the research, authorship, and/or publication of this article: Financial support for this work was provided by FPT-Motorenforschung AG. Michael Harter (FPT), Hans van Griensven, and Theo de Groot (both TU/e) are gratefully acknowledged for their excellent technical support.