
Abstract
In this article, the acoustic characterisation of a turbocharger compressor with ported shroud design is carried out through the numerical simulation of the system operating under design conditions of maximum isentropic efficiency. While ported shroud compressors have been proposed as a way to control the flow near unstable conditions in order to obtain a more stable operation and enhance deep surge margin, it is often assumed that the behaviour under stable design conditions is characterised by a smooth, non-detached flow that matches an equivalent standard compressor. Furthermore, research is scarce regarding the acoustic effects of the ported shroud addition, especially under the design conditions. To analyse the flow field evolution and its relation with the noise generation, spectral signatures using statistical and scale-resolving turbulence modelling methods are obtained after successfully validating the performance and acoustic predictions of the numerical model with experimental measurements. Propagation of the frequency content through the ducts has been estimated with the aid of pressure decomposition methods to enhance the content coming from the compressor. Expected acoustic phenomena such as ‘buzz-saw’ tones, blade passing peaks and broadband noise are correctly identified in the modelled spectrum. Analysis of the flow behaviour in the ported shroud shows rotating structures through the slot that may impact the acoustic and vibration response. Further inspection of the pressure field through modal decomposition confirms the influence of the ported shroud cavity in noise generation and propagation, especially at lower frequencies, suggesting that further research should be carried out on the impact these flow enhancement solutions have on the noise emission of the turbocharger.
Keywords
Introduction
Ported shroud (PS) casing treatment is one of the most widely used passive flow control1–3 strategies in automotive turbocharger compressors for delaying the onset of surge and, thereby, enhancing the stable flow region of the compressor operation. PS casing treatments are based on the principle of recirculating the low-momentum fluid that blocks the blade passage back to the compressor inlet. The efficiency penalties associated with the PS design are well known in the literature.2,4 A number of investigations in the past 3 and recent times5,6 are focused on understanding the mechanism of these losses and potential means to minimise them. The other, less researched aspect of the PS design is its impact on the acoustics of the compressor. The PS design is believed to deteriorate the acoustic performance of the compressor. 7 The ever increasing downsizing and downspeeding trends in internal combustion engines to reap the low emission benefits coupled with the advances in powertrain refinement 8 have unmasked the turbocharger compressor noise as a major annoyance specifically from the customer standpoint. 9 Historically, acoustic phenomena in the centrifugal compressors are relatively less researched in comparison with their axial equivalents because of the predominant dependency of the aerospace industry on axial flow machines.
The early work on the acoustics of small centrifugal compressors was driven by automotive and turbocharger manufactures given the product sensitivity to the acoustic emission, specifically to broadband noises identified by an onomatopoeia like ‘whoosh’10,11 or ‘hiss’ 12 or ‘blow’ 13 noise. The experimental investigations of Evans and Ward 11 and Trochon 13 presented the 1.5–3 kHz range for whoosh noise, while the works of Teng and Homco 10 and Figurella et al. 14 provided an inclusive frequency range of 4–12 kHz for the whoosh noise. As pointed out by Torregrosa et al., 15 the wide frequency range used by some authors10,14 to identify ‘whoosh’ noise could be due to conflation with the so-called tip clearance noise (TCN). While the works of Evans and Ward 11 and Teng and Homco 10 implied ‘whoosh’ noise to be a near-surge or marginal surge phenomenon, Figurella et al. 14 presented the broadband content in the higher mass flow regions too; this was further confirmed by Broatch et al. 16
Raitor and Neise 17 focused on exploring the acoustic characteristics of the large centrifugal compressors using experimental measurements. An attempt to investigate the corresponding mechanisms of the features observed in the acoustic spectra of the centrifugal compressor was also made. The lower operating speeds corresponding to the subsonic conditions are shown to be dominated by TCN, a narrow band noise identified at around half the blade pass frequency (BPF), and at higher operating speeds corresponding to transonic conditions, spectra are dominated by ‘buzz-saw’ tones and BPF. TCN and buzz-saw tones are hypothesised to be caused by the secondary flows through the tip clearance region and the shock waves attached to the impeller blades, respectively, but the work of Galindo et al. 18 demonstrated the insignificant effect of the tip clearance gap by itself on the compressor acoustics. Dynamic change in blade tip clearance during the compressor operation 18 due to shaft motion or aeroelastic and mechanical torsion in the blades is not considered, but three different tip clearance gaps are studied that remain constant during the compressor operation pointing towards the insignificance of the tip gap in altering the acoustic spectra. Gaudé et al. 12 presented a characterisation of the various noises and the corresponding frequency regions in a turbocharger.
The numerical investigations of Mendonça et al. 19 and Karim et al. 20 established the potential of computational fluid dynamics (CFD) to accurately model the compressor acoustics. The TCN like ‘rotating stall’ noise is identified in the 0.5–0.9 rotating order (RO) region of the spectra shown by Mendonça et al. 19 Numerical simulations are further explored by Broatch et al. 21 in their work, showing reasonable correlation with experimentally measured data. The numerical spectra faithfully replicated various features of the measured noise including whoosh noise. Although, broadband elevation in the 12.5–16 kHz region corresponding to TCN is not seen in the numerical results and as noted by Torregrosa et al., 15 the effect is of propagation in nature, and the source of the noise could be some form mechanical deformations or fluid structure interactions that are not numerically modelled.
Researchers at KTH22–25 numerically investigated the compressor with PS treatment of the similar size as used in this work using large eddy simulation (LES). The researchers22,23 also employed dynamic mode decomposition on the numerical results to further understand the flow behaviour under near-surge operating conditions. The rotating stall similar to the one shown by Mendonça et al. 19 at 0.5 RO is shown and postulated to be caused by the interaction of the flow exiting the PS cavity with large coherent structures. Their work is mainly focused on near-surge compressor operation with little or no remarks on the identification of the whoosh noise in the design operating conditions. The surge frequency is predicted to be approximately 43 Hz, and the results are validated by comparing the predicted flow field with the ones measured using particle image velocimetry (PIV) rather than the measured noise data.
The investigations discussed in the literature are primarily made on the non-PS compressors except for the work at KTH22–24, which are primarily focused on the near-surge operation. The multiplicity of the hypothesised mechanism for the various noises identified in the spectra, specifically whoosh noise, ranges from turbulence10,11 to the poor incidence angles leading to instabilities in the impeller and the diffuser.16,20 Furthermore, the lack of understanding and quantification of the impact of PS on compressor acoustics dictates the need for further research. This work is a subset of ongoing efforts to study the performance and acoustics of the PS design in parallel, to understand the impact of PS and the associated flow features on the turbocharger compressor acoustics and, thereby, to reach optimal compressor designs. This investigation is an attempt to understand the acoustic spectra of the compressor operating under the design condition. The operation at the maximum isentropic efficiency for this particular compressor is modelled to explore the acoustic emission at this point along with the impact of PS on the aforementioned noise features, specifically tonal noise. Furthermore, the possible mechanisms of the identified noises are further explored by studying the compressor flow features and using mode decomposition techniques.
Methodology
Among the available methods, namely, external radiated noise,10,11 orifice noise14,26 and internal (in-duct) noise12,21 to compute the acoustic characteristics of the turbocharger compressor, internal (in-duct) noise is employed in this work due to higher computational efficiency over the vibroacoustic and computational aeroacoustic alternatives. The internal (in-duct) noise approach is validated in the works of Broatch et al.16,21 and the computed acoustic characteristics are correlated with orifice noise as shown by Torregrosa et al. 27 The internal (in-duct) pressure field that includes the hydrodynamic and acoustic fluctuations is computed by numerically solving the unsteady Navier–Stokes equations for each control volume of the computational domain in their conservation form using a commercial CFD coupled solver, ANSYS CFX. 28 The computed pressure fluctuations are then processed using suitable approaches to obtain the noise levels at specific locations as well as in the ducts. The statistical turbulence modelling approach of unsteady Reynolds averaged Navier–Stokes simulation (URANS) as well as scale-resolving approaches like LES and stress-blended eddy simulation (SBES) 29 is explored to model the compressor operation under design conditions.
URANS uses the Reynolds averaged form of Navier–Stokes equations to model all scales of the turbulence field. Assuming that the flow solution can be decomposed into a mean and fluctuating part, the Reynolds averaging procedure solves directly for the mean flow solution. The transient term in the governing equations is retained to resolve the large unsteady flow motions including resolved unsteady flow in the mean flow solution. Thus, the time-dependent mean component of the flow solution for URANS is achieved through the idea of separation of scales and is calculated by ensemble averaging. The Reynolds stress tensor introduced by the Reynolds averaging formulation is modelled using a two-equation shear stress transport (SST) (
A computationally efficient alternative to the LES approach is the SBES approach, which is a combination of the RANS and LES approaches. This hybrid RANS-LES model employs URANS inside the attached region and mildly separated boundary layers and the LES model in free sheer flows and massively separated regions where turbulent structures are of dimensionally comparable order as the geometrical structures generating them. The SBES model is an improvement over conventional detached eddy simulation (DES), specifically in the shielding of the boundary layer and transition issues in separating shear layers. 29 These problems are alleviated in SBES formulation by ‘blending’ the RANS and LES models using a shielding function. The shielding function provides improved asymptotic shielding of RANS boundary layer against LES modification and produces significantly lower values of eddy viscosity in separating shear layers.
The turbulence is initialised as isotropic with the curvature correction in the regions where the Reynolds averaged method is used. The working fluid in the compressor is assumed to be air behaving as a perfect gas with the ideal gas law modelling the fluid behaviour and Sutherland’s law approximating the dynamic viscosity. The impeller motion is modelled using the rigid body motion (RBM) approach, also known as sliding mesh in which the mesh actually rotates every time step at the transient rotor–stator interface. 28 A steady boundary condition, as a combination of total pressure at the inlet and mass flow rate at the outlet, is prescribed in this work to model the compressor operation under design condition. Although the combination of total pressure at the inlet and static pressure at the outlet boundary is broadly used in the literature, however, it has been shown to be sensitive to an initial guess. 28 In order to use the common set of boundary conditions to model the entire operating range of the compressor for further work, the aforementioned boundary conditions are employed. The values of mass flow rate and pressure used as boundary conditions in the numerical model are determined experimentally. The walls are modelled as smooth with adiabatic and no-slip boundary conditions.
The in-duct pressure fluctuations derived from the flow solution at the various locations in the compressor are processed to obtain the spectral characteristics. Inlet and outlet duct noise levels are computed from the decomposed pressure waves obtained from the linearly constrained minimum variance (LCMV) beamforming
21
and method of characteristics (MoC),
31
while the spectra of the diffuser and near-impeller locations are directly calculated from the pressure fluctuations recorded by the probes. The pressure wave decomposition at the duct is used to alleviate the issues such as the reflection from the duct ends and the standing waves. Beamforming uses two linear arrays of three pressure probes each at the inlet and the outlet duct to decompose the pressure wave into a forward travelling wave
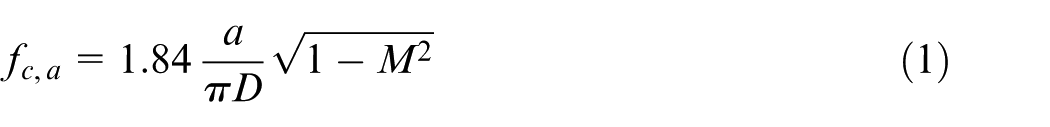
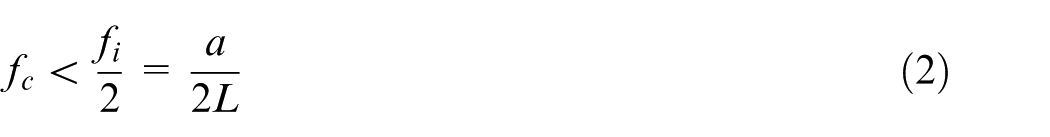
The information of the flow field can also be used to compute the decomposed pressure components using the MoC. The decomposed components are calculated as per equations (3) and (4) defined below
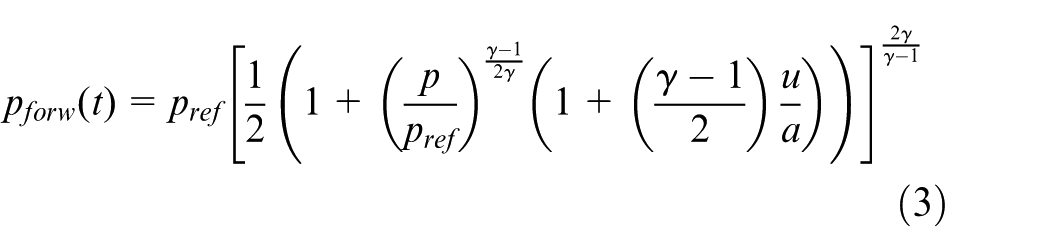
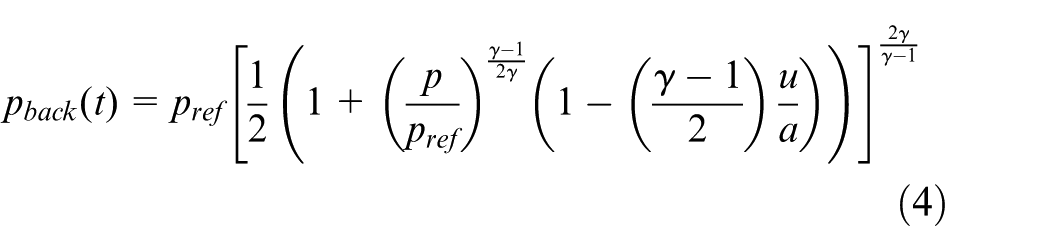
In contrast to beamforming, MoC is not limited by any such inherent constraints and is, therefore, used to compute the duct spectra till higher frequency limits. The respective pressure components, namely,
Geometry and computational model
A commercially available turbocharger compressor geometry with a PS recirculation treatment is the subject of this investigation. The front and section views of the compressor geometry are shown in Figure 1. The PS cavity is structurally supported by three struts in a symmetric arrangement, and therefore the working fluid can enter or exit the PS slot via three channels. The impeller backside cavity (IBC), that is, the gap between the impeller and the diffuser back-plate along with oil bearings, has been modelled in this investigation. The specification of the compressor is provided in Table 1. The operation of the compressor under the design conditions of an isospeed line shown in the Figure 2 is numerically investigated in this work.
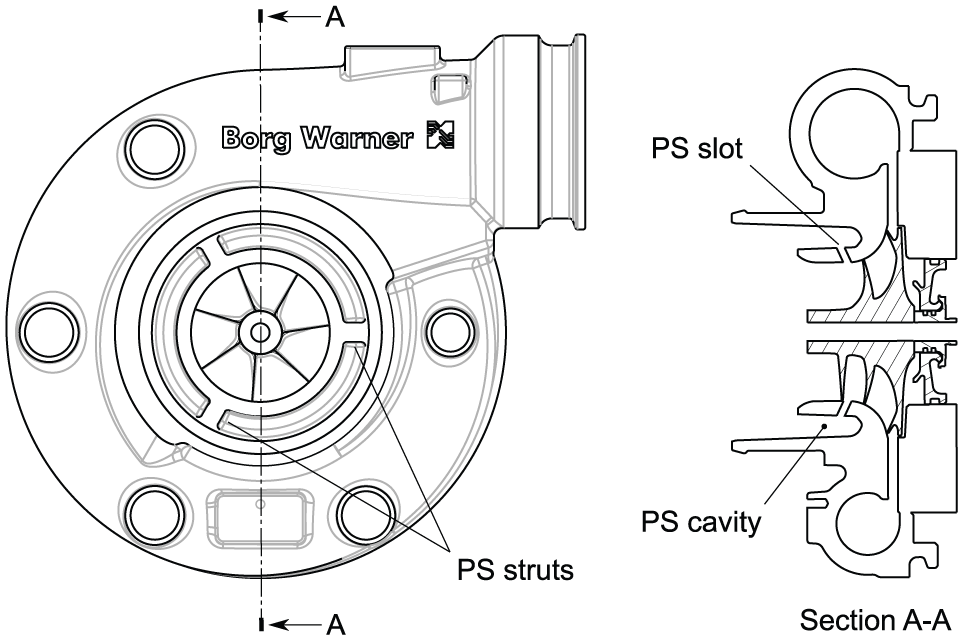
Mechanical drawing of the selected PS compressor, showing the location of the supporting struts, the slot and the cavity geometry.
Details of the modelled compressor.
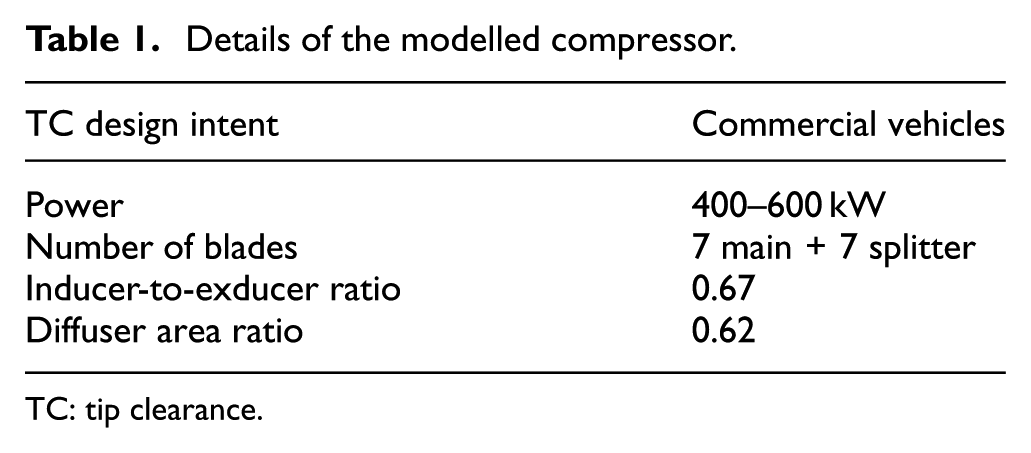
TC: tip clearance.
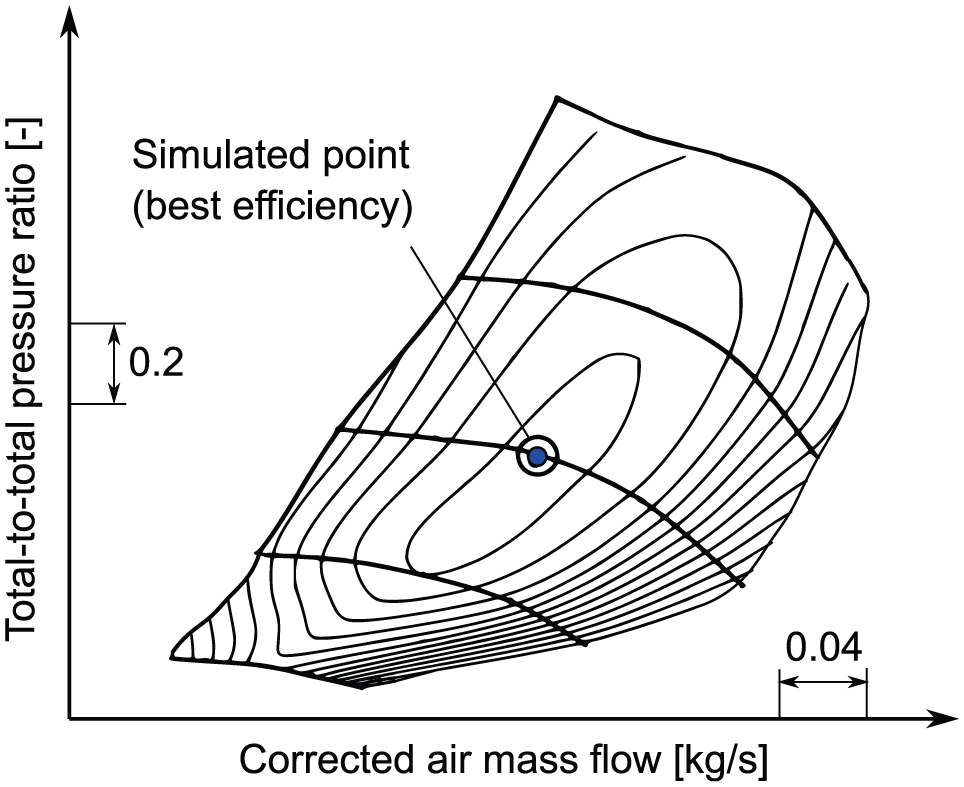
Experimental compressor map for the selected turbocharger, highlighting the design (best efficiency) operating point selected for the study.
The computational domain is spatially discretised by an unstructured polyhedral control volume created from the tetrahedral cells generated in the ICEM CFD 32 by the vertex-centred numerical approach in ANSYS CFX. 28 The grid is shown in Figure 3. A polyhedral control volume is less diffusive and offers significant accuracy gains compared to an equivalent-size unstructured grid of other cell types (i.e. tetrahedral). 33 Although a structured mesh would result in less numerical diffusion and commensurately higher accuracy, it can also lead to some cells in regions of high geometric complexity with unavoidably large aspect ratios or heavy skewness, resulting in unacceptable discretisation error. Furthermore, a polyhedral grid is expected to offer similar accuracy as an equivalent hexahedral grid in the cases where secondary flows are relevant, 34 and therefore both design and off-design operating conditions can be accurately modelled using a polyhedral grid.
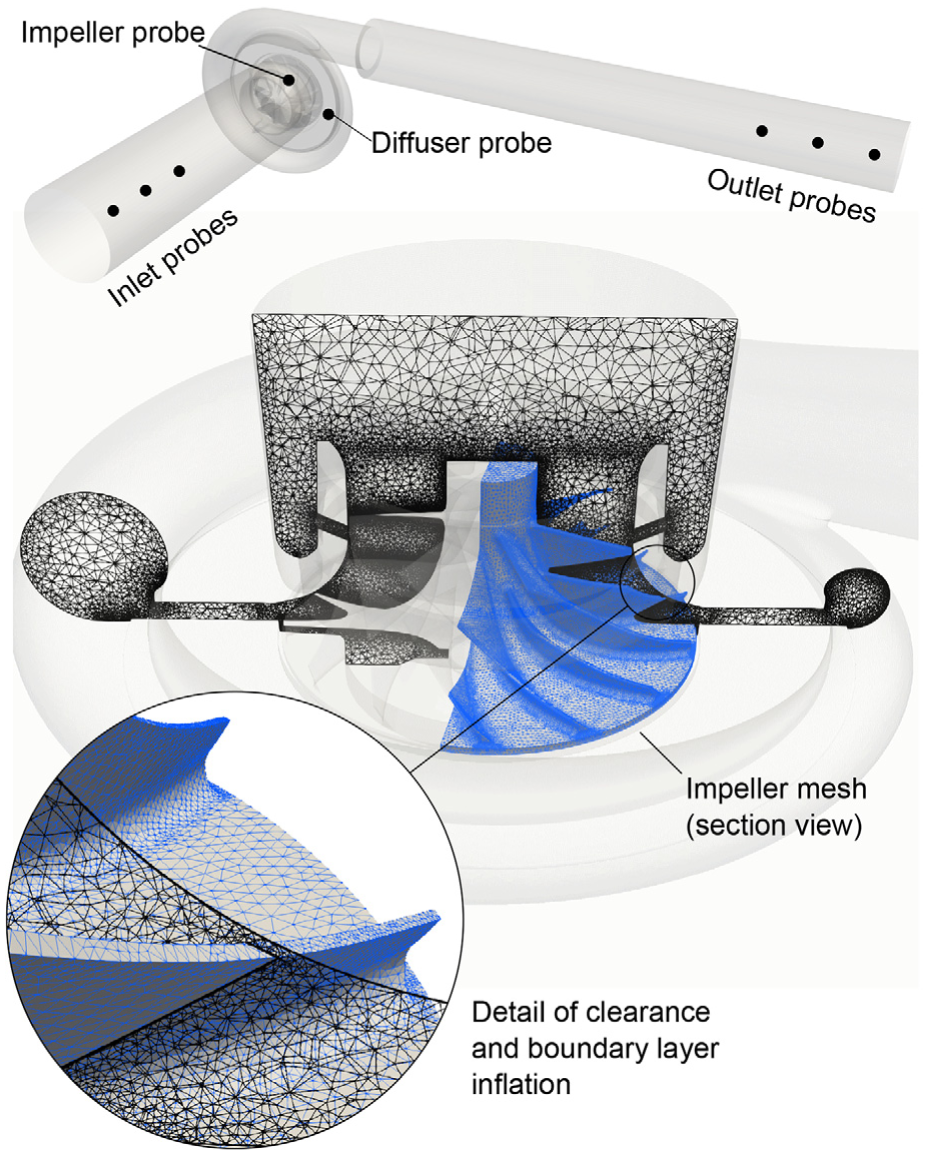
View of the computational domain focusing on the compressor, highlighting a slice of the fluid mesh and including the rotor surface mesh. A detailed view shows the clearance between the blades and the shroud and the boundary layer inflation. Locations of the pressure arrays and probes are also indicated.
The convective terms are discretised using the combination of the second-order accurate central difference scheme and the first-order upwind scheme to maintain the boundedness of the solution. An implicit, second-order accurate scheme implemented in ANSYS CFX
28
as a second-order backward Euler scheme is used to discretise the transient terms. It is worth noting that in this scheme the transient scheme for the turbulence equations is still first order, and a bounded second-order scheme is used for the volume fraction equations. The hybrid model uses 1% turbulent intensity and a turbulent viscosity ratio of 10 at the inlet section. Five inner coefficient loops are used for each iteration to achieve the convergence of residuals up to four orders
Three numerical configurations which include the URANS model with time step size corresponding to
Performance predicted by various numerical configurations and the deviation from the values measured experimentally from a gas stand.
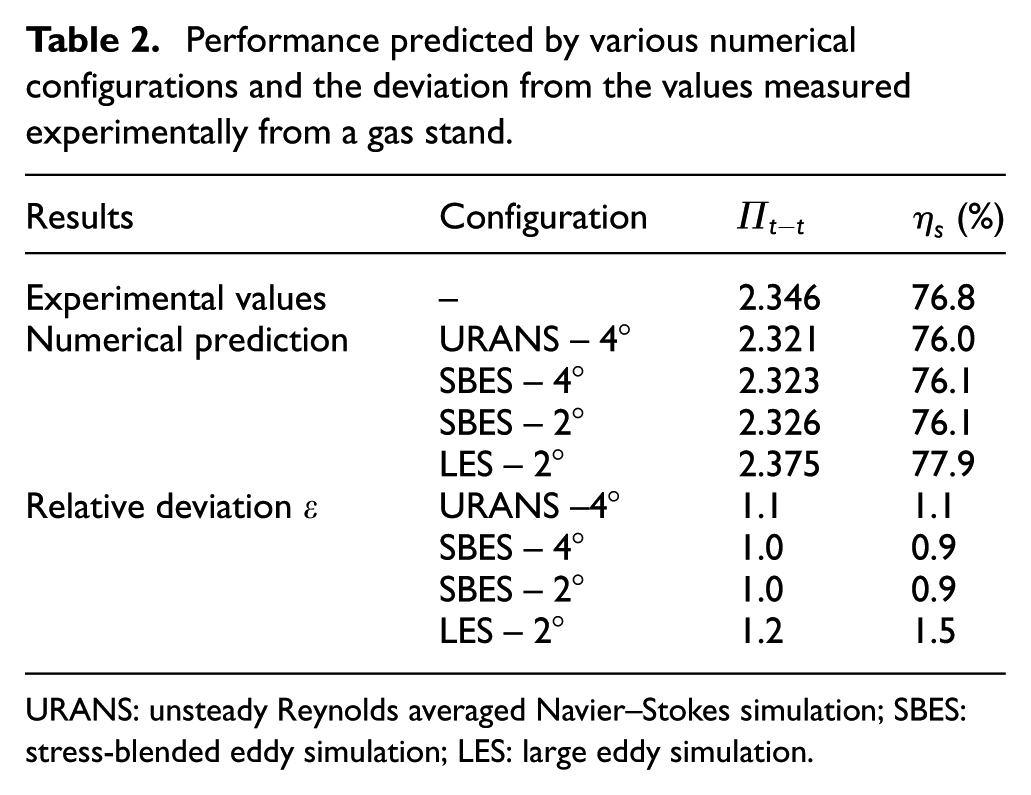
URANS: unsteady Reynolds averaged Navier–Stokes simulation; SBES: stress-blended eddy simulation; LES: large eddy simulation.
Validation of the numerical model
The computational model is validated in a two-step approach by first comparing the performance predictions with the measured data. The second step focuses on validating the acoustic spectra predicted by the numerical model by comparing it with the experimentally measured spectra. The aforementioned steps are elucidated in the subsections below.
Validation of the global performance predictions
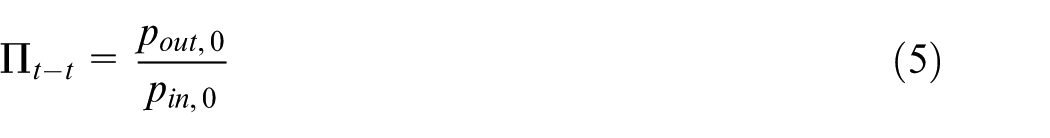
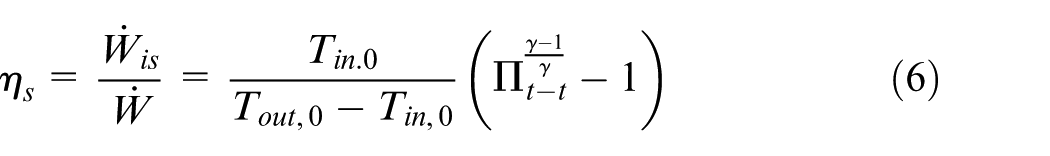
The first level of validation is achieved by comparing the performance parameters predicted by the computational model with gas stand measurement data. The global performance parameters of total-to-total pressure ratio
Compressor measurements are performed at the gas stand testing facility in BorgWarner (BW) Turbo Systems, Bradford. The turbocharger test bench characterises both the compressor and the turbine as the turbocharger is tested as a whole machine. The test rig uses pressurised air as the working fluid, heated to
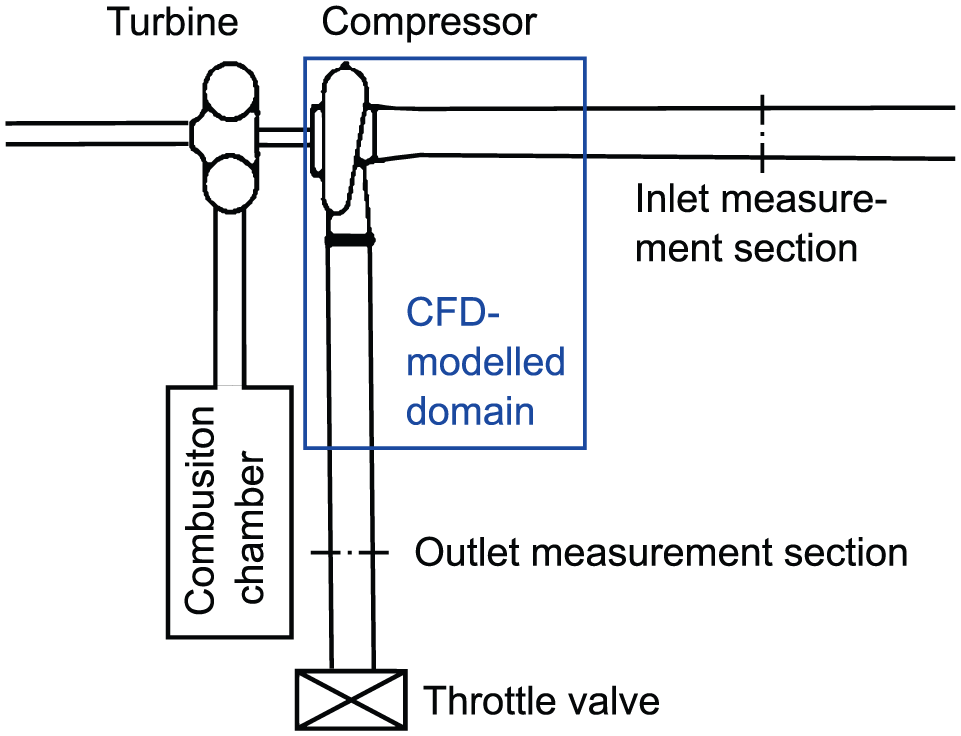
Sketch of the test rig used to experimentally characterise the compressor map and to obtain boundary conditions and validation data.
The time-averaged total-to-total pressure ratio
The numerical performance parameters show deviation in the range of
Validation of the acoustic predictions
The acoustic spectra computed from the pressure signal of the probe near impeller and diffuser are used to validate the acoustic predictions of the numerical model by comparing with the experimentally measured spectrum at the similar location. The experimental measurements are carried out by installing the turbocharger on the test rig facility in CMT-Motores Térmicos, wherein exhaust from an engine is used to run the turbine of the turbocharger. The measurements are made with idealised long straight pipes at the inlet and the outlet openings of the turbocharger. The positions of the piezoelectric pressure sensors used to measure the pressure fluctuations near the impeller and inside the diffuser are shown in Figure 5, along with the schematic of the test rig. The pressure signal is sampled at
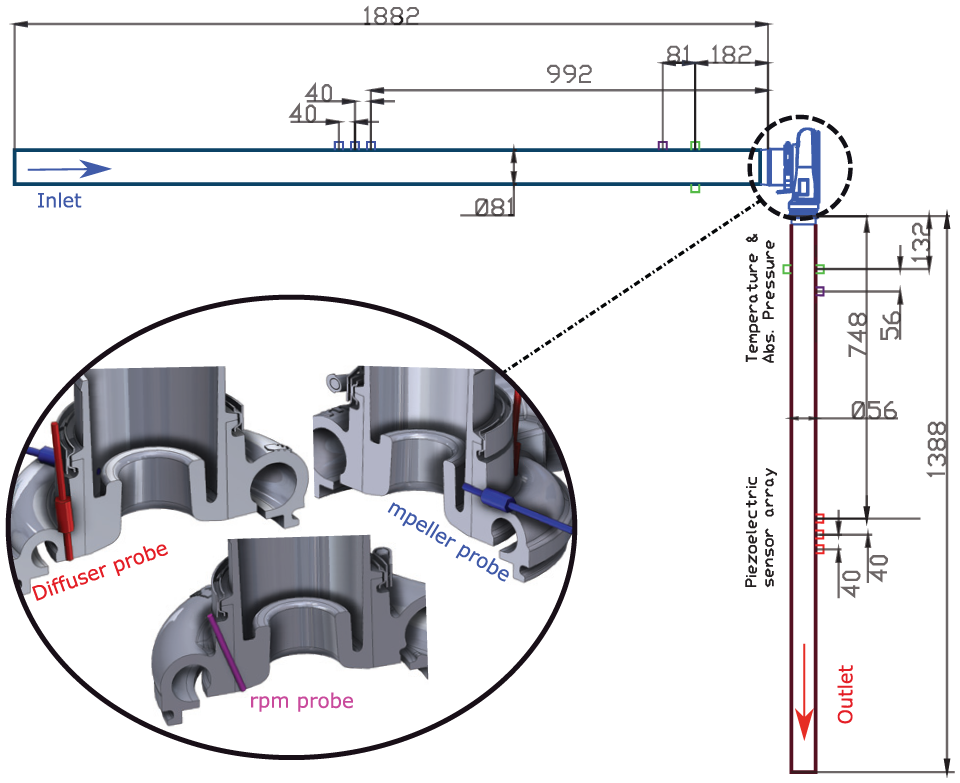
Schematic of the experimental apparatus used for acoustic measurements showing the location of various sensors along with the inlet and outlet pressure arrays. Probes instrumented on the compressor, namely, impeller probe, diffuser probe and rotational velocity sensor, are shown in the zoomed section.
It is worth mentioning that the performance parameters measured at two facilities are in close agreement as the
The correlation of the sound spectra predicted by the numerical configurations with the measured spectrum can be clearly seen in Figure 6. The BPF tones and the harmonics of BPF along with rotor shaft speed harmonics (‘buzz-saw’ tones) are correctly identified in the predicted spectrum of the impeller probe. The experimental impeller spectrum is dominated by the BPF with a consistent overall noise level all across the frequency range as opposed to the numerical spectrum, in which a decay is seen after the BDF. The spectra of the diffuser probe also show a reasonable agreement with the measured values in terms of the overall flatter trend except with the inability to capture the broadband feature seen in the range of 18–20 kHz and the first RO tone. In general, the RO tones are less accentuated in the measured spectra as compared to the predictions.
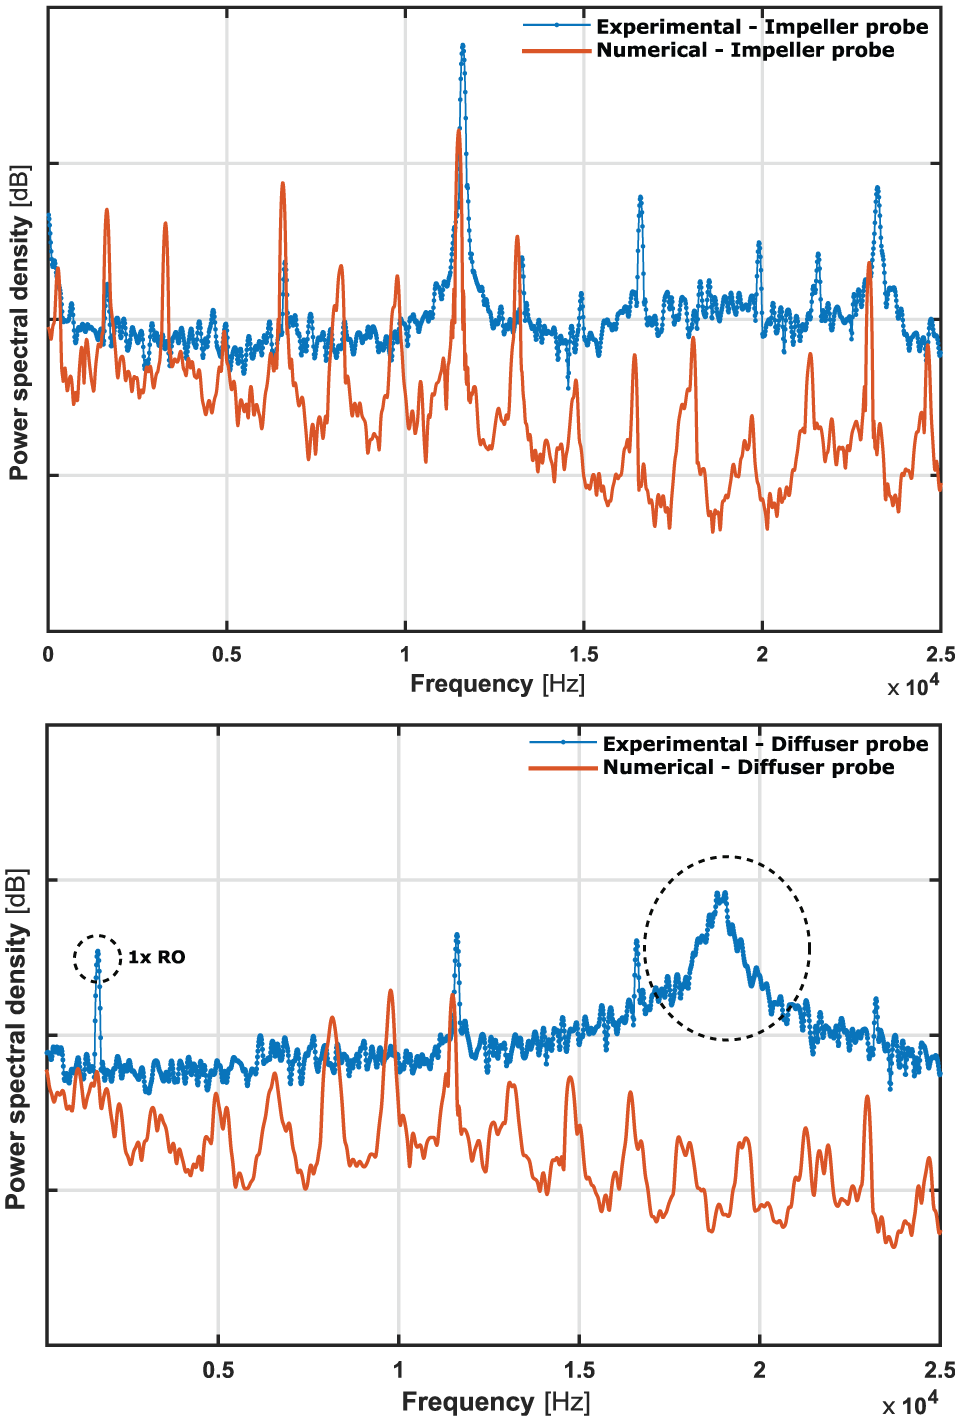
Numerical spectra of the near-impeller (top) and the diffuser (bottom) probes obtained from the LES model are compared with the experimental values. Impeller spectrum is in a reasonable correlation with the measured values. The broadband feature (highlighted) in the spectrum of the diffuser probe is not captured by the numerical model. The Y-axis scale is kept at 30 dB per division.
The deviation of the numerical spectrum from the measurement in the region beyond the plane wave range could be partly attributed to the location of the pressure sensors. The probes used in the experimental exercise are wall flushed as shown in Figure 7, while the pressure in the numerical model is monitored in the mid-flow region. The constraint of mid-flow probes in the numerical model is based on the necessity of particularly high spatial resolution in the LES approach to accurately model wall-bounded flows at a high Reynolds number. The boundary layer effects captured in the experimental measurements are ignored in the numerical model. The origin of the broadband feature in the measured diffuser spectrum could be related to fluid–solid interactions (blade flutter, axis torsion/deflection, etc.) that are not usually modelled.
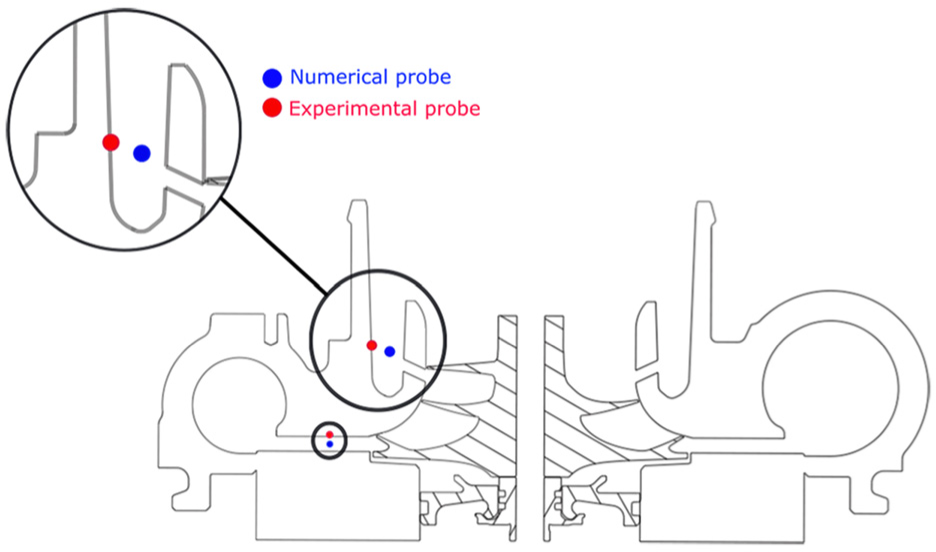
Difference in the location of experimental (wall flushed) and numerical (mid-flow) probes.
Results and discussion
Compressor spectral signature
PSD of the monitor near impeller for the turbocharger compressor is shown in Figure 6. The various characteristics identified in the predicted spectrum include BPF peaks and ‘buzz-saw’ tonal noise. Buzz-saw tones are caused by rotor-alone pressure field, dominated by shock waves attached to the rotor blades at higher speeds, according to various other investigations based on axial compressors in the literature.
Figure 6 indeed shows buzz-saw tones corresponding to each main blade. In order to test the aforementioned hypothesis, regions with Mach number
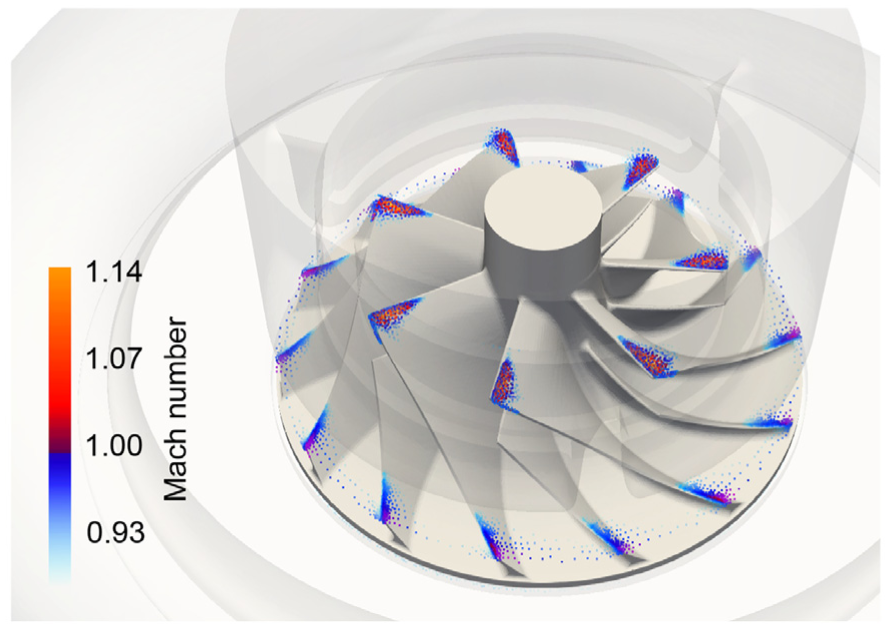
Close-up view of the impeller, highlighting locations of the flow featuring transonic, sonic and supersonic speeds. Results show that main blade leading edges and both main and splitter blade trailing edges reach sonic conditions.
It is interesting to point out that a feeble tone is seen in between the two buzz-saw tones in the predicted spectra. The source of tonal noise is of dipole type due to the fluctuating surface pressures. The mechanism of these mid-tones is hypothesised as the weak interaction between the structural struts in the PS cavity and the leading edges of the impeller blades. The mode decomposition results presented in the later part of this article reinforce this hypothesis as some of these mid-tones can be seen in the spectral signature of POD mode
Interaction between the struts and the blades can be thought of as similar to a rotor–stator interaction (RSI) wherein the three structural struts act as the stator and the impeller blades as the rotor. It is well established that the number of stator blades has a predominant role in the overall noise levels and the directivity of the noise due to the RSI 35 and, therefore, necessitates further research in this context for a PS compressor. Secondary flows through the gap between the impeller shroud and the blade tips are postulated as the mechanism of narrow-band TCN seen in the study by Raitor and Neise. 17 However, the acoustic characteristics of the compressor under the examined operating conditions do not showcase any such TCN.
PSD of the pressure monitors located
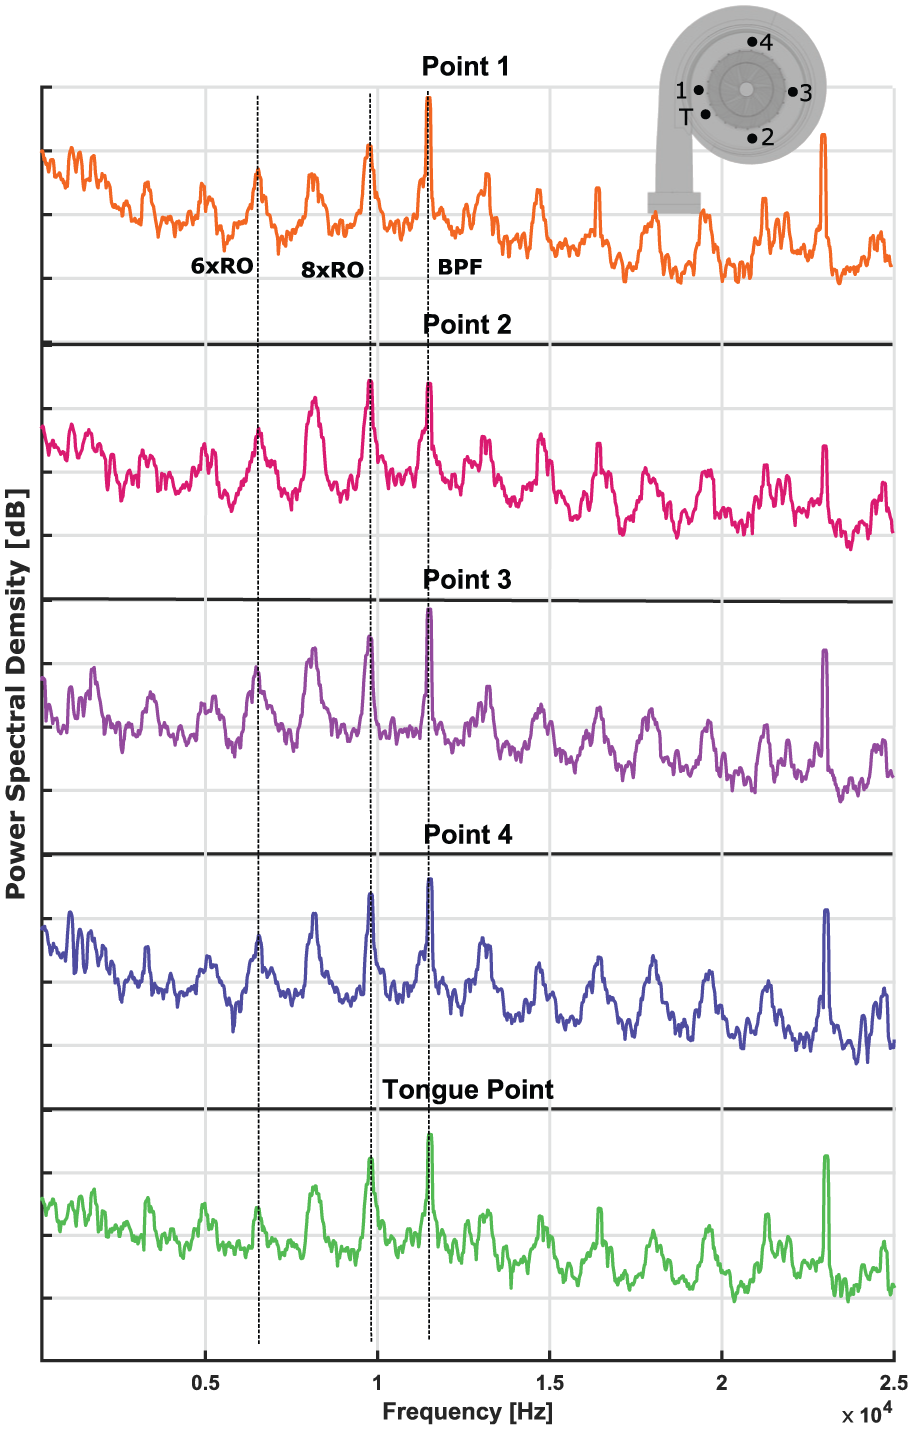
Result of predicted pressure spectral density (PSD) for different points in the diffuser and near the volute tongue. The Y-axis differences are arbitrary, although the scale is kept at 20 dB per division.
Inlet and outlet decomposed pressure spectra
Pressure arrays positioned at the inlet and outlet ducts of the compressor are used to store the temporal trace of the pressure for 0.07 s excluding the initial transients. The pressure fluctuations are decomposed and are processed by Welch’s overlapped segmented average to compute the PSD at the inlet and outlet ducts. The duct spectra are validated by comparing the measured and predicted PSD in the low-frequency region corresponding to the plane wave propagation of the sound. The experimentally measured pressure fluctuations are decomposed using the LCMV beamforming–based method to compute the duct spectra. Numerical results are computed from the pressure wave decomposed using beamforming and also with the pressure wave reconstructed from the flow field information using MoC. 31
The plane wave propagation for the studied case is limited by the onset of the first asymmetric mode. The limiting values for the inlet and outlet ducts in the measured spectra are 2.4 and 4.1 kHz. The intent of decomposing the pressure wave is to enhance the content coming from the compressor and to obtain the pressure fluctuations with lower reflected content from the boundary. Although non-reflecting boundary conditions and significantly longer ducts with successive grid coarsening can be used to address the reflection by numerical dispersion, these methods are not used in this study due to computational and numerical configuration reasons.
The spectra of pressure components obtained using beamforming and MoC are compared with the beamformed experimental spectra in Figure 10. The spectra obtained from MoC and beamforming shows higher coherence for the inlet duct relative to the outlet duct. This makes sense as the flow properties are expected to be uniform at the inlet array, while the presence of high swirl at the outlet of the compressor would introduce difference in the flow field recorded by the individual probes of the outlet array. Nonetheless, numerical results show a reasonable correlation with the experimental results for the low-frequency region.
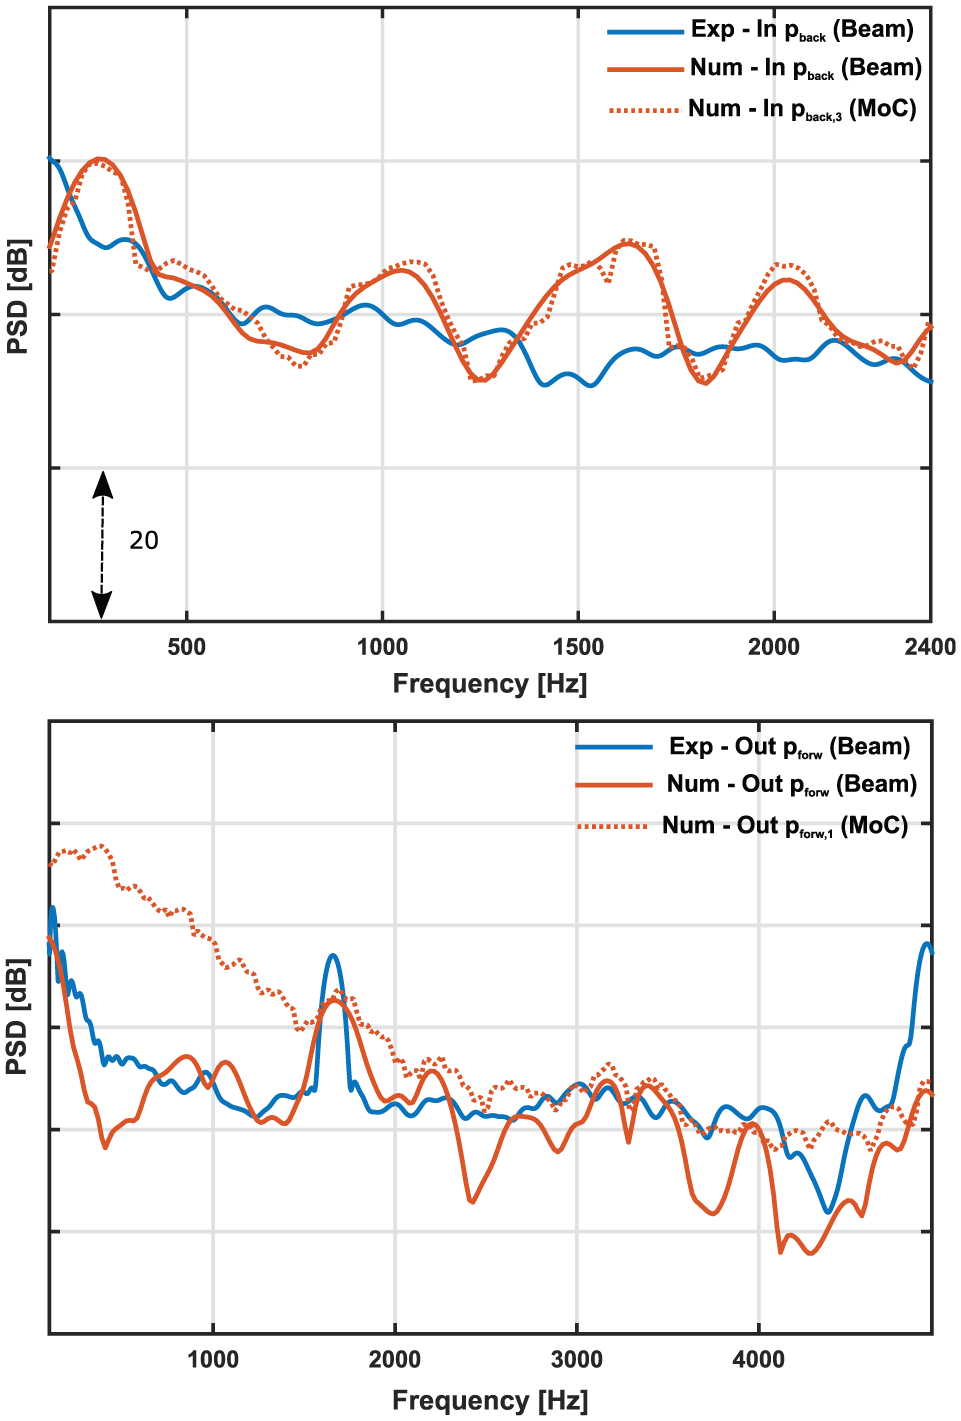
Spectra of the inlet –
The high-frequency spectra of the inlet and outlet ducts are obtained from the pressure traces reconstructed using MoC given the inherent limitations associated with the beamforming method. The experimentally measured duct spectra and the numerically predicted results are presented in Figure 11. It is interesting to see the propagation of the first asymmetric mode in the experimental spectrum of the inlet duct. The asymmetric mode is not present in the numerical spectrum as the pressure wave is decomposed. BPF can be identified in the numerical spectra of both ducts although the first harmonic of the BPF is not seen in contrast to the measured spectra. Broadband noise features present after the BPF in the measured spectra are also not captured by the numerical model. Furthermore, the decay of numerical spectra is stepper than what is seen in the experimentally measured results.
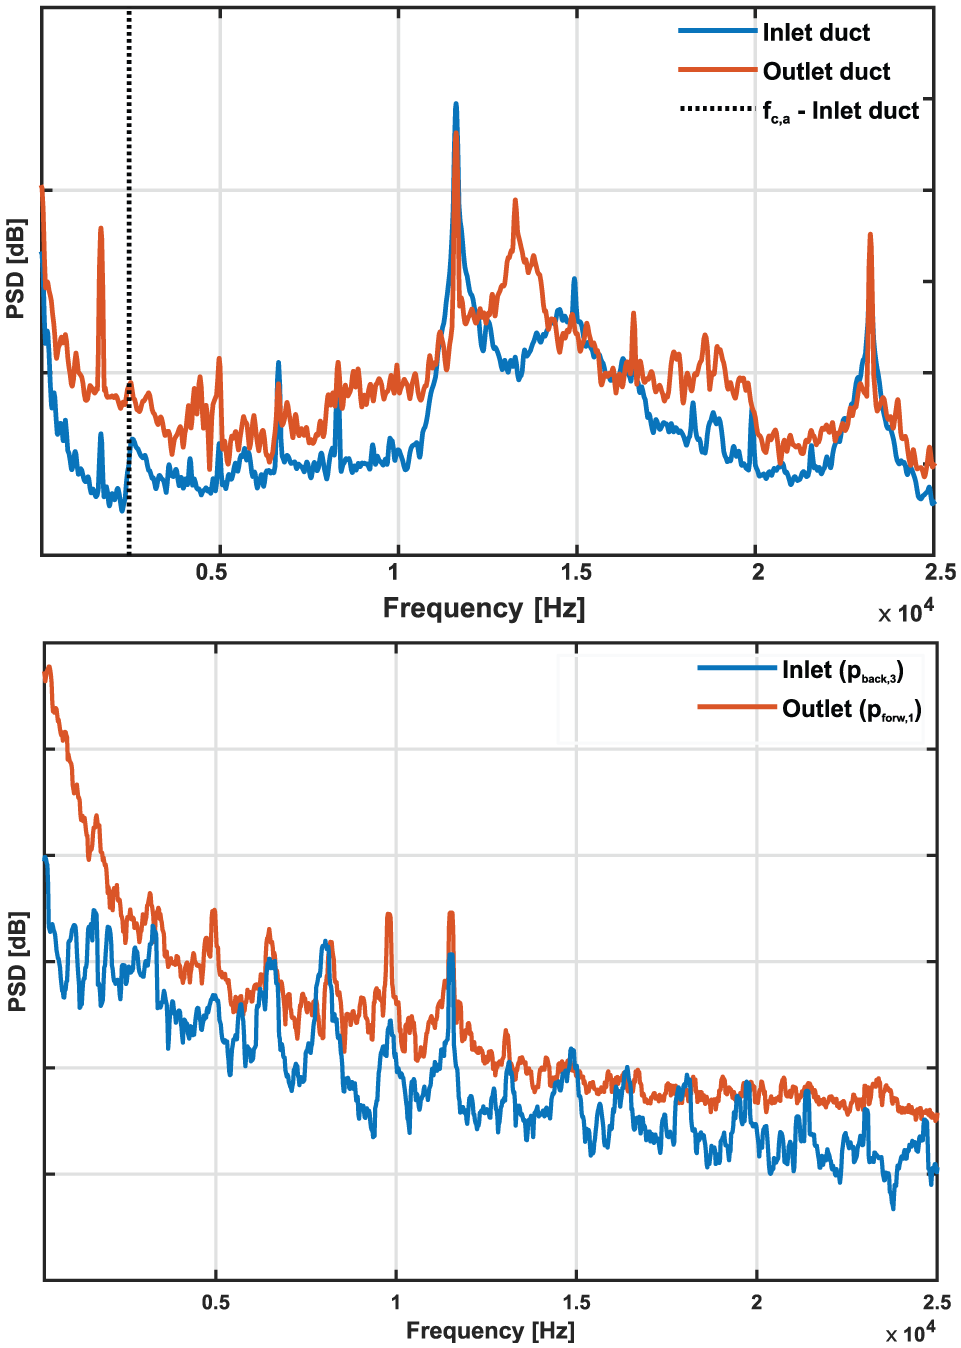
Inlet and outlet duct spectra obtained from experimental (top) and numerical (bottom) probes. The experimental spectra are obtained from raw pressure signals, while numerical spectra are obtained from pressure waves reconstructed using MoC. The Y-axis scale is kept at 20 dB per division.
The result shows the existence of tonal RO noise without the presence of any broadband ‘whoosh’ noise when the compressor is operating under the design condition of the examined isospeed line which is 75% of the maximum operating speed. Similar results are seen in the experimental study of Torregrosa et al. 15 (Figure 11 of the referenced article) where ‘whoosh’ noise is not existent in the design conditions of the isospeed line corresponding to the compressor modelled in this study, but RO tone can be identified in the spectrum of the outlet duct. The agreement between the predicted and measured results for the compressor ducts is not good, but the noise generation as seen from the spectra of the probe near impeller and in diffuser is reasonable.
Flow field characteristics
In this subsection, the flow field characteristics, specifically the flow through the PS cavity for the compressor operating under the design conditions, are investigated in order to discern if the interaction of the PS with the impeller flow shows disturbances with a potential to affect the acoustic behaviour.
The compressor essentially behaves like the one without casing treatment for the modelled conditions (design point), with the flow nearly stopping at the cavity and the PS working as a smooth area reduction of approximately half a radius as demonstrated in Figure 12, which also shows the typical ‘inverted S-shaped’ flow structure 36 in the PS cavity.
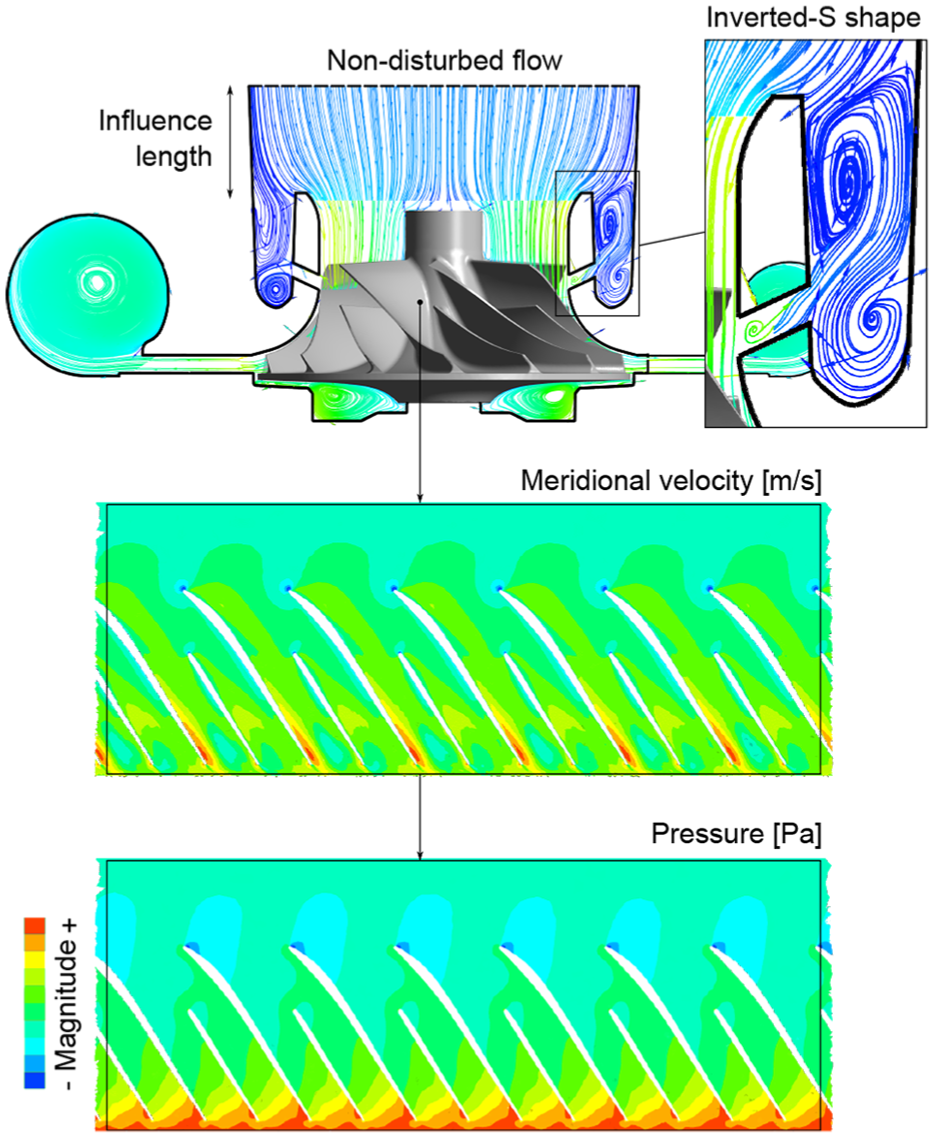
Analysis of the flow field characteristics at the PS and impeller. Top plot shows a streamline slice coloured by velocity magnitude, while blade-to-blade views of meridional velocity (middle) and pressure (bottom) demonstrate the regularity of the impeller flow field.
It is possible that the velocity increase due to this area reduction plays a role in the apparition of sonic conditions. In any case, plots of average meridional velocity and pressure distribution in the impeller passages presented in this figure show attached and smooth flow through the impeller passages, as expected for the design condition.
A previous investigation 37 indicated that an insignificant fraction of inlet mass flow is known to recirculate through the PS cavity for the design condition. However, flow can go in either direction. Either the fluid can be removed from the impeller passages and recirculated to the main flow or the flow can bypass the impeller leading edge and be added into the impeller main flow depending on the position of the impeller blades as shown in Figure 13.
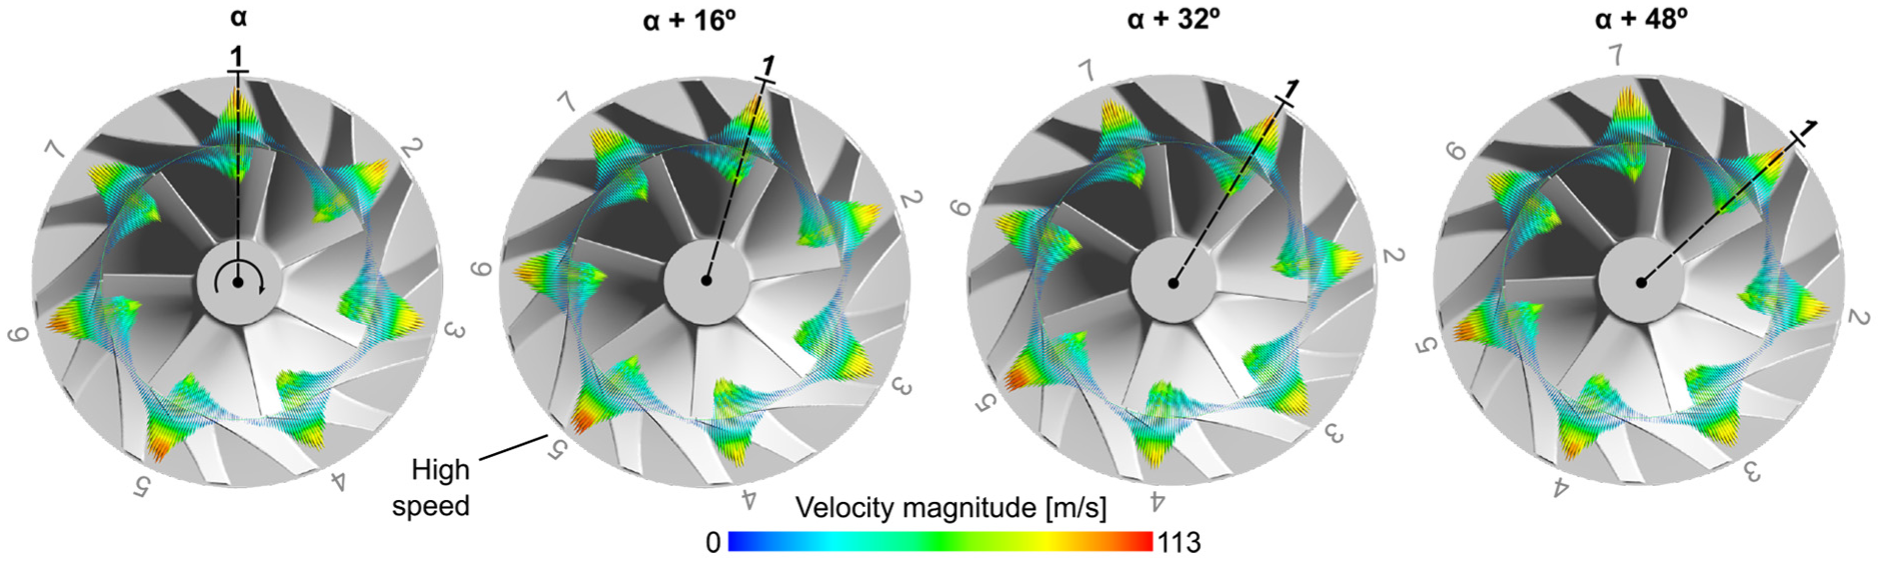
Four subsequent snapshots of velocity direction and magnitude of air mass flow through the PS cavity, highlighting how regions where fluid is pushed out and regions where the fluid is pulled in rotate with the blades. A section of higher speeds is shown near the ‘5’ mark, especially in the 16° and 32° plots.
Suction surfaces of the impeller blades pull the fluid into the PS slot from the compressor inlet, and the pressure surfaces of the blade push the fluid from the PS slot into the compressor inlet. The annular location at which the fluid is being drawn in or pushed out changes as the impeller rotates, thereby leading to a potential issue of high-cycle fatigue or enhanced vibration.
However, even though the net flow is not significant, it must be noted that the back-and-forth motion of the fluid in the PS slot, which moreover is rotating with the impeller, could cause pressure fluctuations that may generate or amplify the acoustic output of the compressor. Furthermore, it can be seen in Figure 13 that these motions, while similar, vary in speed depending on the angular position on the rotor, especially near the ‘5’ mark. Its velocity increases from the first plot to the 16° and 32° ones, to finally start to diminish again by the 48° plot. This region of higher speed could be associated to lower pressures, causing an imbalance with the opposite area of the PS and creating additional acoustic perturbations as flow fluctuations go from an area of higher pressure to the one of lower pressure.
Flow field modal decomposition
In order to explore the link between these unsteady flow field phenomena and the acoustic behaviour of the turbocharger, more sophisticated postprocessing techniques can be applied. One of the widely used techniques which is identified by several names such as POD, 38 principal component analysis (PCA) 39 or Karhunen–Loève expansion is used in this work. 40
This technique was first applied in the context of probability theory to explore the relation between variables in a dataset. However, it soon found application in many other fields, including fluid dynamics. 41 It allows the decomposition of the flow into spatial and temporal orthogonal modes, coupling them so that each spatial distribution is linked to a certain time evolution. 38
In this way, the spatial structures of the flow that comprise most of the energy of the system can be identified and tracked along time. This time evolution can be transformed to the frequency domain to inspect the spectral component of the different flow structures.
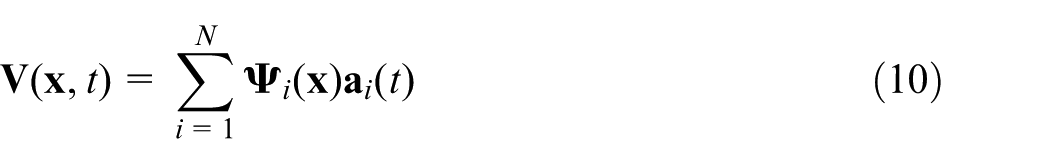
To apply this technique, the information of the flow field evolution must be grouped in a series of N consecutive ‘snapshots’ at a constant sampling time

Each of these vectors holds a quantity M of pressure scalar values at selected positions. As POD has the useful property of allowing the selection of a subset instead of the whole system,
To ensure that each row of vectors
POD can then be solved39,42 in the rest of the domain using a formulation based on singular value decomposition (SVD) of the assembled snapshot matrix

If the ‘economy’ version of the SVD is used,
The principal values
Applied to the compressor simulation,
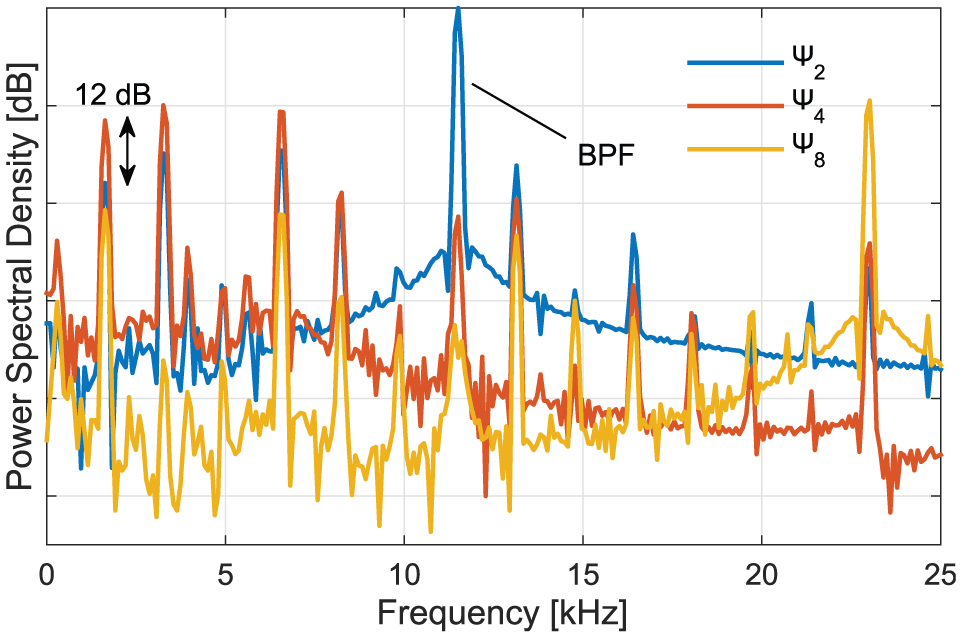
Spectral content of the time evolution
Spatial distribution of POD modes
Mode
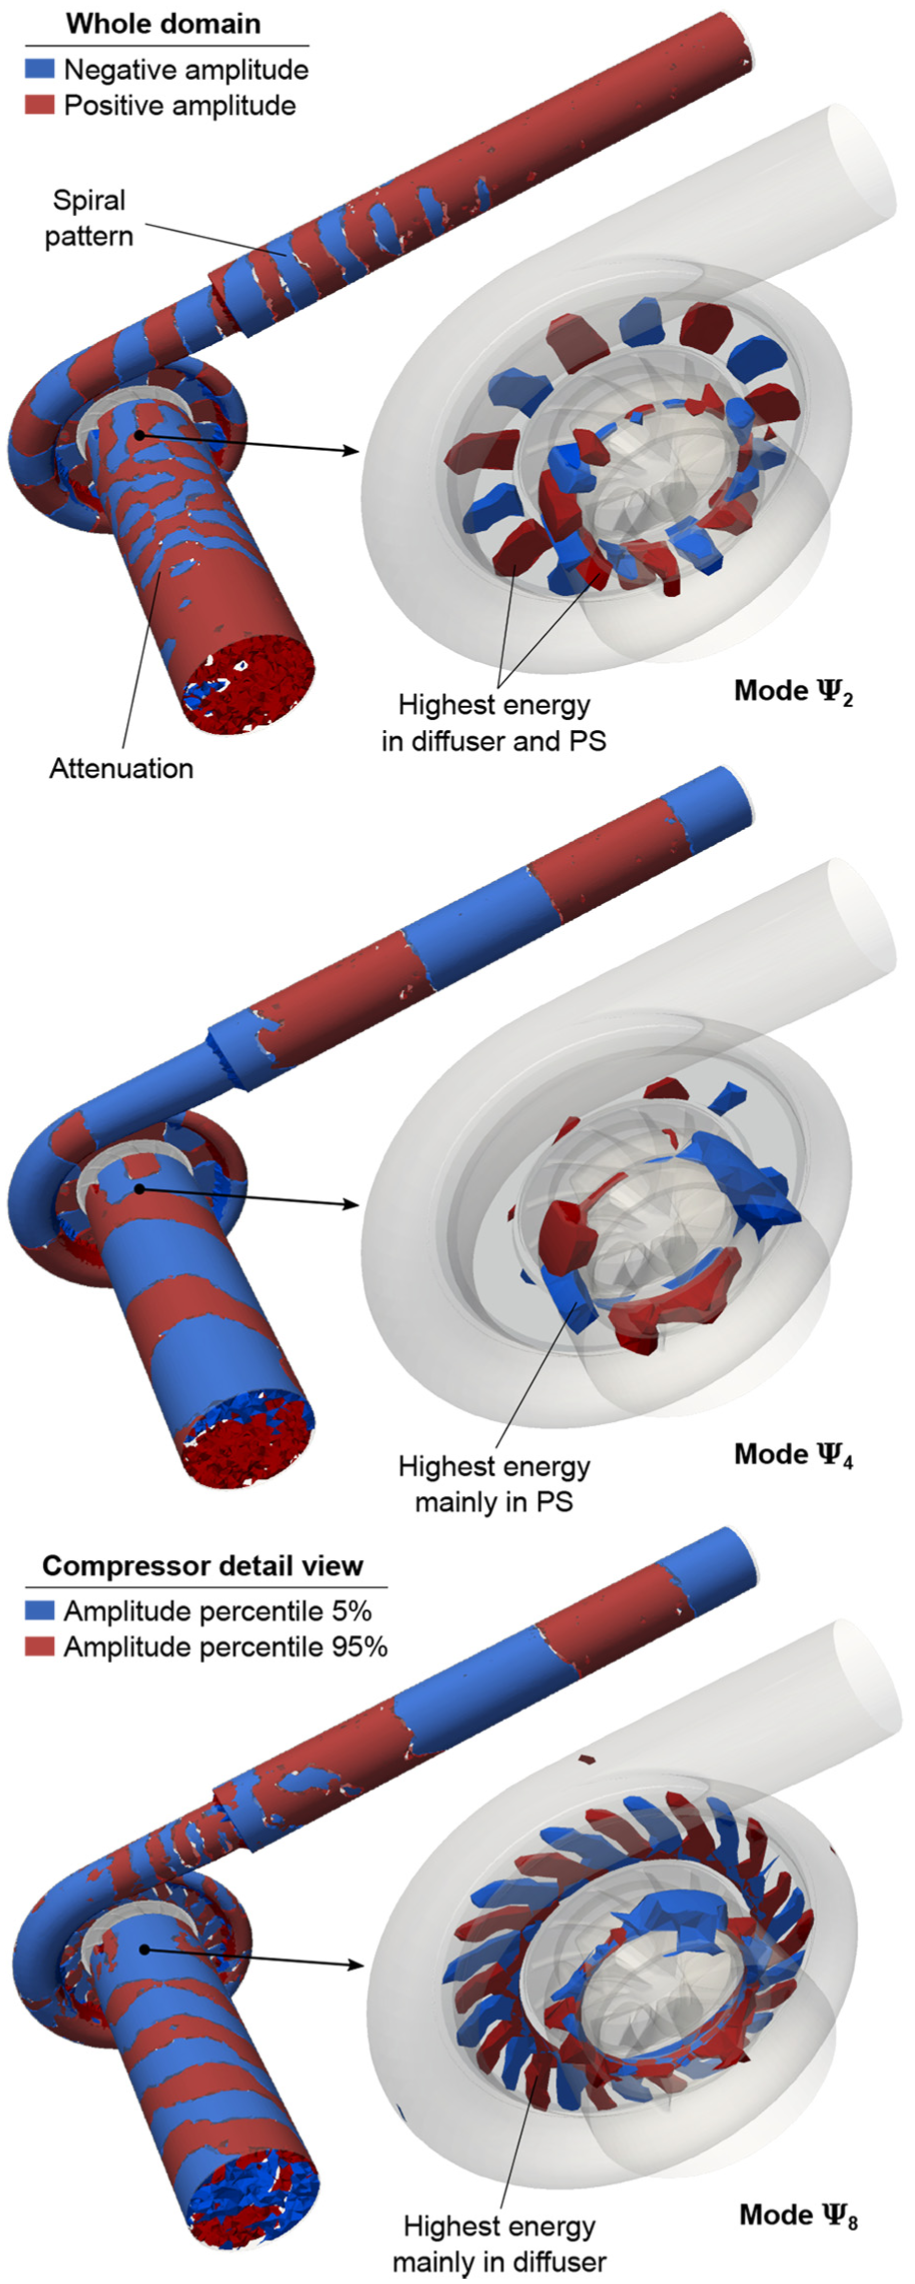
The positive and negative parts of the mode amplitude shown in the view of the whole domain will indicate how the BPF and middle frequency content is propagating through the domain. A spiral structure is clearly seen in the outlet duct and the volute, whereas in the inlet the spiral structure is more complex, possibly indicating interactions with the incoming flow. It can also be seen that although this mode features the highest energy, it becomes attenuated not far from the compressor itself.
Further insight into the sources of these oscillations can be obtained by plotting isovolumes of only the highest energy areas of the mode, realised in the detailed compressor view shown in Figure 15 by only displaying the 5% and 95% percentiles of the mode amplitude
In this way, it can be clearly seen that the sources of the BPF tonal noise are located in the diffuser but also in the PS region. When the analysis is described for the lower frequency content described by mode
It appears that, even though the compressor with PS is behaving as a standard compressor regarding performance, the behaviour of flow inside the slot and the cavity can still create pressure fluctuations that impact the acoustic output. Furthermore, the slot could provide an acoustic path that enhances the transmission of diffuser-produced oscillations to the inlet duct.
Concerning the higher frequency content illustrated by mode
Conclusion
In this investigation, the acoustic characteristics of a commercial turbocharger compressor equipped with a PS have been studied through a numerical simulation of the flow field. Both the LES and hybrid RANS-LES–based turbulence modelling approaches are explored to simulate the design operation of the compressor. Boundary conditions were obtained through experimental testing of the selected turbocharger, obtaining data that were also used to validate the numerical model performance, demonstrating a deviation of around 1% with respect to measurements.
Acoustic signature of the near-impeller probe and diffuser probe in the compressor is similar to the experimentally measured characteristics. However, the numerical model could not predict the broadband noise seen after the BPF in the experimental spectra of the near-impeller probe. Clear BPF peaks are identifiable in the spectrum, along with some of its harmonics. Characteristic ‘buzz-saw’ tonal noise is clearly predicted by the numerical model, which was attributed by previous researchers to sonic conditions being reached in the impeller, a phenomenon seen in axial turbocompressors. The numerical results confirm this hypothesis, by identifying sonic regions attached to the leading edges of the main blades, with splitter blades in the subsonic regime. In addition, sonic conditions are also reached in the tips of the trailing edges, in this case for both main and splitter blades. The numerical model shows thus potential to optimise the design of the impeller blades to avoid the source of these adverse tonal noise effects.
Propagation of the acoustic phenomena through the inlet and outlet ducts was also investigated. In order to enhance the spectral content coming from the compressor, the wave decomposition procedure based on LCMV beamforming and MoC was carried out. The numerical and experimental duct spectra obtained from the pressure wave decomposed using beamforming showed a good agreement in the plane wave region. This also allowed the identification of a tonal noise compatible with the first ROs of the modelled compressor operation, the dominant presence of which under high mass flow design conditions has been experimentally demonstrated. In contrast, the correlation between the experimental duct spectra computed from the raw pressure signal and the numerical results is unsatisfactory predominantly due to the propagation of higher order duct modes. Tonal noise can be identified in the numerical spectra of the ducts but the broadband noise corresponding to ‘whoosh’ noise is not seen for the studied operating condition. Broadband noise in the range of 12.2–14.3 kHz and 13–16 kHz is identified in the measured spectra of the inlet and outlet ducts, respectively.
Analysis of the flow characteristics was also performed in order to assess the influence of the particularities introduced by the use of the PS on noise generation. Results demonstrated that while the flow through the impeller itself is smooth and stable, a back-and-forth movement of the flow takes place inside the PS slot, with clear structures rotating with the blades, featuring differences in speed at certain angular coordinates.
To investigate the acoustic influences of these oscillations, POD was applied to the numerical simulation results. The decomposition of the total fluid field (and therefore its spectral signature) into its constituent modes allowed the separate analysis of lower, medium and higher frequency characteristics of the compressor pressure field. Inspection of the spatial distribution of the modal energy illustrated propagation patterns and, more importantly, the role of the diffuser and the ported PS cavity in housing the more energetic sources of the oscillations. In particular, while high frequency content dominated by the BPF and its higher order harmonics shows a clear influence of the diffuser, at the lower frequencies it is the PS cavity that holds the largest amplitudes of the oscillations.
In conclusion, while it is true that under design conditions the performance and flow management of the PS compressor resembles that of a standard one, the PS slot and cavity themselves can influence the noise vibration harshness (NVH) behaviour of the turbocharger, by allowing the presence of rotating pressure oscillation patterns, providing paths for the diffuser sources to propagate and favouring the appearance of sonic conditions. It is thus recommended that further numerical and experimental studies are conducted, in order to ensure that the benefits of PS compressors do not come at the cost of worse NVH performance.
Footnotes
Appendix 1
Acknowledgements
The authors would like to thank BorgWarner Turbo Systems for permission to publish the results presented in this article. The support of the HPC group at the University of Huddersfield is gratefully acknowledged.
Declaration of conflicting interests
The author(s) declared no potential conflicts of interest with respect to the research, authorship and/or publication of this article.
Funding
The author(s) disclosed receipt of the following financial support for the research, authorship, and/or publication of this article: The project was sponsored and supported by BorgWarner Turbo Systems and the Regional Growth Fund (RGF Grant Award 01.09.07.01/1789C).