
Abstract
Tests with diesel/n-butanol blends (up to 20% by volume) were carried out in a Euro 6 engine following the New European Driving Cycle in a test bench. No decrease in engine efficiency was observed when n-butanol is used and fuel consumption increased proportionally to its lower heating value. Regarding emissions, total hydrocarbon and carbon monoxide increased when n-butanol is used. On the other hand, the use of n-butanol reduces the particle emissions down to a minimum value (for around 16% of n-butanol content) and then increases particle emissions again. This was observed in both mass and particle number. This trend occurs as a consequence of the compromise between the increase in oxygen content, which inhibits soot formation, and the increase in hydrocarbon emissions, especially under cold-engine conditions, which promotes liquid nucleation. Finally, NOX emissions remained unchanged as a consequence of the compensation between larger ignition delays and shorter combustion durations.
Introduction
Fossil fuels are being replaced by renewable fuels in order to reduce both the environmental impact and the dependence from conventional fuels in internal combustion engines. Additionally, the use of oxygenated fuels (not only biodiesel but also alcohols) has the potential to reduce some of the regulated pollutant emissions from diesel engines, especially particulate matter (PM)1,2 which is one of the most critical emissions for diesel engines along with NOX. The reduction of PM emissions and the enhanced soot reactivity when oxygenated fuels are used 3 are a crucial issue to reduce the trap regeneration frequency and therefore to increase fuel economy and to extend the aftertreatment life-cycle. 4
Regarding alcohols, the most common alcohol studied in diesel engines is ethanol, which has proved to reduce PM emissions.5–6 However, this fuel presents a series of drawbacks such as low cetane number, low heating value, low lubricity, 7 low flash point and especially poor miscibility with diesel fuel. This latter drawback limits the use of ethanol, especially at low temperatures.8,9
N-butanol, as well as other long-chain alcohols, presents better miscibility with diesel fuel, 9 which allows to increase the replacement percentage. Also, n-butanol has higher cetane number, 10 higher viscosity 11 and higher heating value compared to ethanol. Although traditionally n-butanol has been produced from fossil fuels, nowadays it can be produced from renewable sources (by fermentation process), 12 with lower greenhouse life-cycle emissions than ethanol. 13 Currently, n-butanol can be produced through either an acetone–n-butanol–ethanol (ABE) fermentation process or an isopropanol–n-butanol–ethanol (IBE) fermentation process.14,15 The n-butanol used in this study was produced from miscanthus and municipal solid waste (MSW) within the ButaNexT project. Therefore, it can be considered an advanced fuel, whose contribution to the transport sector in energy basis will increase from 0.5% to 3.6% in the future European regulation. 16
There are some studies which analyse the effect of n-butanol/diesel blends on diesel emissions.17–20 In most of these studies, diesel engines were tested under steady conditions21–25 and only few of them measured along driving cycles. For instance, Armas et al. 18 and Kozak 26 analysed the effect of n-butanol addition on the performance and emissions from different Euro 4 diesel engines following the New European Driving Cycle (NEDC). These studies reported that HC emissions increase with increasing butanol content, PM sharply decreases, while there was no consensus about CO and NOx gaseous emissions. These blends have been tested not only in conventional diesel engines but also in advanced combustion engine technologies, showing the potential of n-butanol to reduce simultaneously both particle and NOX emissions but with similar trends in HC and CO emissions. 27
In summary, this article focuses on the use of n-butanol/diesel blends (up to 20% by volume of n-butanol) in a modern Euro 6 diesel engine under transient conditions. The effect of the n-butanol addition on the performance and the pollutant emissions in the tailpipe was analysed. The tests were carried out following the NEDC, which is the current cycle for certification procedures in Europe, 28 as described in regulation 83 UNECE. 29
Experimental procedure and fuels
Engine test bench and experimental equipment
This study was carried out in a Euro 6 Nissan 1.5 dCi engine (model K9K). This engine (shown in Figure 1) is a four-cylinder, four-stroke, turbocharged intercooled, common-rail direct-injection diesel engine, and it is equipped with double exhaust gas recirculation (EGR) system, one low-pressure cooled exhaust gas recirculation (LPEGR) and another high-pressure non-cooled exhaust gas recirculation (HPEGR). Only one of the EGR loops is activated at the same time, either the LPEGR or the HPEGR: HPEGR is activated at low coolant temperatures whereas LPEGR is activated at high coolant temperatures with some exceptions such as the lean NOx trap (LNT) purge in which HPEGR is also activated. Furthermore, the aftertreatment system was equipped with a diesel oxidation catalyst (DOC), a LNT and a regenerative wall-flow-type diesel particle filter (DPF). The main characteristics of the engine are shown in Table 1.
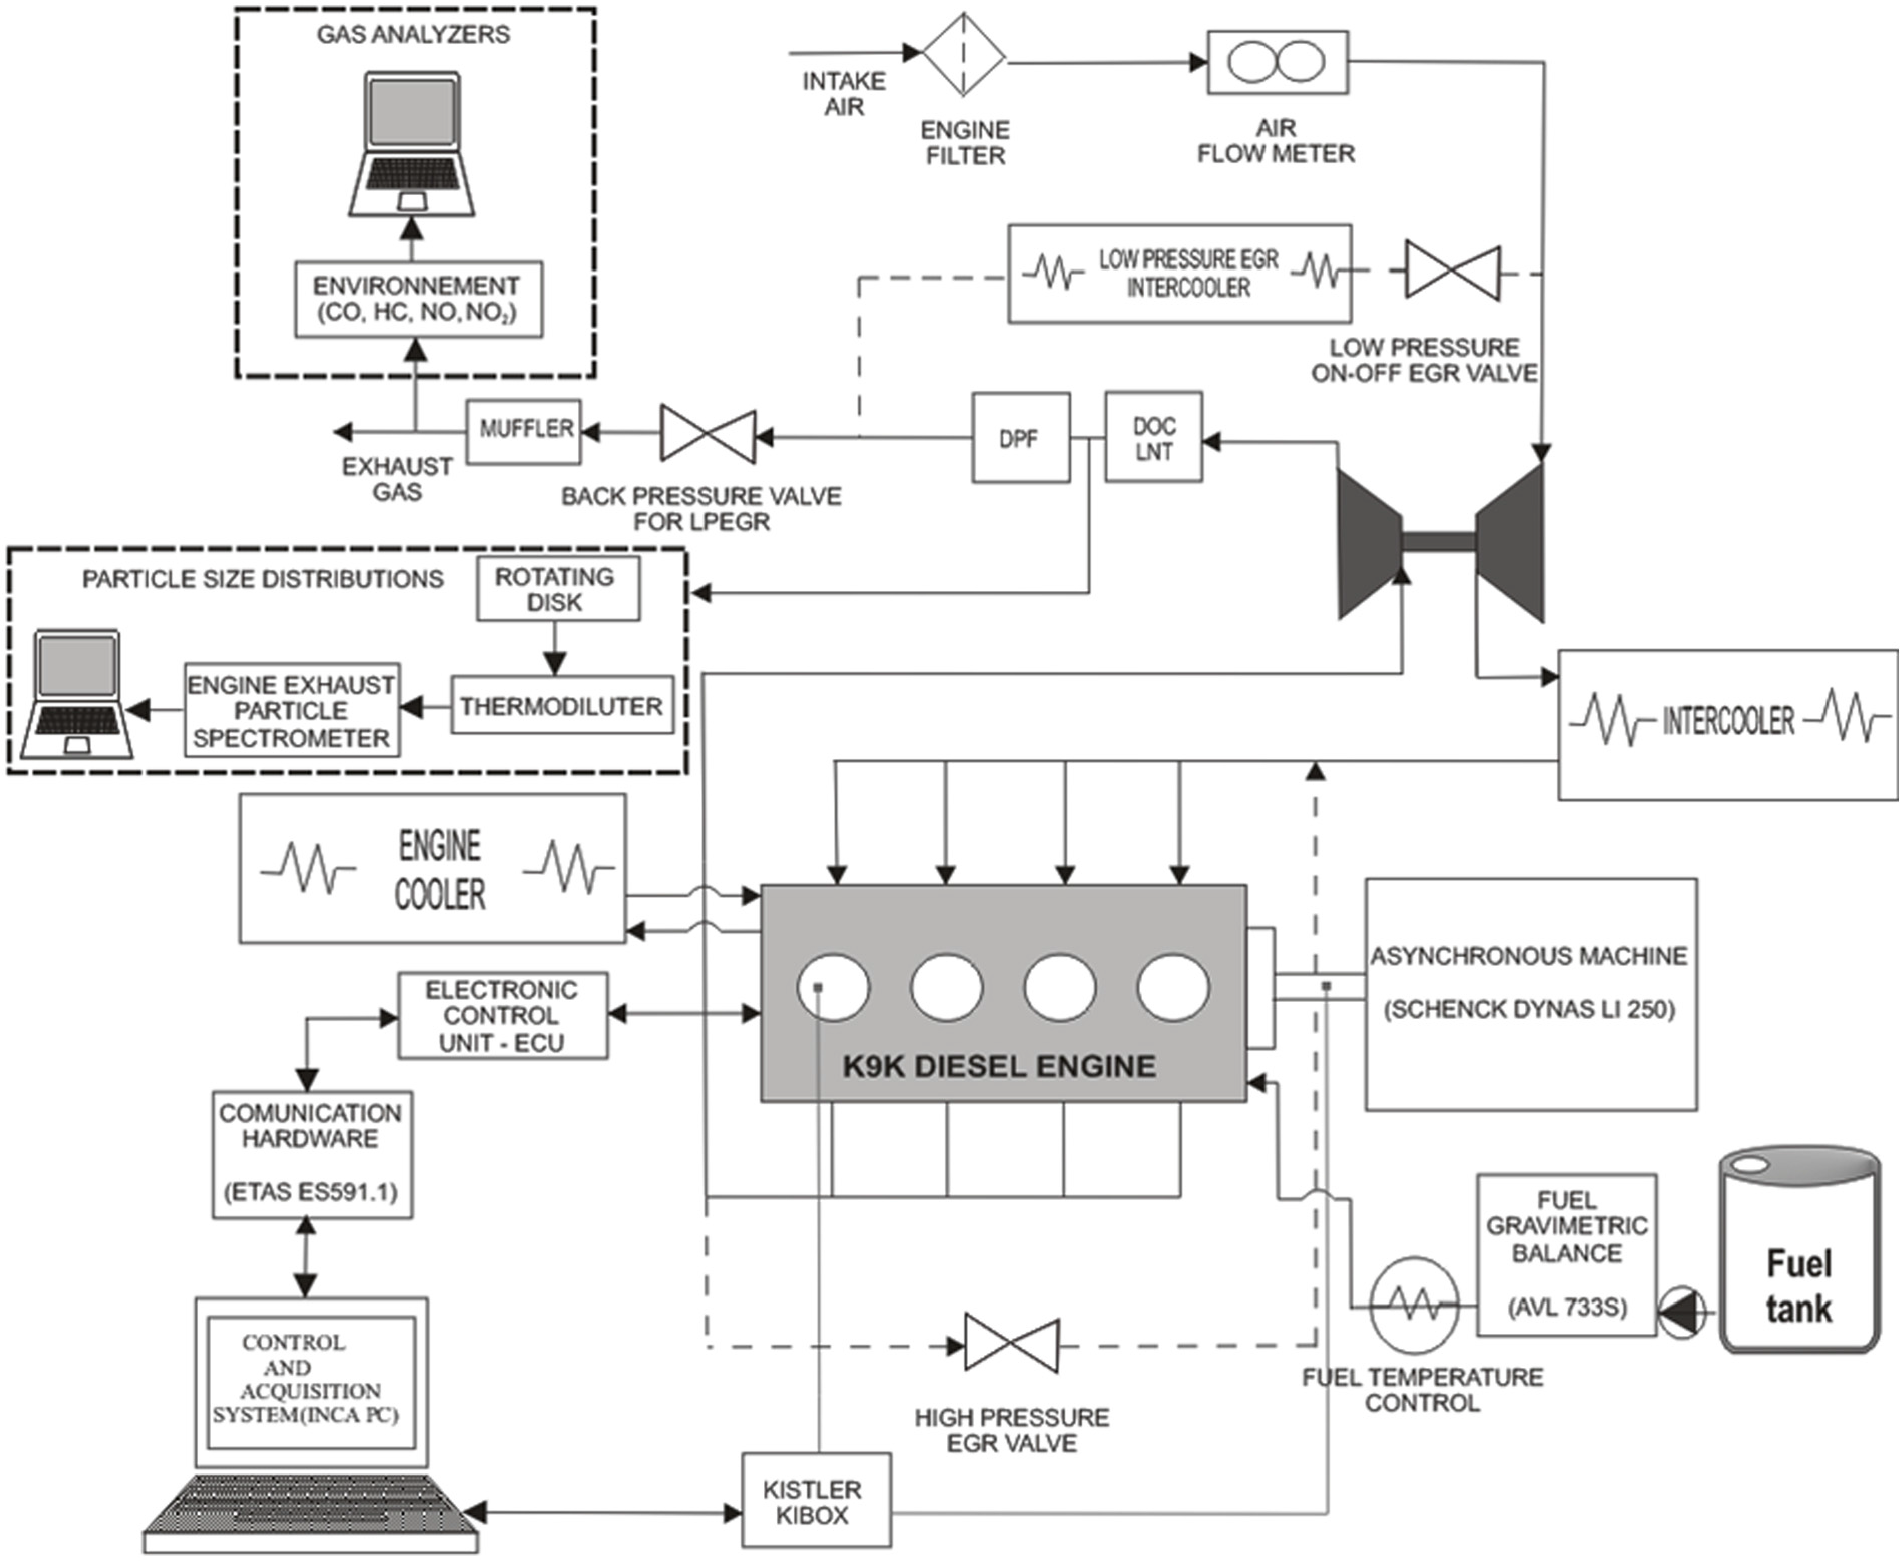
Scheme of the experimental installation.
Engine and vehicle characteristics.
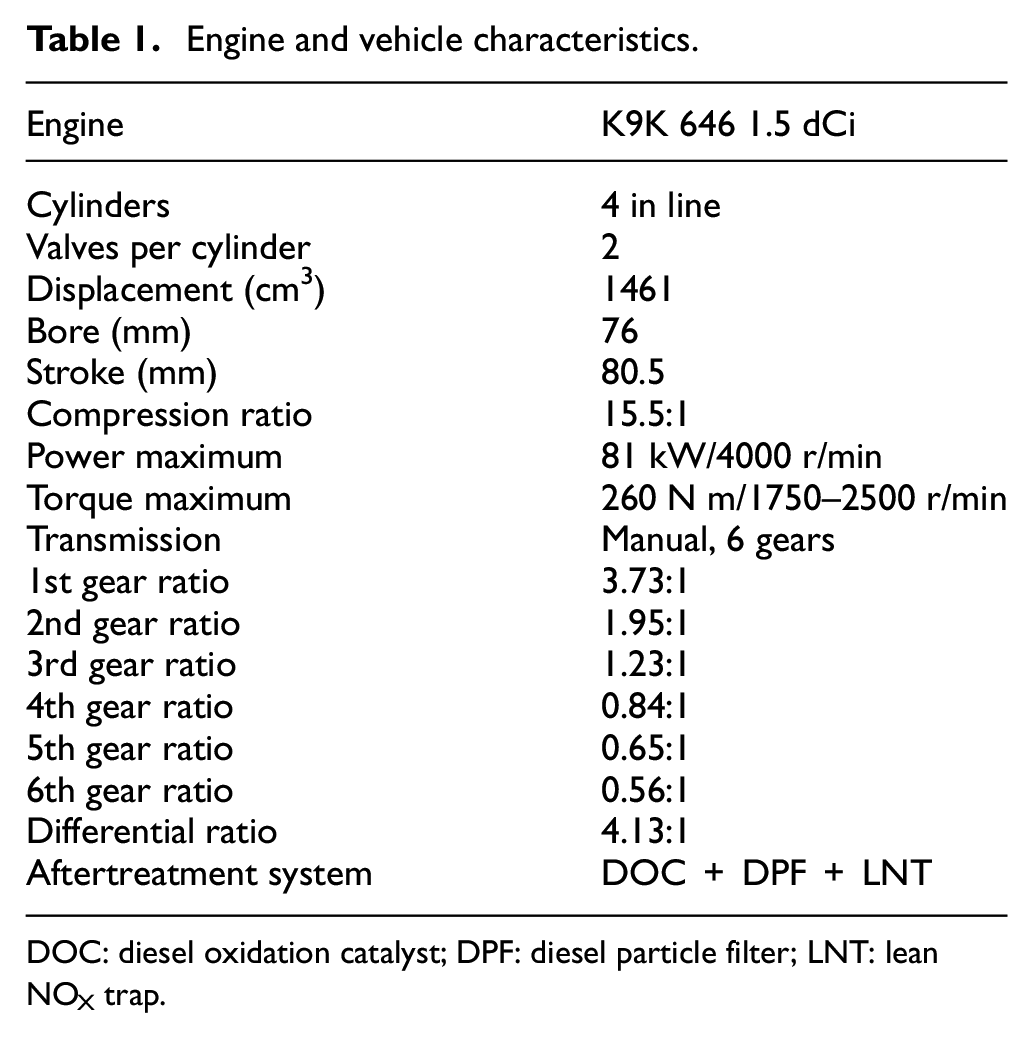
DOC: diesel oxidation catalyst; DPF: diesel particle filter; LNT: lean NOX trap.
The engine was coupled, with a rotating shaft, to an asynchronous electric dynamometer (Schenck Dynas III LI 250), which controls the engine speed and torque. The dynamometer was equipped with a Road Load Simulation (RLS) system from Horiba, with capability to simulate in the engine test bench the dynamics of a particular vehicle (transmission, gearbox, tyres, etc.). In this work, a Nissan Qashqai 1.5 dCi vehicle was simulated during the tests. This is the best-selling sport utility vehicle (SUV) vehicle in Europe. The engine tested was calibrated to power this vehicle with neat diesel.
The INCA PC software and the ETAS ES 591.1 hardware were used for the communication between the user and the electronic control unit (ECU) of the engine. The original settings of the mapping were not modified. Therefore, operating parameters such as fuel injection strategy, position of the EGR valves and boost pressure were not externally controlled during the tests. The inlet air mass flowrate and the fuel consumption were measured with the raw engine sensors and registered with the INCA PC software. The fuel consumption measurement was previously calibrated with an AVL 733s fuel gravimetric system. 30
It should be noted that the simulation performed with the RLS system may lead to slightly higher emissions with respect to those from the actual vehicle, for two reasons: (a) the driving cycle is generally followed in a smoother way by a human driver than by the RLS system, because the instantaneous torque is followed as a consequence of a closed-loop control, with a small inertia and (b) the information of the gear position, which is one of the variables used in the engine mapping, was not used as an input in the ECU because the gearbox is not included in the test bench.
Online thermodynamic combustion diagnosis was applied by means of a Kistler Kibox instrument. The following signals were registered: (a) in-cylinder pressure (measured by Kistler piezoelectric sensor model 6056AU20, located inside one of the cylinders), (b) energizing current of one of fuel injectors and (c) crank angle rotation angle. From these signals, different thermodynamic parameters related to the injection and combustion processes were determined, such as indicated mean effective pressure (imep), start of energizing (SoE), ignition delay (ID), start of combustion (SoC) (defined as the angle at which 5% of the heat release is achieved), apparent heat release (AHR) and the end of combustion (EoC) (defined as the angle at which the 90% of the heat release is achieved). 30
Particle size distributions were measured with an Engine Exhaust Particle Sizer (EEPS) Spectrometer model 3090 from TSI. The EEPS sampling point was placed upstream of the DPF. As the EEPS instrument needs special temperature and dilution conditions of the inlet gas, the sample gas was first diluted with a rotating disk diluter (RD) model MD19-2E using dilution air supplied by a thermal conditioner (TC) model ASET15-1. The diluted exhaust gas is introduced in the evaporating tube of the ASET15-1 where the temperature is increased to 300 °C. After that, the aerosol flows into a mixing chamber for the second dilution in order to cool down the aerosol temperature and to reduce the thermophoretic losses. The RD temperature was set at 150 °C to avoid hydrocarbon condensations. Dilution factors and thermophoretic and diffusion losses were taken from the calibration certificates provided by Matter Engineering AG. Primary dilution factor at RD was 64.73:1 and secondary dilution factor at the TC was 6.18:1, leading to a total dilution factor of 400:1.
The total hydrocarbon emissions (THC) were sampled through a heated line, pump and filter (190 °C) and were measured with a flame ionization detector Graphite 52M-D. Carbon monoxide and carbon dioxide emissions were measured with a Non-Dispersive Infrared (NDIR) detector MIR 2M. NOX emissions were measured using a chemiluminescence Topaze 3000 analyzer. All these emission analyzers are integrated in a modular system purchased from Environnement, which also includes the electro-valves and software necessary to commute between sample gas, zero gas and calibration gases. 31
Fuels and test cycle
The main properties and reference standard methods of pure fuels and blends tested are shown in Table 2. Most of the properties were measured following standard methods. If they were not measured, the source is indicated in the footnotes.
Main properties of tested fuels.
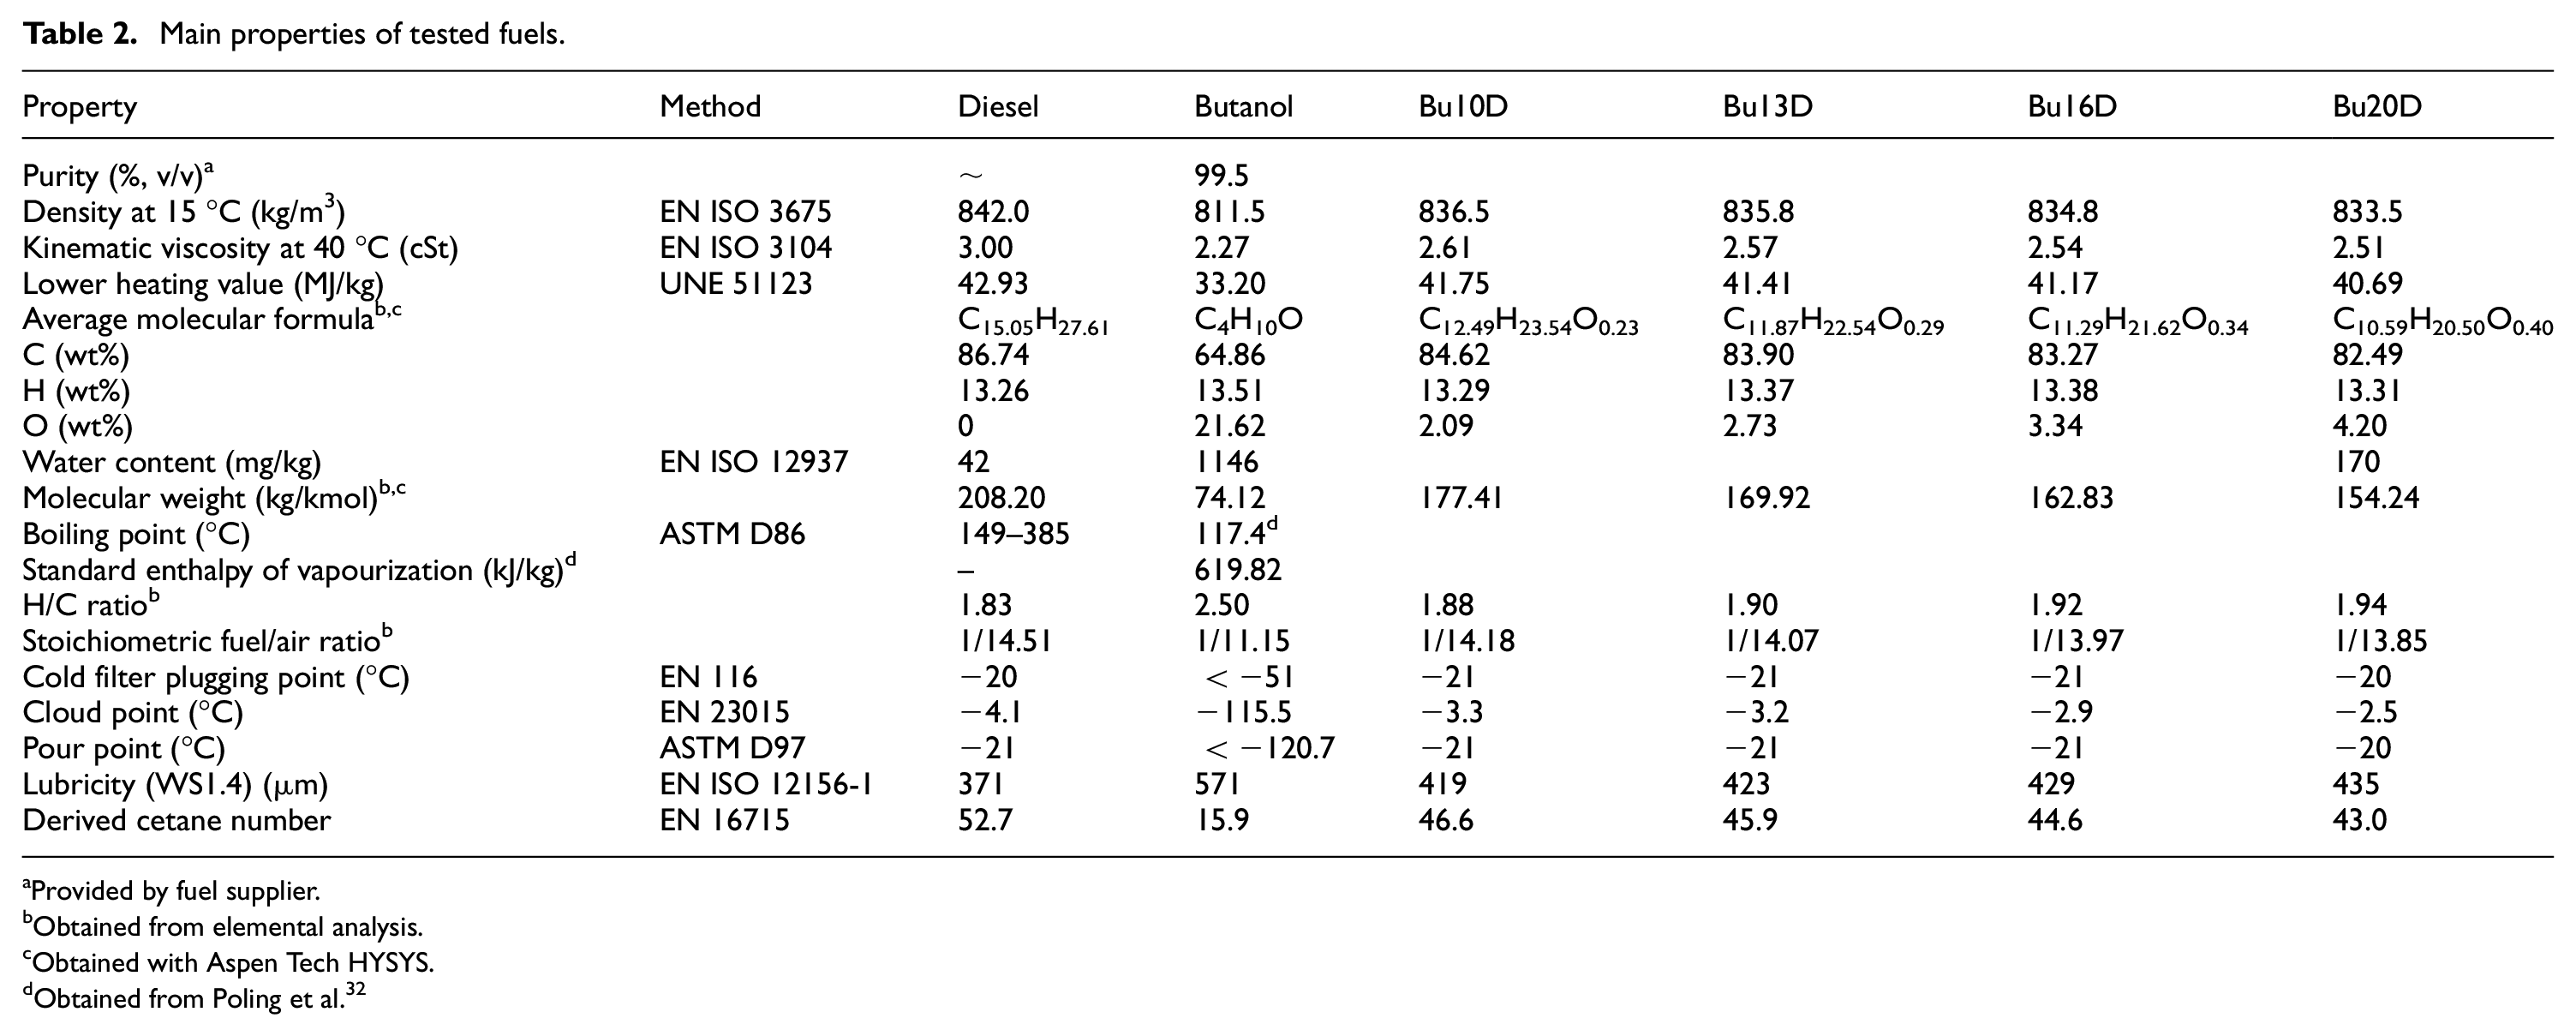
Provided by fuel supplier.
Obtained from elemental analysis.
Obtained with Aspen Tech HYSYS.
Obtained from Poling et al. 32
The diesel fuel used was supplied by Repsol (Spain) and it fulfils the European standard EN 590. Its characteristics are common with those of many diesel fuels supplied by petrol stations in Europe in winter season. However, it was selected with no biodiesel content (and thus with no oxygen content) because the aim of this study is to explore the effect of replacing the usual (and future) biodiesel content with an alternative advanced biofuel. N-butanol was donated by Green Biologics Ltd. (Consortium member of ButaNexT Project) and ethanol was purchased from PanReac AppliChem.
For this study, diesel blends with n-butanol at 10%, 13%, 16% and 20% (volume basis) were tested in the engine test bench at ambient temperature. Higher n-butanol contents were discarded because the low cetane number and the high enthalpy of vapourization (see Table 2) of n-butanol would lead to cold start problems. Additionally, closer n-butanol contents were tested between 10% and 20% (such as 13% and 16%) trying to find the minimum particle emissions (both in number and mass), as shown below. All the tests were repeated three times in different days, in order to guarantee cold start conditions.
The NEDC is a certification driving cycle designed to evaluate emissions and fuel consumption from light duty vehicles. The whole cycle includes four urban driving subcycles repeated without interruption and an extra-urban driving subcycle. Before the tests, the vehicle remained for at least 6 h at a temperature between 20 °C and 24 °C. This range is narrower than that allowed by the regulation. 28
Results and discussion
The main aim of this study is to evaluate the emission benefits from the use of n-butanol as a blend component. Therefore, prior to the emission results, some other relevant engine parameters (such as fuel/energy consumption, equivalence ratio, EGR ratio and engine temperatures) are presented because they are useful to explain the emissions results.
Specific fuel and energy consumption
The instantaneous fuel consumption and the total accumulated fuel consumption results are shown in Figure 2. Since oxygenated fuels have lower heating values, fuel consumption increases slightly with respect to reference diesel fuel. Maximum fuel consumption was measured for blend with 20% butanol (Bu20D) due to its lowest heating value (see Table 2).
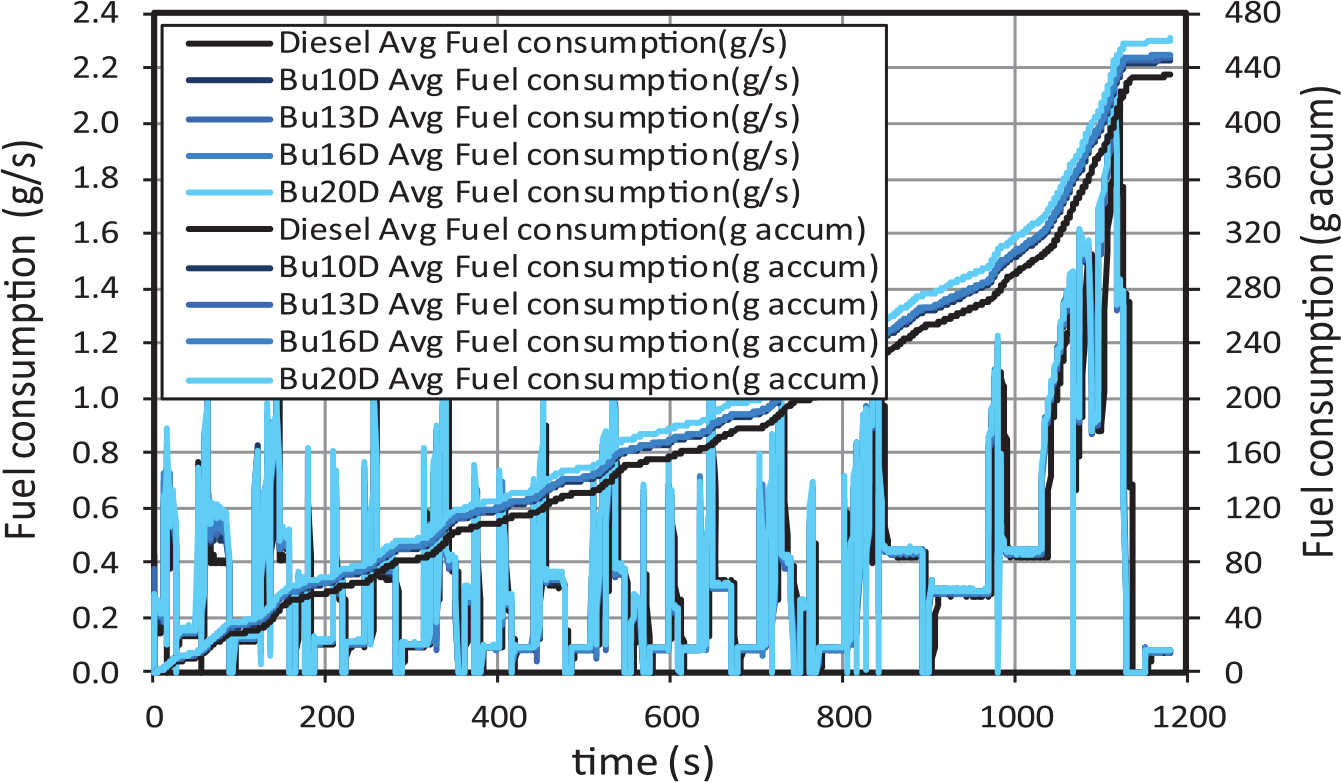
Fuel consumption for butanol–diesel blends.
It is interesting to observe that intense fuel consumption peaks are associated with accelerations. These fuel consumption peaks decrease in intensity (for all fuels) as the engine temperature increases. On the contrary, during decelerations, two stages can be distinguished. In the first stage of each deceleration (with engine speed higher than 1000 r/min), fuel consumption is nil, because the engine speed is still enough to sustain the engine idle. At this condition, the engine inertia is compensated with pumping losses, leading to negative effective power (the engine operates as a compressor). In the second stage of each deceleration (with engine speed lower than 1000 r/min), the engine inertia is already insufficient to compensate the mechanical losses, and therefore, idle regime speed is re-established, leading to a fuel consumption of around 0.1 g/s (when the engine is hot) and to almost 0.2 g/s (when the engine is still cold).
Energy consumption (inversely proportional to the engine efficiency) is determined as the product of the fuel consumption and its lower heating value. Instantaneous rate of energy consumption (MW) and accumulated energy consumption (MJ) are shown in Figure 3. As can be observed, the above described differences in fuel consumption almost disappear in terms of energy consumption as a consequence of the lower heating value of n-butanol. This implies that the use of n-butanol in the blends does not lead to any decrease in the engine efficiency.
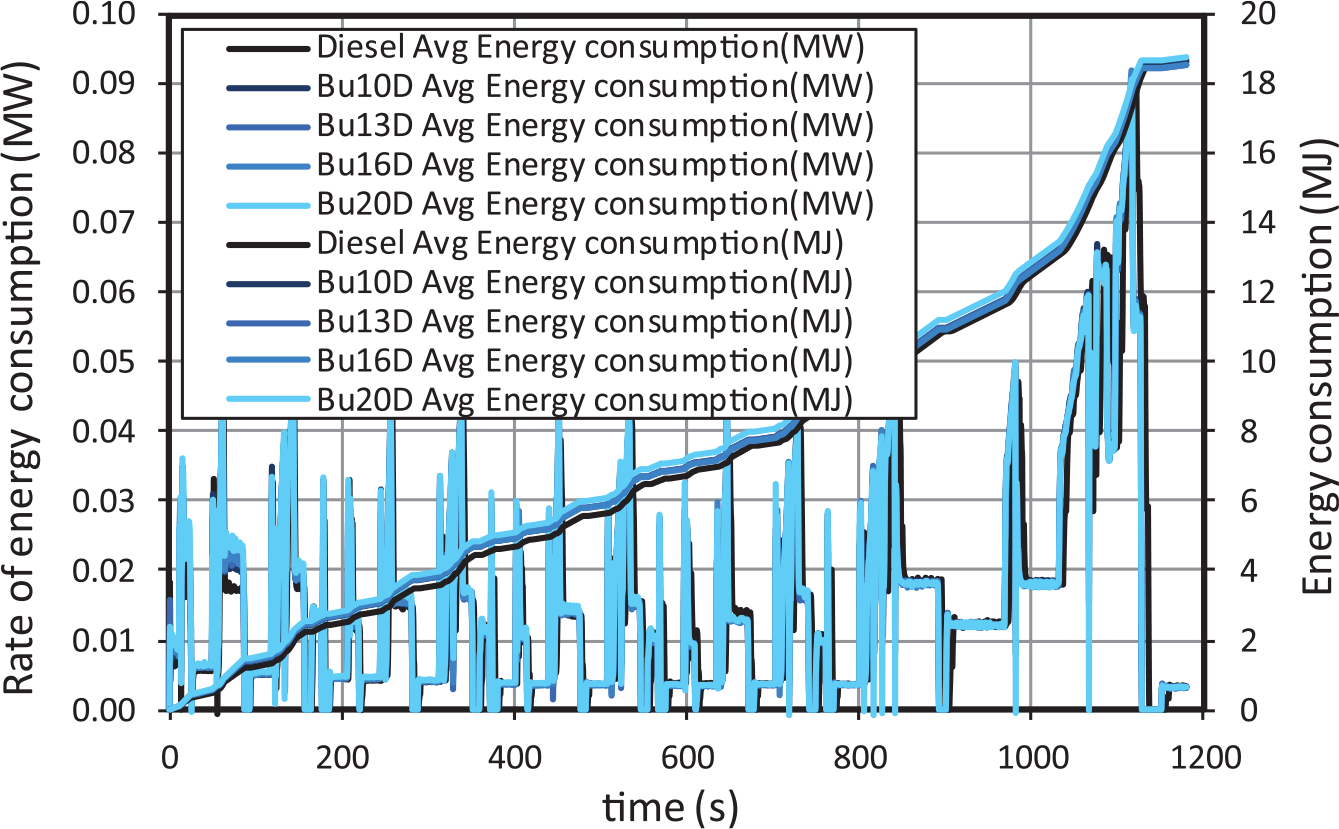
Rate of energy consumption for butanol–diesel blends.
Equivalence ratio
Equivalence ratio is defined as the ratio between the actual fuel/air mass ratio and the stoichiometric fuel/air ratio. Equivalence ratios higher than one correspond to rich combustion (very unusual in diesel engines, at least when the NEDC cycle, with no sharp accelerations, is followed) and equivalence ratios lower than one correspond to lean combustion. As observed in Figure 4, equivalence ratios remain always below one, with two exceptions: (a) in the extra-urban accelerations, for very small periods of time and (b) when the simulated vehicle reaches 100 km/h (second 1075), when LNT regeneration becomes active (for all tests). Equivalence ratios at steady conditions are lower in urban subcycles than in the extra-urban one and decrease slightly as the engine gets hotter. In the first stage of decelerations (with engine speed higher than 1000 r/min), the equivalence ratio is nil, consistently with the nil fuel consumption already described. The main conclusion from Figure 4 is that there are no significant differences in equivalence ratio between different fuels, and therefore, differences in emissions should not be attributed to equivalence ratio in any case.
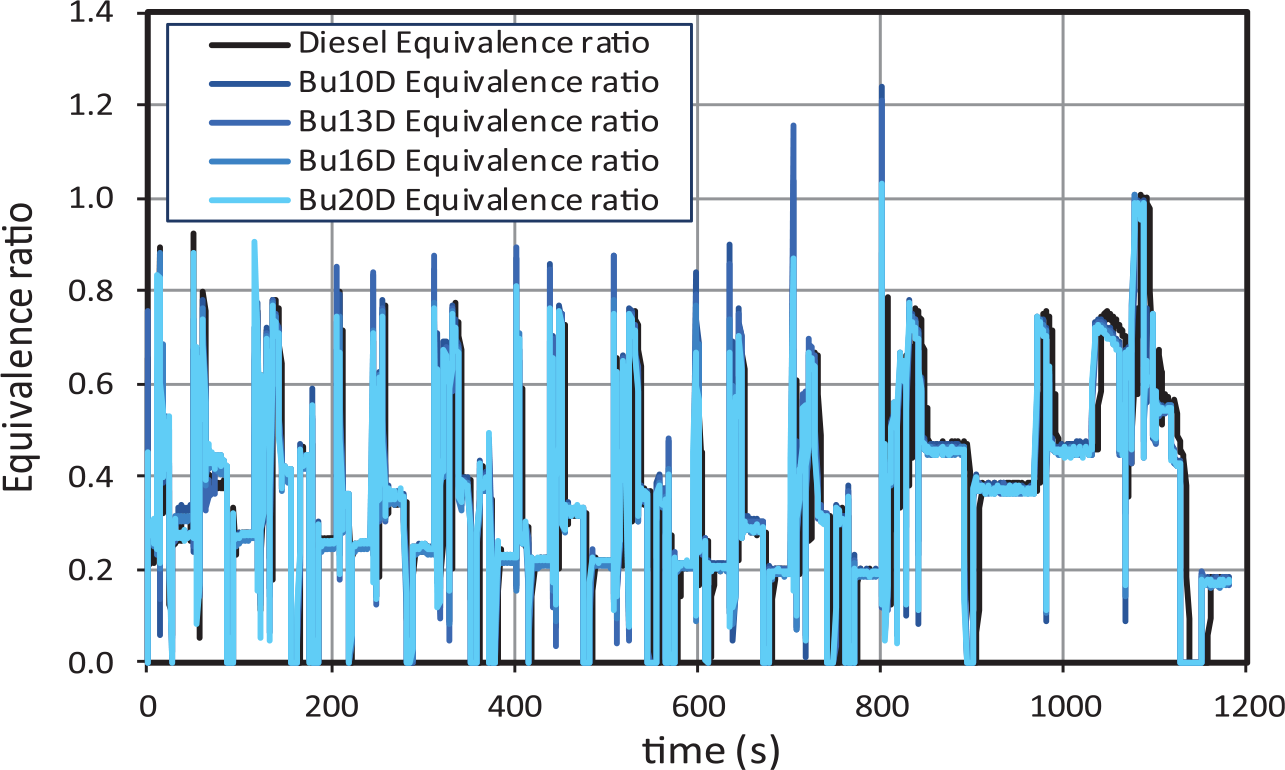
Equivalence ratio for butanol–diesel blends.
EGR and engine temperatures
As shown Figure 5, the EGR ratio is not constant along the NEDC. From the start of the cycle until approximately the second step of the fourth urban subcycle, HPEGR is used for all tests. When the coolant temperature reaches 65 °C, the LPEGR, which is more effective to reduce NOX emissions than HPEGR, becomes active instead.
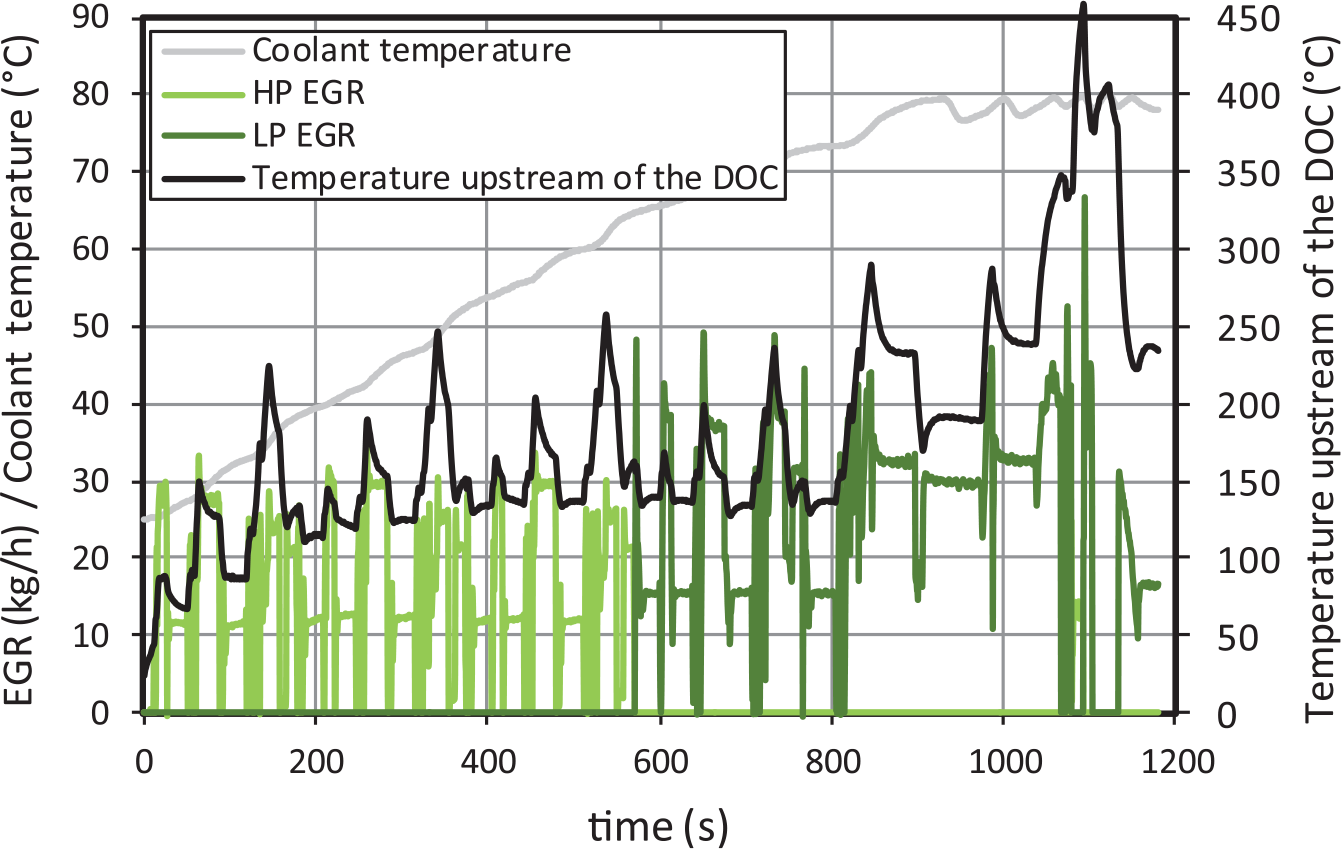
EGR, coolant temperature and temperature upstream of the DOC for diesel fuel (as example).
The instantaneous temperature upstream of the DOC along the NEDC cycle is also shown in Figure 5. As this temperature is similar for all blends tested, only that for diesel fuel is shown as an example. Such similarity between temperature traces suggests that any difference observed in the oxidation catalyst efficiency should be attributed to the exhaust gas composition, but not to the DOC temperature.
Combustion diagnosis
This section shows selected results for injection delay angles and for combustion timing, which are useful for the interpretation of emission results. Figure 6 shows the instantaneous ID angles along the NEDC cycle. In all cases, IDs decrease as the engine gets hotter. This can be observed clearly from the start of the cycle to the shift from HPEGR to LPEGR (approximately the second step of the fourth urban subcycle). Also, ignition delays increase during the extra-urban subcycle, i.e. from 780 onwards, for two reasons: a) HPEGR is switched to LPEGR, which has higher cooling potential, and b) injection timing is sharply advanced.
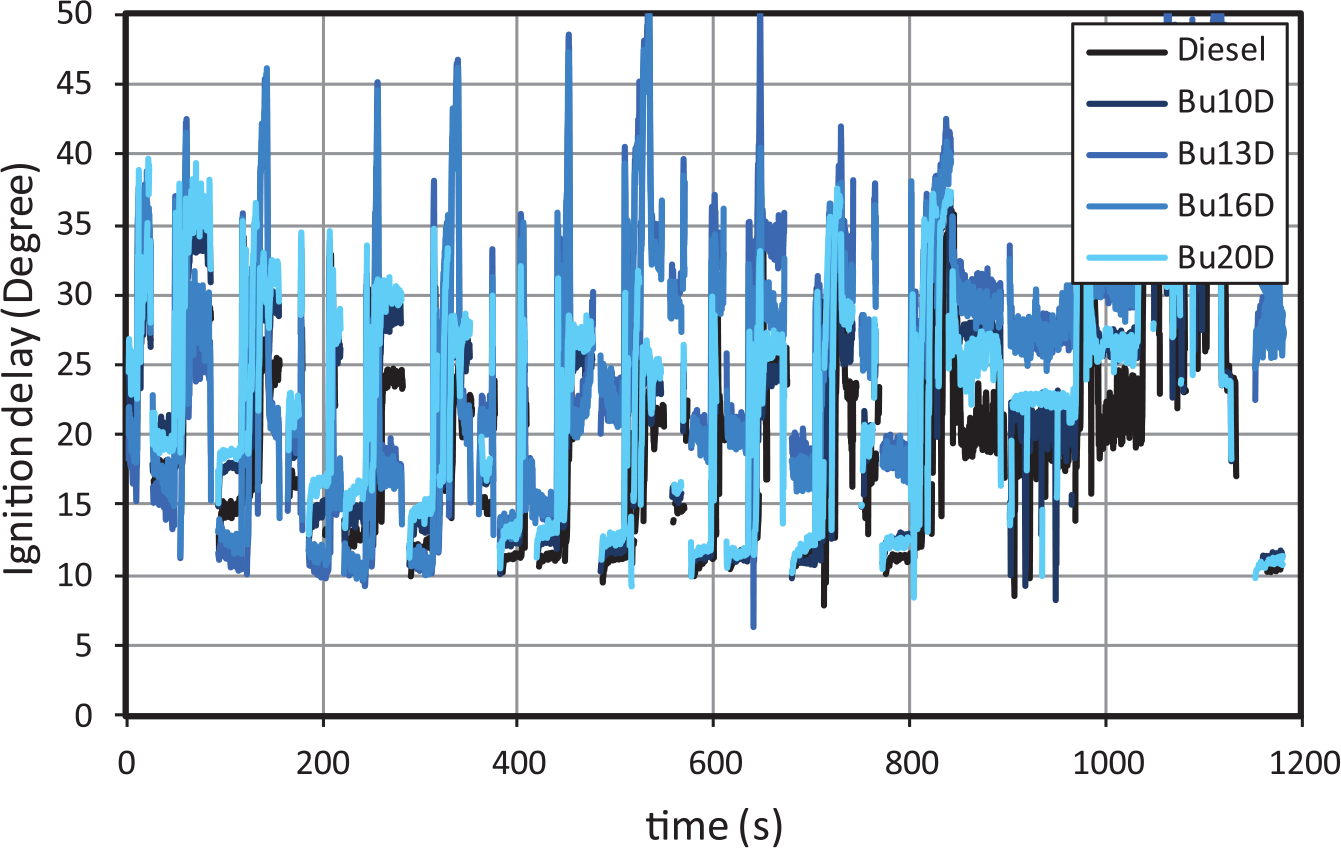
Ignition delay for butanol–diesel blends.
With regard to the effect of fuels, as observed in Figure 7, the ID increases for increasing butanol contents. 10 Such increase is more noticeable during high/medium load conditions (due to the larger injection advance) than during idle conditions. Opposite to the higher ID for butanol blends, the combustion duration (difference between EoC and SoC) becomes lower for increasing butanol content. This can be explained by a twofold effect: (a) the higher premixed/diffusion ratio derived from the increased delay time and (b) the higher flame velocity of butanol, as proved in laminar flame experiments. 33
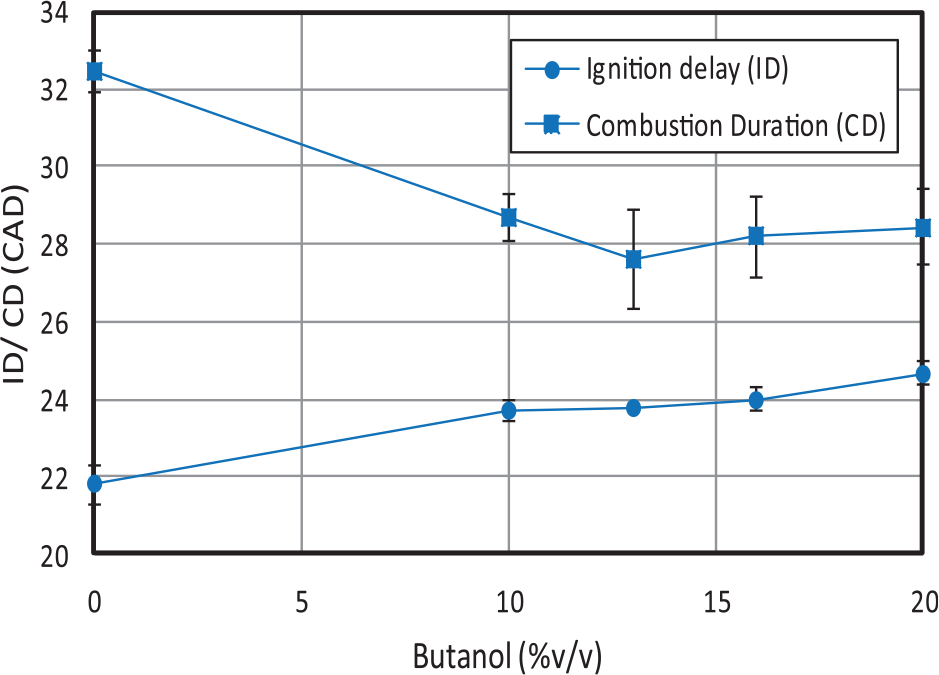
Average ignition delay and combustion duration.
Gaseous emissions
In general, CO (Figure 8) and HC emissions (Figure 9) are associated with cold-engine start conditions. In fact, around 70% of the final CO emissions occurs during the first 70 seconds of the cycle (which lasts 1180 s). Both gaseous emissions increase very significantly for increasing butanol contents with respect to diesel fuel, as shown in Figure 10, in agreement with other studies. 34 Specifically, Bu20D increases CO emissions around 135% and HC emissions around 273% with respect to diesel fuel. The increase in CO emissions is much higher from diesel to 10% butanol than from 10% to 20% butanol.
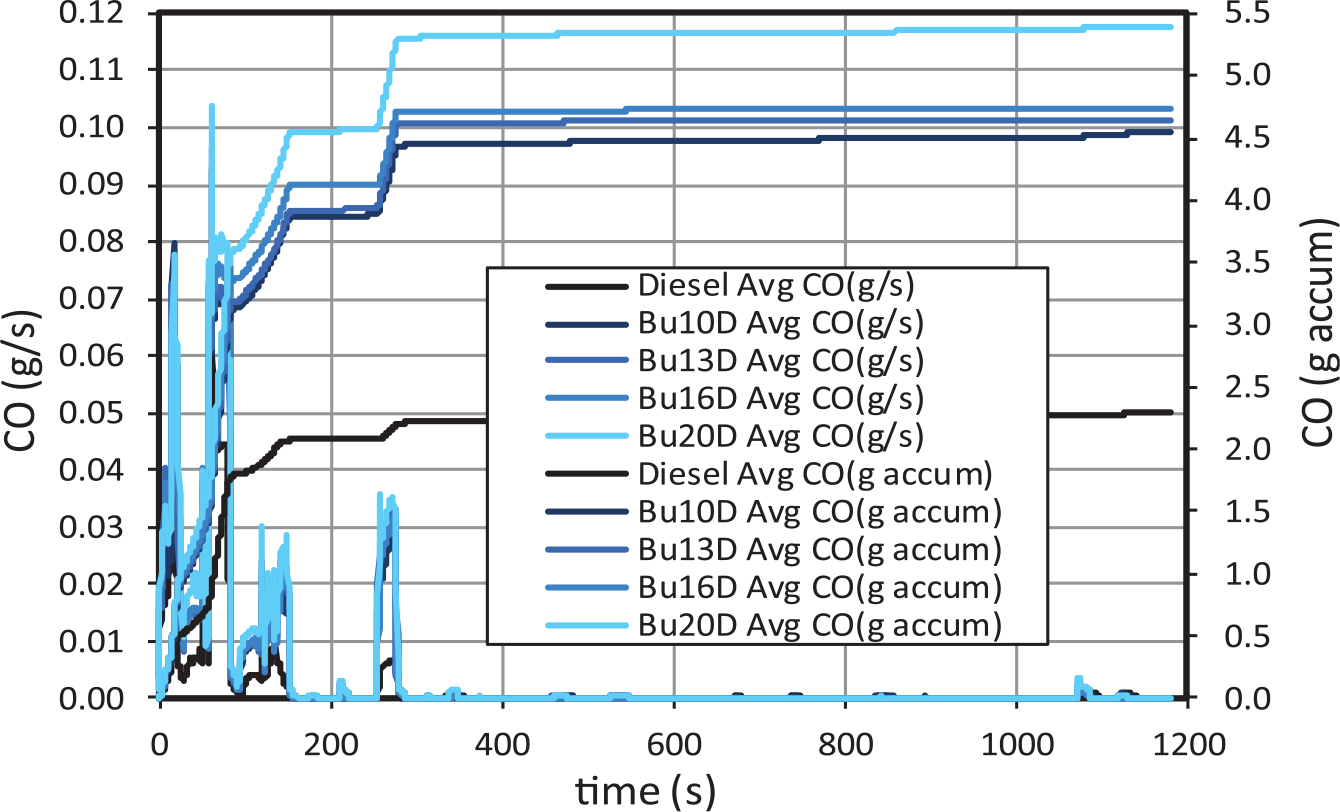
CO gaseous emissions for butanol–diesel blends.
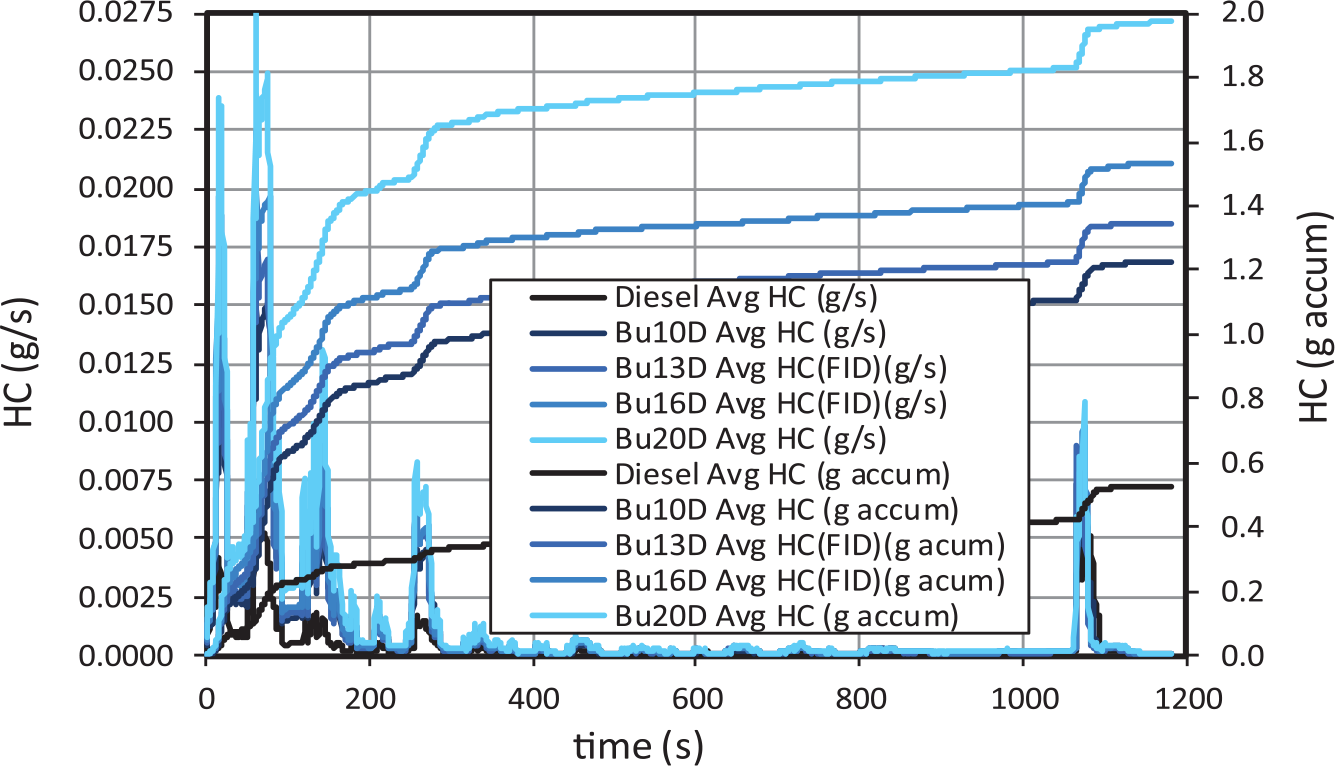
HC gaseous emissions for butanol–diesel blends.
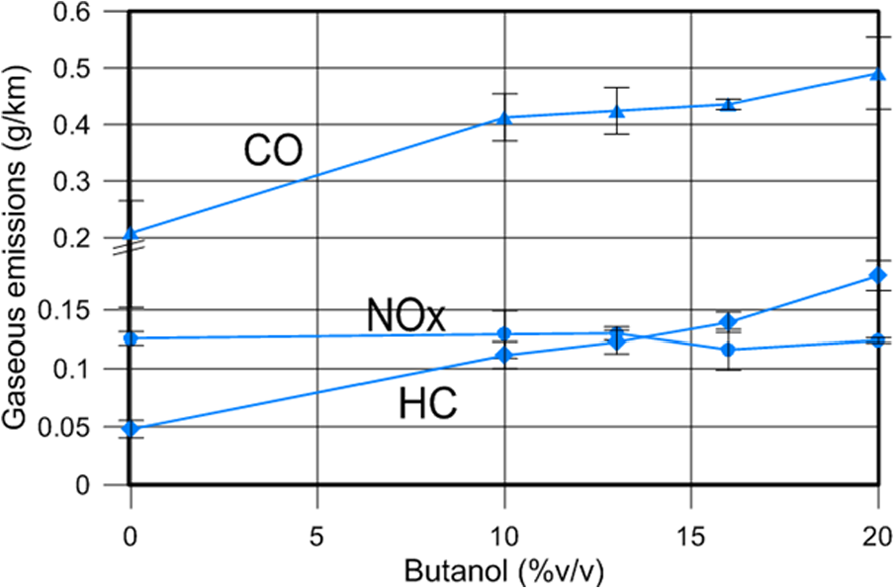
Average CO, HC and NOX gaseous emissions.
The main reason for such increase in both emissions is that n-butanol is much more volatile and diffusive than diesel fuel. At the combustion chamber temperature conditions and with such a high injection pressure, butanol vapours are rapidly diluted on excess air and the flame hardly propagates towards the lean regions away from the fuel spray. This overleaning effect has also been observed in dual-fuel diesel engines operating with natural gas or syngas. 35 Also the higher enthalpy of vapourization of butanol (see Table 2) may contribute to such increase in CO and HC emissions, at least in the first part of the cycle (when the engine is still cold), because evaporation reduces local temperature, thus reducing combustion efficiency.
Nitrogen oxides emissions become much more intense from the start of the extra-urban cycle for all fuels (and especially when the engine simulates more than 100 km/h), as a consequence of the sudden increase of load, despite the low-pressure EGR being active during the whole extra-urban subcycle. The LNT regeneration, which was triggered when the simulated vehicle velocity reached 100 km/h, has also some contribution to this sudden increase. In fact, more than 60% of the total NOX emissions occurred in the extra-urban subcycle, in all cases. During urban subcycles, NOX instantaneous emissions decrease as the engine gets hotter (Figure 11).
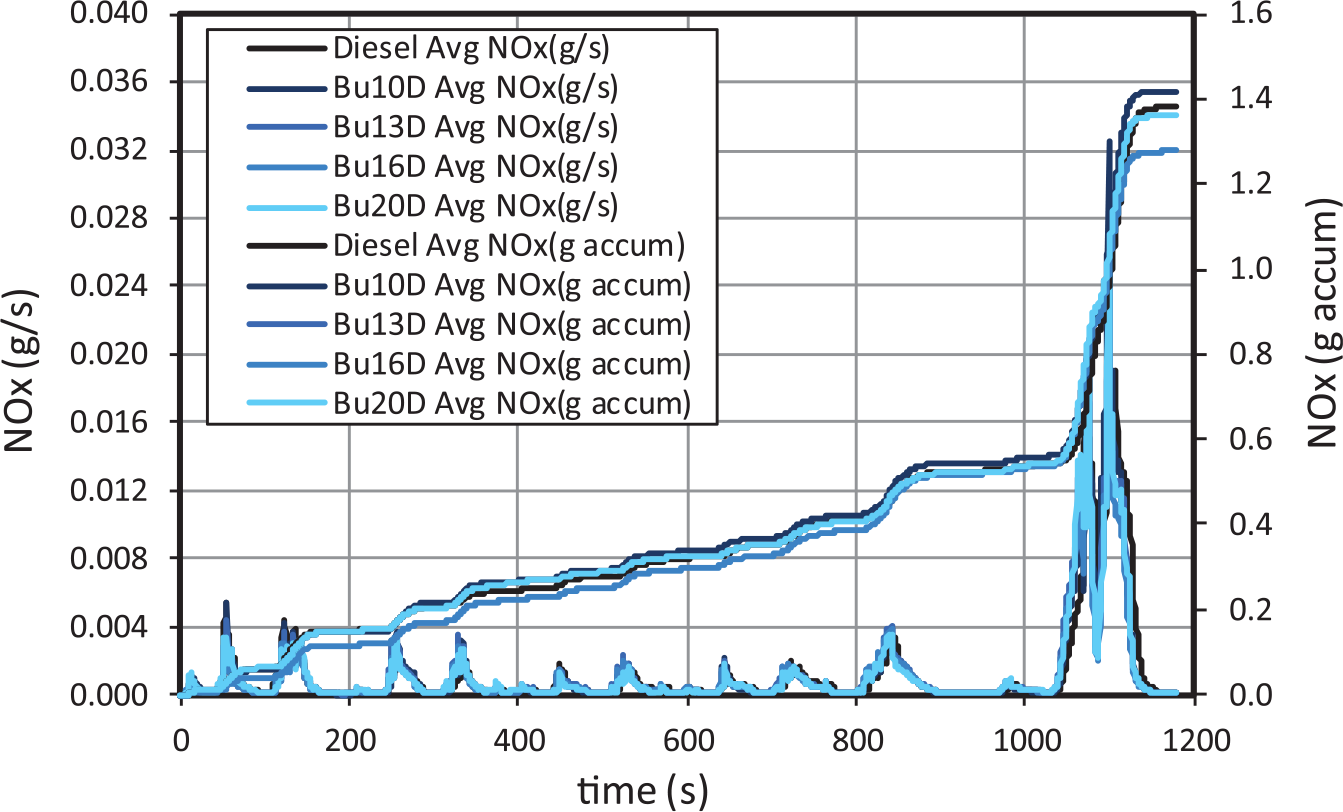
NOX gaseous emissions for butanol–diesel blends.
As the EGR ratio is equal for all the blends tested, it can be concluded that increasing butanol contents do not affect NOX emissions significantly, as shown in Figure 10. In diesel engines with advanced injection timing (such as those previous to Euro 4), increases in the ID usually led to increases in premixed combustion, and thus to higher temperature peaks and NOX emissions. 18 On the contrary, in diesel Euro 5 and Euro 6 engines, injection processes are, in general, much more delayed (to avoid NO formation), and therefore, increases in the ID does not necessarily lead to any increase in temperature peaks and NOX emissions. Additionally, in the case of butanol blends, the whole combustion timing is maintained with increasing butanol content, because as shown above, larger IDs are compensated with shorter combustion durations.
Particle emissions
Particles were sampled upstream of the DPF in all cases. Although following the Directive 692/2008, 28 only particles with diameters larger than 23 nm should be counted, in order to extend the information, particles were measured within the range of 5.6−560 nm. Particle number and particulate mass engine-out emissions are highly dependent on the engine temperature and on the oxygen concentration in the intake charge, which is reduced as the EGR is increased.
Particle number (PN) emissions, both instantaneous and accumulated, are shown in Figure 12. The highest rate of particle emissions is observed in the extra-urban accelerations. The main reason is the higher equivalence ratio at these conditions (see Figure 4). Also significant emission rates are observed in the urban accelerations when the engine is still cold, despite only high-pressure EGR is active. As it gets hotter, the emission rates decrease substantially.
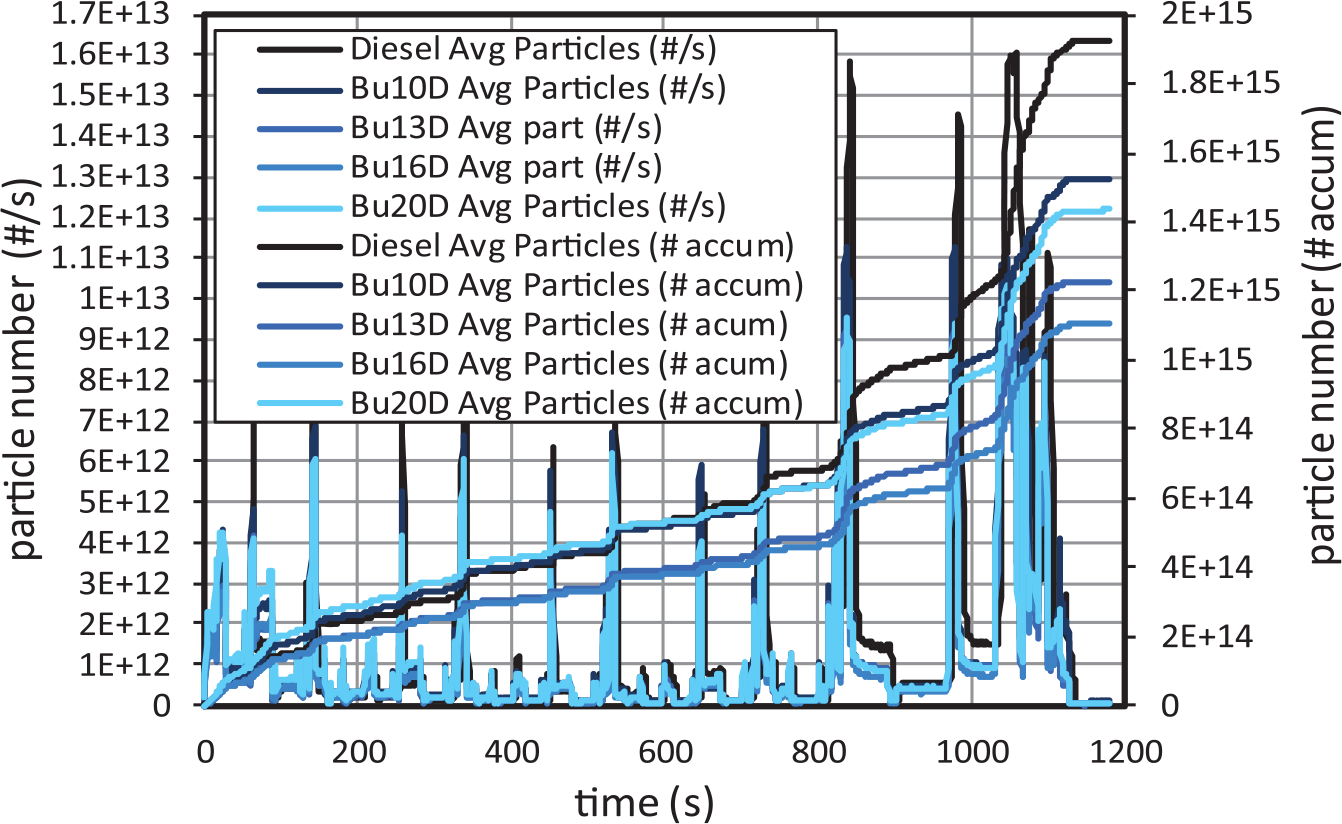
Particle number emissions for butanol–diesel blends.
In general, it is observed that the particle number and particle mass (PM) emissions are reduced because the O2 present in the butanol molecule favours the soot oxidation, and the aromatic content (which is reduced as the butanol content increases) favours soot formation. The main benefit of butanol with respect to diesel fuel in terms of particle number emissions occurs during the extra-urban subcycle (Figure 12) because at these conditions, the equivalence ratio is much higher, in general, than in the urban subcycles. On the contrary, the highest amount of particles emitted during the first urban subcycle corresponds to the highest butanol contents.
Figure 13 shows that the highest particle number reduction is reached with blend Bu1D (around 43% with respect to diesel fuel). In Figure 14, particles smaller than 23 nm (unregulated) and higher than 23 nm (regulated) are shown separately. For increasing butanol contents, as shown in Figure 14(a), the number of liquid-nucleation particles remains approximately constant up to a certain n-butanol content, from which the amount of these smallest particles starts to increase, probably as a consequence of the saturation of the specific surface area, where hydrocarbons are absorbed. Two factors may contribute to such saturation: (a) the highest HC concentration (and thus nucleation) for Bu20D and (b) the lowest formation of soot agglomerates for this blend (except in the first urban subcycle when the engine is still cold). The mean diameter (Figure 15) is reduced for increasing butanol contents despite the highest amount of larger particles (higher than 23 nm), in agreement with other previous studies.25,34
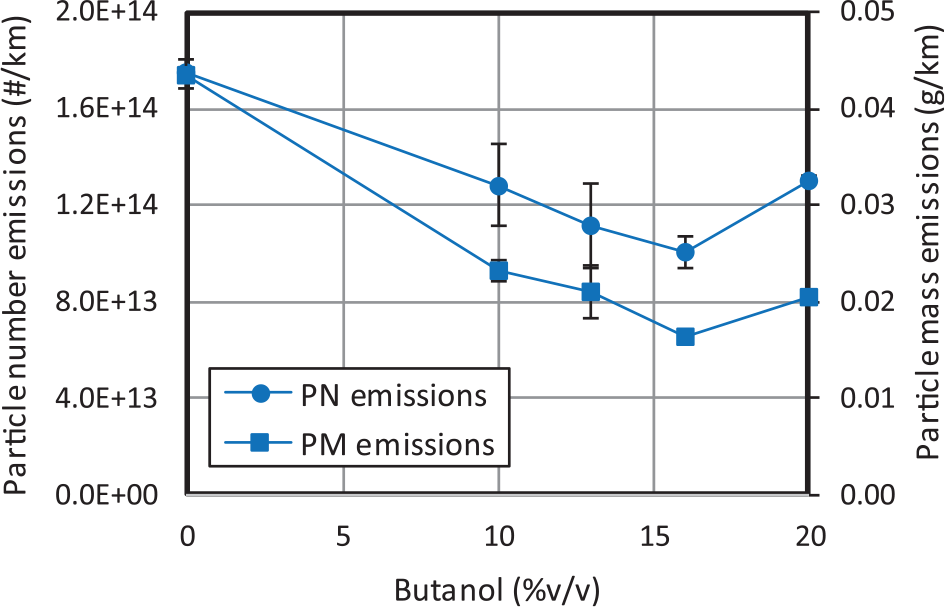
Average particle number and mass emissions.
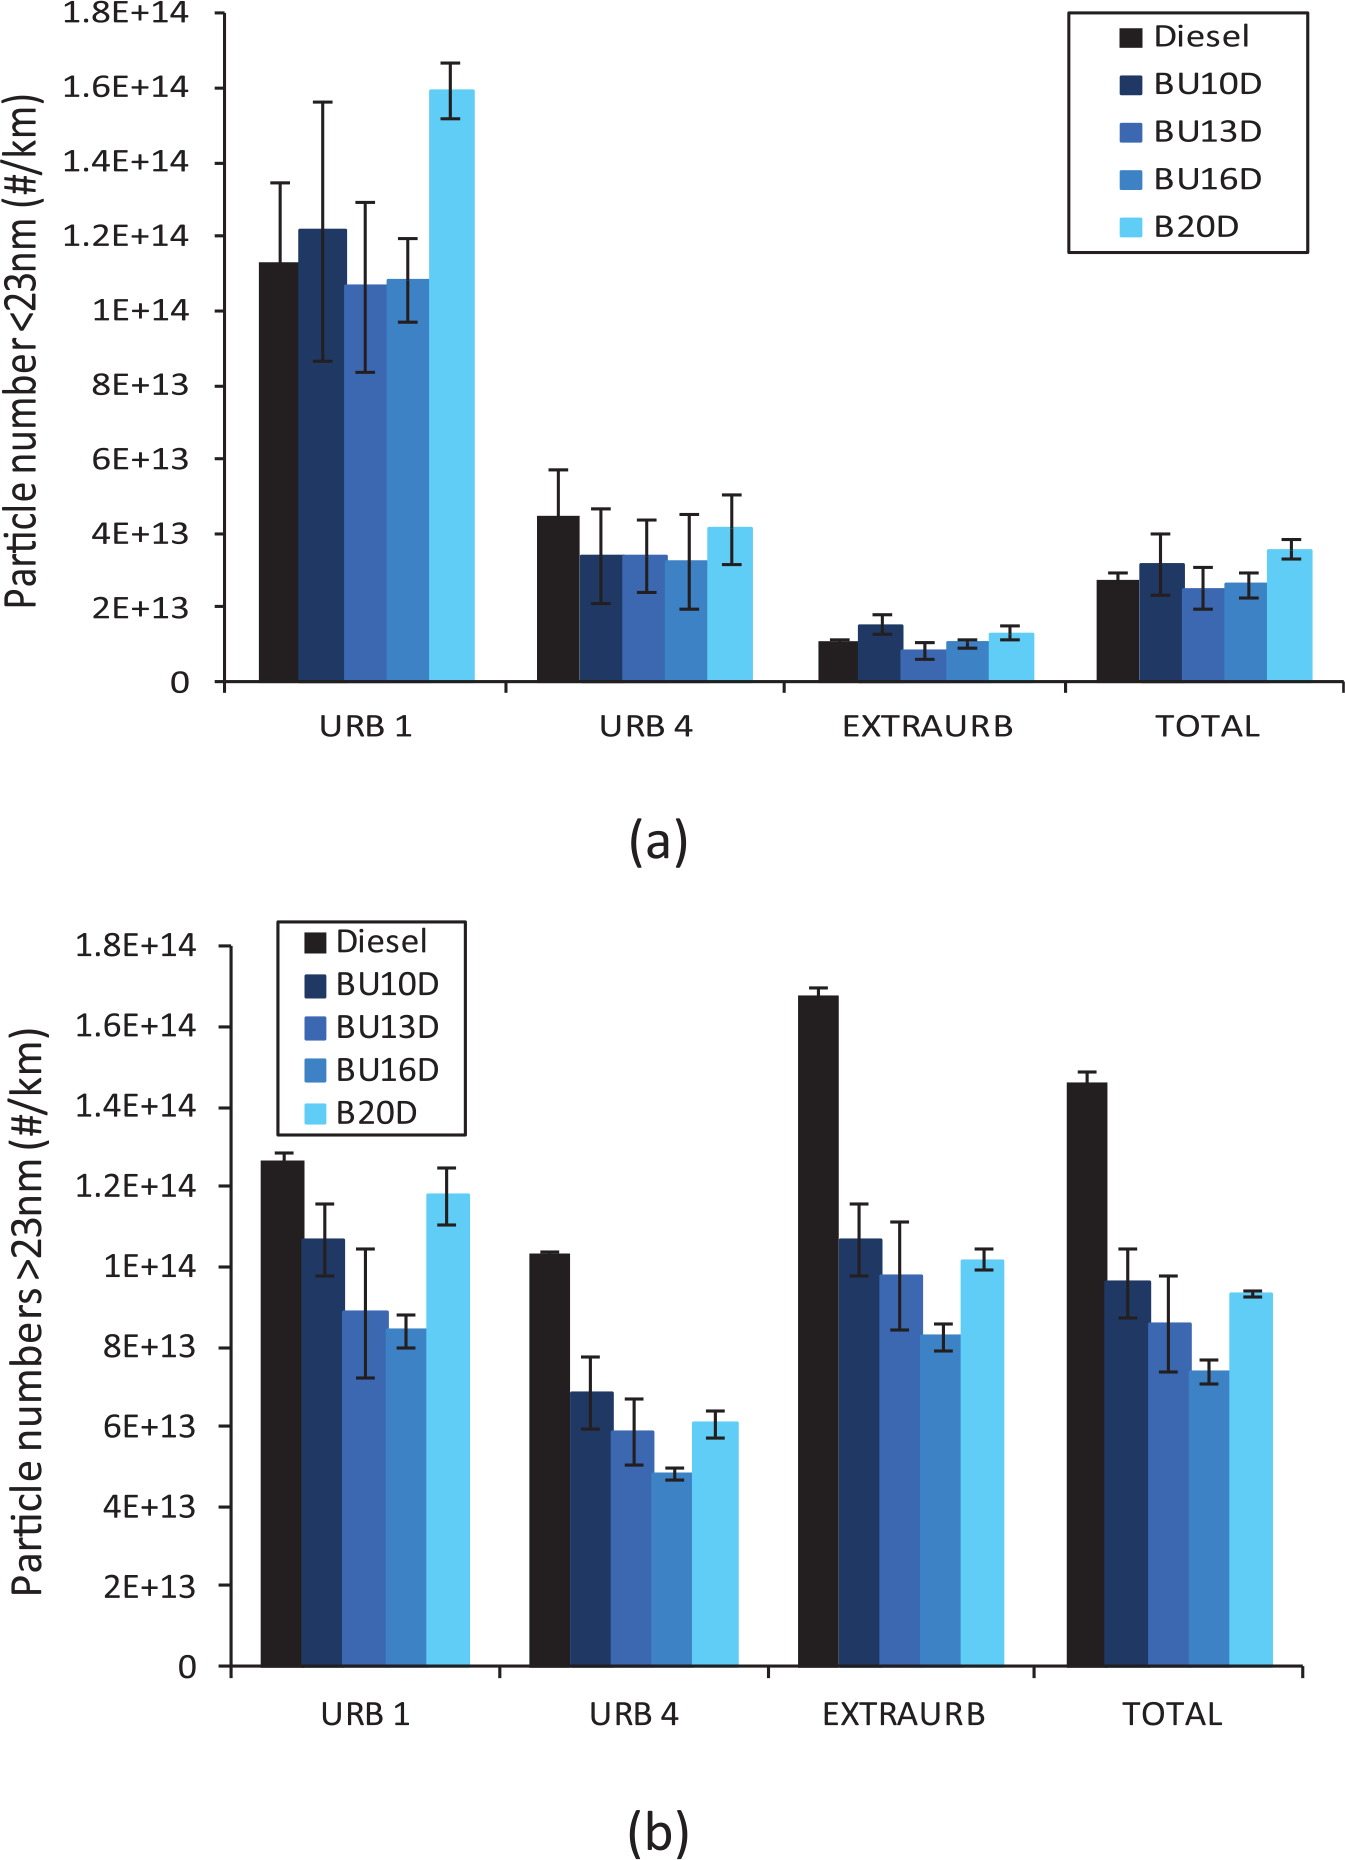
Particle number emissions for butanol blends: (a) lower than 23 nm and (b) higher than 23 nm.
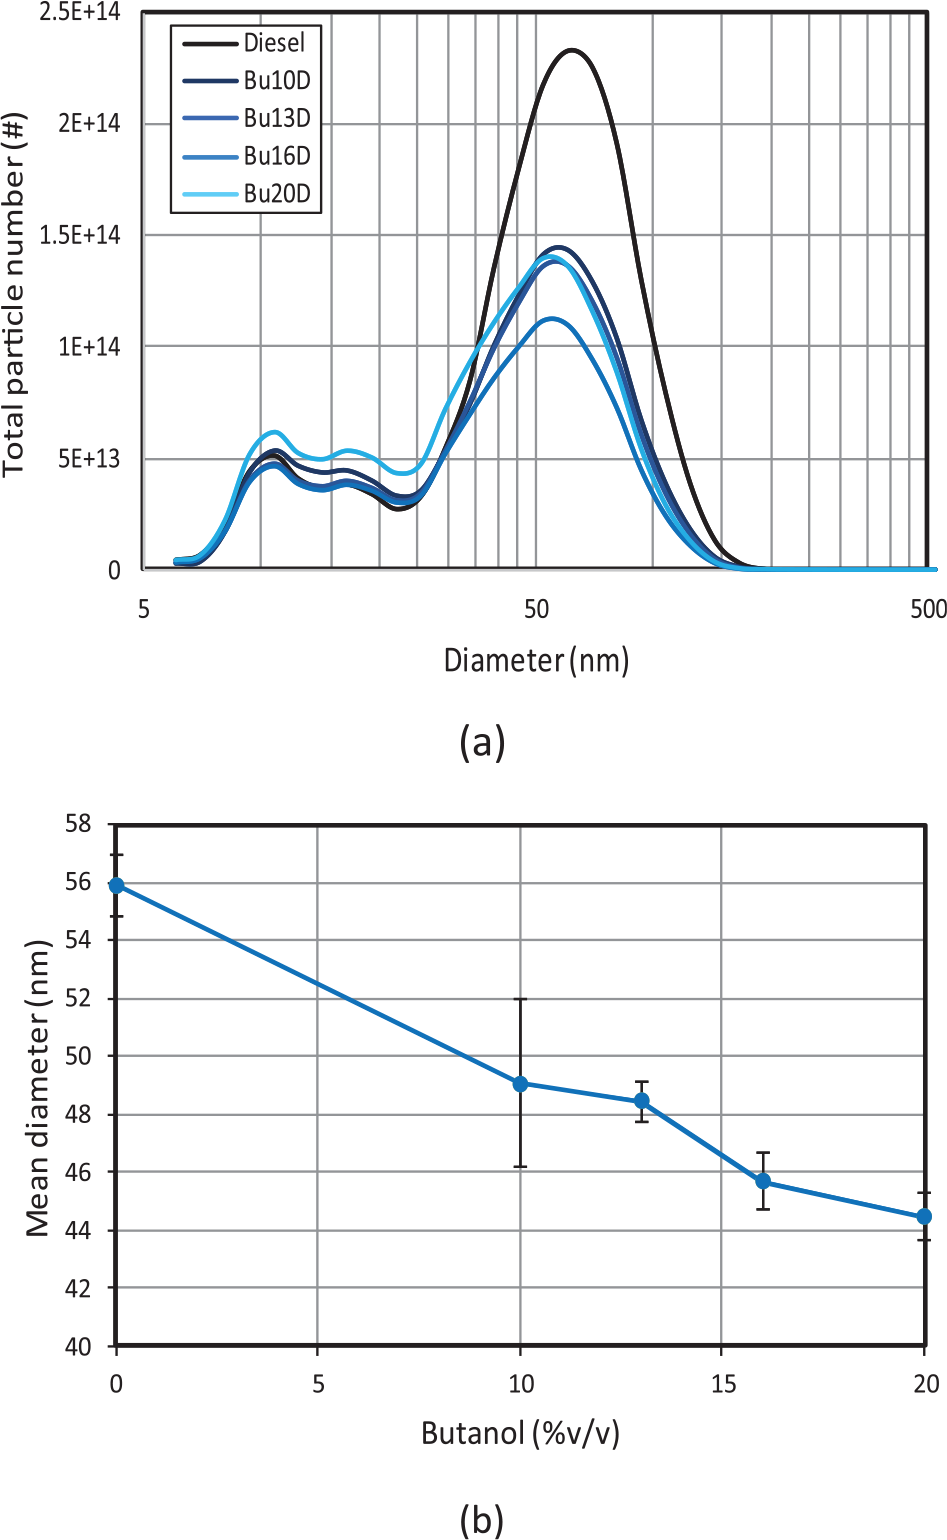
(a) Particle size distributions and (b) particle mean diameters.
As shown Figure 14(b), blend Bu20D also shows higher accumulation mode than Bu16D. As mentioned above, such increase is mainly derived from the higher particle emissions observed for this blend during the first urban subcycle. These higher particle emissions can be explained, especially in blends with high butanol content, because the higher enthalpy of vapourization of butanol decreases the local combustion temperature thus hindering soot oxidation.
When mass PM is analysed in Figure 16 (after converting particle number into particle mass emissions through the particle density correlation proposed in Lapuerta et al. 36 ), two main differences can be observed with respect to particle number emissions, regardless of the fuel used:
First, the contribution of the first urban subcycle (right after cold-engine start) to the mass emissions is smaller compared to that of the number emissions, demonstrating that much of the particles generated during the first urban subcycle are liquid nanoparticles rather than soot agglomerates, as a consequence of the cooling effect derived from butanol evaporation.
Second, the contribution of the extra-urban subcycle to the mass emissions is even higher than to the number emissions. Although in the NEDC cycle accelerations there is no EGR (Figure 5), they involve sudden increases in the equivalence ratio, which demonstrates that the effect of equivalence ratio on the soot formation processes is essential.
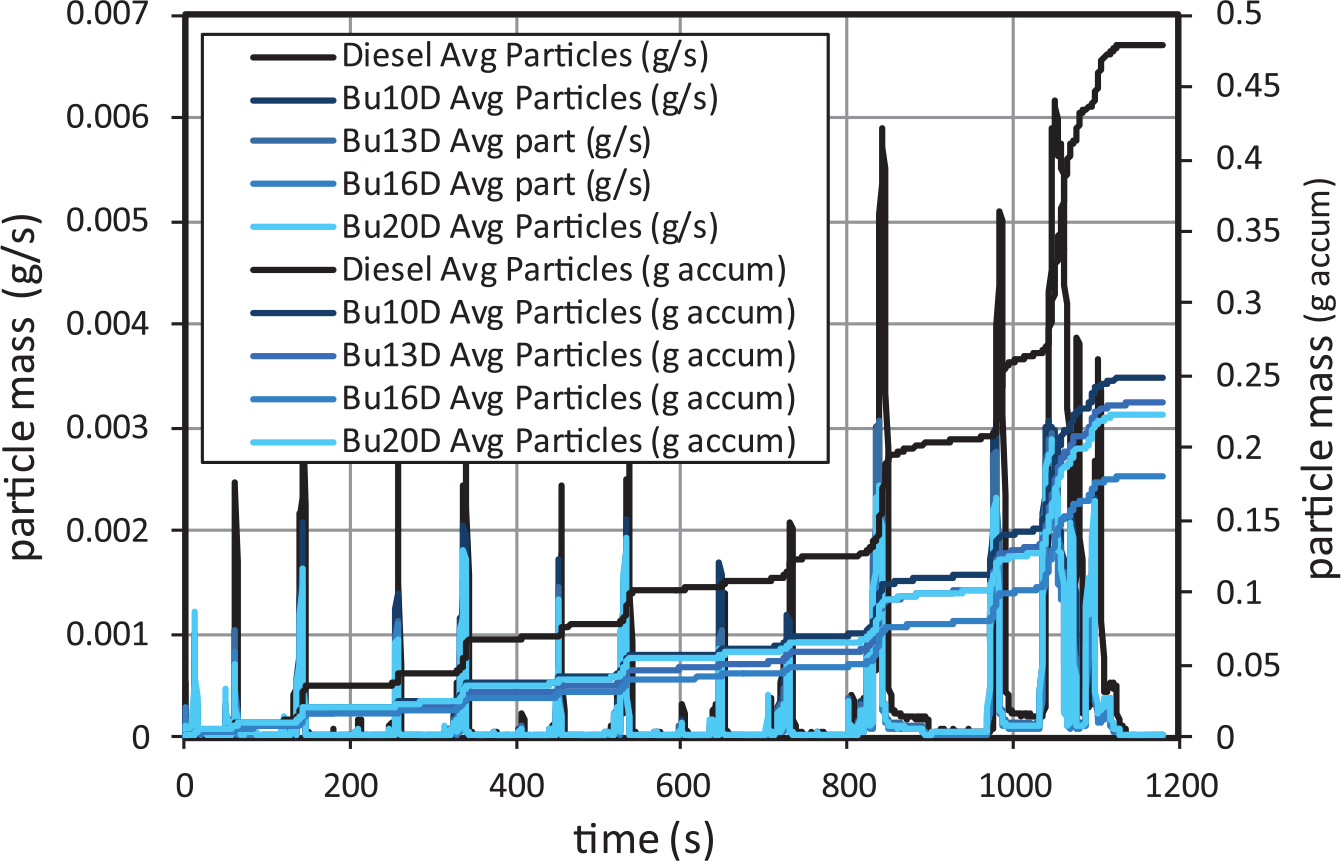
Particle mass emissions for butanol–diesel blends.
Regarding fuel effect (Figure 13), small amounts of butanol decrease significantly the particle mass emissions. However, for higher butanol contents, the decreasing trend is not so noticeable, and it is even reversed. In particular, the highest reduction is observed with Bu16D (around 62.52%). These reductions are even much more noticeable than in the case of particle number emissions, as can be observed in Figure 13. This observation demonstrates that:
Increasing butanol content up to 16% leads in average to less particles, and to finer particles, and thus to lower mean particle diameters. In this range of butanol contents, the increase in oxygen content and the decrease in aromatic content affect mainly to reduce soot formation.
For butanol contents higher than 16%, despite the mean particle diameter still decreases, the huge increase in particle number leads to higher particle mass emissions.
Since particle emissions upstream of the DPF find the minimum at 16% butanol content and NOX gaseous emissions do not increase for increasing butanol contents, this blend could be considered as an optimal blend to reduce the trap regeneration frequency (and the associated fuel consumption) and thus to enlarge the aftertreatment life-cycle.
Conclusion
From this study, the following conclusions can be obtained:
All n-butanol blends increased the specific fuel consumption consistently with their reduced heating value, and the engine efficiency remained unchanged during the engine tests.
CO and THC gaseous emissions increase very significantly for all butanol blends. These increases are mainly manifest during the first urban subcycle, where the temperature of the catalyst is insufficient for an adequate efficiency. The increase in THC emissions is linear with the butanol content, whereas it is non-linear for CO emissions. The more volatile and diffusive character of butanol with respect to diesel fuel, together with its higher enthalpy of vapourization, are responsible for the increases in THC and CO emissions.
Increasing butanol content does not increase NOX emissions as a consequence of compensation between increased IDs and shorter combustion durations.
Increasing butanol content reduces particle number and PM emissions upstream of the DPF up to 16% (volume basis) leading to less and finer particles. For higher butanol contents, despite the mean particle diameter still decreases, the higher amount of particles formed, especially in the first subcycle, also increases the particle mass emissions.
As butanol blends reduce particle mass significantly, higher EGR ratios could be used to reduce NOX, leading to a better PM/NOX trade-off.
In summary, the increases in CO and HC emissions reduction at low catalyst temperature conditions are largely compensated by the benefits in PM (and number) emissions, specially for Bu16D, which would reduce the frequency of particulate active regeneration, and thus the extra fuel consumption and the eventual annoyance to users without increasing NOX gaseous emissions.
Footnotes
Declaration of conflicting interests
The author(s) declared no potential conflicts of interest with respect to the research, authorship and/or publication of this article.
Funding
The author(s) disclosed receipt of the following financial support for the research, authorship, and/or publication of this article: This research was funded by the European Union Horizon 2020 Research and Innovation Programme under Grant Agreement No. 640462 (Buta NexT project). Green Biologics as member of ButaNexT consortium and Nissan are acknowledged for the donation of n-butanol and the engine, respectively.