
Abstract
A relatively high level of stratification (qualitatively: lack of homogeneity) is one of the main advantages of partially premixed combustion over the homogeneous charge compression ignition concept. Stratification can smooth the heat release rate and improve the controllability of combustion. In order to compare stratification levels of different partially premixed combustion strategies or other combustion concepts, an objective and meaningful definition of “stratification level” is required. Such a definition is currently lacking; qualitative/quantitative definitions in the literature cannot properly distinguish various levels of stratification. The main purpose of this study is to objectively define combustion stratification (not to be confused with fuel stratification) based on high-speed OH* chemiluminescence imaging, which is assumed to provide spatial information regarding heat release. Stratification essentially being equivalent to spatial structure, we base our definition on two-dimensional Fourier transforms of photographs of OH* chemiluminescence. A light-duty optical diesel engine has been used to perform the OH* bandpass imaging on. Four experimental points are evaluated, with injection timings in the homogeneous regime as well as in the stratified partially premixed combustion regime. Two-dimensional Fourier transforms translate these chemiluminescence images into a range of spatial frequencies. The frequency information is used to define combustion stratification, using a novel normalization procedure. The results indicate that this new definition, based on Fourier analysis of OH* bandpass images, overcomes the drawbacks of previous definitions used in the literature and is a promising method to compare the level of combustion stratification between different experiments.
Keywords
Introduction
Partially premixed combustion (PPC), a relatively new combustion mode of compression ignition (CI) engines, relies on an optimal ignition delay to achieve a partially premixed charge.1–6 PPC is a promising combustion concept, which reduces both nitrogen oxides (NOx) and soot emissions while providing a high combustion efficiency. The low NOx emissions are resulting from the low combustion temperature. The low soot emission is a result of increased premixing (compared to conventional CI engines).2–6 Control of premixing is necessary to implement PPC combustion strategies particularly in transient mode and to improve the emission formation over the full load range.5–7 The amount of premixing can be controlled in various ways, for instance by tuning the injection timing.
Combustion stratification as a result of mixture stratification and/or thermal stratification can qualitatively be considered as the lack of combustion homogeneity. For the PPC combustion concept, stratification is one of the main parameters affecting the combustion efficiency, and it improves the controllability of combustion in comparison with fully homogeneous (HCCI) combustion.6,8 For this reason, various studies have tried to define a metric for combustion stratification and correlate it with engine performance.9–11 However, there is no objectively quantifiable definition for “stratification level” thus far.
OH* chemiluminescence imaging is an optical combustion diagnostic based on recording photons emitted by naturally excited OH* radicals when they return to the ground state. In practice, these so-called OH* bandpass images are recorded by an intensified charge-coupled device (CCD) or complementary metal-oxide semiconductor (CMOS) camera through a spectral filter that nominally transmits light only in the wavelength interval that is characteristic for OH* luminescence, say 305–315 nm. OH* chemiluminescence imaging offers line-of-sight information across the volume imaged, and its time-dependent intensity is known as an indicator for the temporal behavior of heat release rate.12–15 This feature is commonly used in the literature. Zegers et al. 14 investigated the position and size of PPC combustion clouds by analyzing OH* chemiluminescence images in a heavy-duty optical engine. A clear correlation between ignition delay and flame location was observed. Tanov et al. 13 analyzed the combustion stratification of different injection strategies in a light-duty optical engine. The degree of stratification was determined as the ratio between the magnitude of intensity variations over the mean intensity of OH* bandpass images. Their results showed that the combustion following triple injection is more homogeneous compared to single or double injection. However, optical distortion by the piston bowl limited their study to only angular stratification analysis of PPC combustion in a narrow annular band inside the piston bowl. In a previous study, 11 OH* bandpass imaging of PPC combustion was performed using a flat optical piston without any distortion. Therefore, the combustion stratification analysis used by Tanov et al. 13 could be improved and expanded to both angular and radial stratification over a wide field of view (FOV). The results of this previous study confirmed that the combustion stratification indeed is an important parameter, affecting the combustion efficiency and phasing. However, the results of the stratification definition used there (see “Angular, radial and vertical stratification” section below for more detail) were significantly affected by noise, and it was hard to compare the stratification level of different PPC points objectively. Recently, the angular stratification method was applied by Vallinayagam et al. 16 to study the combustion stratification for Naphtha ranging from CI combustion to PPC. Their results showed a strong correlation between combustion stratification and NOx/soot emissions as shown in Figure 1.
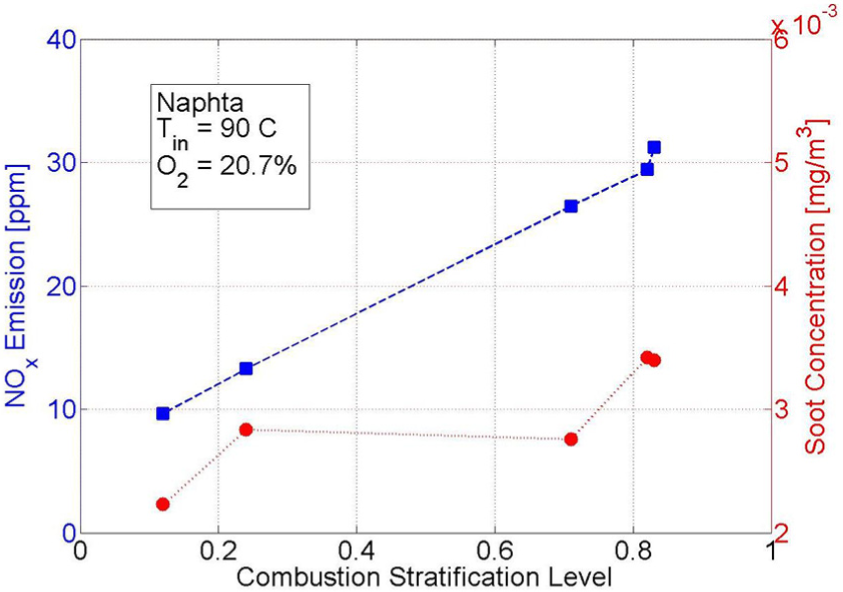
NOX emission and soot concentration as a function of combustion stratification (combined Figures 15(b) and 17(b) of the study of Vallinayagam et al. 16 ).
All in all, the literature study confirms that stratification is playing a key role in controlling emissions, ignition timing and heat release rate behavior of PPC. Hence, an objective quantification of this parameter helps to better understand PPC and can provide a tool to compare different studies.
This study improves and expands the previous work 11 by side view OH* bandpass imaging and analyzing the vertical stratification as well. Furthermore, this article proposes an advanced stratification metric based on the spatial frequency domain and signal energy (defined as the sum of the square of spatial frequency magnitudes based on Parseval’s theorem) of OH* chemiluminescence images. The new method can distinguish stratification levels where the old methods fail.
Experimental setup
Optical engine
A Volvo D5 light-duty direct injection (DI) diesel engine is used in this study to do measurements. The engine is modified for optical access using a Bowditch 17 design. One of five engine cylinders is equipped with a cylindrical quartz liner with a height of 25 mm, while other cylinders are inactive. The other cylinders are deactivated by disconnecting the cylinder head from the engine block and connecting it only to the optical cylinder based on a piston and cylinder extender. The quartz liner allows for wide optical access through the combustion chamber from the side (full engine bore diameter). A flat optical quartz piston is used to image the OH* chemiluminescence from below. This flat piston geometry decreases the amount of premixing with respect to the geometry of a piston bowl. Furthermore, fuel is more likely to end up in the crevice volume using the flat piston geometry. 18 However, the advantage of a flat piston over a re-entrant bowl is that the imaging is hardly affected by optical distortion. Distortion correction for the re-entrant piston bowl geometry is challenging for chemiluminescence imaging, since spatial position inside the cylinder along the line-of-sight of the camera is undefined.
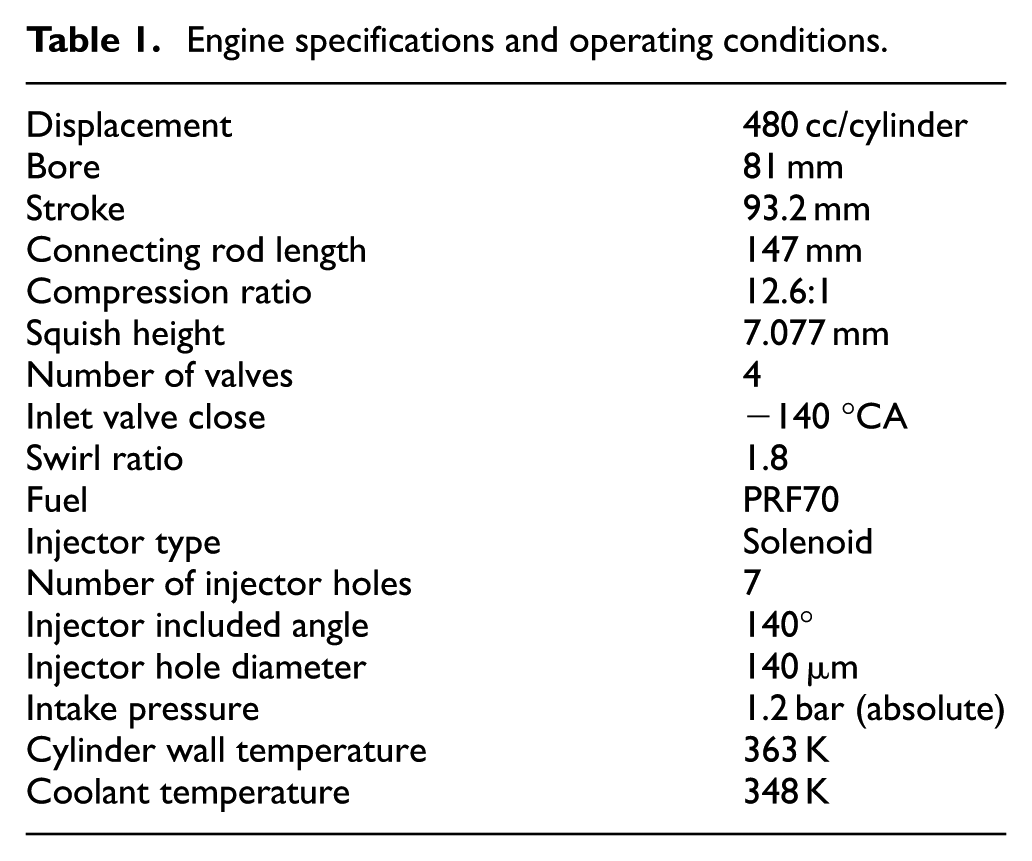
Engine specifications and operating conditions are presented in Table 1. Note that 0 °CA marks firing top dead center (TDC) throughout this study. The compression ratio of the engine is decreased to 12.6 to protect the optical parts against high pressure. Moreover, a high compression ratio is not essential to study fundamentals of PPC. The engine is operated at 1200 r/min using a dynamometer. We use skip fire mode (once every 10 engine cycles) to reduce the risk of liner failure due to thermal and mechanical loads. Exhaust gas recirculation (EGR) is simulated by diluting the intake air with nitrogen. Intake pressure and all other engine parameters are kept constant (Table 1). For each measurement point, 30 fire cycles are recorded.
Engine specifications and operating conditions.
The in-cylinder pressure is measured every 0.20 °CA. The heat release analysis of the pressure trace is performed based on a single-zone thermodynamic model, including the Woschni’s heat loss model and a crevice volume model.19,20 A fifth-order Hann window function is applied to suppress noise on the pressure trace and heat release rate.
Operating conditions
To investigate the effect of stratification, the CA50 is held constant at +8 °CA (by tuning the intake temperature) for four different single-injection timings (different ignition delays). These timings are detailed in Table 2; the amount of injected fuel is approximately 16 mg/cycle for all cases. In case A, port fuel injection is used as a reference point for the most homogeneous mixture and combustion. Stratification of other points can be evaluated with respect to this point. Due to the skip fire mode, the total amount of port-injected fuel does not end up in the fire cycle. Hence, for this case, the amount of delivered fuel to the combustion chamber is tuned based on the accumulated heat release.
Single injection timings.
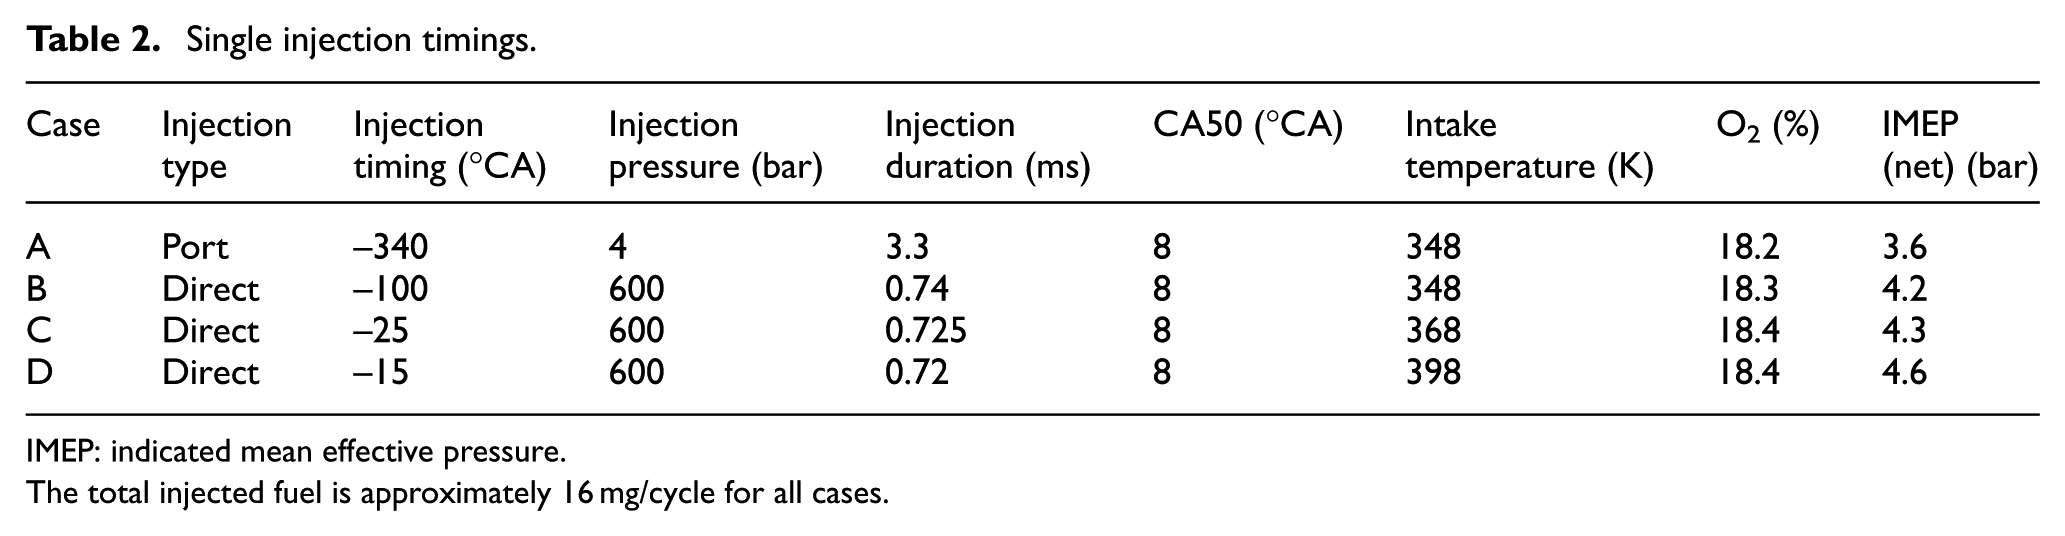
IMEP: indicated mean effective pressure.
The total injected fuel is approximately 16 mg/cycle for all cases.
OH* bandpass imaging
OH* bandpass images are recorded at 1 °CA intervals using a high-speed intensified camera. The flat optical piston used in this study provides a diameter of 60-mm optical access out of the diameter of 81-mm engine bore. The combustion is detected from below, by aiming the camera at the 45° mirror and from the side by aiming the camera directly at the quartz liner (Figure 2). Bottom and side view imaging are not performed simultaneously. However, the same operating conditions are used for both of them.
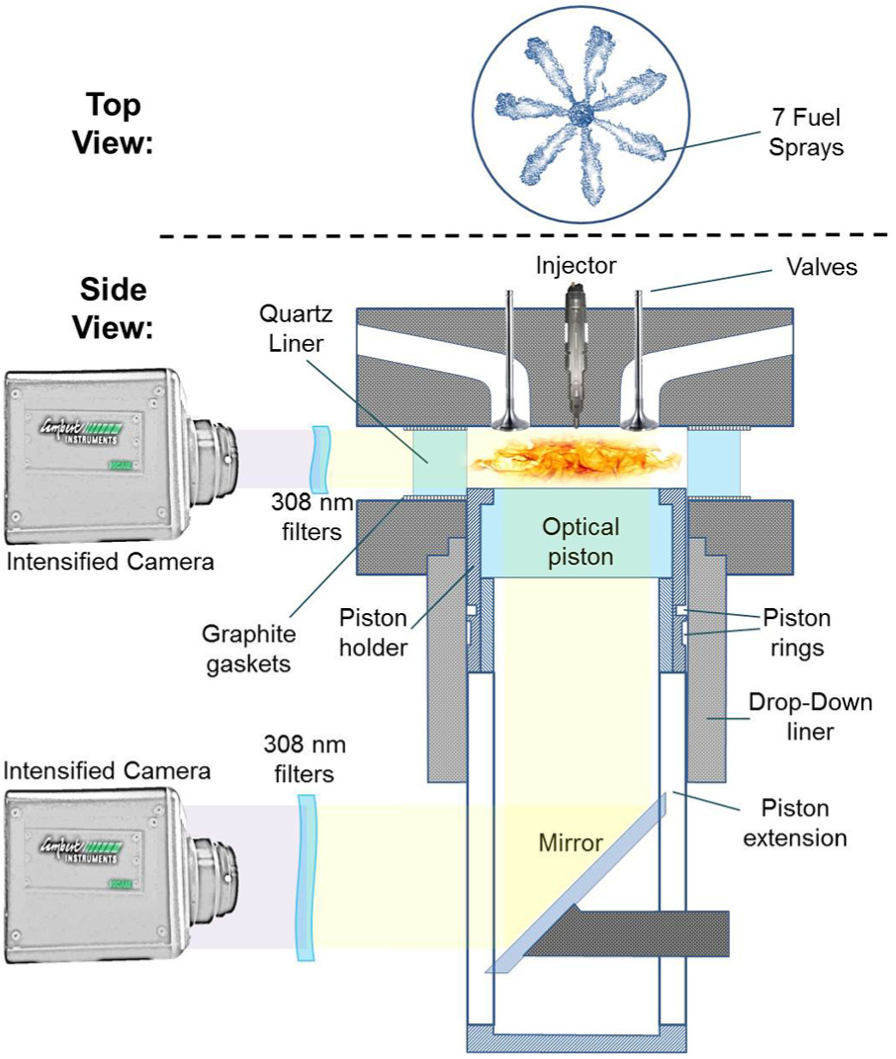
Schematic of the optical engine and OH* bandpass imaging setup.
Specifications of the detection setup are presented in Table 3. The light is recorded through a combination of a 315-nm bandpass filter with 20.4-nm full width at half maximum (FWHM) and a 300-nm bandpass filter with 87.5-nm FWHM, to reject light with wavelength below 300 nm or above 330 nm. Transmissibility and optical density of the optical filters as well as their combination are depicted in Figure 3. These filters are chosen to record OH* chemiluminescence wavelengths, which has peak emission around 310 nm, but it must be kept in mind that their transmission beyond the selected range is still finite.
Specifications of the camera and optics.
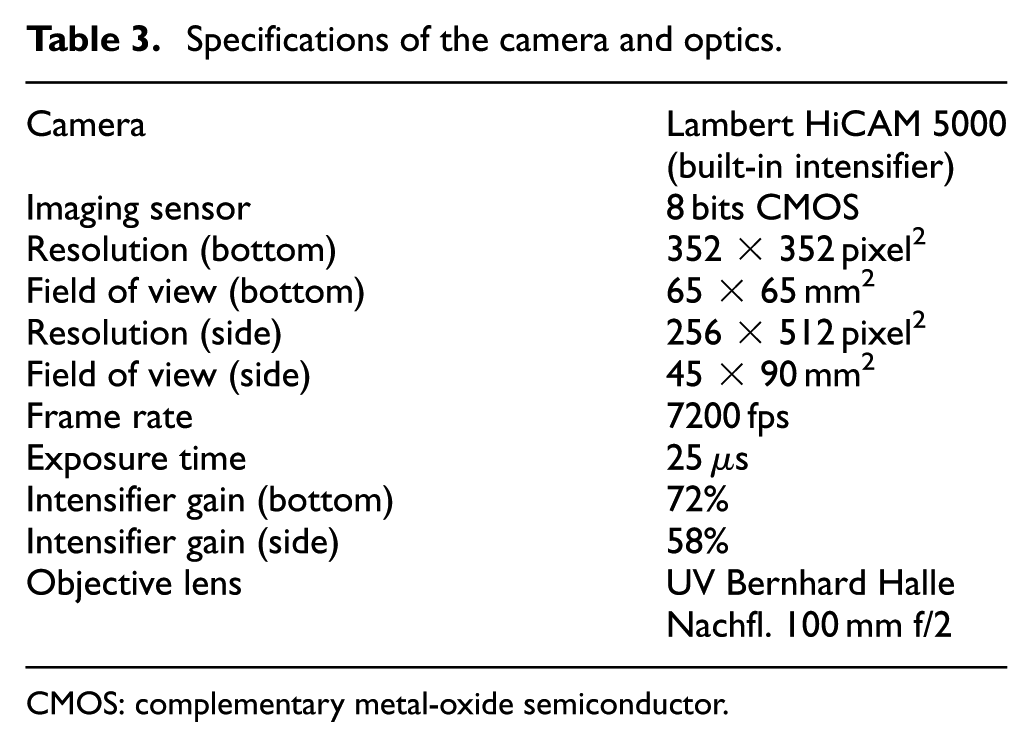
CMOS: complementary metal-oxide semiconductor.
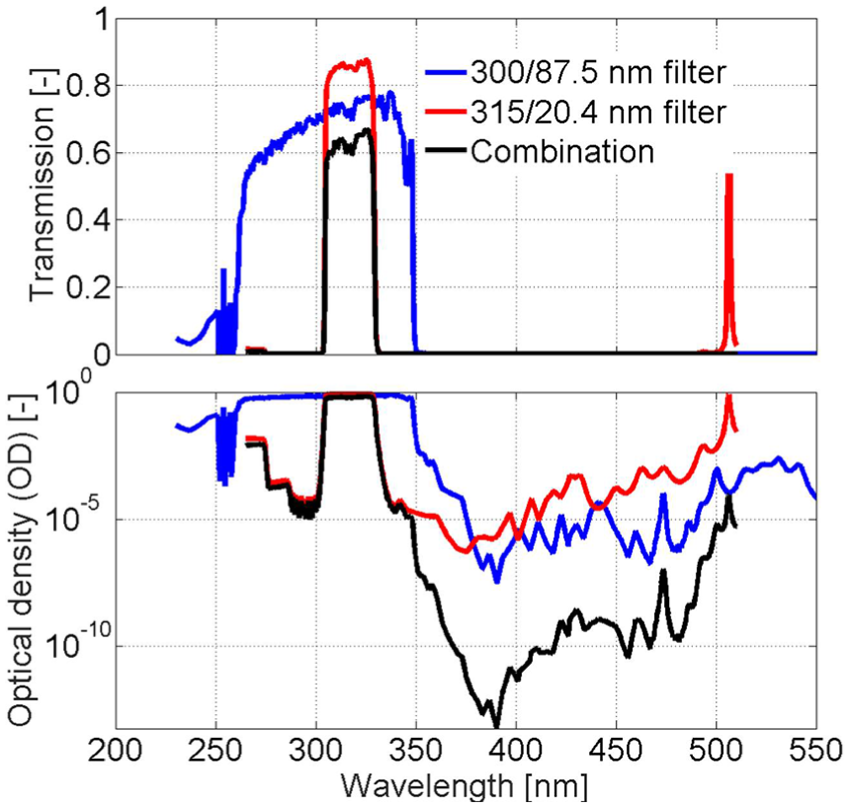
Transmittance (top) and optical density (bottom) of the optical filters used for OH* bandpass imaging.
Combustion stratification analysis
Time-resolved OH* chemiluminescence imaging provides spatial and temporal information on the heat release rate during the combustion.11–15 Our spectroscopy study for similar operating conditions shows that OH* bandpass imaging is highly affected by broadband chemiluminescence of relatively large molecules, like HCO*, CH2O* and CO2*, especially for HCCI points. 21 However, it is observed that broadband chemiluminescence can be used as a measure for the heat release rate as well. This implies that an OH* bandpass filter can still result in meaningful luminescence images, since the temporal behavior of the signal will be proportional to that of the heat release rate anyway. 21
The goal of the image processing is to quantify the level of combustion stratification based on OH* bandpass images. In this section, two methods are described to quantify the stratification; the first method is based on previous work11,13 and the second is a newly proposed method based on the spatial frequency content of the chemiluminescence images.
Angular, radial and vertical stratification
As mentioned in section “Introduction,” an attempt to quantify the combustion stratification has been made previously.11,13 In this section, the angular, radial and vertical stratification analysis is based on those studies. Before data are analyzed, a background correction is carried out. The mean of 10 frames before the start of combustion is used as a background to be subtracted from all frames in a cycle.
Imaging from beneath is analyzed in a polar coordinate system because of rotational symmetry of the spray configuration. For computational convenience, the recorded images (with a nominal center of symmetry at the nozzle position) are transformed into a Cartesian image with polar coordinates along the axes, based on linear interpolation (we will refer to this as a direct space image; see Figure 4).
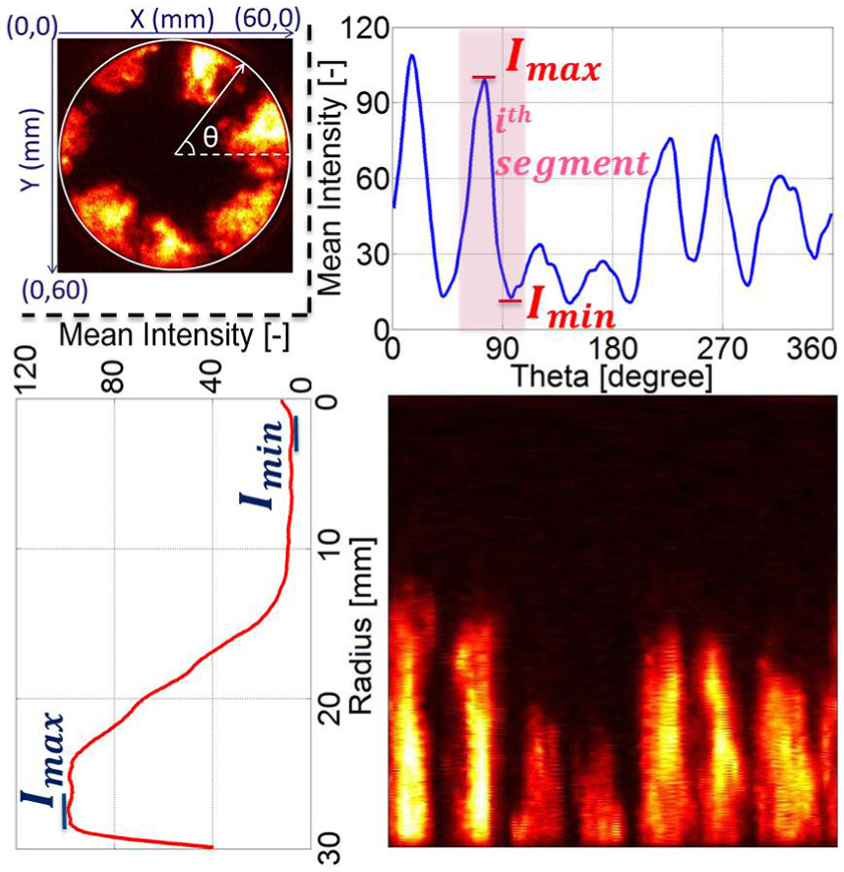
Typical behavior of intensity as a function of polar angle and radius for PPC combustion. Top left: original OH* bandpass image at a certain CAD, top right: radially averaged intensity as a function of angle; the shaded region corresponds to one of the seven combustion clouds, bottom left: angularly averaged intensity as a function of radius, bottom right: image transformed into a Cartesian image with polar coordinates along the axes (direct space image). The graphs are derived from the bottom right image.
To determine the angular stratification, the intensity is radially averaged, and the average is plotted as a function of polar angle θ. The top right of Figure 4 shows typical behavior of a PPC combustion by applying this method to an instantaneous OH* bandpass frame. Based on that the range of θ can be divided into seven equal segments, representative of seven combustion clouds (seven injector holes).
Referring to Figure 4, the angular stratification,
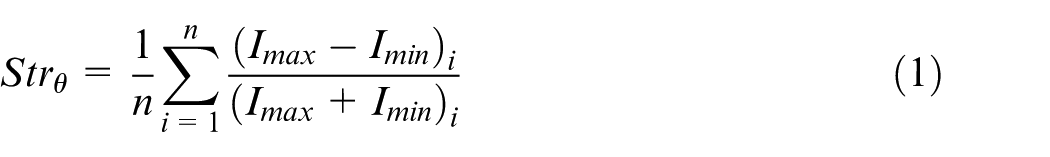
where n is the number of injector holes (comparable to an angular wave number) and
To analyze radial stratification, for each radius (r), the intensity is averaged over all angles (θ). A typical example is illustrated in the bottom left part of Figure 4. The radial stratification,
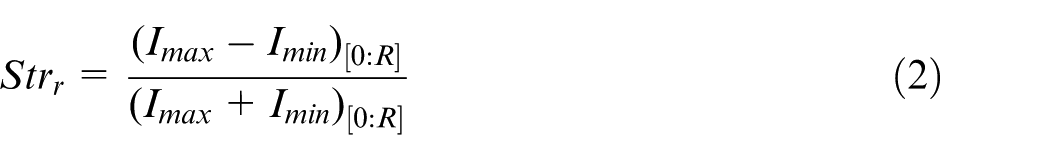
where R is the radius of the FOV (0.03 m in this study), and
To analyze the vertical stratification from the side view images, the intensity is averaged over the horizontal position and is plotted as a function of vertical position for individual crank angle degrees (CADs) (Figure 5). First, the area of analysis is defined based on the piston position. Referring to Figure 5, the vertical stratification,
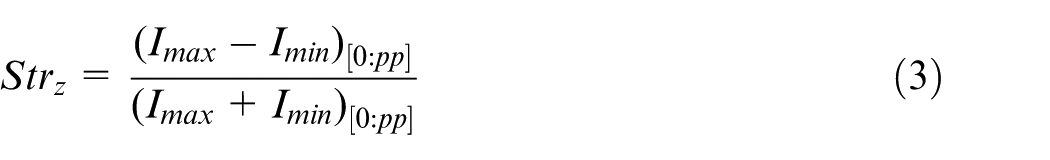
where pp is the piston position relative to the cylinder head, and
Typical behavior of the horizontally averaged intensity as a function of vertical position for the side view images.
Fourier-based stratification
The intensity-based method, described in the previous section, is highly sensitive to noise by considering local intensities, and its outcome is not always informative, as will be discussed in section “Validation.” To overcome the deficiencies of this method, a Fourier analysis–based stratification definition, that is explicitly considering combustion structure, is proposed and explained in this section.
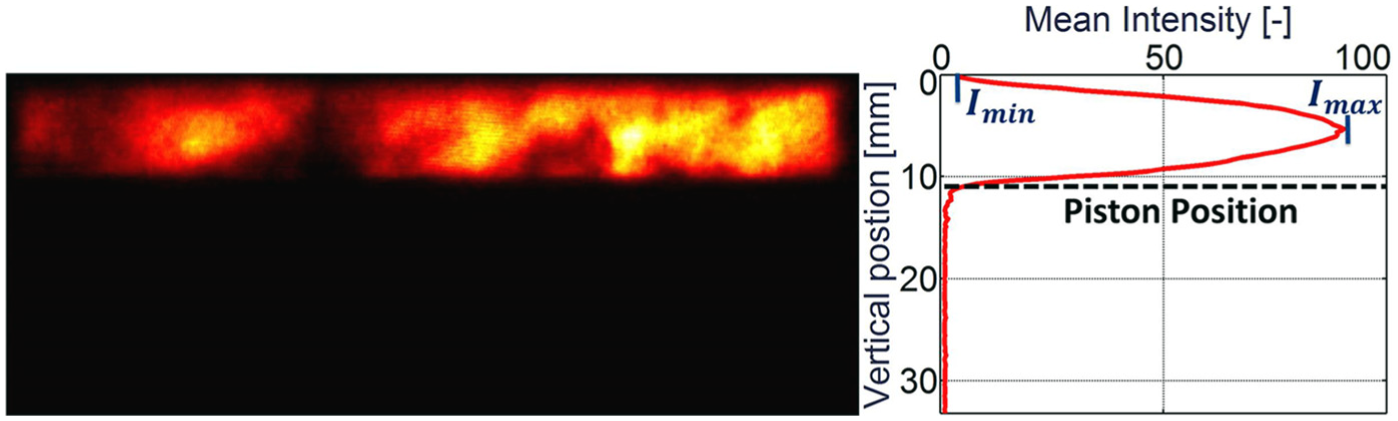
The Fourier-based method basically focuses on the spatial frequencies (Spatial frequency is a characteristic of a periodic structure across position in space. In a two-dimensional (2D) image, spatial frequency is defined by the number of cycles of alternating dark and light bars per degree of visual angle. 22 ) in a certain FOV. For ease of calculation, the recorded images (bottom view only) are again transformed into M × N direct space images, as above. In these images, the horizontal axis corresponds to polar angle, the vertical axis to radius. Over this 2D spatial domain, the discrete Fourier transform is applied based on equation (4) (see also Figure 6)
where I[m, n] represents the intensity of pixel [m, n] in direct space, and F[u, v] represents the contribution of spatial frequency pixel [u, v], in which u and v represent angular and radial frequency components, respectively. Note that the origin (0, 0) in the direct space image is at the top left corner, while in the Fourier space image, it is located in the center.
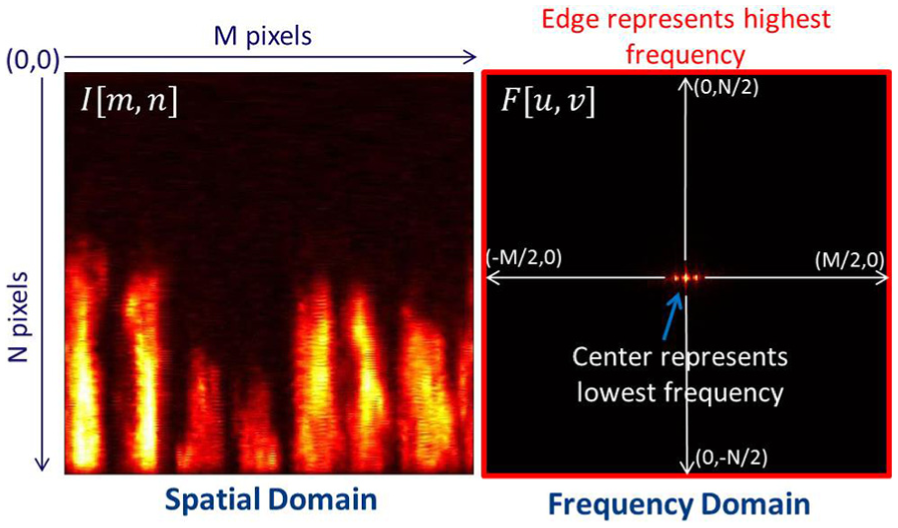
Transformation from the spatial domain to the frequency domain.
In direct space, the sampling unit is 1 pixel, corresponding to 2π/M (rad) (horizontal) or R/N (m) (vertical), so the spatial frequencies in Fourier space are limited to the intervals ±M/2 rad−1 and ±πN/R (units of m−1), respectively. Because the sampling in direct space is discrete, the sampling in Fourier space is discrete as well, with spatial frequency units corresponding to 2π/(full range), where the full range corresponds to 2π rad (horizontal) and the bowl radius of 0.03 m (vertical), respectively. Note that the center of the frequency domain represents the lowest frequency (Direct Current value), while the edges represent the highest frequencies. 22
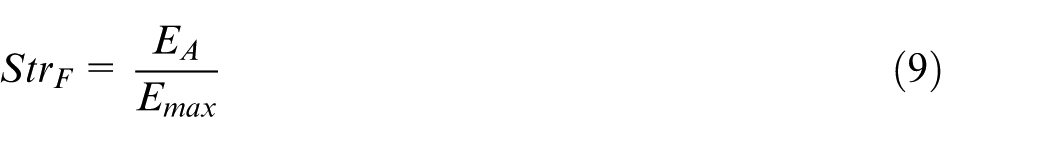
Not all spatial frequencies in the Fourier domain are related to combustion stratification. Low spatial frequencies correspond to large-scale variations, whereas the high spatial frequencies are largely due to noise. Hence, an intermediate spatial frequency range, A, should be selected, the signal energy of which
Whereas the informative signal energy
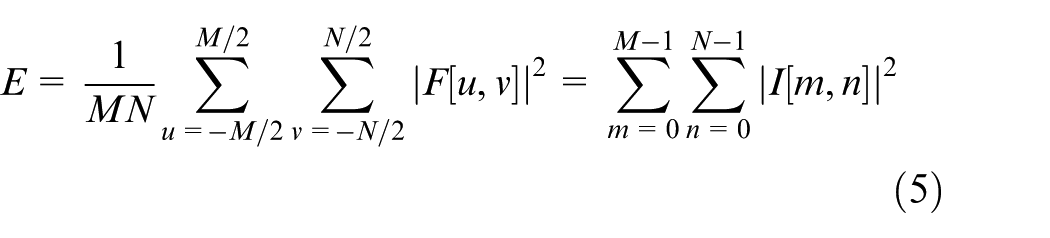
Writing

and using that the mean intensity of an image follows from
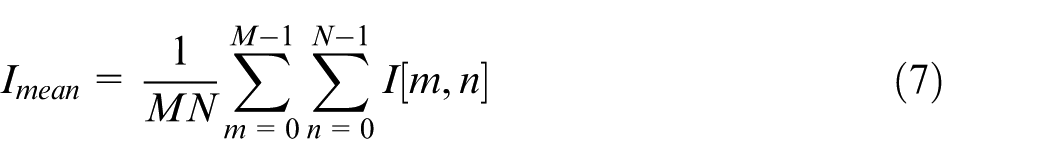
Parseval’s equation can be rewritten as
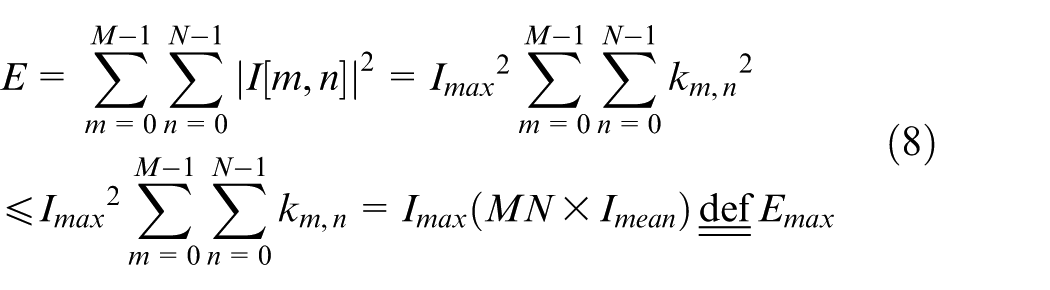
in which the inequality could be introduced because
Finally, the range A, containing the informative spatial frequency components, remains to be determined. A is a central portion of the Fourier plane, covering the frequencies physically relevant for stratification. In principle, it can have arbitrary shape, as long as it excludes the higher, noise-related frequencies. We choose it to be circular, as in Figure 7(a) (and will show later that this is not very critical). The relevant signal energy based on this spatial frequency range is calculated by
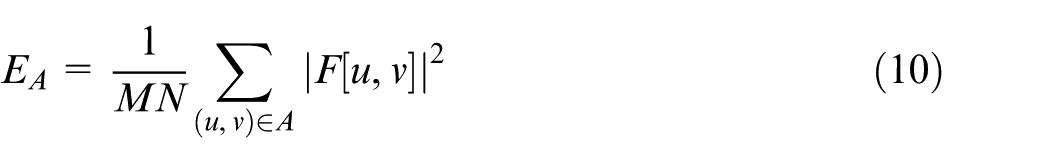
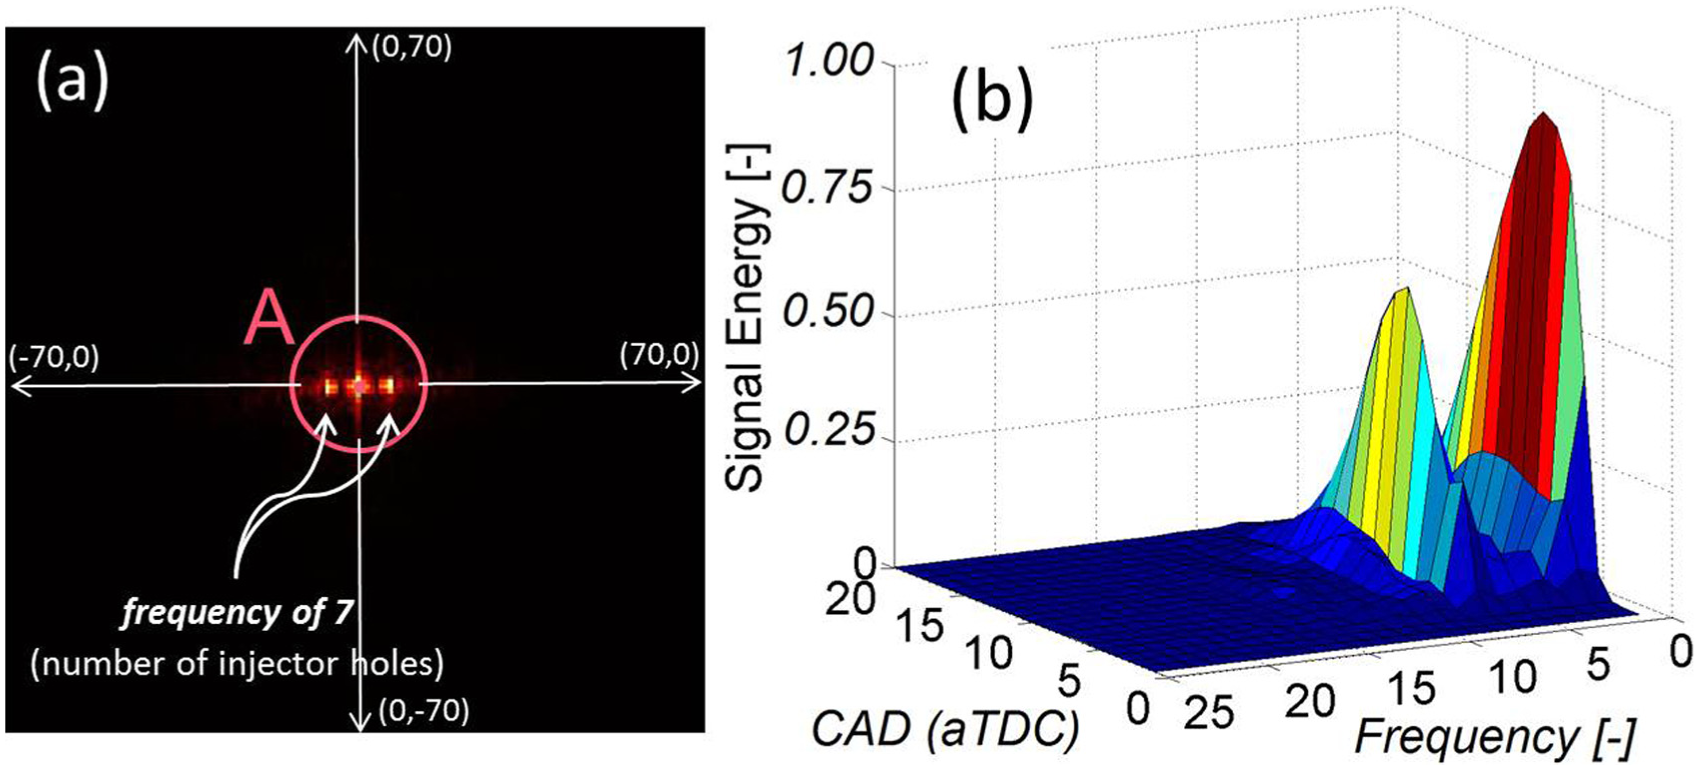
(a) Typical spatial frequency domain for a PPC combustion image at a given crank angle degree and (b) signal energy as a function of radius
To specify the radius of spatial frequency range A, we divide the images in concentric rings around the origin, each 1-pixel wide. The signal energy is then calculated over each ring of radius k (similar to equation (10)), and the results are plotted as a function of k (spatial frequency). This is done for different CADs of the PPC combustion event illustrated in Figure 10 (case C). The result is shown in Figure 7(b). Two peaks are observed. The first peak, at k = 1, corresponds to the radial structure of the burning sprays, each filling about one quarter of the cylinder diameter, and the second peak, at k = 7, corresponds to the angular periodicity of the seven sprays. On this basis,
Validation
Two sample images, shown in Figure 8(a) and (b), are constructed to check the functionality of the Fourier-based method described in the previous section. Both images are composed of the same number of black (0) and white (1) pixels. As a result, both images have the same mean intensity and the same root mean square (RMS) fluctuation (the square root of mean square of pixel intensity fluctuations relative to the mean intensity). Their structure, however, is obviously very different. Figure 8(a) is a cartoon of typical PPC behavior (based on a seven-hole injector) like case D as shown in Figure 8(c), while Figure 8(b) represents an essentially homogeneous distribution, similar to typical HCCI behavior like case A, as illustrated in Figure 8(d). Both intensity-based stratification analysis (angular and radial stratification) and Fourier-based stratification analysis are implemented to extract the level of stratification from these images. The intensity-based method simply fails to distinguish between these two sample cases (a and b). Since there are radially averaged and angularly averaged intensities of 0 in both images, angular and radial stratifications equal 1 for both images (see equations (1) and (2)). However, Fourier-based stratification clearly distinguishes the stratification levels of these two sample images, showing a (1) stratification level of 0.62 for the stratified image (2) against a stratification level of 0.009 for the homogeneous image. For real OH* bandpass images of case A and D, it can also be seen that Fourier-based stratification can better distinguish between these two cases. From a physical point of view, this is fully understandable. RMS- and contrast-based methods do not specifically look at structure, but summarize integrated fluctuations. Fourier analysis, however, identifies spatial structure on various scales. For stratification analysis, which is all about structure, the latter is obviously the method of choice.

Sample images: (a) stratified and (b) homogeneous distributions of pixel values of 0 and 1. OH* bandpass images: (c) case D at CA50 and (d) case A at CA50.
Results and discussion
OH* bandpass imaging has been performed for both bottom and side view. All the presented results in this section are the mean values over 30 measurement cycles, but error bars are omitted from intermediate results for the sake of clarity. However, a high level of repeatability is observed for the experimental points as can be seen in final results (Figure 13).
Figure 9(a) shows the temporal heat release rate behavior for different injection timings (cases A–D of Table 2). As can be seen in this figure, the peak heat release rate does not correlate in a unique way with the injection timing. Case A with start of injection (SOI) at −340 °CA can be classified as an HCCI point. Cases C and D represent PPC points with different charge stratification levels (injection timings at −25 and −15 °CA, respectively), whereas case B with SOI at −100 °CA can be considered as a transition point from HCCI to PPC.
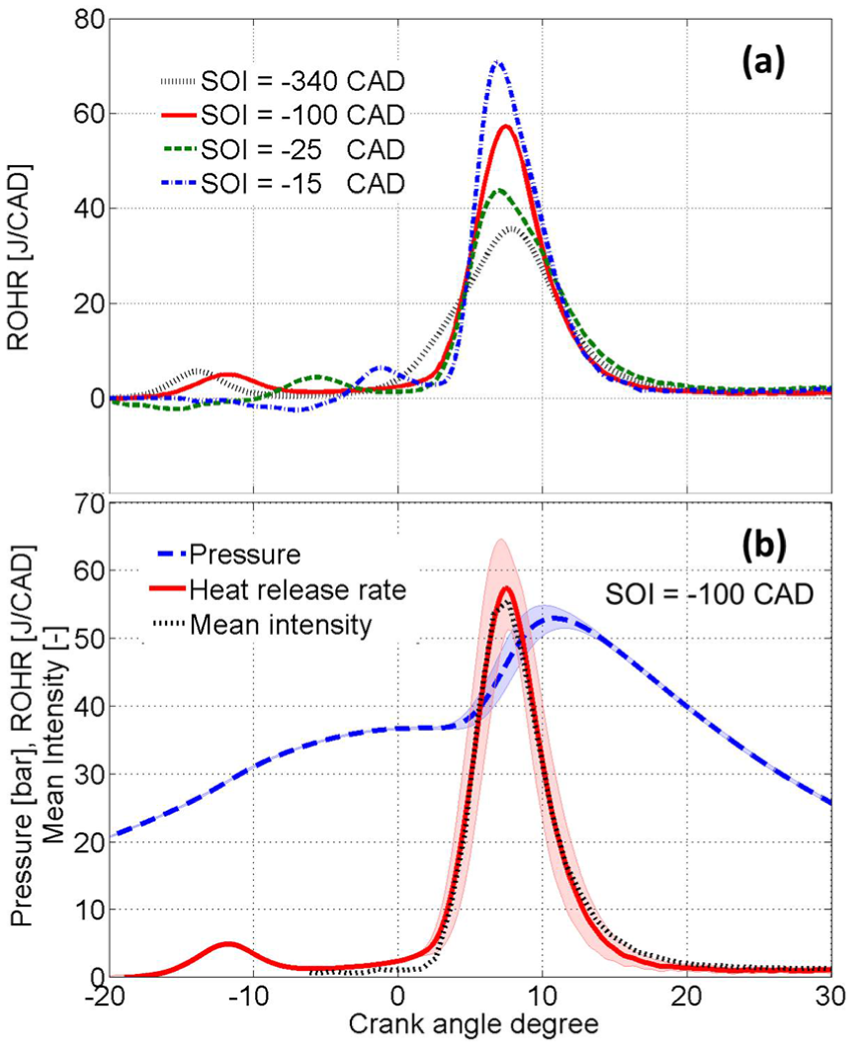
(a) Rate of heat release (ROHR) for different injection timings and (b) comparison of pressure, ROHR and normalized mean intensity for SOI of −100 °CA.
In Figure 9(b), the normalized mean intensity and the heat release rate are compared for the injection timing of −100 °CA (case B of Table 2). The very similar behavior of the heat release rate and the mean intensity shows the accuracy of OH* bandpass imaging as an indicator of heat release. However, for late injections (PPC points), a longer tail is observed for the mean intensity in comparison with the heat release rate, which is probably due to soot luminosity transmitted through the optical filters. The combination of optical filters used in this study is relatively transmissive in the region around 500 nm (the optical density increases from 10−15 to 10−5 in this wavelength region; see Figure 3).
OH* bandpass images around CA50 are demonstrated in Figure 10 for different operating conditions. Based on eye inspection, it can be seen that port fuel injection (case A) results in the most homogeneous combustion; while by retarding the injection timing toward −15 °CA after top dead center (ATDC) (case D), the combustion stratification increases.
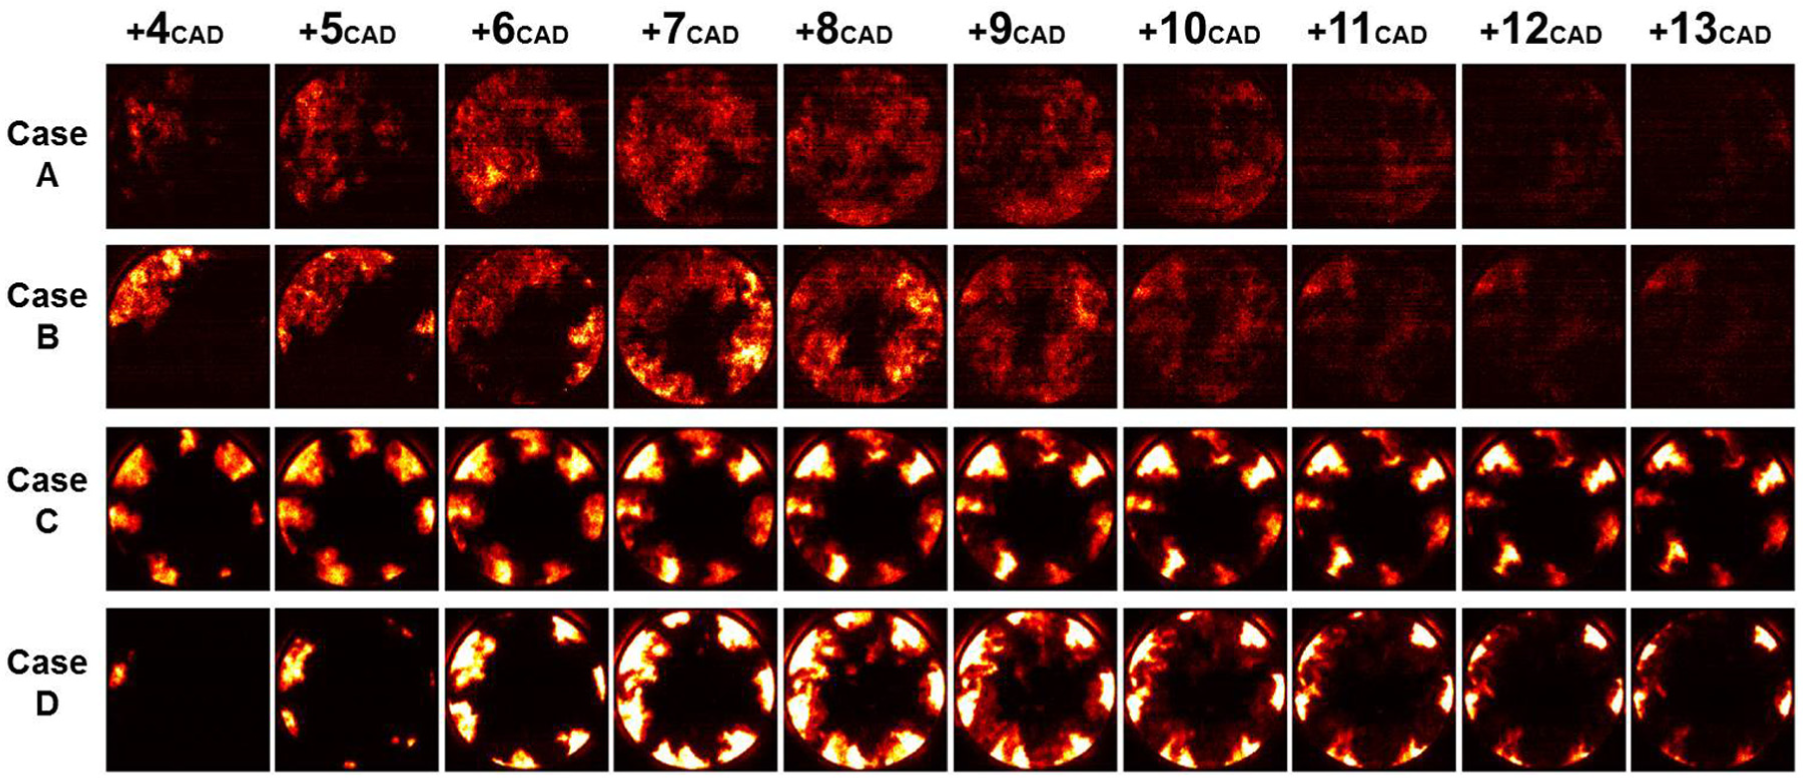
Representative bottom view OH* bandpass images around CA50 (+8 °CA) for different cases (A–D).
Angular, radial and vertical stratification
The images captured from below are used to determine both angular and radial stratification, while side view images are used to determine the vertical stratification. Results of the combustion stratification for different injection timings are demonstrated in Figure 11. As expected, the stratification levels of PPC combustions (SOI of −15 and −25 °CA) are higher than those of HCCI-like combustion (SOI of −100 °CA and port injection), due to the shorter ignition delay which limits the fuel–air mixing process. For the late injections, however, the maximum angular, radial and vertical stratifications reach values close to 1, which does not allow to distinguish between SOI of −15 and −25 °CA. For early injections, the maximum level of stratification exceeds 0.4, which is relatively high, especially for the port fuel injection case, which is supposed to result in homogeneous combustion. Figure 10 shows that radial lines and circles with mean intensities close to 0 (black color) can be easily found for all cases. This means that
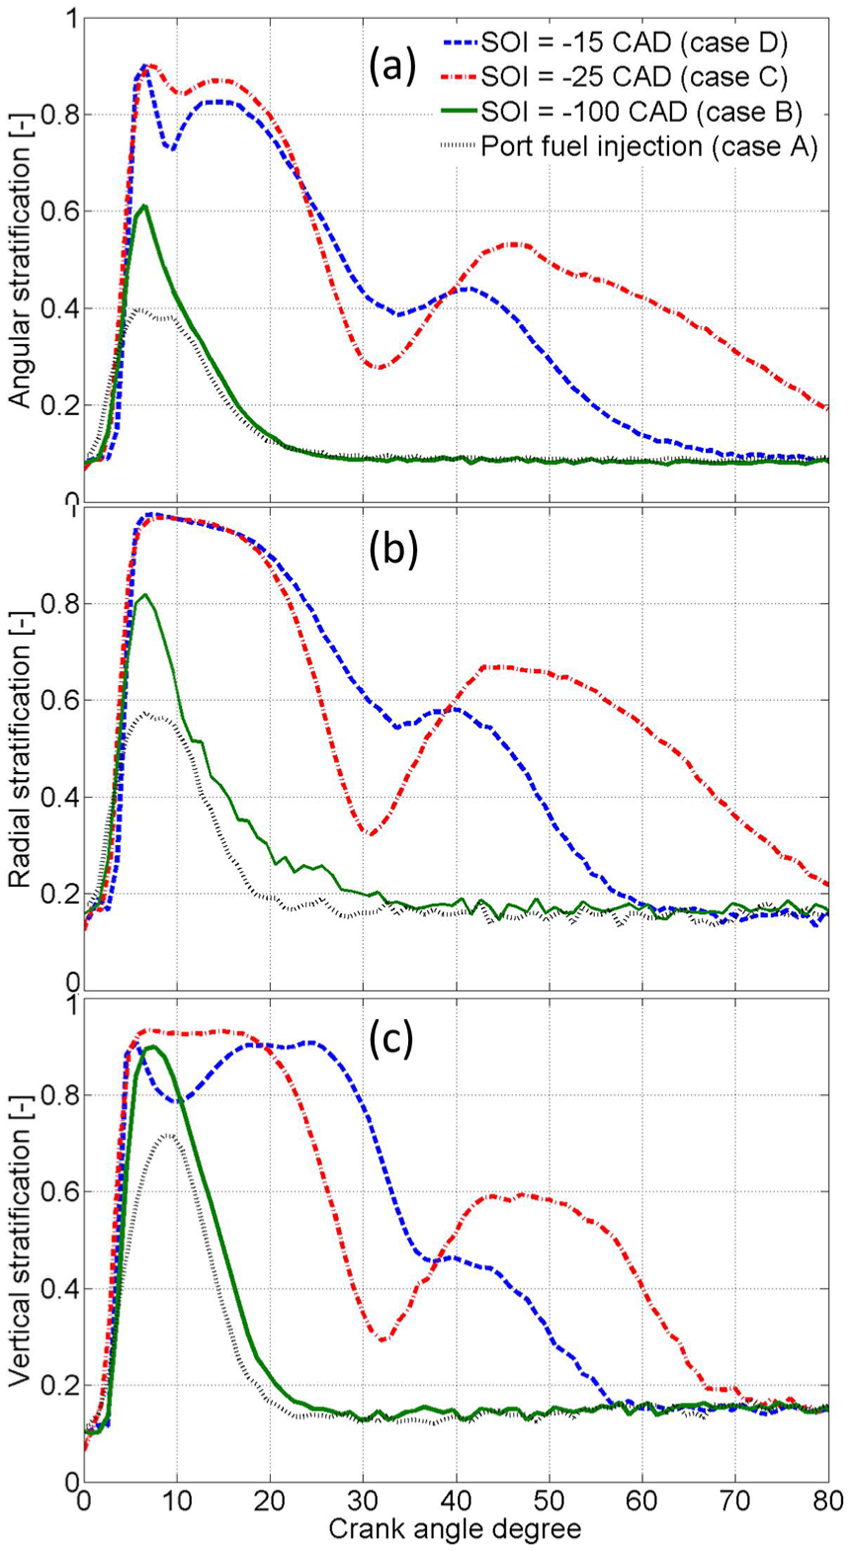
Time-resolved (a) angular, (b) radial and (c) vertical stratification analysis for several injection timings.
As a noteworthy fact, a relatively high level of stratification is observed around 45 °CA for PPC combustion strategies. This is caused by afterburning of the fresh fuel–air mixture coming out of the crevice volume.
11
This crevice fuel does not burn under the low-temperature combustion conditions of HCCI cases. Obviously, the crevice fuel does not significantly contribute to the heat release. However, small intensity variations in chemiluminescence images can easily increase the intensity-based stratification level, as discussed in the previous paragraph. When comparing the results of the angular, radial and vertical stratifications, it is observed that the vertical approach leads to the highest stratifications. The weak combustion close to the relatively cold cylinder head and piston crown brings down the minimum vertical intensity close to the 0 during a combustion event and hence yields a relatively large
Fourier-based stratification
The results of the Fourier-based stratification analysis for both bottom and side view imaging are illustrated in Figure 12. It is observed that the level of stratification is close to 0 for HCCI combustion strategies, while for PPC combustion, the stratification level is significantly higher. There is a good level of distinction between stratification levels for SOI −15 and −25 °CA (higher stratification for later injection), illustrating how, contrary to the previous definitions, this Fourier-based definition allows to compare stratification levels of different PPC strategies. The weak afterburning near the cylinder walls does not have a significant effect on the stratification in the Fourier-based analysis, as it should, because it does not significantly contribute to the heat release. The level of stratification is also 0 for images in which nothing is detected. It indicates that the method is sensitive to the temporal behavior of heat release rate, while it is not particularly sensitive to noise and insignificant intensity variations. The reason for this improvement offered by the Fourier-based stratification definition is twofold. The method focuses on the signal energy in the low-frequency part of the spectrum (thus disregarding noise), and the normalization is based on the highest possible signal energy, which provides a meaningful and objective outcome. Note that the Fourier-based stratification metric does not follow the order found in the peak heat release rates as can be seen by comparing Figures 9(a) and 12(a), while the temporal behaviors are similar. This also implies that for controlling the peak heat release rate, an optimum stratification level is needed and quantification of combustion stratification can be used as a tool for this optimization. The higher stratification level of case C has lowered the peak heat release rate compared to case B (an almost homogeneous case). However, the higher stratification level of case D compared to case C has increased the peak heat release rate apparently because higher local equivalence ratios close to stoichiometric are achieved.
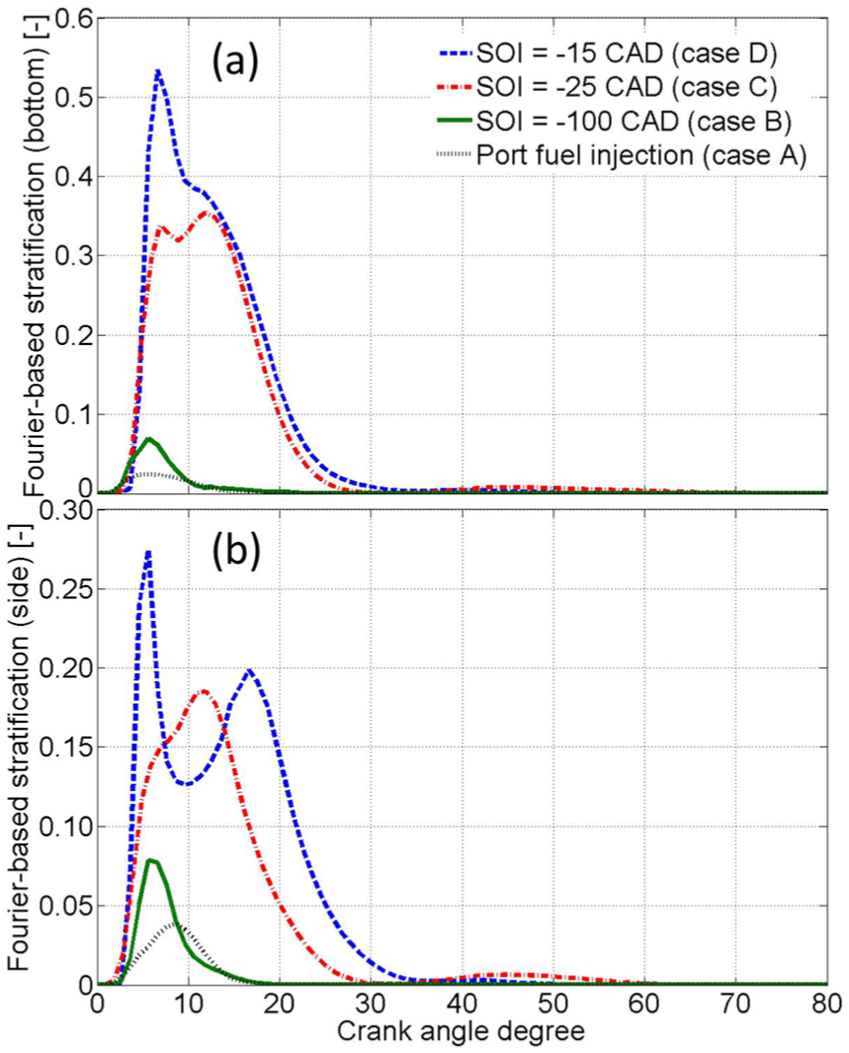
Time-resolved Fourier-based stratification analysis for various injection timings and (a) bottom (b) and side view images.
Fourier-based stratification analysis is performed for the side view images as well, in their original coordinate system (Figure 12(b)). For SOI of −15 °CA, the stratification level drops around 10 °CA, but this is due to an experimental artifact, namely, overexposure of the camera (overexposure essentially reduces the signal energy and the stratification level). Initially to eliminate the effects of camera intensifier gain factor on results of different methods, gain was kept constant for HCCI and PPC points. This caused the overexposure for SOI −15 °CA, while lower intensifier gain factors could strongly decrease the signal intensity of HCCI combustion strategies. However, the Fourier-based stratification method is independent of the camera and intensifier settings as discussed; hence, variable intensifier gain factors can be implented in future studies.
Figure 13 shows the maximum Fourier-based stratification achieved in a cycle as a function of ignition delay. Here, the ignition delay is defined as the difference between SOI (command) and CA10. It is observed that for increasing ignition delay, the combustion stratification decreases. Regarding PPC points with small ignition delays, the lower stratification level of side view images is due to the overlap of individual combustion clouds in the line-of-sight imaging in side view. Similar stratification levels are obtained for longer ignition delays, since the homogeneity is then independent of the line-of-sight. Obviously, the results of imaging from below are more reliable considering the distinction of individual combustion clouds.
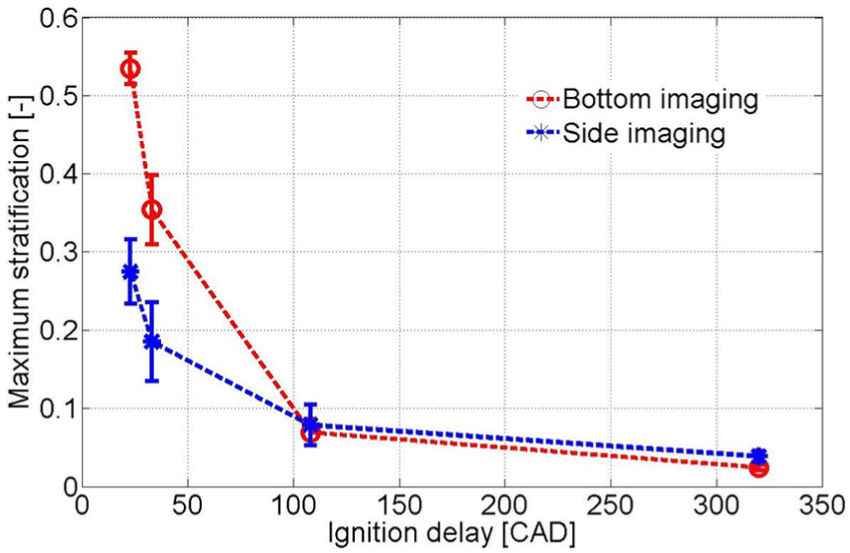
Maximum combustion stratification (Fourier-based) versus ignition delay for both bottom and side view imaging.
The results presented in this study might seem contradictive to the results obtained in the previous work. 11 In that study, it was stated that the combustion stratification decreases by retarding the SOI from −25 °CA to TDC. However, the CA50 was not kept constant for different injection timings in the previous work, 11 while the emphasis of this study is on the influence of ignition delay by keeping the CA50 constant.
Effect of the considered spatial frequency range
The Fourier-based stratification definition is based on a specific spatial frequency range
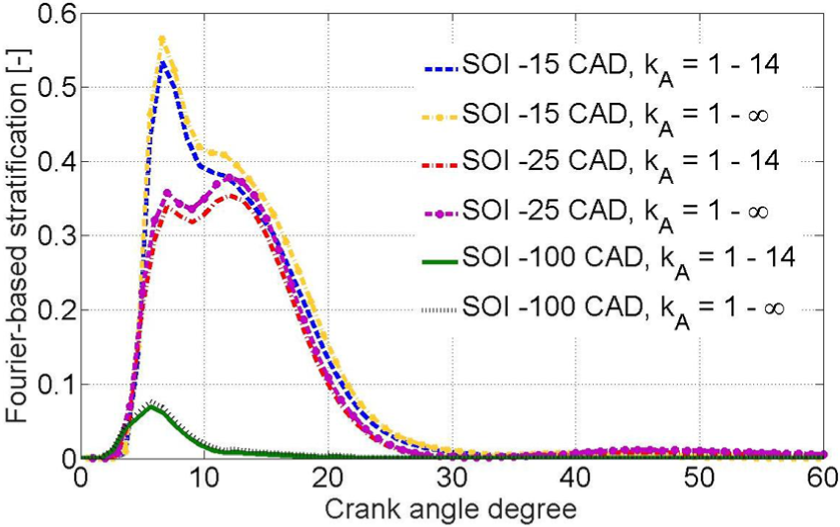
Effect of the considered spatial frequency range.
Conclusion
OH* bandpass imaging was performed in order to analyze the combustion in a light-duty optical engine. The objective of this study was to evaluate different metrics to quantify “combustion stratification” of PPC. A new methodology is proposed based on the spatial frequency domain of OH* bandpass images to quantify the combustion stratification. Regarding this method, the following is concluded:
Fourier-based stratification analysis is an objective method to compare the stratification of different combustion strategies, ranging from homogeneous HCCI combustion to stratified PPC combustion, and it clearly distinguishes those two regimes.
Fourier-based stratification analysis of OH* bandpass-filtered images corresponds to the temporal behavior of heat release rate (not the peak orders) as an indicator of the combustion, whereas other definitions clearly do not.
Low spatial frequencies contribute to the majority of the signal energy and combustion stratification.
The rejection of high spatial frequencies renders the Fourier-based method relatively insensitive to noise.
Results confirm that combustion stratification generally drops by increasing the ignition delay. However, there is an optimum combustion stratification level in the PPC regime where the peak heat release rate can be the lowest.
The method can also be implemented to analyze fuel stratification, based on, for example, fuel tracer laser-induced fluorescence (LIF) measurements or other fuel-mixing indicator methods.
Footnotes
Appendix 1
Acknowledgements
The authors would like to acknowledge Shell Global Solutions for providing the Volvo D5 optical engine setup. They also thank Luc Egelmeers for his support in carrying out the experiments during his Master’s project.
Declaration of conflicting interests
The author(s) declared no potential conflicts of interest with respect to the research, authorship and/or publication of this article.
Funding
The author(s) disclosed receipt of the following financial support for the research, authorship, and/or publication of this article: The research leading to these results has received funding from the People Programme (Marie Curie Actions) of the European Union’s Seventh Framework Programme FP7/2007-2013/ under REA Grant Agreement No. 607214.