
Abstract
This work compares the fundamental thermodynamic underpinnings (i.e. working fluid properties and heat release profile) of various combustion strategies with engine measurements. The approach employs a model that separately tracks the impacts on efficiency due to differences in rate of heat addition, volume change, mass addition, and molecular weight change for a given combination of working fluid, heat release profile, and engine geometry. Comparative analysis between the measured and modeled efficiencies illustrates fundamental sources of efficiency reductions or opportunities inherent to various combustion regimes. Engine operating regimes chosen for analysis include stoichiometric spark-ignited combustion and lean compression-ignited combustion including homogeneous charge compression ignition, spark-assisted homogeneous charge compression ignition, and conventional diesel combustion. Within each combustion regime, the effects of engine load, combustion duration, combustion phasing, compression ratio, and charge dilution are explored. Model findings illustrate that even in the absence of losses such as heat transfer or incomplete combustion, the maximum possible thermal efficiency inherent to each operating strategy varies to a significant degree. Additionally, the experimentally measured losses are observed to be unique within a given operating strategy. The findings highlight the fact that to create a roadmap for future directions in internal combustion engine technologies, it is important to not only compare the absolute real-world efficiency of a given combustion strategy but also to examine the measured efficiency in context of what is thermodynamically possible with the working fluid and boundary conditions prescribed by a strategy.
Introduction
The dominant prime-mover for personal mobility and freight transport is the internal combustion engine (ICE). In the United States, ICE applications are heavily dependent on market segment. For light-duty applications, spark-ignited (SI) engines dominate the segment, while compression-ignited (CI) engines, primarily based on conventional diesel combustion (CDC), dominate the heavy duty-passenger and freight transport segments.
SI engines rely on spark timing for controlling the combustion event, and therefore require fuels with high resistance to autoignition, which in the United States is specified by anti-knock index (AKI)—calculated by averaging the research octane number (RON) and motor octane number (MON). Recent evolution in the SI segment has been driven toward downsizing and downspeeding for maximum efficiency,1,2 which has seen the increased market penetration of enabling technologies such as continually variable or 6 +speed transmissions, gasoline direct injection (GDI), and turbocharging.3,4 At high loads, SI engines are limited by knock, and this is exacerbated by the downsizing trend. Methods of raising the knock limit include reducing compression ratio (rc) 5 which reduces efficiency, increasing fuel AKI,6–8 and the use of exhaust gas recirculation (EGR), which can result in efficiency gains comparable to compression ratio increases, 9 and also introduce problems with combustion stability.10,11
CI engines operating with a CDC strategy rely on combustion that is mixing-controlled, where combustion control is achieved through injection timing and pressure. Because CDC is not limited by knock, it can achieve high thermal efficiency by operating at high rc. The primary challenge with CDC is controlling NOx and soot emissions, which presents cost and efficiency trade-offs. 12 As an alternative to CDC, several advanced low-temperature CI strategies have been proposed.13–18 These strategies generally seek to avoid NOx and soot formation using long ignition delay and low equivalence ratio, which reduces peak temperatures. This approach has shown order-of-magnitude reductions in both pollutants while maintaining or improving on gross efficiency. However, these advanced concepts still face technical challenges such as control, stability, combustion noise, operating range, and transient capability before they are likely to find market acceptance.
To create a roadmap for future directions in ICE technologies, it is important to not only compare the absolute real-world efficiency of a given combustion strategy but also put that number in context of what is thermodynamically possible with the conditions prescribed by a given strategy. In other words, to assess the future potential of a given strategy, there needs to be an understanding of the efficiency ceiling, how close the state of the art is to the ceiling, and how much closer we can expect to come in the future. As an idealization, ICEs are often modeled as heat engines undergoing reversible thermodynamic cycles, such as the Otto cycle. In the Otto cycle, the working fluid is air with a constant ratio of specific heat,
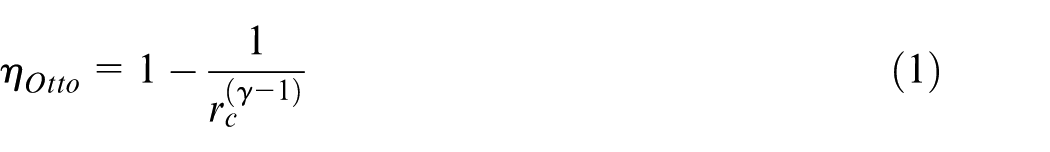
For a closed cycle with constant
Methods
The current approach uses a first-law thermodynamic model coupled with experimental data from multiple GM 2.0L GDI SI engines (engine code LNF) and a GM 1.9L compression-ignition engine (engine code DTH). The subsequent sections will detail the specifics of the thermodynamic model and experimental platforms.
Thermodynamic model
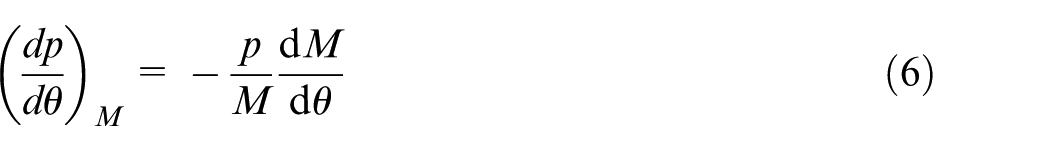
For this work, a model was developed to track the properties of a working fluid undergoing a prescribed heat release profile. This model is based on a single-zone, first-law analysis of an ideal gas under adiabatic conditions, with all derivatives taken in the crank angle (CA)
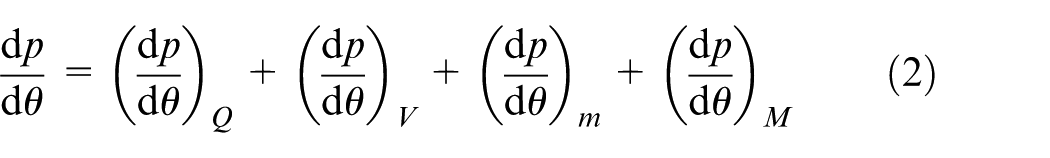
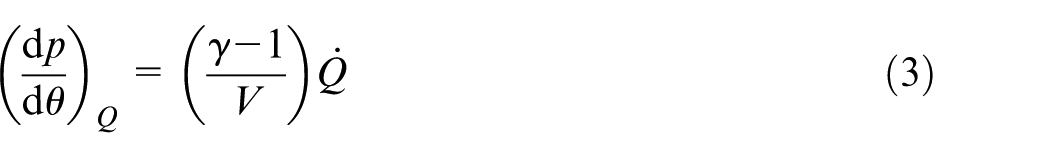
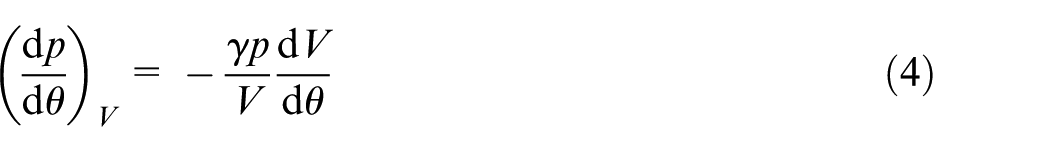
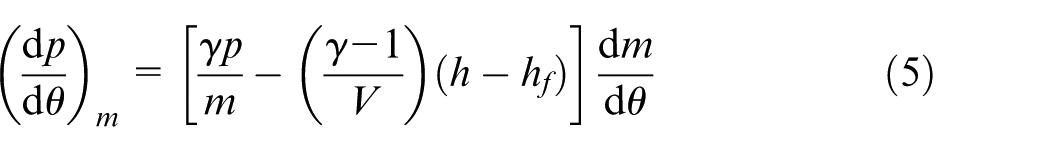
where
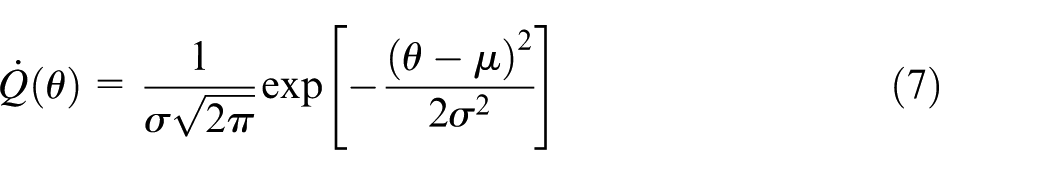
The model assumes that the rate of conversion from reactants to products is proportional to the rate of heat release. No kinetic models, intermediate species, or dissociation products are considered. Any injected fuel is assumed to vaporize and mix instantly, and the enthalpy difference between the fuel and air (including enthalpy of vaporization) is captured in equation (5). No other mass changes are considered. The simulation spans from −180° to +180°CA aTDC and does not consider any gas exchange process. At each step in the simulation, the thermodynamic properties of the fluid (
Experimental platforms and conditions
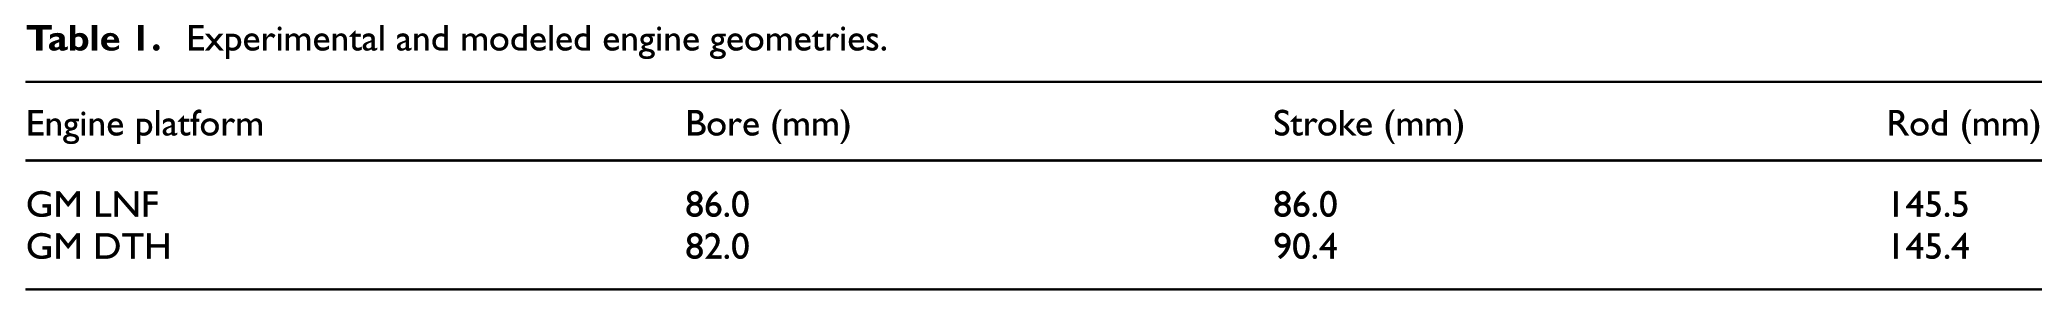
The operating conditions from the selected experimental results were used as inputs to the model described in the previous section. The specifics of the engine design parameters are presented in Table 1. Note that the bore, rod length, and stroke are similar between the two engine platforms, representing common light-duty passenger car applications.
Experimental and modeled engine geometries.
The experimental conditions are presented in Table 2. The engine speed for all experimental conditions was 2000 r/min. The operating conditions can be grouped into three general combustion modes: autoignition, mixing-controlled, and flame propagation. For the cases shown in Table 2, the engine was operated at conditions relevant to the given combustion strategy and with an emphasis on achieving the highest practical gross thermal efficiency (GTE) while sweeping load. For each condition, load sweeps were conducted from 200 kPa gross indicated mean effective pressure (IMEPg) to a constraint of CA50 of 25°CA aTDC, coefficient of variation (COV) of IMEPg of 3%, 96 dB combustion noise, or the engine peak cylinder pressure limit. Additional information on the operating conditions, engine specifics, and detailed results can be found in previous works.6,7,28,29
Experimental and modeled engine operating conditions for load sweeps.
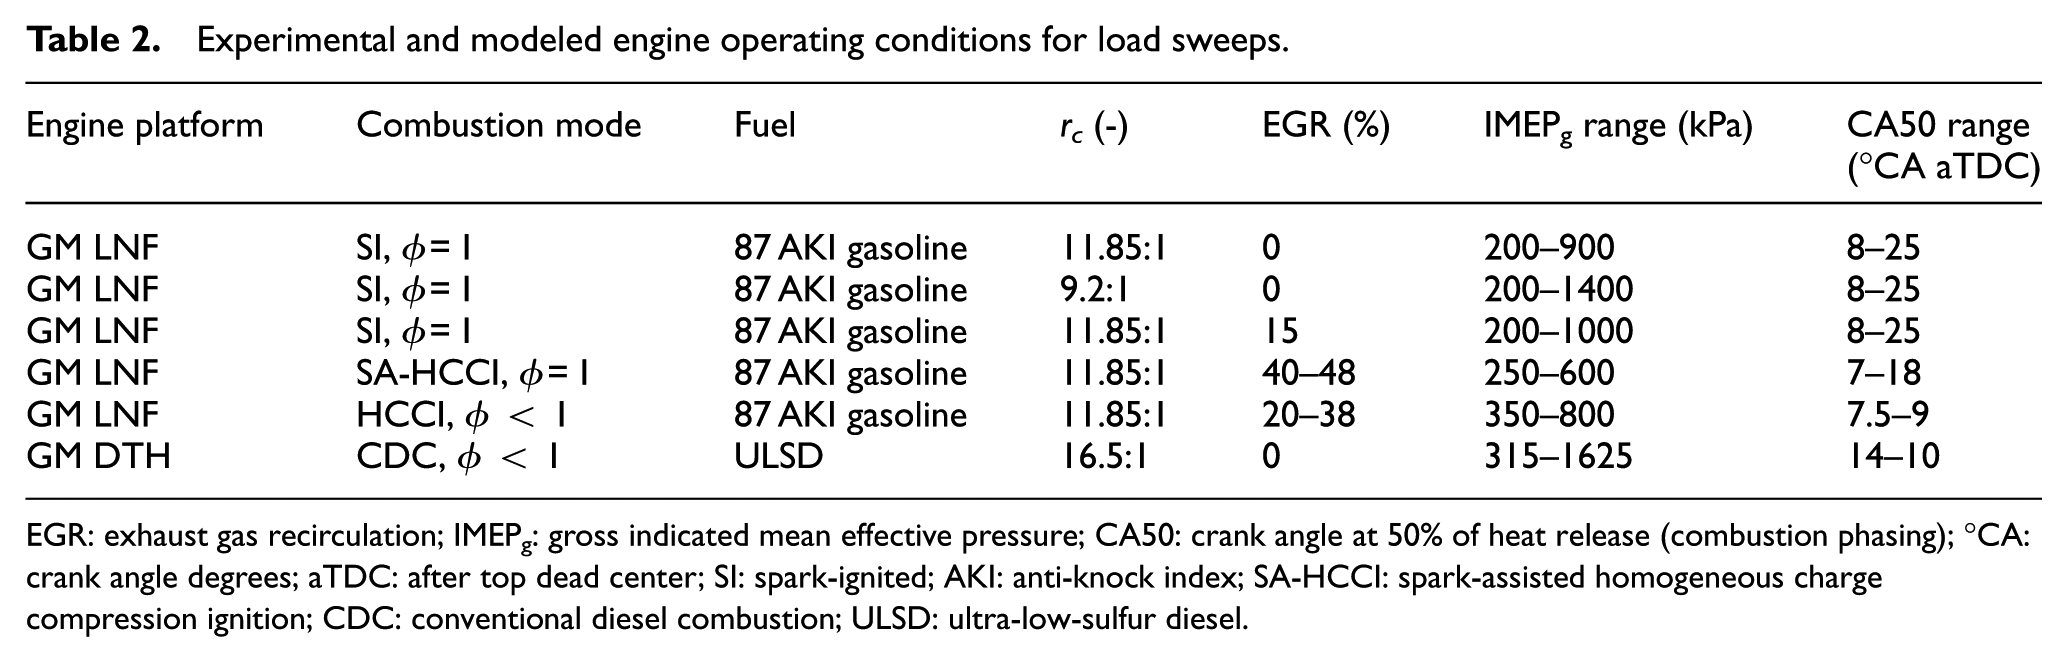
EGR: exhaust gas recirculation; IMEPg: gross indicated mean effective pressure; CA50: crank angle at 50% of heat release (combustion phasing); °CA: crank angle degrees; aTDC: after top dead center; SI: spark-ignited; AKI: anti-knock index; SA-HCCI: spark-assisted homogeneous charge compression ignition; CDC: conventional diesel combustion; ULSD: ultra-low-sulfur diesel.
Results and discussions
The results are presented in three sections: combustion phasing and duration, stoichiometric operation, and lean operation.
Thermodynamic implications of combustion phasing and duration
A visualization of the impact that combustion phasing and duration have on modeled thermal efficiency is shown in Figure 1. The reactants for this example were a premixed stoichiometric mixture of iso-octane and air with no EGR and a starting temperature of 40°C at −180°CA aTDC. The modeled volume trace was prescribed from the geometry of the LNF engine in Table 1 with rc = 11.85:1. The general trend, as expected, is that increasing combustion duration and moving combustion phasing away from TDC both contribute to decrease efficiency, because both cause a reduction in the effective expansion ratio. However, due to the temperature dependence of
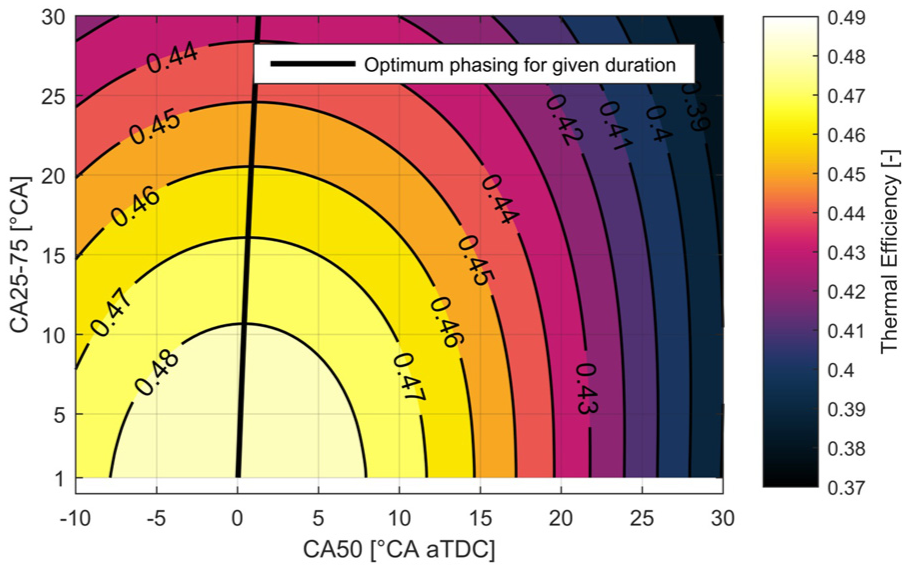
Contour plot of model-predicted maximum thermal efficiency (no losses) as a function of combustion duration and phasing for a stoichiometric mixture of iso-octane and air in the LNF engine with rc = 11.85:1. The heavy solid black line represents the combustion phasing resulting in maximum efficiency for a given value of combustion duration.
For each of the experimental cases in the load sweep from Table 2, CA50, CA25–75, and GTE were calculated from the measured in-cylinder pressure. The results are shown in Figure 2, where all data are plotted on a common axis in Figure 2(a) and are also delineated by combustion regime and load sweep direction in Figure 2(b)–(d). Figure 2 illustrates that a wide range of CA50, CA25–75, and GTE are encountered in the various regimes and that each moves through the CA25–75 versus CA50 space in a different way as load is increased. For the CDC load sweep, shown in Figure 2(c), the low-load condition has relatively late phasing and short duration, and the initial load increase is achieved by increasing injection duration at fixed start of injection (SOI), which causes combustion duration to increase without changing the phasing, because the rate of combustion is limited by the rate of injection due to the majority of heat release occurring within the mixing-limited regime. As illustrated in Figure 1, there is only a modest thermodynamic penalty to increasing CA25–75 in this range of CA50, and it is outweighed by other factors such as changing equivalence ratio, heat transfer, and incomplete combustion, resulting in a 2% absolute GTE improvement from 315 to 600 kPa IMEPg. At this transition point, the operating strategy transitions to 0% EGR with the EURO 4 emissions calibration used for these experiments. The CDC strategy changes such that SOI advances while increasing rail pressure, which causes combustion phasing to advance and the premixed portion of the burn to increase, essentially maintaining constant combustion duration. This coincides with a 1.7% absolute GTE improvement from 600 to 1625 kPa IMEPg.
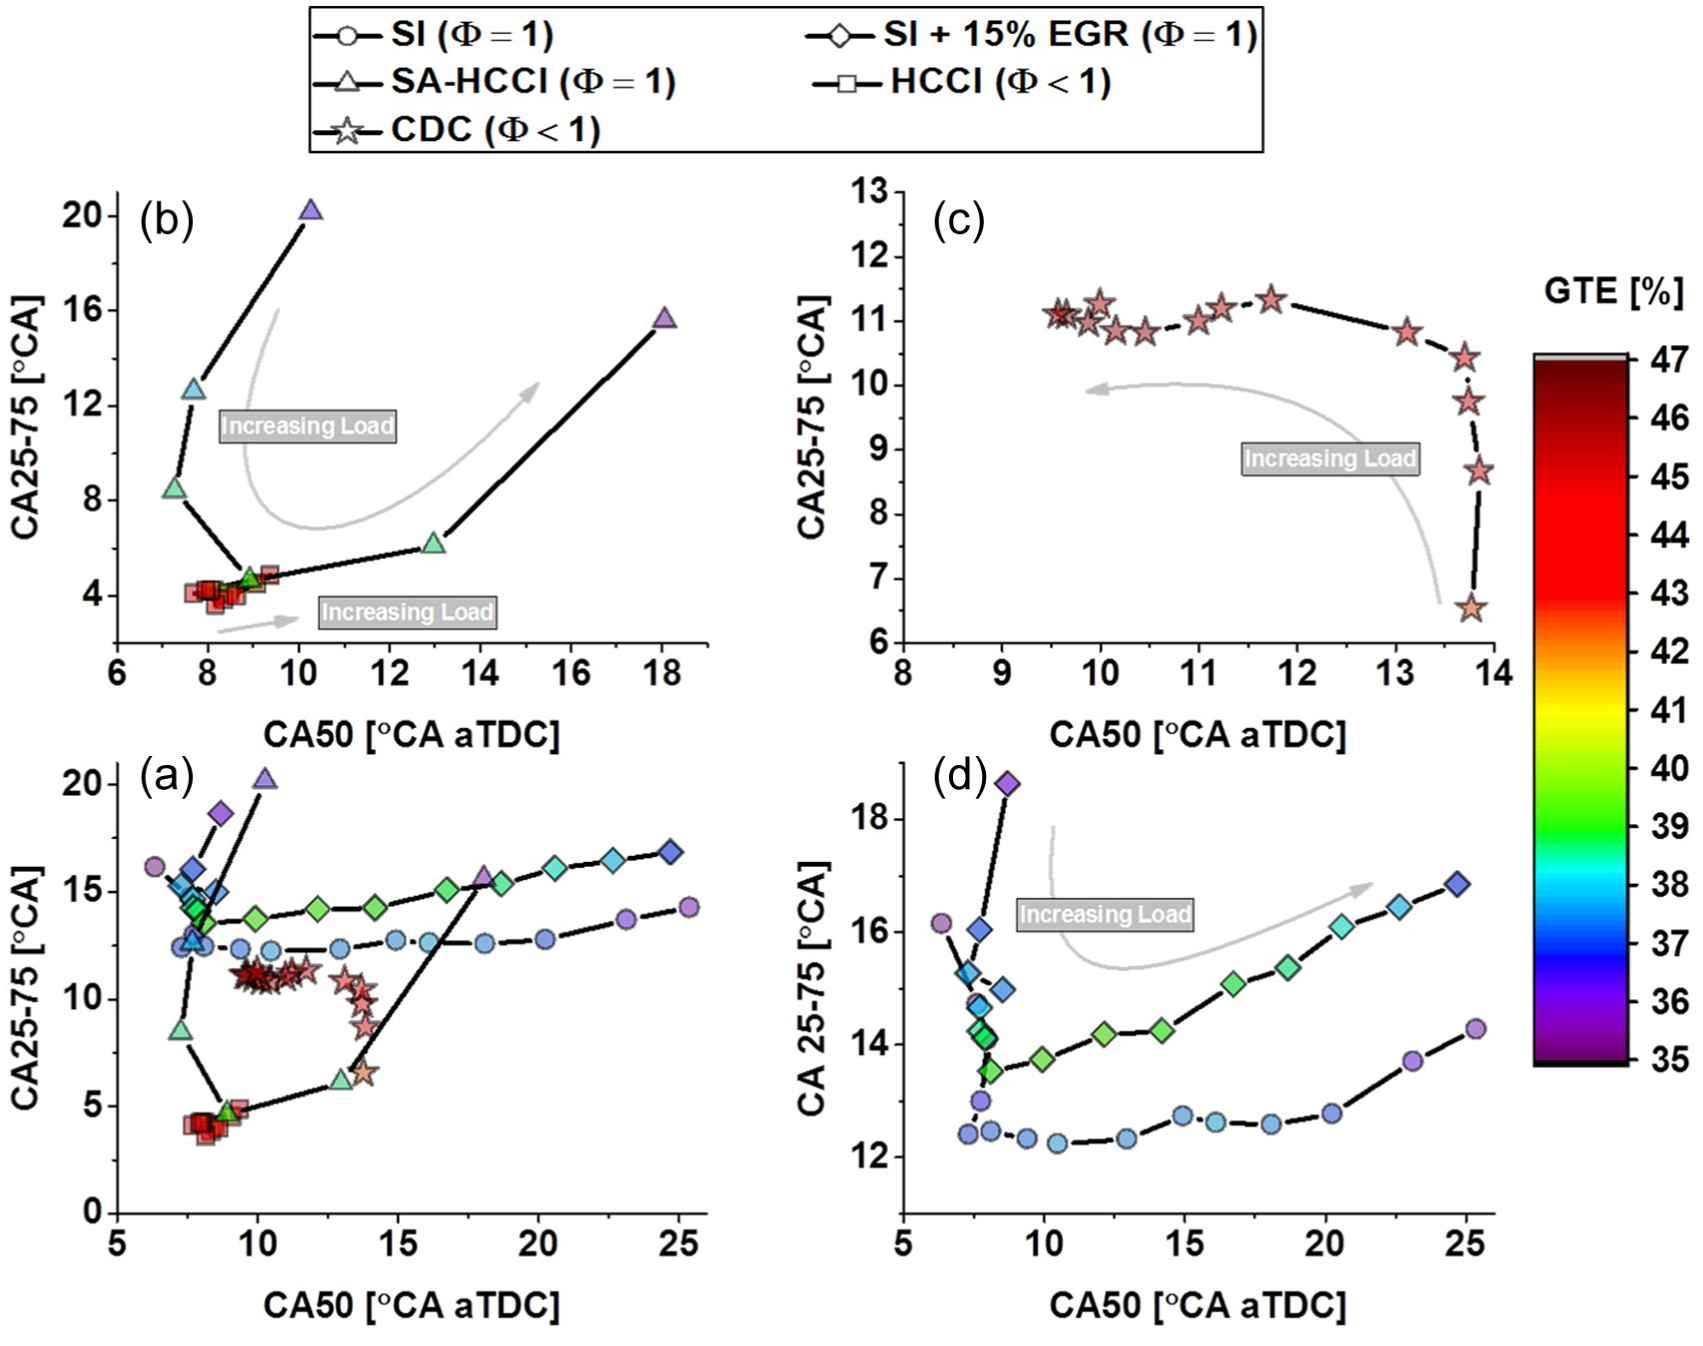
Load sweep of various combustion regimes from two engines (Table 2) illustrating combustion phasing and duration effects shaded by GTE: (a) all data, (b) autoignition regime (HCCI and SA-HCCI), (c) mixing-controlled regime (CDC), and (d) flame-propagation regime (SI).
For the SI load sweeps, shown in Figure 2(d), the path through the combustion phasing and duration space is essentially opposite to the CDC strategy in Figure 2(c). For SI combustion, idle occurs at relatively advanced phasing and long duration, and the initial load increase occurs with a maximum brake torque (MBT) strategy at fixed phasing and coincides with a decrease in duration and an increase in GTE. Once the knock limit is reached, the spark timing is retarded with further load increase, a region commonly referred to as knock-limited spark advance (KLSA). Increased load in the KLSA region coincides with a moderate increase in duration and a 1.4% absolute decrease in GTE from KLSA onset at 500–900 kPa IMEPg for the 0% EGR case shown in Figure 2(d). The addition of 15% EGR shifts the entire SI load sweep to longer combustion duration, but has several benefits that will be discussed in the following sections. Note that the GTE trends for SI follow Figure 1 more closely than those for CDC because SI employs fixed equivalence ratio
Two distinct combustion strategies are included in the autoignition regime presented in Figure 2(b). Homogeneous charge compression ignition (HCCI) operates at lean conditions throughout its load sweep and is contained to a small region at early combustion phasing and short combustion duration, all of which are beneficial to GTE. However, the lack of control over the heat release profile for HCCI relative to the other strategies is evident in Figure 2(a). Spark-assisted (SA) HCCI operates at
To directly compare the measured efficiency to the model-predicted efficiency, the measurement conditions were provided as inputs to the model. In this approach, the measured CA50, CA25–75, initial conditions (i.e. intake temperature, EGR,
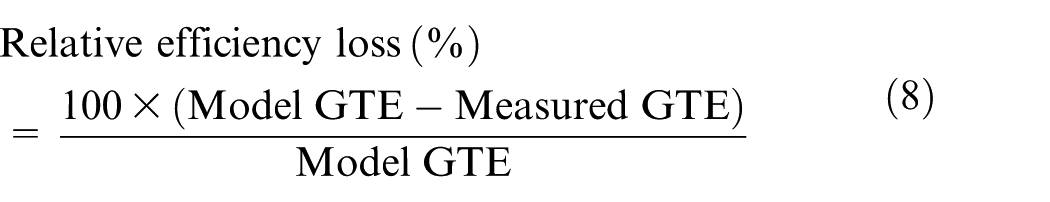
Using this approach, the trends of Figure 2 were analyzed in terms of the relative efficiency loss as a function of combustion phasing and presented in Figure 3. Data in Figure 3 show that as the load increases, the relative efficiency loss decreases. Interestingly, for combustion modes that are knock-limited, that is, SA-HCCI in Figure 3(b) and SI in Figure 3(d), the relative efficiency loss decreases with increasing load even when combustion phasing is retarded. On the contrary, Figure 3(c) shows that CDC actually advances combustion phasing with load and continues to reduce relative efficiency loss with increasing load. Finally, unlike the SI and CI strategies that illustrate reduction in relative efficiency loss that are functions of combustion phasing, the HCCI data in Figure 3(b) were contained to a narrow range of CA50, and the SA-HCCI data show little to no dependency of relative efficiency loss on combustion phasing. The data for all three regimes are shown together in Figure 3(a), where trends in relative efficiency loss seem to be non-universal as a function of combustion phasing. This finding illustrates that there are complex aspects and relations present in trends of engine efficiency which could be regime dependent and may not be uniquely aspects of combustion phasing. What is suggested by the trends in Figure 3 is that relative efficiency loss may be better correlated to load than combustion phasing. To explore this possibility, the data in Figure 3 were plotted as a function of IMEPg in Figure 4.
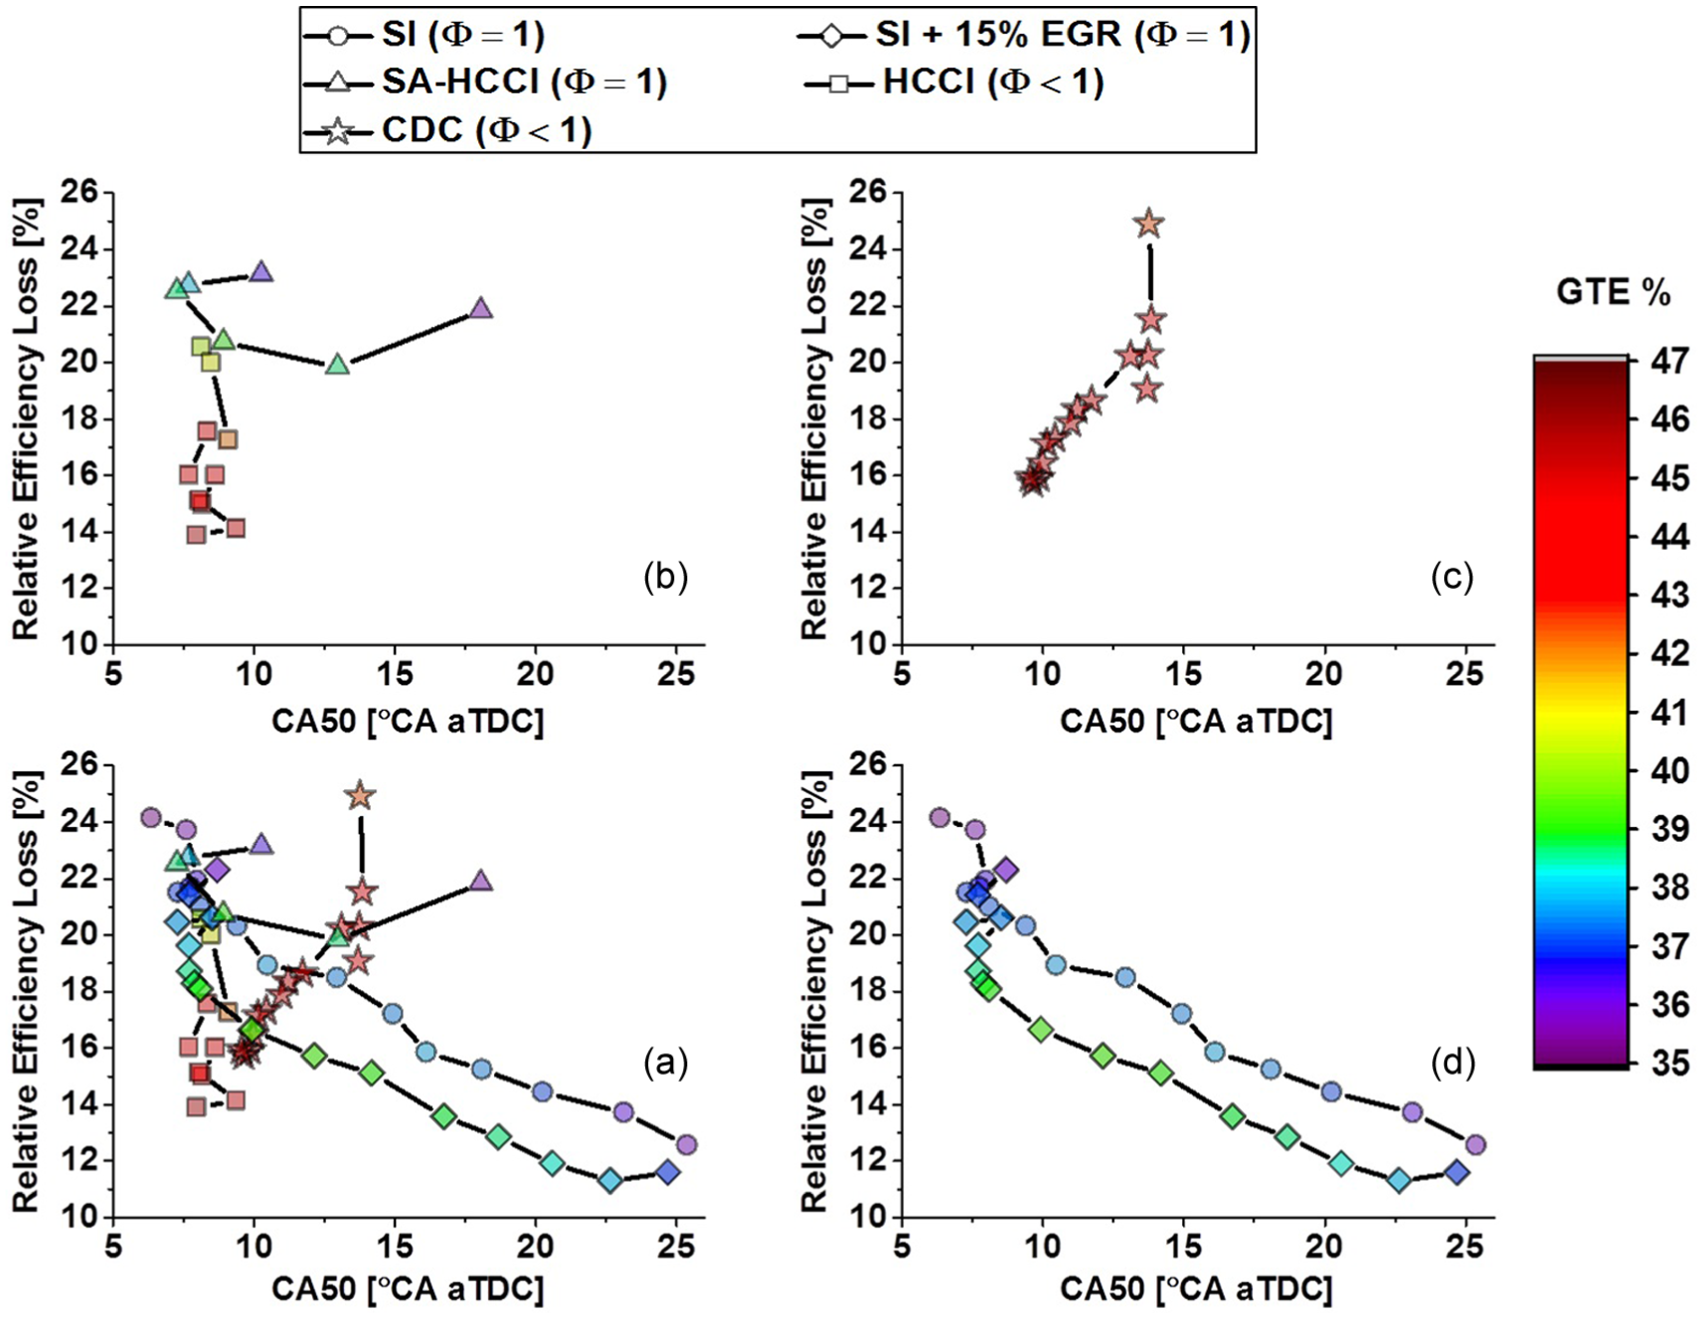
Relative efficiency loss as a function of combustion phasing for various combustion regimes from two engines (Table 2) illustrating reduction in losses with increasing load: (a) all data, (b) autoignition regime (HCCI and SA-HCCI), (c) mixing-controlled regime (CDC), and (d) flame-propagation regime (SI).
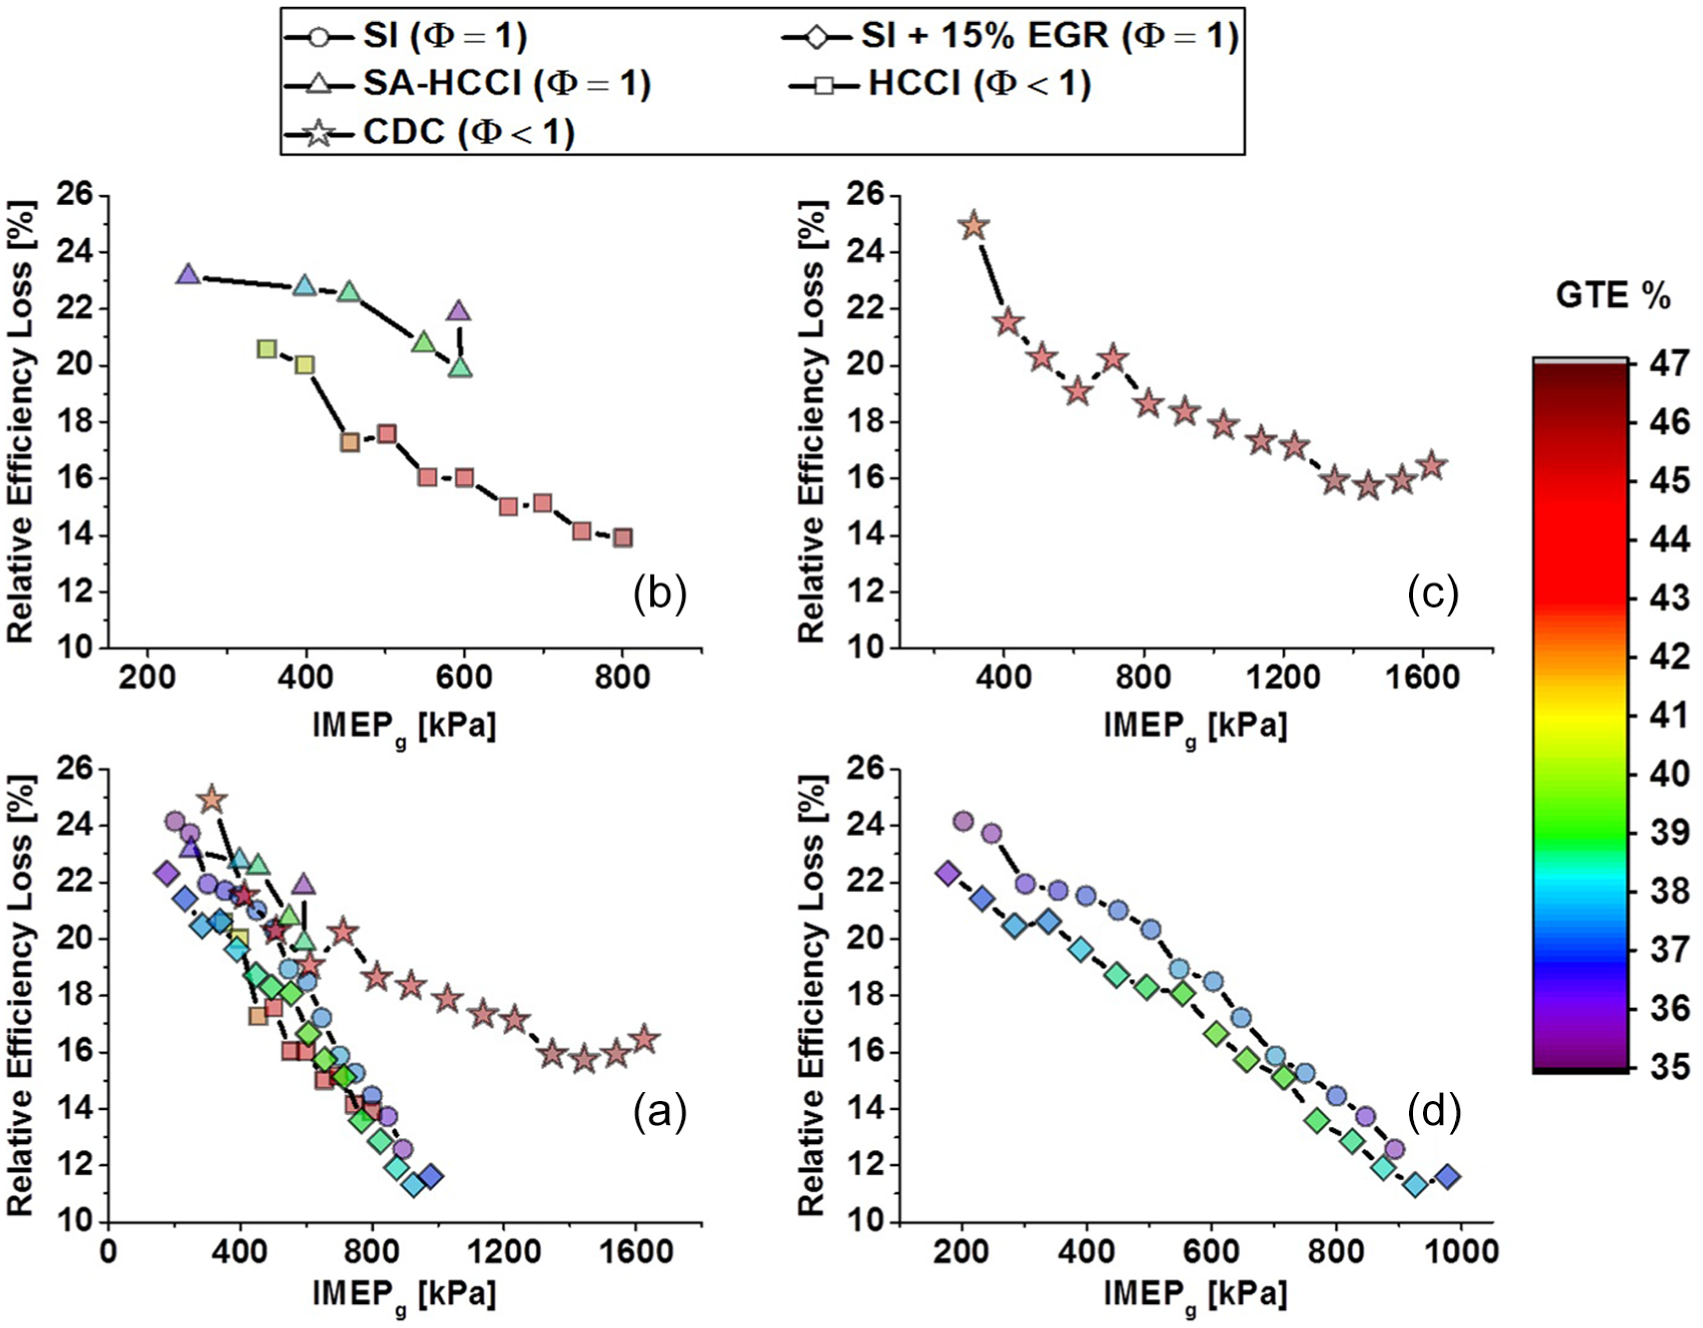
Load sweep of various combustion regimes from two engines (Table 2) illustrating reduction in losses with increasing load: (a) all data, (b) autoignition regime (HCCI and SA-HCCI), (c) mixing-controlled regime (CDC), and (d) flame-propagation regime (SI).
While Figure 4(a) shows that all combustion strategies except CDC tend to operate with a similar relative efficiency loss for a given load, it should be noted that the absolute GTE values are widely divergent, with a nearly 10% GTE difference between modes. The CDC trend in Figure 4(a) does show that relative efficiency loss is inversely proportional to load; however, the trend is not as steep as with the other combustion strategies. Again, unlike the other combustion strategies, as load increased with CDC, combustion phasing was advanced, causing an increase in heat transfer. CDC is the only combustion regime not knock-limited (HCCI has a knock-induced noise limit), suggesting that if knock is not encountered, there could be dependency of relative efficiency loss on combustion phasing. Another factor illustrated in Figure 4 is that dilution could also offer reduced relative efficiency loss. For example, Figure 4(d) shows that the addition of 15% EGR with SI combustion reduced losses for a given load, and comparing directly to lean operation with HCCI in Figure 4(a) shows similar or slightly greater reductions. Whether accomplished by adding EGR or air, dilution tends to reduce heat transfer by decreasing the temperature of the charge. The effects of EGR on SI combustion will be studied in greater detail in the following section, but the trends observed in Figure 4 suggest that the complex relations previously shown in Figure 3 could be functions of heat transfer and incomplete combustion, which both tend to decrease on a relative basis as load increases.
Thermodynamic implications of stoichiometric operation
To understand how the working fluid impacts efficiency, we first look at the ratio of specific heat,
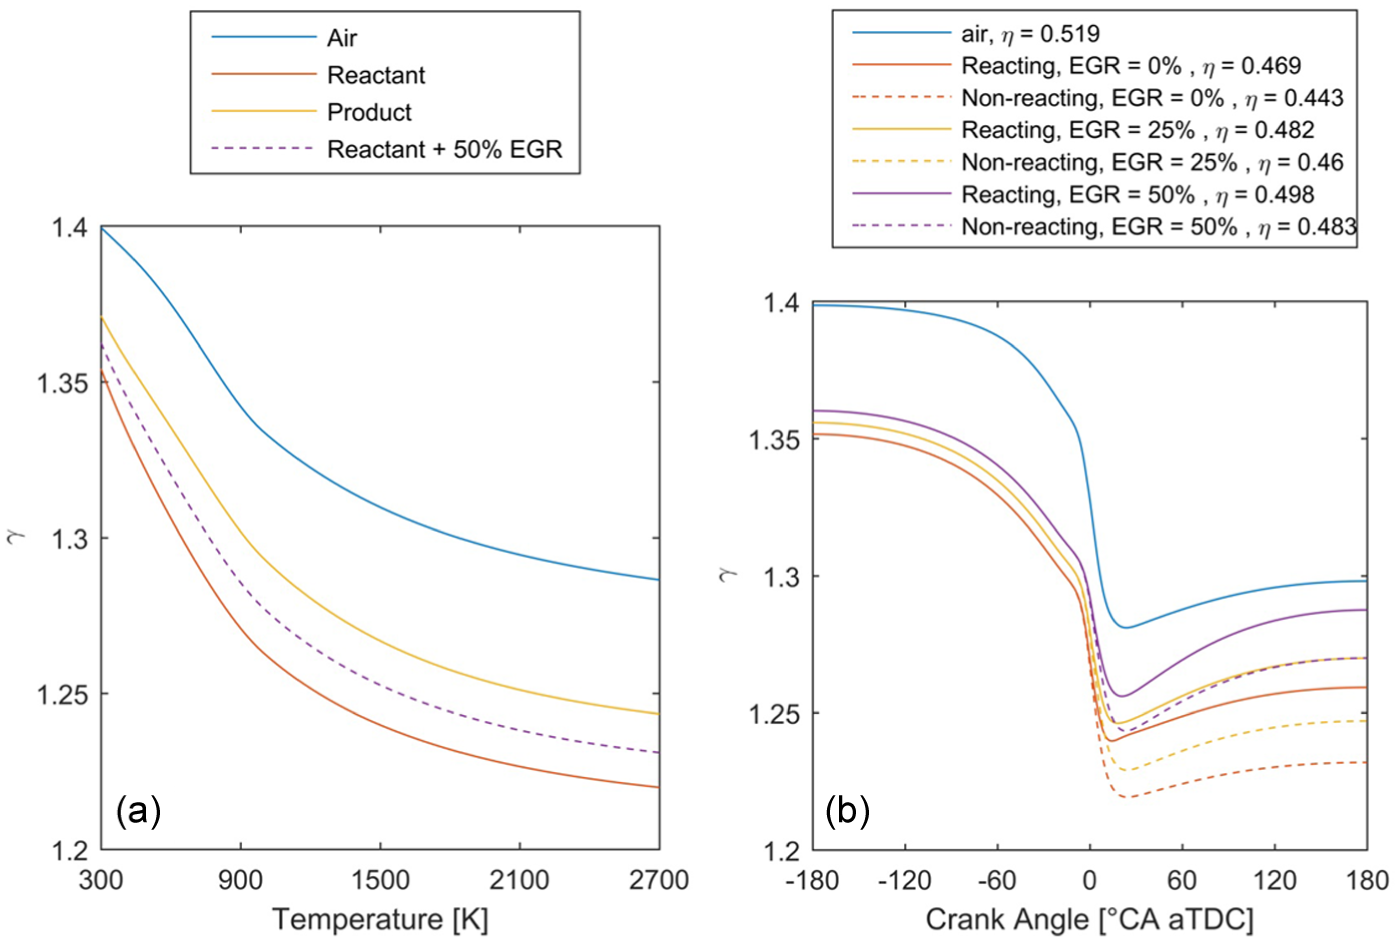
(a) Ratio of specific heat as a function of temperature for air, a stoichiometric reactant mixture of iso-octane and air, a product mixture resulting from combustion of the reactants, and the reactant mixture with 50% EGR and (b) ratio of specific heat as a function of crank angle for air and stoichiometric mixtures of iso-octane and air with various levels of EGR, both reacting and non-reacting.
As noted in Figure 5(b), the iso-octane cases were simulated as both “reacting” and “non-reacting,” with an assumption of transition from reactants to products and fixed composition, respectively. Note that the rate of heat release was imposed identically for all cases regardless of the working fluid or transition to products, which is simply modeled as being coincidental with heat release in the reacting cases. Comparing the reacting and non-reacting cases therefore illustrates the effect of compositional changes and molar conversion and expansion on
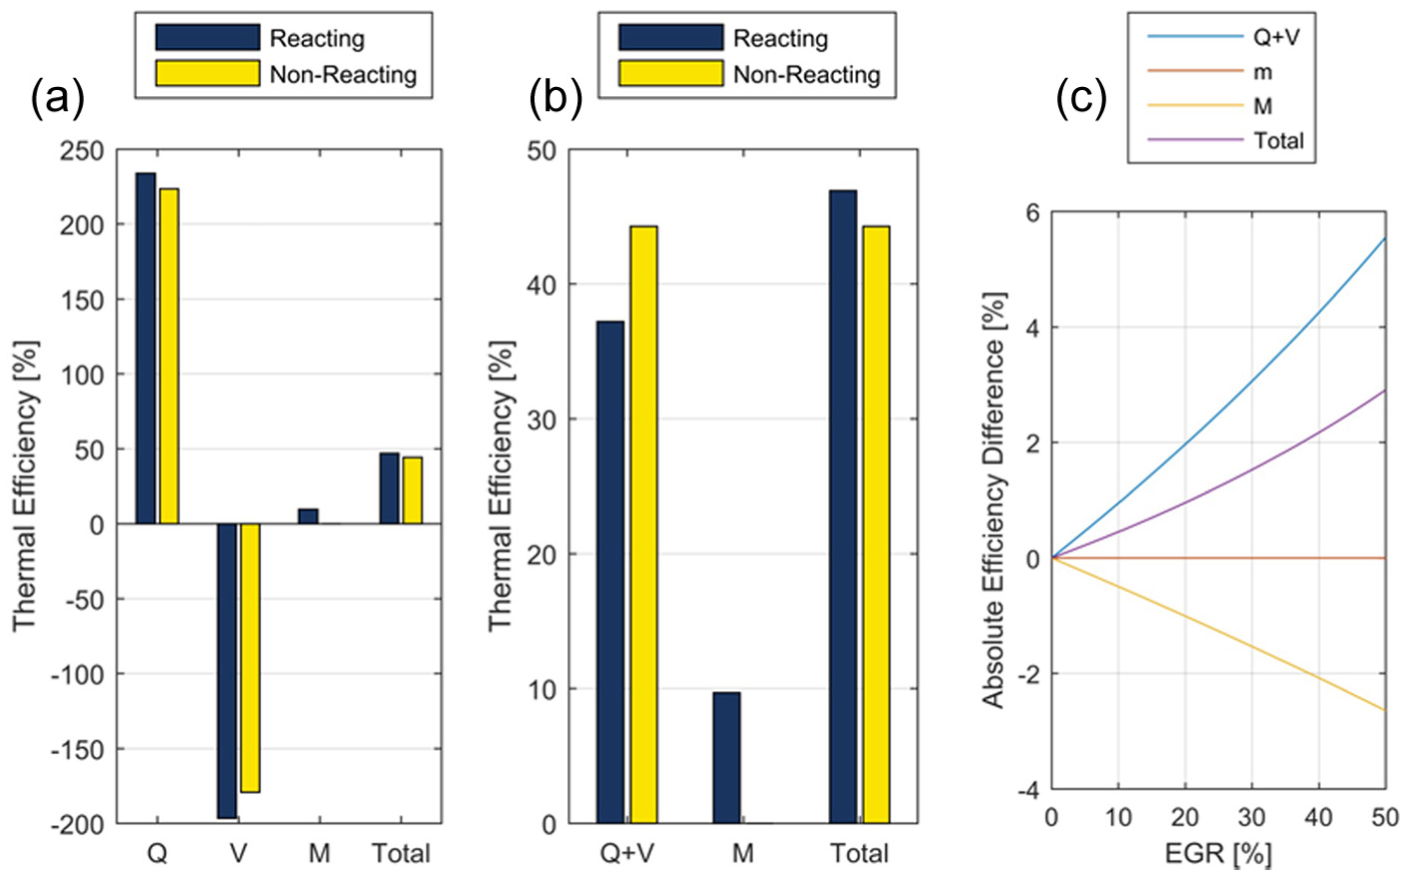
(a) Individual contributions to efficiency from the heat addition, volume, and molecular weight terms for the 0% EGR cases from Figure 5(b), (b) same plot with the contributions from heat addition and volume combined, and (c) change in absolute efficiency of each term with addition of EGR, relative to the 0% EGR case.
Figure 6(a) illustrates the individual contributions to overall efficiency for each term in equations (3)–(6) using the 0% EGR cases from Figure 5(b). Equations (3)–(5) are dependent on
To explore the model-predicted effects in Figures 5 and 6, measurements and the model predictions were compared. The measurements were conducted for premixed SI engine operation on a common GM LNF platform with 9.2:1 or 11.85:1 rc and 87AKI fuel (90 RON). The specifics of the conditions are provided in Table 2 for the three experiments to be discussed here: 0% EGR at 9.2:1 rc and both 0% and 15% EGR at 11.85:1 rc. Load was swept from 200 kPa to knock at MBT CA50 (8°CA aTDC) for all configurations. Once knock-limited, CA50 was retarded from 8° to 25°CA aTDC while maintaining constant combustion noise and visual inspection of end gas knock. Further details on the specific results and approach are found in Splitter and Szybist.6,7,28 The general operating conditions for the experiments, that is, engine geometry, rc, intake temperature, and EGR rate, were used as inputs to the model to generate efficiency contours as a function of combustion phasing and duration, such as the one presented in Figure 1. The model used a toluene reference fuel (TRF) with a molar blend of 50% iso-octane, 20% n-heptane, and 30% toluene, which was determined using the method described by Morgan et al., 31 resulting in an octane rating and H/C ratio equivalent to the 87AKI gasoline used in the measured conditions from Table 2. This blend is referred to as TRF87.
The experimental values and model contours of GTE as a function of CA50 and CA25–75 are compared in Figure 7, which reveals several interesting trends in combustion phasing and duration space, as well as the effects of relative efficiency loss as a function of load. First, in Figure 7(a), for a given combustion phasing and duration, the model-predicted efficiency contour lines illustrate that the efficiency of the 11.85:1 rc is higher than the 9.2:1 rc. This is not unexpected, as the Otto cycle efficiency given in equation (1) is a function of compression ratio. However, what is illustrated in Figure 7(a) is that the compression ratio could not be increased without affecting combustion phasing or duration. Increasing rc required both a reduction in load and an increase in combustion duration to maintain a given phasing, and maintaining a given load required both a retard in phasing and increase in duration. While the impact of duration was minimal due to the nearly vertical slope of the efficiency contours in this region, being forced to retard combustion phasing moved the 900-kPa IMEPg point from just above the 44% model GTE contour for 9.2:1 rc to below the 42% model GTE contour for 11.85:1 rc. This resulted in a decrease in measured GTE for the 900-kPa load condition, even with the reduction in relative efficiency loss shown in Figure 7(b). This reduction in relative efficiency loss with increased compression ratio can be attributed to heat transfer reduction due to retarded combustion phasing, which reduces peak temperatures, in-cylinder turbulence intensities, and the amount of time available for heat transfer. However, these reductions in relative efficiency loss are not enough to overcome the direct GTE loss due to retarded combustion phasing. In addition to the decrease in GTE for a given load, operating with 11.85:1 rc also restricts the maximum load due to combustion instability and increased exhaust gas temperatures encountered at very retarded combustion phasing.
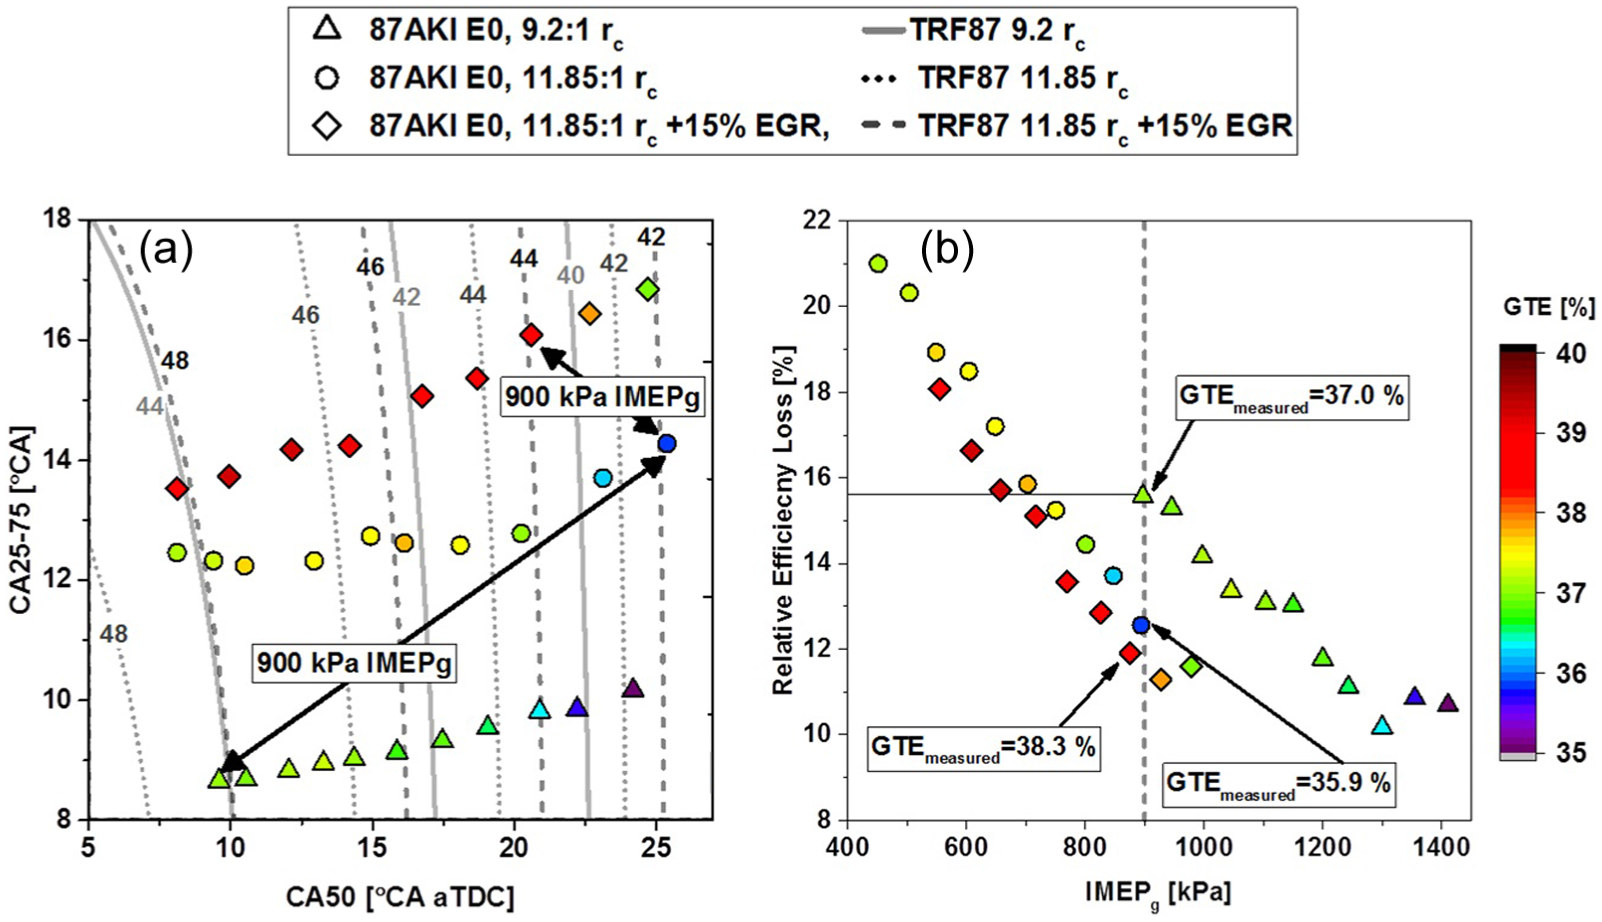
Measured KLSA conditions of 87 AKI fueled data from (Table 2): (a) model-predicted contours overlaid with measured data and measured GTE in CA25–75 versus CA50 space and (b) the same measured data plotted in relative efficiency loss versus IMEPg space.
One method for recovering the lost GTE and load at increased compression ratio is the use of EGR, which reduces the bulk gas temperature by diluting the charge, and therefore reduces knocking propensity. As Figure 7(a) shows, the addition of 15% EGR allowed the 900-kPa IMEPg point to advance in phasing while increasing in duration. The increase in duration has a negligible impact on model GTE, while the advance in phasing moves the operating point up the efficiency gradient. Simultaneously, the use of EGR inherently increases the efficiency for a given phasing and duration by increasing
The trends in Figure 7 illustrate that relative efficiency losses can be reduced through increasing load or rc, albeit with tradeoffs between load range and absolute efficiency. However, EGR was found to reduce the tradeoff magnitude by increasing load range, but more importantly, the combination of increasing rc with EGR offered multiple benefits in both relative efficiency loss and absolute GTE through
Thermodynamic implications of lean operation
CDC and other compression-ignition strategies typically involve direct injection under lean conditions. The model presented here allows us to examine the losses inherent to direct injection as described in equation (5), as opposed to the previous analysis in which the charge was assumed to be completely premixed before the start of simulation. For the purpose of illustration, simulations were performed with n-heptane at ϕ = 0.3, a starting temperature of 100°C, CA50 = 10°CA aTDC, and CA25–75 = 10°CA using the geometry of the LNF engine with rc = 11.85. The evolution of
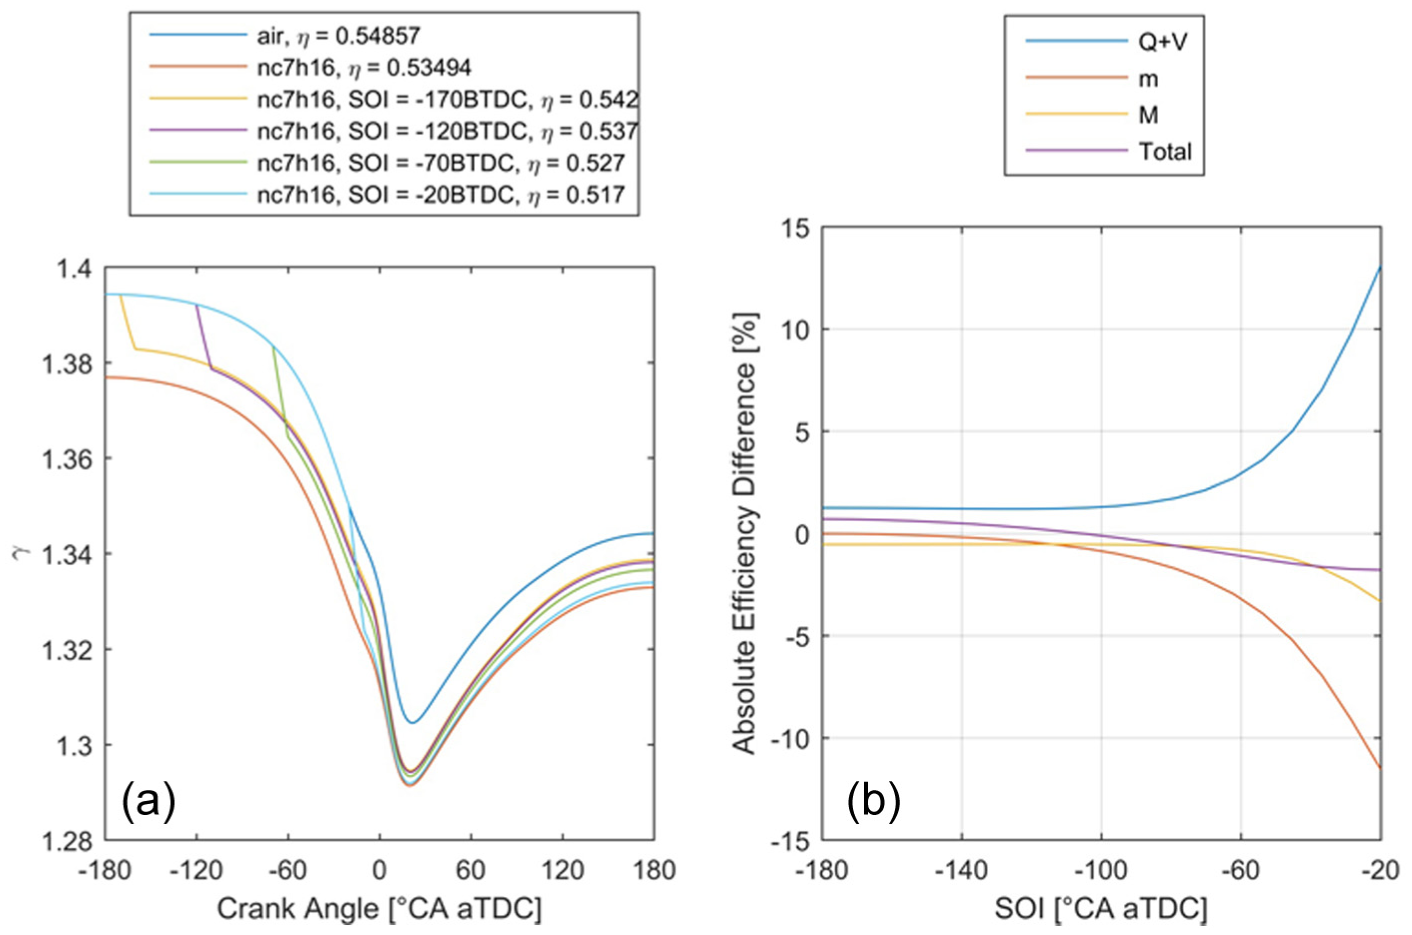
(a) Ratio of specific heat as a function of crank angle for air and lean mixtures of n-heptane and air at the premixed condition and with various injection timings and (b) change in absolute efficiency of the heat addition, volume, and molecular weight terms as a function of injection timing, relative to the premixed case.
Figure 8(a) shows that before the fuel is injected, the mixture is composed only of air, and therefore has a higher
The addition of EGR to lean combustion has several complications when compared to stoichiometric combustion, one of which is the selection of equivalence ratio and the subsequent impact on
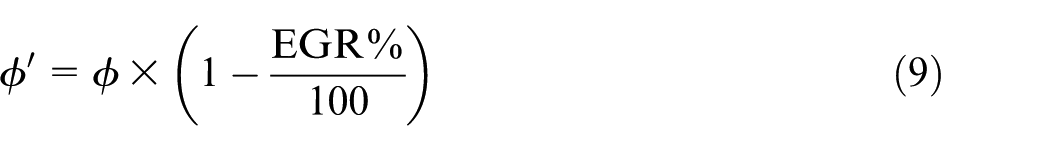
In other words, the two bounding cases for CI engine operation are that charge mass increases by adding EGR to a conserved mass of air (
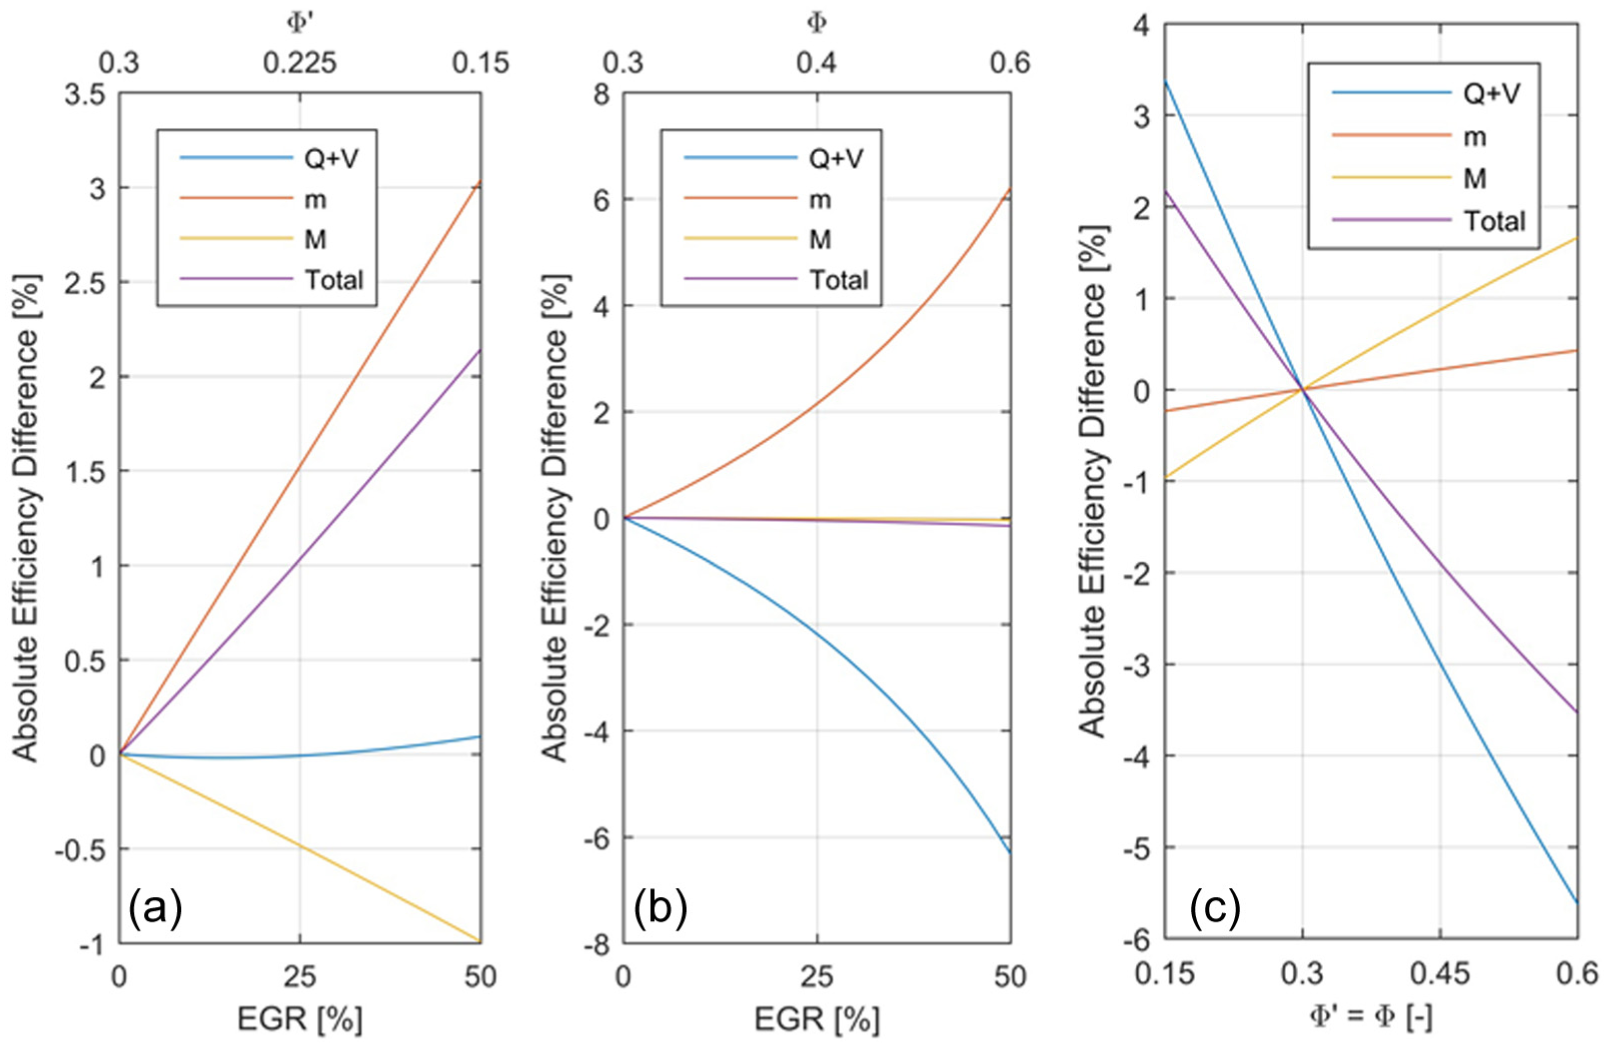
(a) Individual contributions to efficiency from the heat addition + volume, mass, and molecular weight terms for an EGR sweep under diesel-like combustion at
Conserving air with increasing EGR in Figure 9(a) illustrates that the total efficiency increases with EGR. Interestingly, since near-TDC injections were assumed (i.e. diesel combustion), the dilution from EGR actually decreases
Unlike the trends observed in Figure 9(a) with conserved air, if the total mass is conserved with increasing EGR, the trends in efficiency change significantly. Figure 9(b) shows the case of constant charge mass at
To put these results in context, a third case with no EGR was performed, in which the equivalence ratio was swept across the same values as the previous two cases. These results, in which
Conclusion
This analysis has described and coupled a first-principles zero-dimensional thermodynamic engine model with measured engine data. The results showed that combustion phasing and duration are important factors that contribute to engine efficiency, but several other factors are equally if not more important to realizing high engine efficiency:
Combustion phasing and duration space
•With all other variables constant, efficiency improves with decreased combustion duration and combustion phasing closer to TDC, though the temperature dependence of
•The various combustion strategies occupy different areas of the space, and their approach to traversing it with increasing load varies dramatically. Efficiency tends to maximize as load increases, provided that load can be increased without excessive CA50 retard.
Stoichiometric premixed charge SI engine operation
•The addition of EGR reduces the efficiency benefit due to molar expansion, but still provides an overall increase in efficiency due to increase in
•EGR reduces heat transfer losses, resulting in measured GTE closer to the model-predicted GTE.
•Efficiency is reduced during KLSA operation due to retarded combustion phasing, although not to the extent predicted by the model due to reduced heat transfer.
•Increased compression ratio can cause a reduction in efficiency for a given load by forcing the combustion phasing to retard to avoid knock (entering KLSA sooner) and by increasing heat transfer during MBT operation.
In lean CI engine operation
•Direct injection of fuel close to TDC creates a significant efficiency penalty due to pressure reduction and the impact on the molecular weight of the working fluid. This suggests that advanced CI strategies which take advantage of premixing or early direct injection may have implicit efficiency advantages that are not easily seen in the experimental results.
•Maintaining charge mass (constant
•Charge dilution (constant
•Charge dilution with the addition of air can increase efficiency primarily by increasing
The presented findings illustrate that maximizing engine efficiency employs factors beyond those expressed in the Otto cycle. Most importantly, efficiency is affected not only by working fluid properties but also reductions in heat transfer, combustion phasing, fuel delivery strategies, fuel properties, and engine combustion chamber design. This analysis provides a guide as to methods and fundamentals for increasing engine efficiency, but is by no means an exhaustive analysis. Regardless, the findings and approach provide pathways for improving engine efficiency, demonstrating opportunities and challenges based on thermodynamic principles.
Footnotes
Appendix 1
Appendix 2
Acknowledgements
This research used resources at the National Transportation Research Center, a DOE Office of Energy Efficiency and Renewable Energy User Facility operated by the Oak Ridge National Laboratory.
Funding
The author(s) disclosed receipt of the following financial support for the research, authorship, and/or publication of this article: This material is based on the work supported by the US Department of Energy, Office of Energy Efficiency and Renewable Energy, Vehicle Technologies Office via the Advanced Combustion Engine manager Gurpreet Singh.