
Abstract
High-pressure multi-hole injectors for direct-injection spark-ignition engines have shown enhanced fuel atomisation and flexibility in fuel targeting by selection of the number and angle of the nozzle holes. The nozzle internal flow is known to influence the characteristics of spray formation; hence, understanding its mechanisms is essential for improving mixture preparation. However, currently, no data exist for fuel temperatures representative of real engine operation, especially at low-load high-temperature conditions with early injection strategies that can lead to phase change due to fuel flash-boiling upon injection. This challenge is further complicated by the predicted fuel stocks, which may include new (e.g. bio-derived) components. The physical/chemical properties of such components can differ markedly from gasoline, and it is important to have the capability to study their effects on in-nozzle flow and spray formation, taking under consideration their different chemical compatibilities with optical materials as well. The current article presents the design and development of a real-size quartz optical nozzle, 200 µm in diameter, suitable for high-temperature applications and also compatible with new fuels such as alcohols. First, the internal geometry of a typical real multi-hole injector was analysed by electron microscopy. Mass flow was measured, and relevant fluid mechanics dimensionless parameters were derived. Laser and mechanical drilling of the quartz nozzle holes were compared. Abrasive flow machining of the optical nozzles was also performed and analysed by microscopy in comparison to the real injector. Initial validation results with a high-speed camera showed successful imaging of microscopic in-nozzle flow and cavitation phenomena, coupled to downstream spray formation, under a variety of conditions including high fuel temperature flash-boiling effects. The current work used gasoline and iso-octane to provide proof-of-concept images of the optical nozzle, and future work will include testing of a range of fuels, some of which will also be bio-derived.
Introduction
Improvements to the direct-injection spark-ignition (DISI) combustion system are necessary to reduce fuel consumption and emissions, and fuel injection is key to realising those improvements. The fuel injector must be capable of accurate and repeatable fuel metering and provide a well-atomised spray to ensure adequatefuel vaporisation and the desired degree of homogeneity or stratification at an appropriate air-to-fuel ratio (AFR). The injector must function reliably for a wide range of ambient temperature conditions worldwide and also behave as predictably as possible in the high-temperature environment of the combustion chamber and with different fuel types. More to the point, as alternative fuels with bio-derived components become more available, the injectors must be able to function adequately for a variety of blends with differing physical properties that also have different responses to thermodynamic conditions of temperature and pressure. A number of injector designs, with differing spray forms, have been applied to the DISI engine. Following the pressure-swirl atomizer that was typical of the first generation of DISI engines, the main type of injector that has received attention commercially and in research is the multi-hole injector. Multi-hole injectors are a popular choice for DISI engines due to their flexibility in fuel targeting and enhanced atomisation characteristics. The number and angles of nozzle holes can be varied and optimised to perform well over a wide range of operating conditions. The main atomisation characteristics of multi-hole injectors have been extensively studied in compression ignition (CI) diesel engine applications. Currently, the similarity of the injection nozzles of CI and SI engines and the continually increasing fuel pressures to improve atomisation have led to an overlap in their study, although the fuel pressure for CI is far greater than that of the DISI engine (currently in the region of 2000–2500 bar vs 150–200 bar). However, the higher volatility of gasoline in comparison to diesel merits specific detailed understanding of the mechanism of spray development, which – for a step change in our understanding – should include the entire fuel flow path from within the injector to subsequent spray formation, break-up and, ultimately, combustion for the wide range of operating conditions and fuels relevant to current and future DISI engine designs.
Spray characteristics
Dimensionless parameters are well known in their use to describe various flow phenomena, including spray formation. Typically, the Reynolds number, Re, is used to indicate a level of turbulence and is defined by

where ρl is the density, U ∞ is the velocity, µl is the dynamic viscosity and D is the characteristic length scale (usually taken to be the nozzle hole diameter for injectors). As such, it represents the ratio of forces supporting turbulence (inertia) to forces dissipating turbulence (viscous) and is typically an important parameter for the description of the in-nozzle flow. The Reynolds number, used in the context of this work, serves as an indicator of the injector flow conditions and is used as a first approximation to set the conditions of the optical nozzle and also to assist the reader in making comparisons with previously published work regarding nozzles of other geometries.
Analysis of spray development often also includes consideration of Weber numbers, We, in the physical description. At the boundary between the liquid fuel surface and the gaseous environment, liquid surface tension, σl , resists surface changes and acts to maintain the liquid shape, which naturally form spherical droplets, in the absence of external forces. The ratio of the inertia forces on the droplet (promoting break-up) against the surface tension forces (which resist break-up) is the basis of the liquid Weber number, Wel

where ρl represents the liquid density, U∞ and D and σl represent the liquid velocity, characteristic dimension (usually nozzle hole diameter) and surface tension, respectively. Wel does not however incorporate any of the gas properties, which are also known to influence spray break-up. A more complete characterisation of the spray break-up would also include the gas property effects on the spray, such as that related by the gas Weber number, Weg
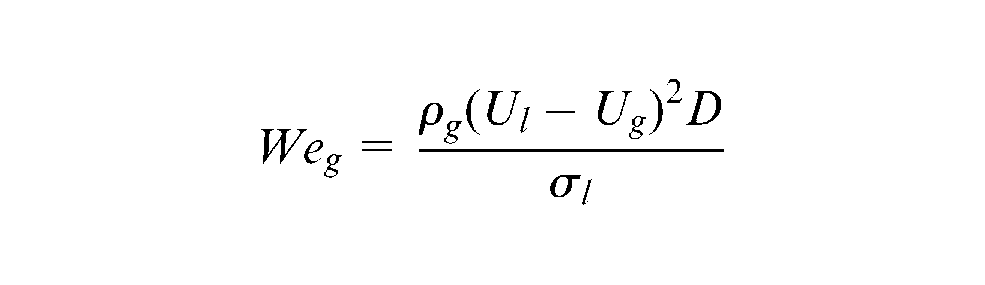
where ρg represents the gas density,
Finally, the Ohnesorge number incorporates an increased number of fluid properties, those of both Reynolds and Weber numbers
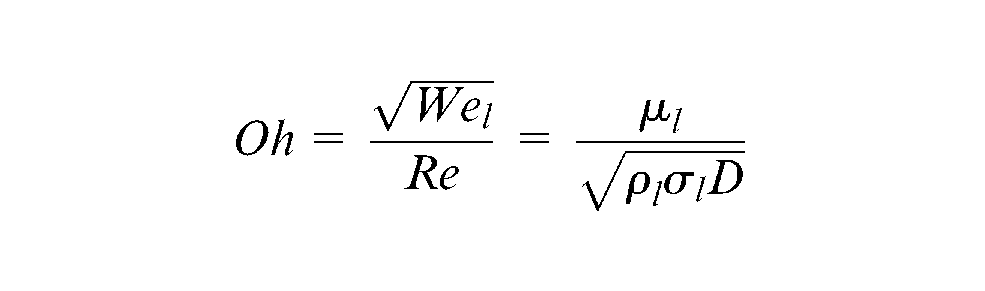
The Ohnesorge number is the basis of some classical spray break-up theories. The Ohnesorge number does not however include the influence of the properties of the gas, which the spray is being injected into, and which are known to affect the spray break-up process. A more complete characterisation could also include the effect of gas phase properties, but so far no single relation exists, which can describe all influences simultaneously. Nevertheless, on the basis of those numbers, various categories of spray regimes have been identified. The regimes are divided into four main types: ‘Rayleigh’, ‘first wind-induced’, ‘second wind-induced’ and ‘atomisation’. The reader is guided to Baumgarten 1 for further details. It needs to be pointed out that such regimes and classical theories have not been developed on the basis of multi-phase flows inside the nozzle or have not explicitly included fast disruptive evaporation effects of hot fuels upon their injection into a low-pressure environment, that is typical of the intake stroke of an SI engine at low-load operating conditions. Nevertheless, it has been recently shown that the dependence of Oh number on the temperature means that it converges to a value that is similar for different fuels at high-temperature conditions and can be used as an informative measure of relevant phenomena. 2
Furthermore, the concept of an intact liquid break-up length close to the nozzle, that is typical of various models and theories, does not necessarily apply to high-pressure injection systems that are characterised by the presence of multi-phase flow already inside the nozzle, for example, from cavitation effects. Cavitation occurs when the local pressure in the flow decreases to below the vapour pressure of the fuel (at the respective local temperature). The cavitation number, Ca, is a dimensionless parameter used to characterise the flows sensitivity to cavitation and represents the ratio of forces suppressing cavitation versus the forces promoting cavitation

where p ∞ is the pressure at a reference point in the flow, pv is the vapour pressure at the reference temperature T∞, ρl is the liquid density and U ∞ is the velocity at the reference point. As the cavitation number (Ca) of the flow decreases, nucleation will occur at a value, which is dependent on fluid properties and experimental conditions. The value of this incipient cavitation is defined by a critical cavitation number Cacrit . Vapour bubble growth is very much affected by temperature changes in the fluid, and therefore, Cacrit is also dependent on the liquid temperature. However, values of Cacrit are not common in the injector nozzle literature. Instead, the most popular definition of a cavitation number for injection systems is given by

where pinj is the injection pressure, pg is the downstream gas pressure and pv is the vapour pressure. This relation simplifies comparison of data from different experimental arrangements as flow velocity is not considered and only experimental data relating to the downstream gas and vapour pressure conditions are incorporated. CN can still be considered as a ratio of forces suppressing and forces promoting cavitation with the propensity for cavitation onset increasing as the CN number increases. Critical CN numbers, CNcrit , have been found to fall in the range of 0.5–10, with associated critical Reynolds number between 5000 and 30,000; 3 –10 once in the cavitating flow regime, the discharge coefficient of the nozzle is dependent mainly on CN and is independent of Reynolds number.
It is important to point out here that the cavitation number does not explicitly define the type of cavitation occurring. For example, the nozzle geometric features have an important influence on cavitation where the radius of curvature at the nozzle inlet, where the flow can separate, dictates the presence and degree of cavitation, usually termed geometric cavitation. Additionally, large-scale vortical motion just upstream of the nozzle hole can lead to other types of cavitation, for example, string cavitation. Depending on the degree and type of cavitation, the result can be a more atomised spray. Nevertheless, cavitation can also be undesirable as it can be a source of erosion brought about by bubble collapse on the nozzle surface. In the context of this, optical access to the nozzle is invaluable. Most studies to date have focused on cavitation imaging inside optical models of diesel nozzles, typically enlarged by factors 15–20, 11 –15 with some studies on real-size nozzles with optical access (ranging from 0.2 to 1.5 mm in diameter with various hole lengths). 5 –10,16 –22 Limited experimental work can be found on quantitative flow data in real or large-scale diesel or spark-ignition injectors, for example, particle image velocimetry (PIV) work by Aleiferis et al. 23,24 in 10× and 20× models, and also by Allen et al., 7 Khoo and Hargreave 8 and Walther et al. 25,26 in real-size pressure-swirl (for spark-ignition engines) and single/multi-hole diesel injectors, respectively. This research has led to questions of whether the cavitation phenomena in injector nozzles are scalable, even when the Reynolds and cavitation numbers have been matched on the enlarged models. Arcoumanis et al. 27 made a comparison between large and real-scale diesel injectors and found that the cavitation in the enlarged models existed as ‘foamy’ clouds of bubbles, similar to those seen by Soteriou et al.; 11 however, in real-size injectors, the cavitation appeared as large clear voids, similar to those seen in Chaves et al. 16 Further developments by Mitroglou et al. 28 with 10× enlarged optical diesel nozzles and real-size optical nozzles discussed various effects of geometric and string cavitation in injectors of geometries relevant to both passenger car and heavy duty applications. They also made comments about the wear of their plastic real-size nozzles due to high-pressure fluid flow.
Another issue is how to relate the cavitation phenomena in one liquid to another with different properties. Examples of the different liquids used for such investigations include diesel oils, calibration oil, unspecified hydrocarbon mixtures, white spirits and gasolines, which all have a wide range of physical properties, for example, density, viscosity, surface tension and vapour pressure. Specifically, for gasoline engines, the effect of low downstream pressure and hot fuel temperature has not been studied in detail with an optical nozzle. Such conditions lead to coupling between in-nozzle cavitation and fast disruptive evaporation of the fuel on injection, termed flash-boiling. Although this mechanism enhances the rate of evaporation, it also leads to alteration of the nominal spray shape, typically termed ‘spray collapse’, where the individual spray plumes are drawn close together and increase the vertical component of spray plume momentum, typically increasing in turn the degree of fuel impingement on the piston’s surface.
Present contribution
This research addresses the need to further understand the mechanisms of in-nozzle cavitation and fuel spray formation for DISI engine injectors, especially for a variety of fuels under elevated fuel temperatures and low gas pressures. To achieve this, development of a suitable faithful real-size optical nozzle was a specific objective. Detailed analysis of typical serial-production DISI multi-hole injector geometry was undertaken using both optical and scanning electron microscope techniques, including silicone casting processes of the nozzle internal geometry. Injected fuel mass was measured at 20 °C and 90 °C injector body temperatures, at 150 and 80 bar injection pressure for gasoline and iso-octane. Discharge coefficient and Reynolds, cavitation, liquid and gas Weber numbers were calculated to set the optical nozzle baseline conditions. Earlier work by the authors presented results from the use of acrylic nozzles with a variety of fuels. 2,29 Specifically, nozzle holes of 0.5 and 0.2 mm diameter were mechanically drilled in polymethyl methacrylate (PMMA), more commonly known as acrylic or Perspex®. However, the low ‘maximum service temperature’ of this material (80 °C –90 °C), in conjunction with issues of chemical compatibility with hydrocarbons and alcohols, limited the range of fuels and conditions that could be studied. Due to these limitations, a new optical nozzle design capable of operating under high-temperature conditions for a variety of fuels is required, the process of which is presented in this article in detail, along with sample images of the initial validation. The capability of observing simultaneously in-nozzle phenomena and spray formation is expected to provide new insights into the different types of in-nozzle cavitation and subsequent coupling with spray formation and flash-boiling.
Experimental techniques and methodology
Multi-hole injector
The basis of the current study was an injector of six holes providing spray plumes at individual geometric angles, as shown in Figure 1. Plumes 1 and 6 are designed to pass on either side of the spark plug. A schematic representation of the injector’s internal hole geometry is shown in Figure 2. The multi-hole valve-covered orifice (VCO) injector has two distinct diameters along the length of the nozzle hole; the smaller diameter at the nozzle inlet expands to a larger diameter downstream of the nozzle inlet via an abrupt ‘step’. Figure 3 shows microscope images of the nozzle holes. The diameter downstream of the step increase measures approximately 0.45 mm at the nozzle exit. The smaller nozzle diameter upstream is approximately 0.20 mm.
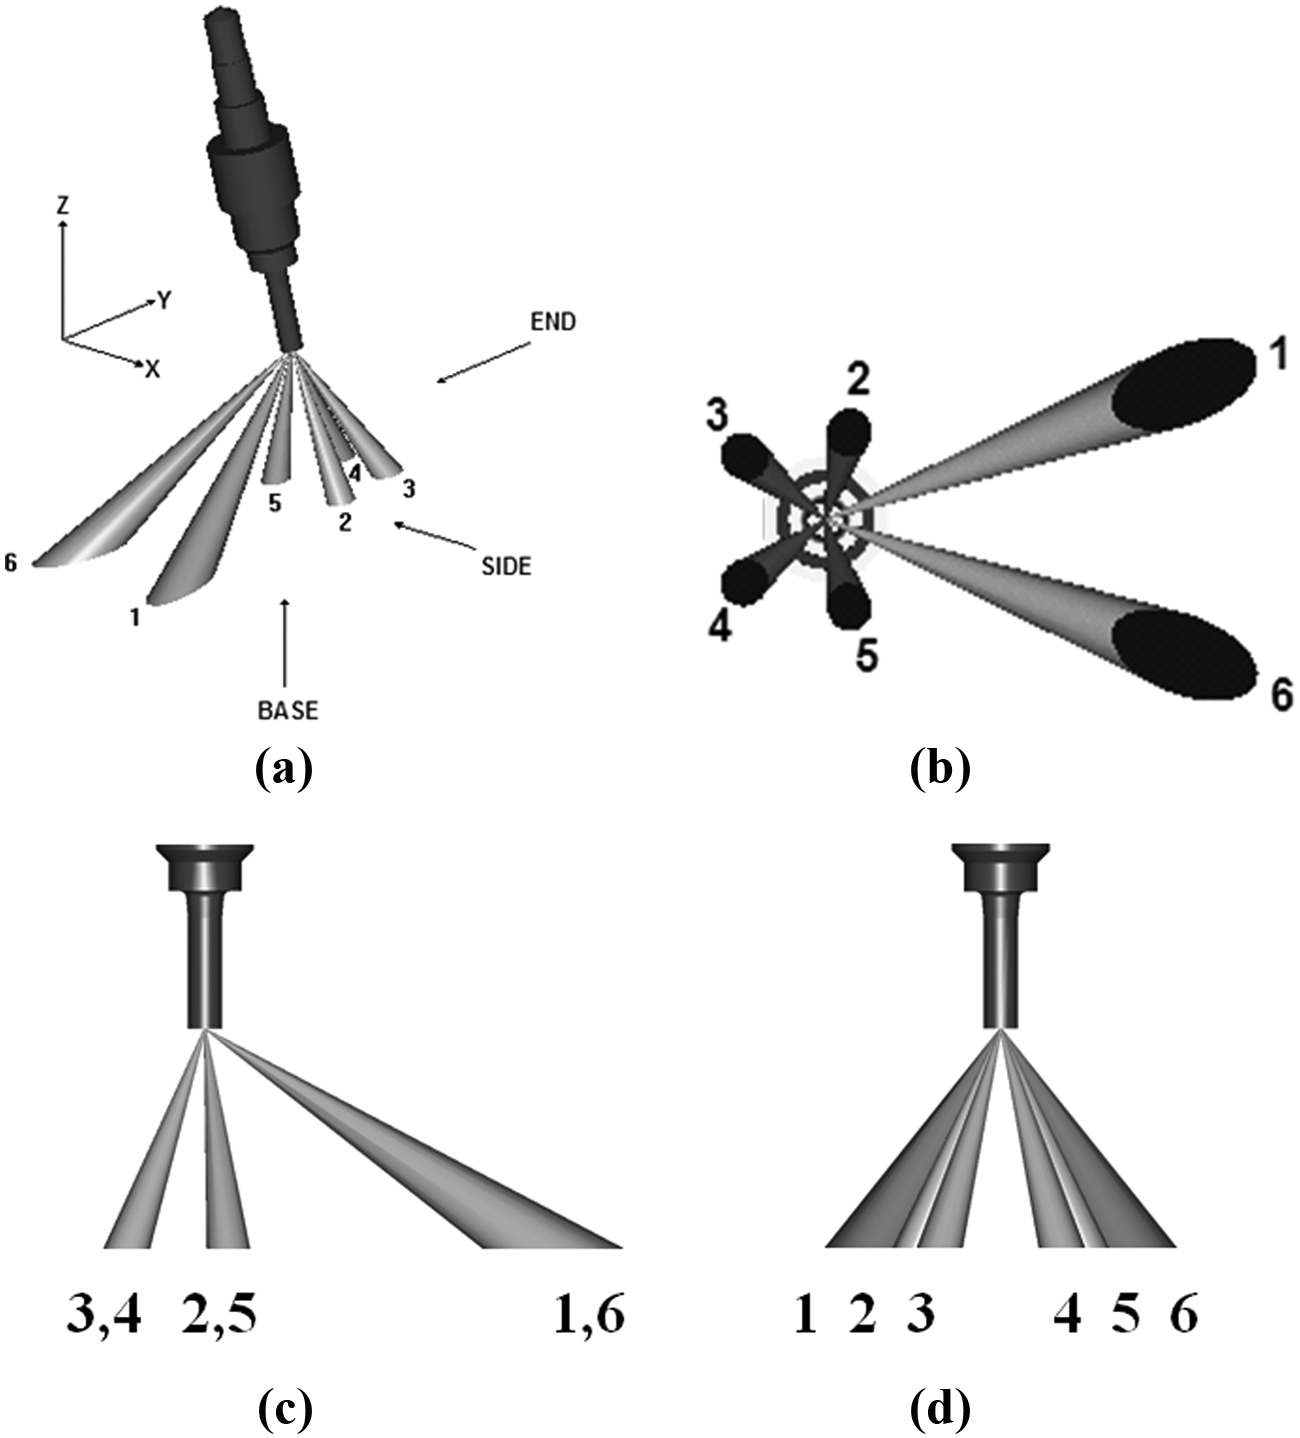
Multi-hole injector spray pattern: (a) general view, (b) base view, (c) side view and (d) end view.
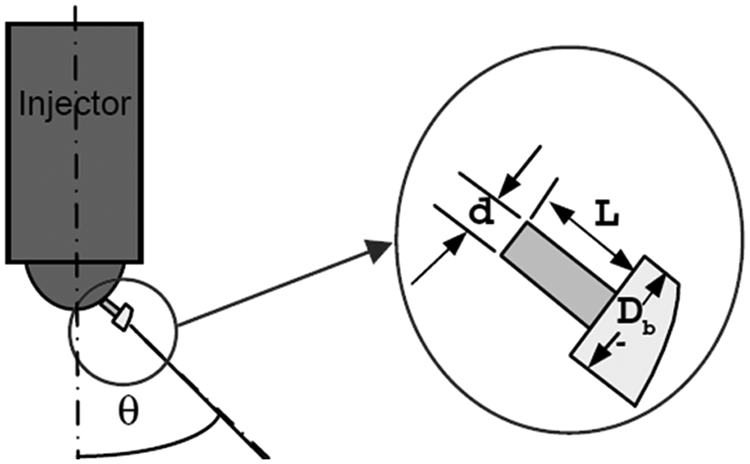
Schematic representation of injector nozzle.
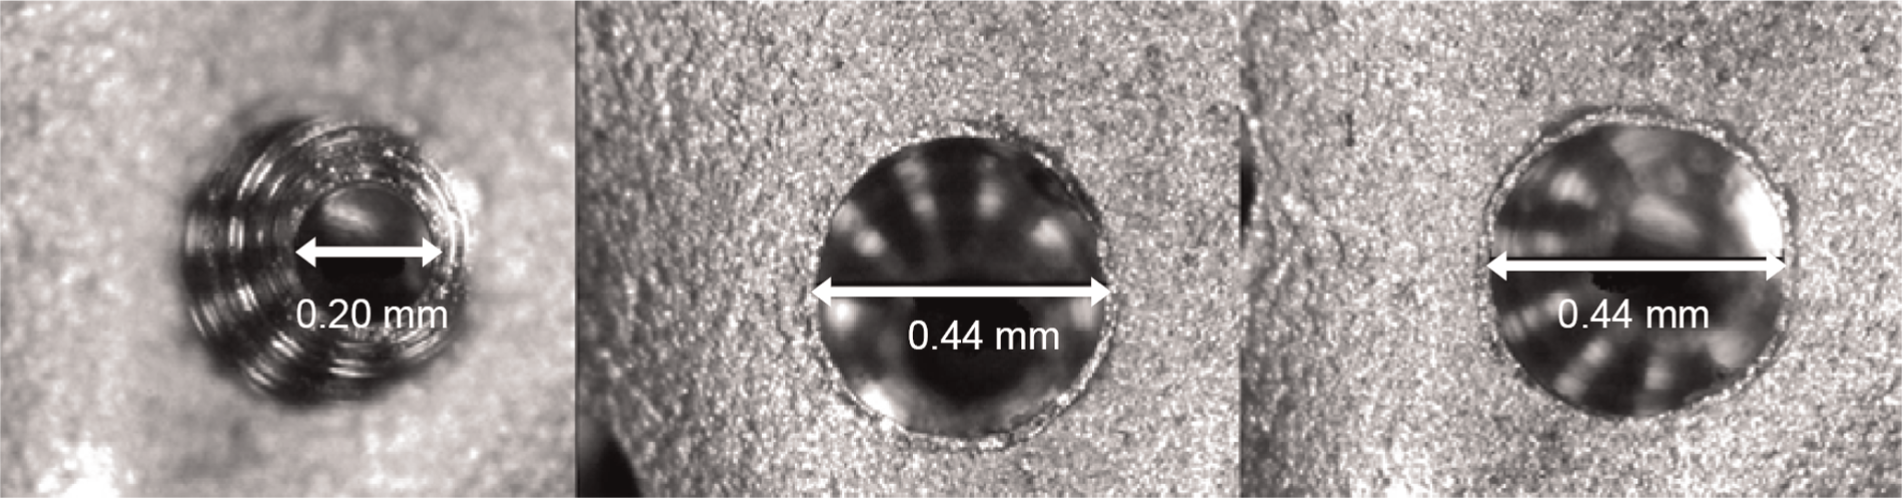
One of six injector nozzle holes: inner and outer holes.
Nozzle impressions using vinyl poly siloxane
Impressions of the internal characteristics of the nozzles were made using a low-viscosity silicone impression material called vinyl poly siloxane (VPS), specifically formulated for dental impressions, using a similar technique as can be found in Macián et al. 30 VPS material specification features <0.2% linear dimensional change (in 24 h) and an elastic recovery of >99.5%. The impressions form a ‘negative’ casting of the nozzle holes, which were subsequently plasma coated with gold and viewed with a scanning electron microscope (SEM). Due to the nozzle’s step feature, it was not possible to remove the VPS impression as a complete piece if the silicone is introduced at the nozzle inlet. To achieve impressions, which represented all of the nozzle features, including inlet and expansion ‘step’ features, the silicon was sometimes introduced at the nozzle exit and other times at the nozzle inlet. Introducing the VPS at the inlet necessitated the nozzle to be cut from the injector body and removal of the ball-end needle and is therefore a destructive assessment process. It was also desirable to make non-destructive internal impressions of the specific injector that was used to obtain the injected fuel mass results (presented in the following section), with the advantage that the injector is not damaged and can be used in future tests. To achieve this, silicone was introduced at the nozzle exit and forced in the individual holes in an effort to expel the air. The ball-end needle, which acts as the valve covering the individual orifices, stops the silicone flowing past the nozzle inlet and into the injector body and offers greater certainty of nozzle channel length because the VPS material is not broken on removal of the cast. Figures 4 –6 show destructive and non-destructive nozzle impression results.
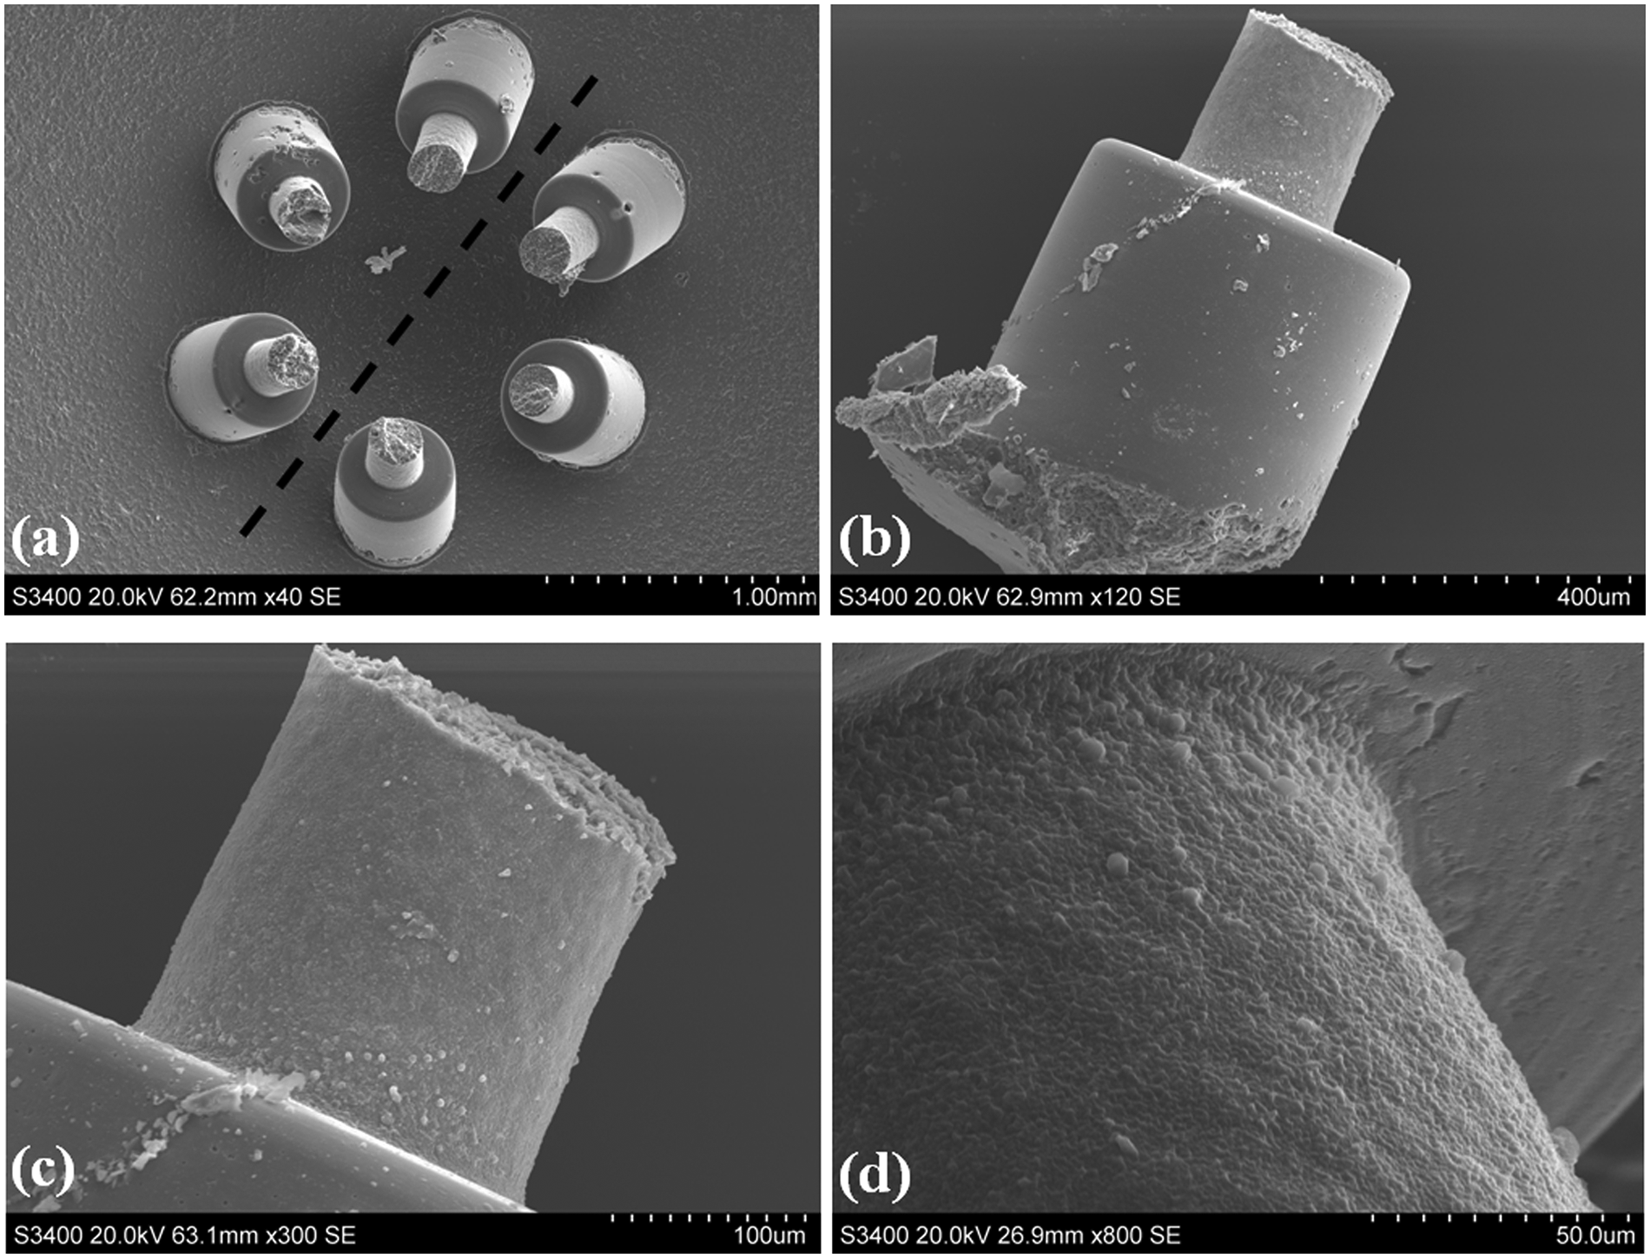
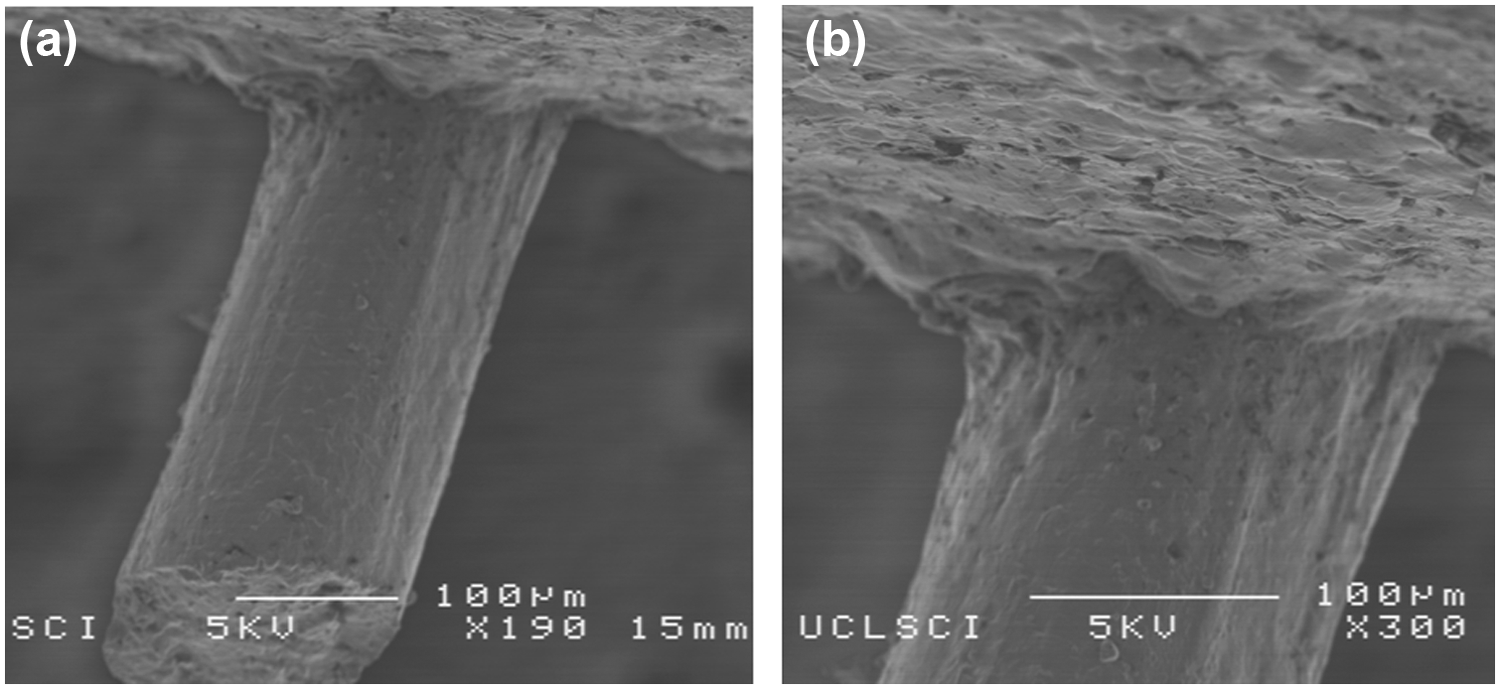
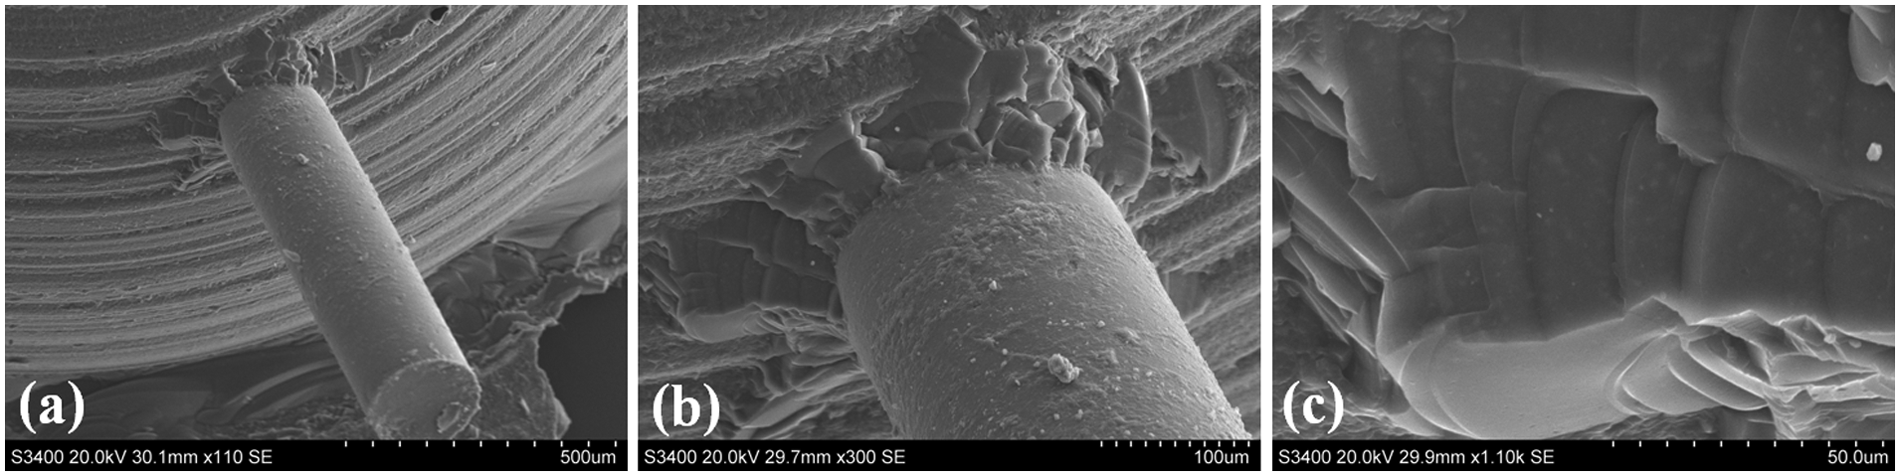
Internal impressions of multi-hole injector nozzle. Destructive casting method: (a) 6-hole nozzle configuration showing symmetry plane (dashed line); (b) single nozzle hole, corresponding to plume numbers 1 and 6; (c) magnified view of image (b) and (d) surface of 0.2-mm-diameter nozzle hole.
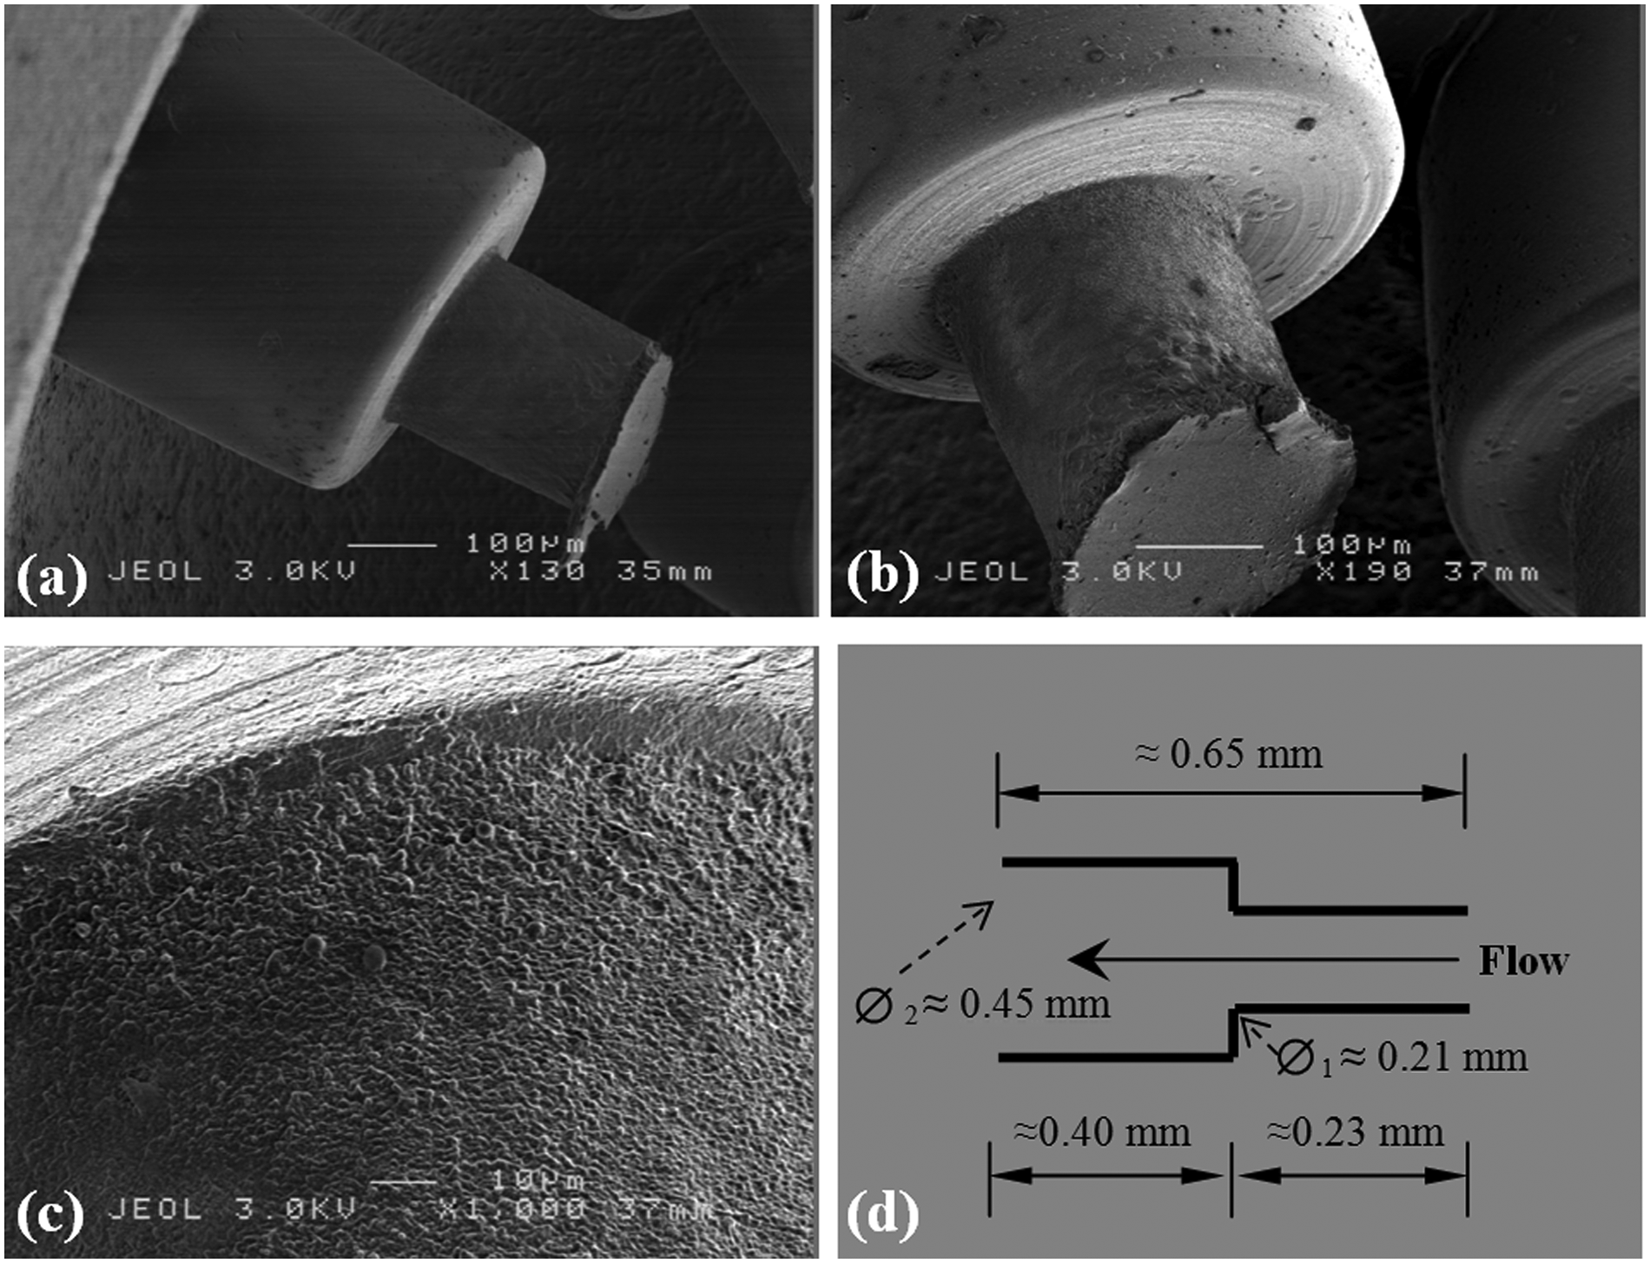
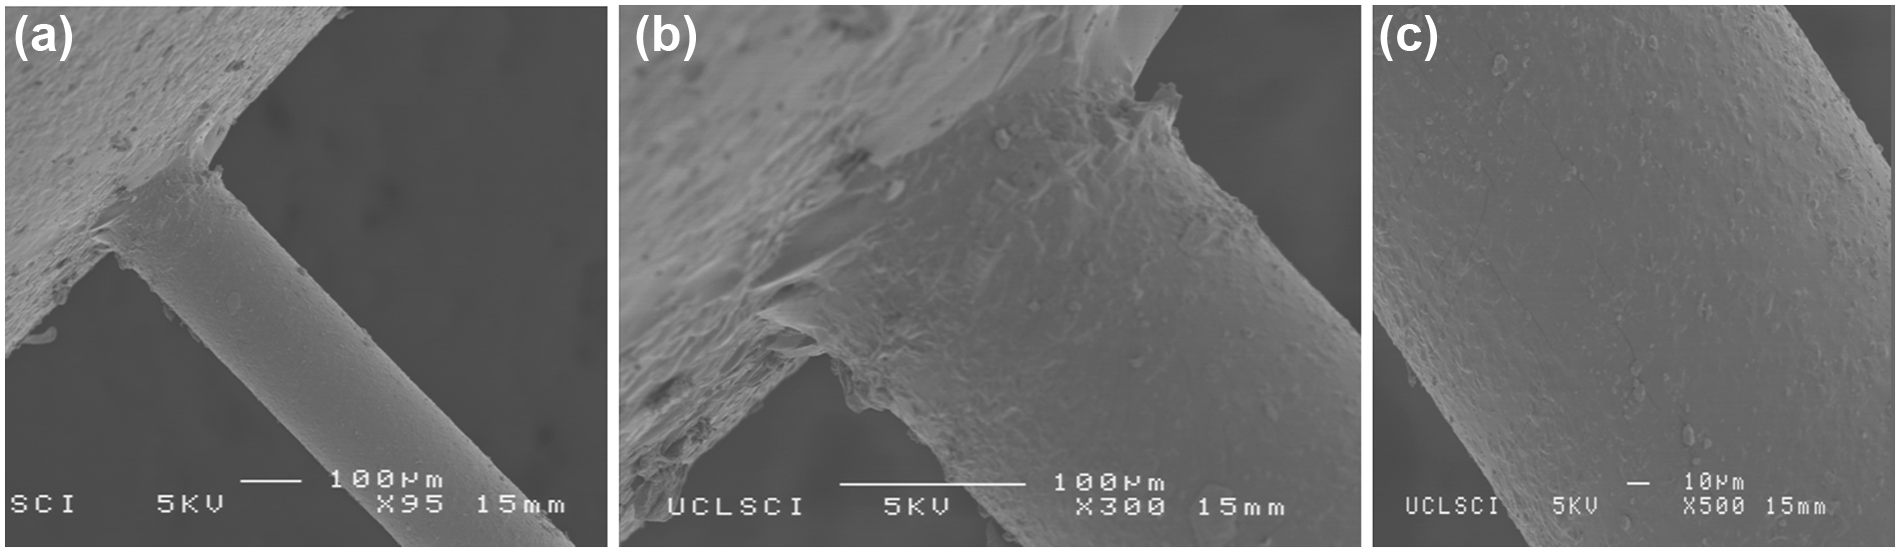
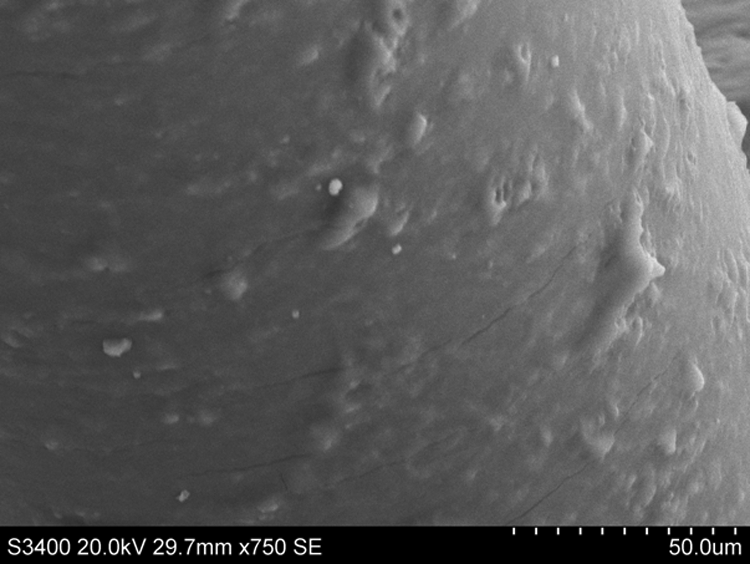
Internal impressions of multi-hole injector nozzle orifices. Non-destructive casting method: (a) side view showing nozzle length and diameter, (b) view showing expansion step and ball-end needle surface features, (c) surface of 0.2 mm nozzle in area just upstream of expansion and (d) single nozzle dimensions, approximate.
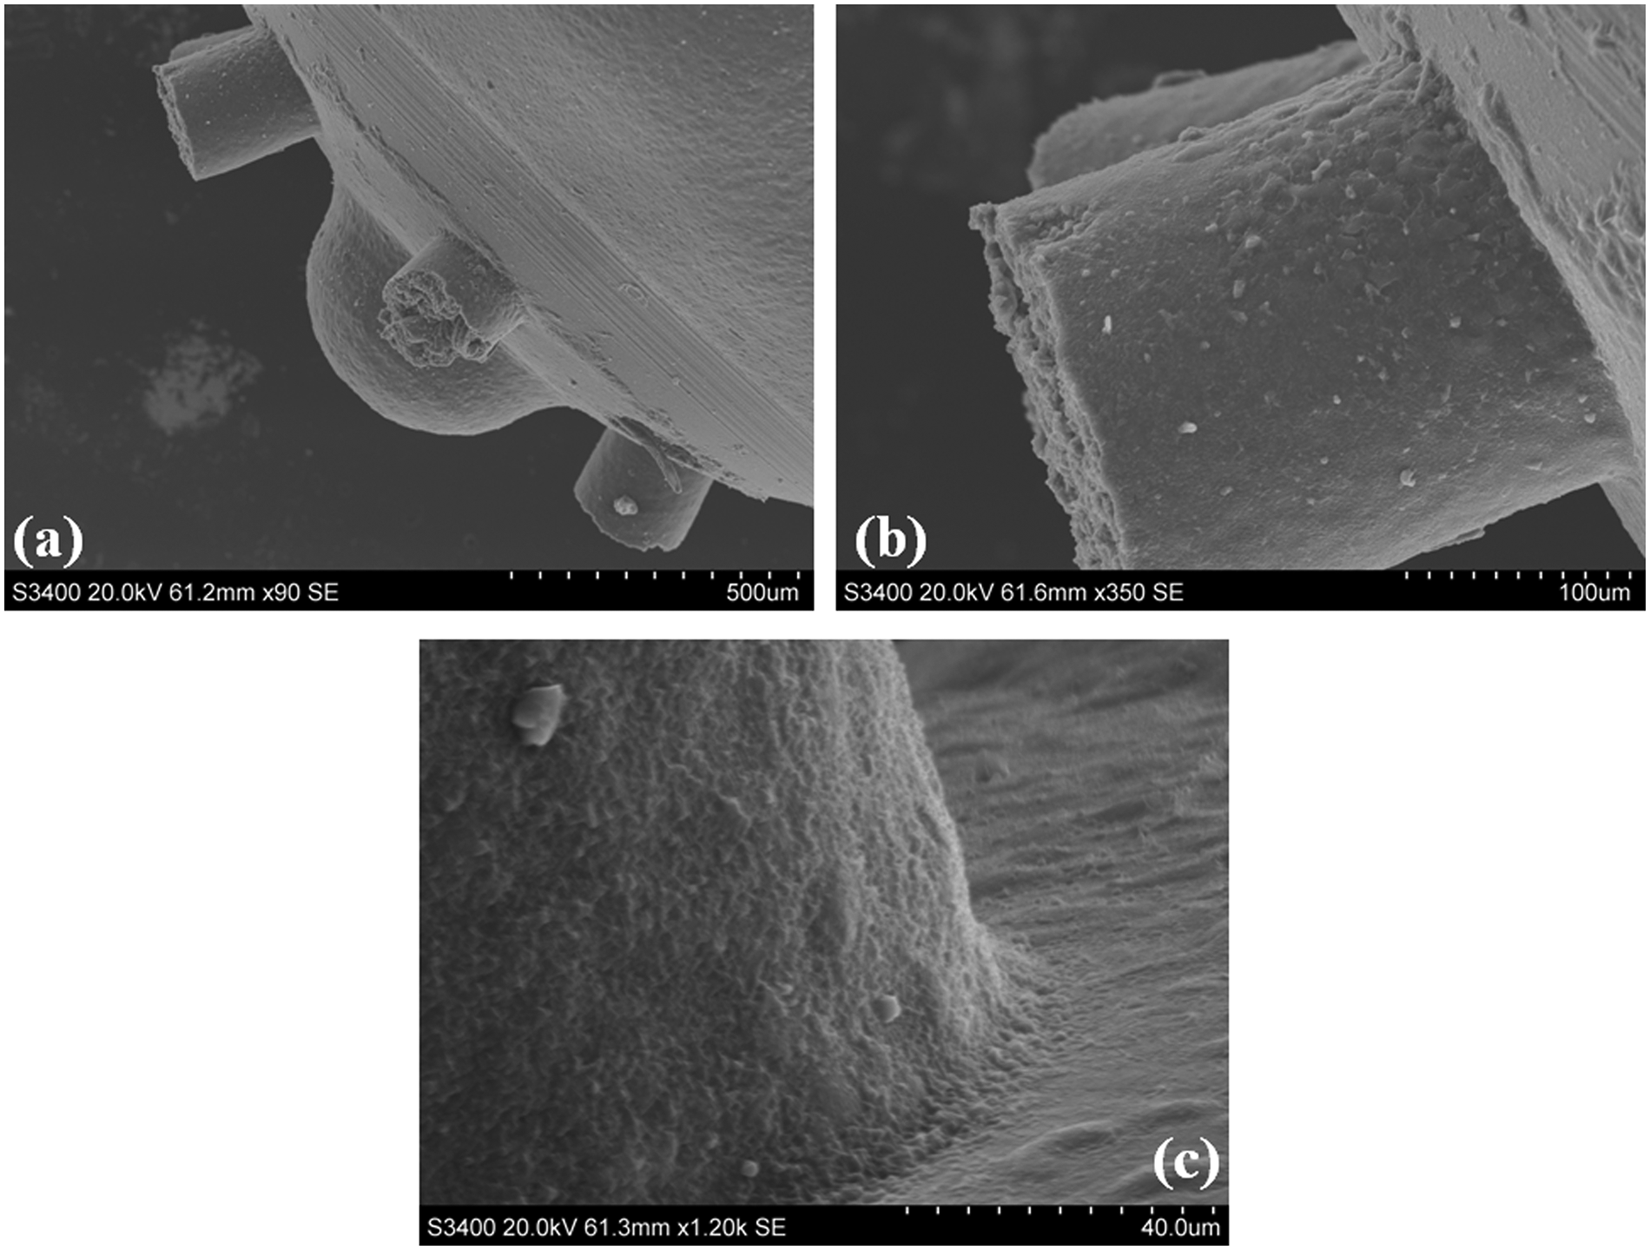
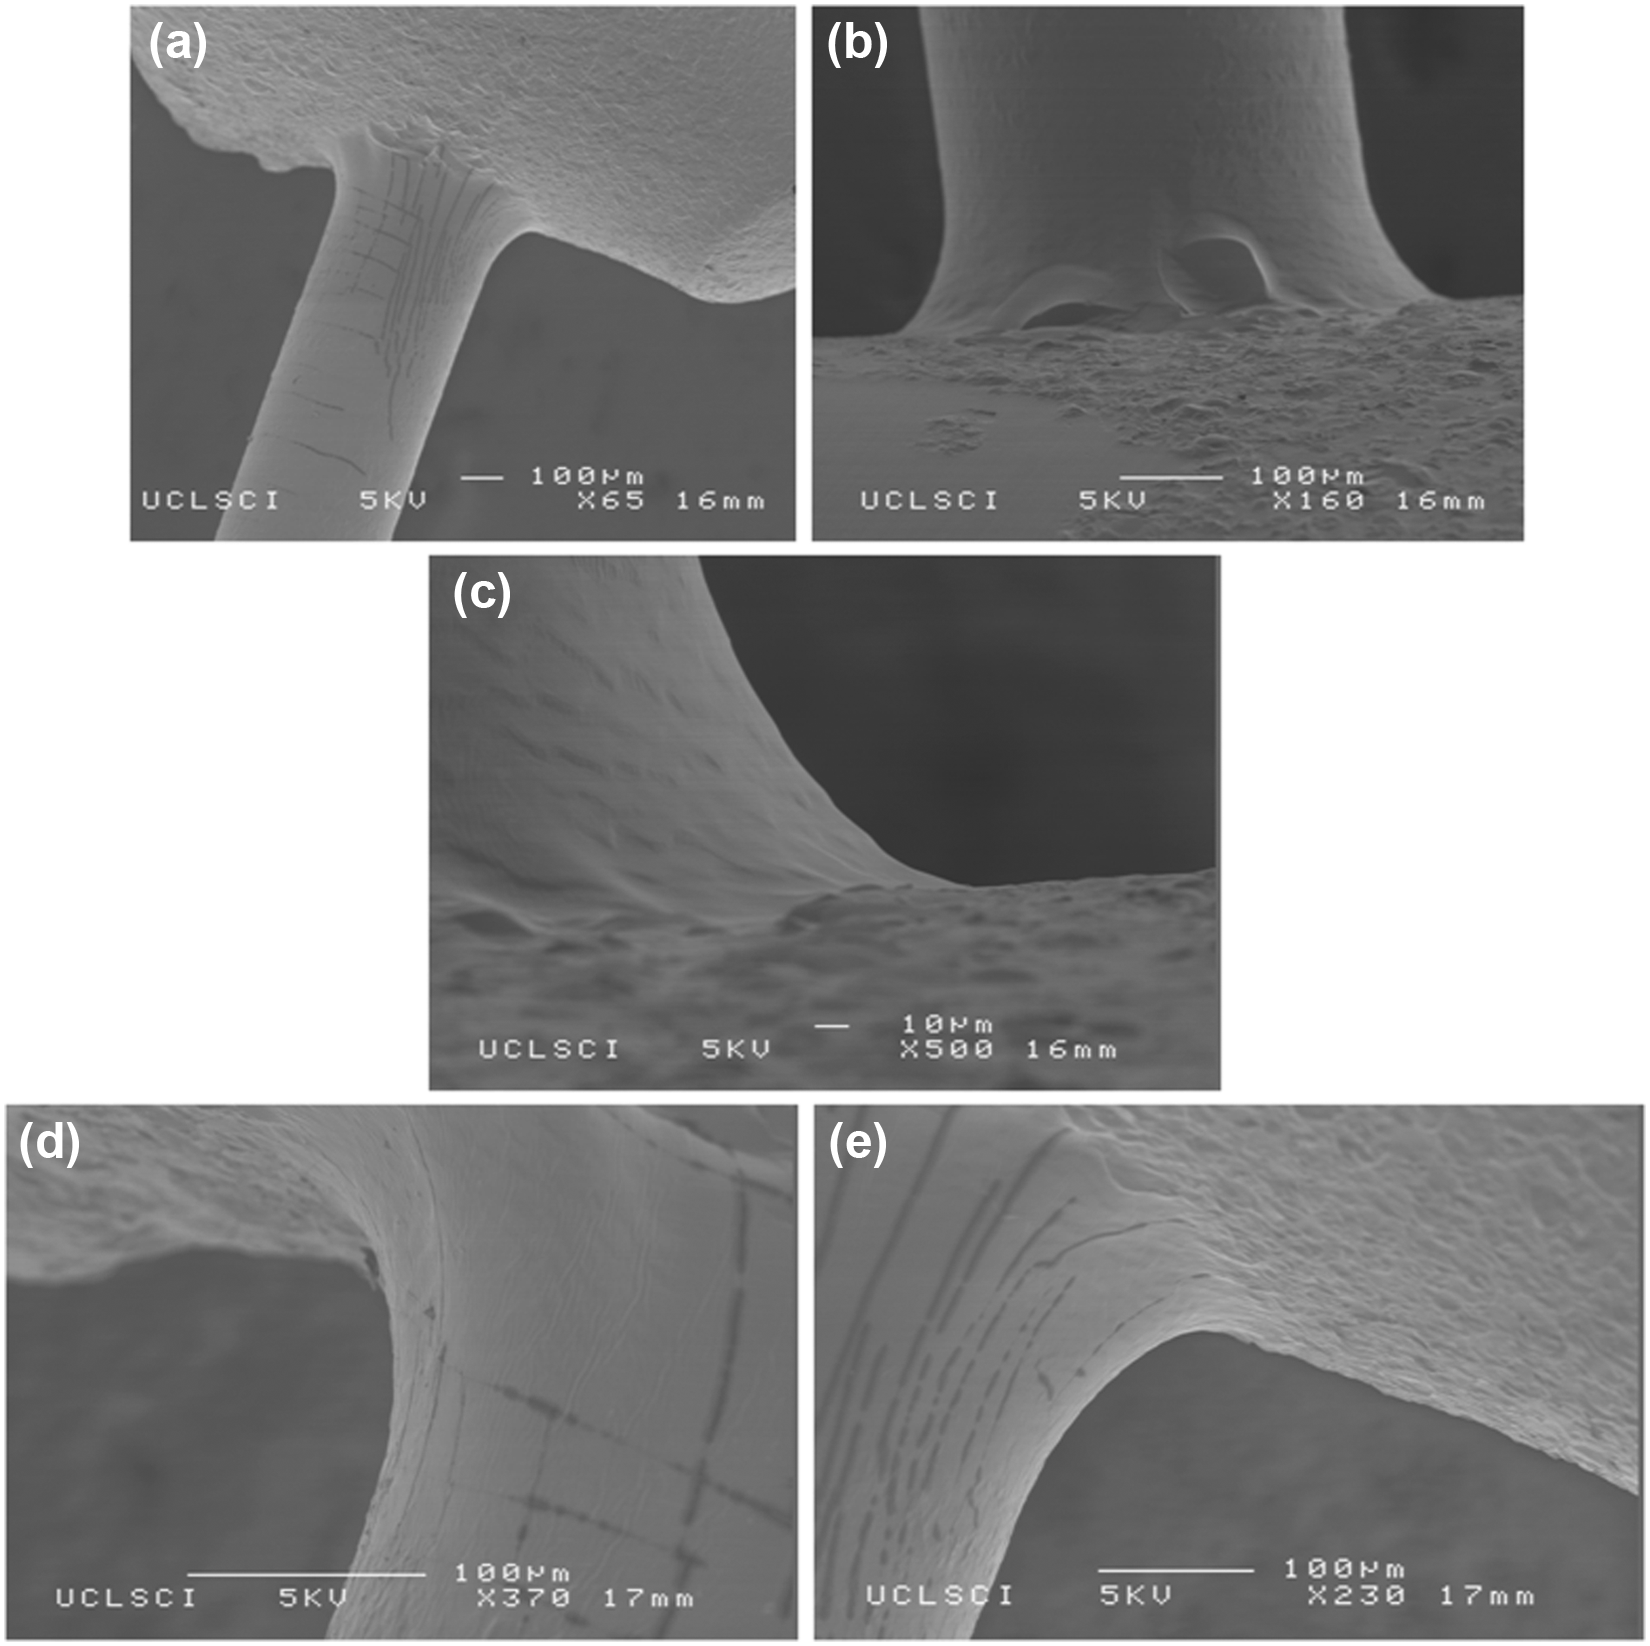
Internal impressions of multi-hole nozzle (inlet) orifices. Destructive casting method. VPS introduced at nozzle inlet (ball-needle removed) with breakage occurring in region of ‘step’ expansion. a) Ball-needle seat and nozzle inlet region with Gaussian profile recess, b) Magnified view of a nozzle inlet region, casting is broken before expansion step, c) Further magnified view of inlet radius, also showing surface characteristics at the nozzle inlet regional.
Figure 4(a) shows the six-nozzle hole configuration where it can be seen that the nozzles can be divided into pairs about the single line of symmetry (dashed line). Figure 4(b) shows one of the longest nozzle holes (corresponding to plume pairs 1 and 6). Figure 4(c) and (d) shows a magnified image of the smaller diameter nozzle surface where it can be seen there is a radius of curvature at the smaller orifice exit, at the location of the transitional ‘step’ to the larger nozzle diameter, which would act to reduce flow separation compared to a lower radius of curvature (sharper) edge.
Figure 5(a)–(c) shows one of the six multi-hole nozzle impressions taken using the non-destructive casting process. It can be seen from Figure 5(a) and (b) that the nozzle diameter is approximately 210 µm with a length of about 230 µm, which varies around the hole surface. The expanded orifice, downstream of the smaller diameter, measures approximately 450 µm diameter and is about 400 µm in length, shown in a schematic representation of the individual nozzles approximate dimensions, Figure 5(d). The values are approximate because the length of the orifice is dependent on the individual nozzle hole angles and also varies around the hole surface of an individual nozzle. Plumes 1 and 6 have a less acute nozzle angle (referenced to the vertical) compared with plumes 3–6 and therefore have longer nozzle lengths. The VPS casting-flash seen at the nozzle entry location in Figure 5(a) and (b) is a result of the VPS material being forced against the ball-needle, which covers the orifice when in the closed position. Figure 5(b) shows concentric scoring on the nozzle surface at the location of the expansion ‘step’, which seems to be a result of material removal using a rotary tool, for example, end-mill. The smaller diameter nozzle hole surface roughness has a ‘pitted’ appearance with an approximate size scale of 1 µm to more than 3 µm in some areas, as shown in Figure 5(b) and (c). This pitting is formed during manufacturing and is a result of electric spark discharge machining (EDM). It can also be seen from Figures 5 and 6 that there are areas, which have a larger scale of surface roughness (towards the nozzle inlet) where the surface takes on a ‘melted’ appearance, which could be due to localised heating during the EDM process. The surface features of the nozzle flow channel can act as cavitation nucleation sites, which can be enhanced by rough surfaces. Small bubbles and foreign particles also provide sites for nucleation. Nucleation is a spontaneous stochastic phenomena and therefore cannot be predicted with certainty. Other dissolved gas species may be present in the liquid and undergo nucleation at a higher pressure than the liquid would otherwise cavitate.
The images of Figure 6(a)–(c) show the ball-needle seat and nozzle inlet region. A smoother area containing concentric circles upstream of the nozzle inlets can be seen in Figure 6(a) and is likely a result of a rotary machining operation and is probably the region where the ball-needle valve is seated when the injector is in the closed position. Figure 6(a) also shows a Gaussian-like recess in the central area downstream of the needle seat. The exact geometry of the nozzle and needle seat volume can be typically set by design to control various flow characteristics. For example, string cavitation can appear due to vortical motion between the needle seat location and nozzle inlet. 10 These cavitation strings can also link between the nozzles, forming a bridging vortex (string) within the needle seat volume, at some conditions. 22
Injector needle lift was measured for many injections using a Photron APX digital high-speed camera and Questar QM100 long-distance microscope (LDM). A small section was cut from the side of a spare injector, where the needle is located, and the lift was imaged for a suitably long injector pulse to ensure a stationary needle image at the point of maximum lift. The images were compared to a Vernier scale, positioned in the same focal plane so millimetre-per-pixel image scaling could be defined. The camera and LDM configuration had an extremely shallow depth of field (< 200 µm). Many needle actuations were observed, and it was found that the needle lift was approximately 40 µm with a lateral movement of a few micrometers. The authors did not specifically expect such low values of lift, as typical needle lift values from literature have been quoted at 70–75 µm for other DISI multi-hole injectors. 31 The internal nozzle flow is mainly determined by the pressure drop at the needle seat area and the entrance to the injection holes. For the particular injector design investigated here, the needle seat pressure drop can be substantial relative to the rail pressure for a needle lift of 40 µm.
Injected mass flow tests
Gravimetric tests were completed to characterise the injected fuel mass for the multi-hole injector, in order to obtain information regarding the internal flow and spray dimensionless parameters, that is, Reynolds, cavitation, gas and liquid Weber numbers (Figures 8 –12). Nozzle discharge coefficient based on volumetric flow rate is also derived (Figure 13). With this information, an attempt can be made to match the flow conditions within the optical nozzle to that of the multi-hole injector. The fuel was injected into atmospheric pressure within a sealed receptacle of varying volume. Tests were performed at two injector body temperatures: 20 °C and 90 °C, for two fuels, gasoline and iso-octane, and at 150 and 80 bar injection pressure, for increasing injector pulse widths at each test condition. The fuel mass was measured for 200 injections, and the average fuel mass per injection is show in Figure 7. The fuel temperature is increased by heating the injector body via a band-heater secured around the aluminium block used to mount the injectors, with a thermocouple located inside the block, close to the location of the injector tip. 2,29 Temperature measurements are therefore quoted as injector body temperatures, and although the fuel temperature at the injector tip can be in excess of the body at full load conditions, it remains a useful metric because the cylinder head temperature (i.e. head coolant or metal temperature) is a typical control metric used by engine development engineers.
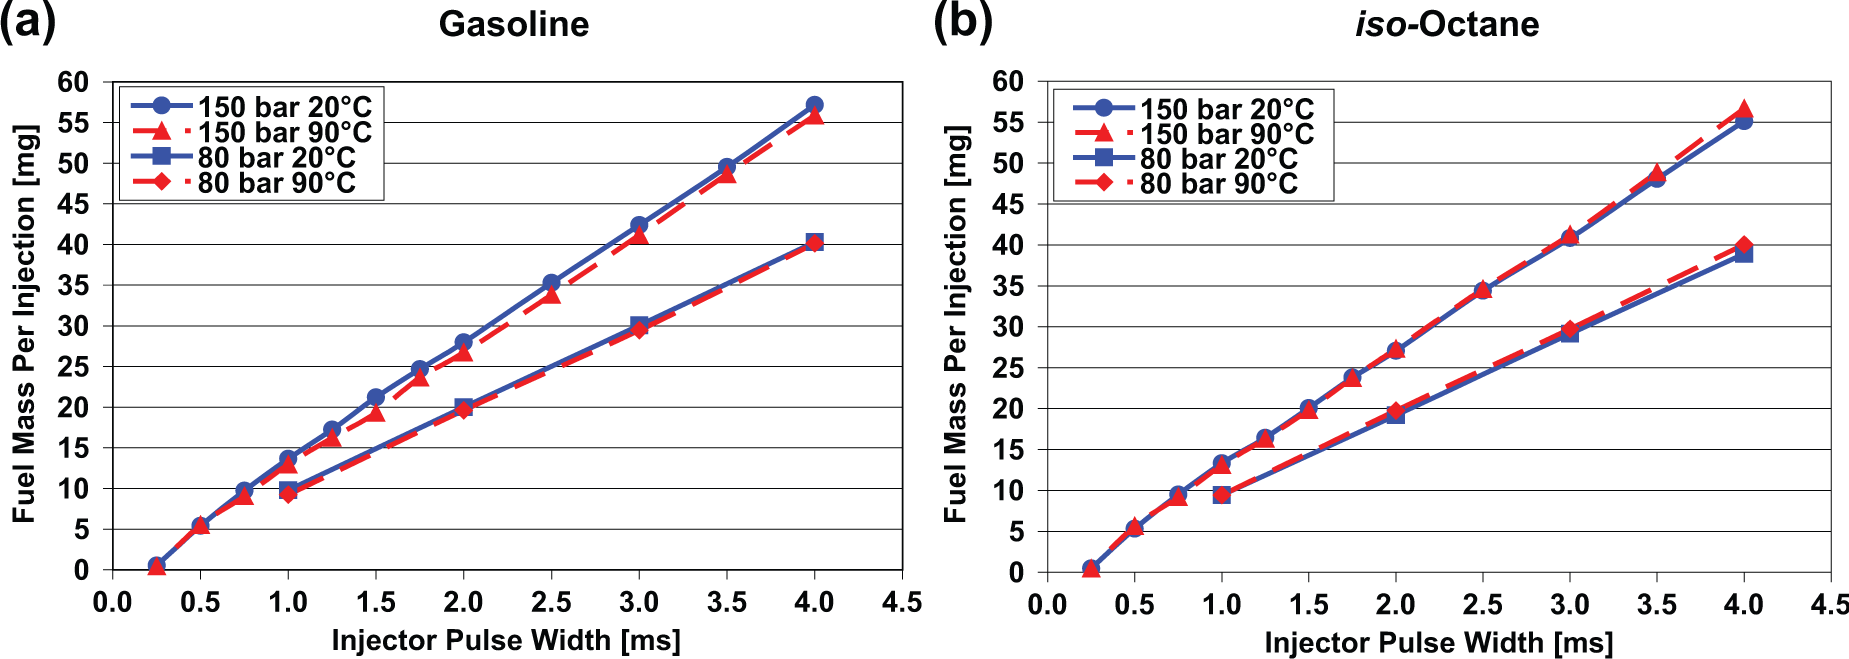
Mass per injection comparison of injectors for varying electrical pulse widths. Gasoline and iso-octane at 150 bar and 80 bar injection pressure, at 20 °C and 90 °C injector body temperature. a) Gasoline, b) iso-octane.
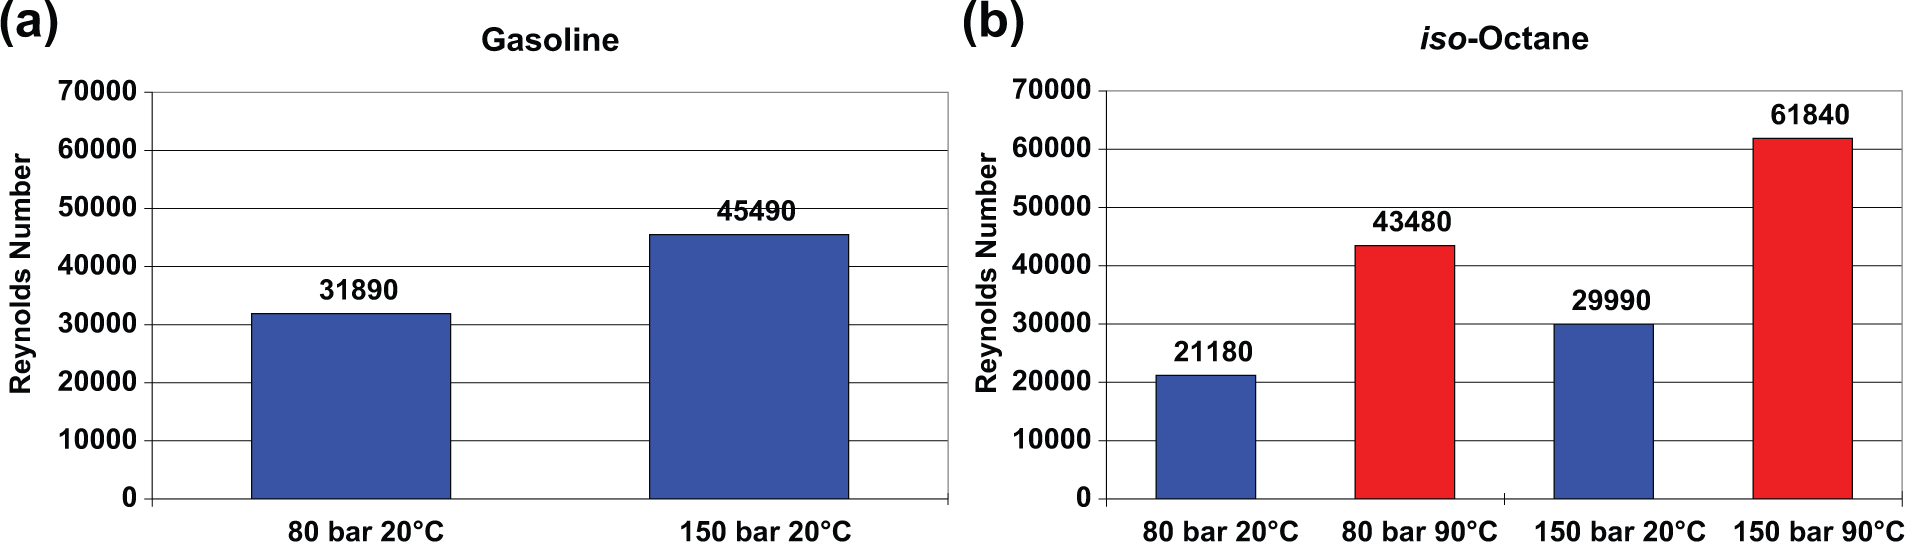
Reynolds number in a single nozzle hole for gasoline and iso-octane at 80 bar and 150 bar injection pressure and 20 °C and 90 °C injector body temperature. a) Gasoline, b) iso-octane.
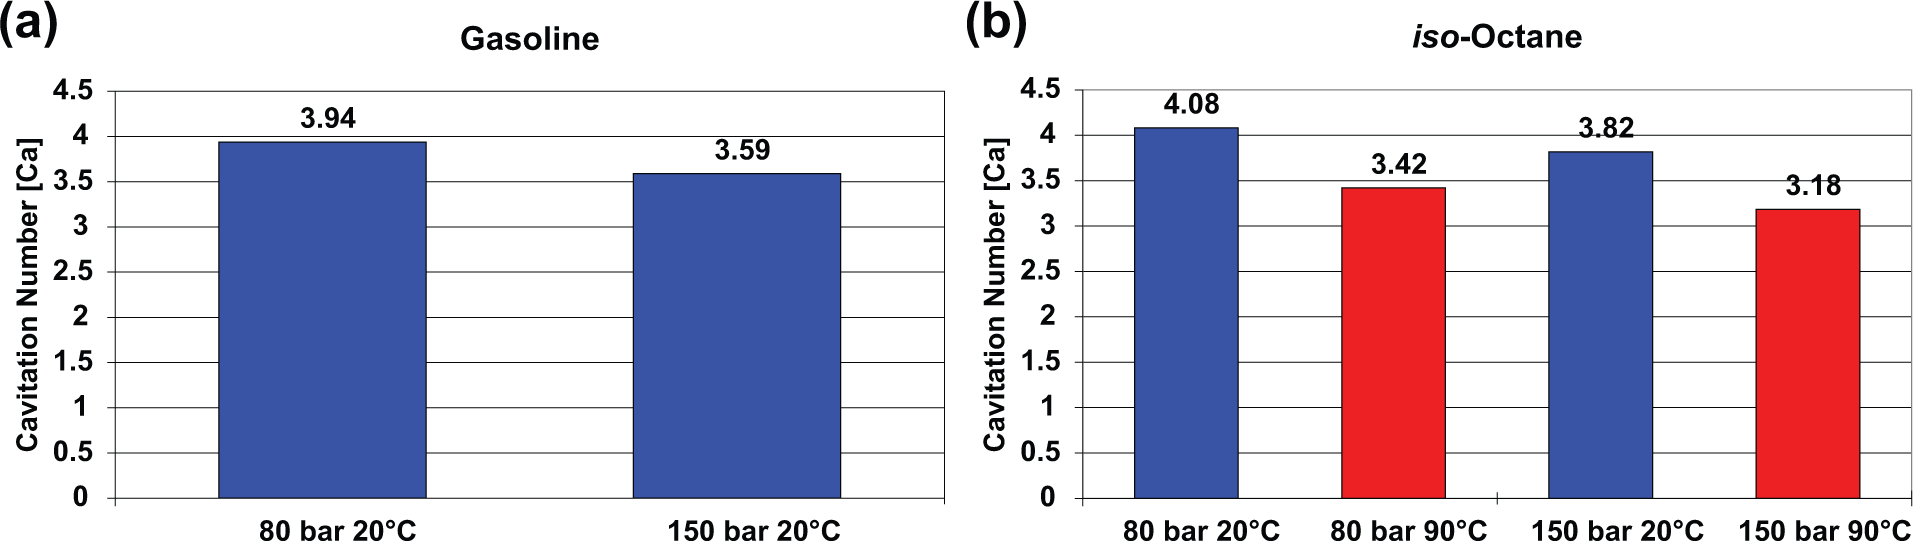
Cavitation number, Ca (fluid mechanics version) for gasoline and iso-octane at 80 bar and 150 bar injection pressure and 20 °C and 90 °C injector body temperature. a) Gasoline, b) iso-octane.
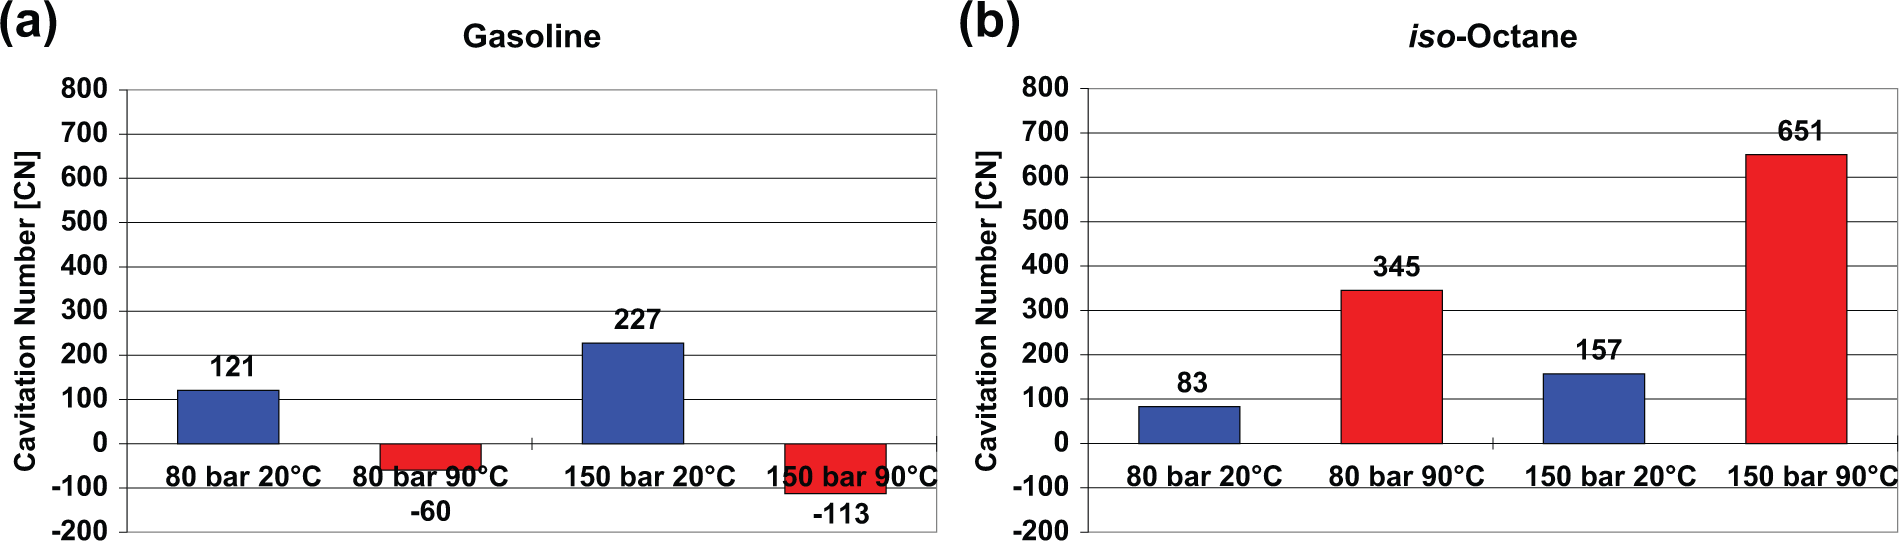
Cavitation number CN (popular alternative formulation based on ratio of pressures only) for gasoline and iso-octane at 80 bar and 150 bar injection pressure and 20 °C and 90 °C injector body temperature. a) Gasoline, b) iso-octane.
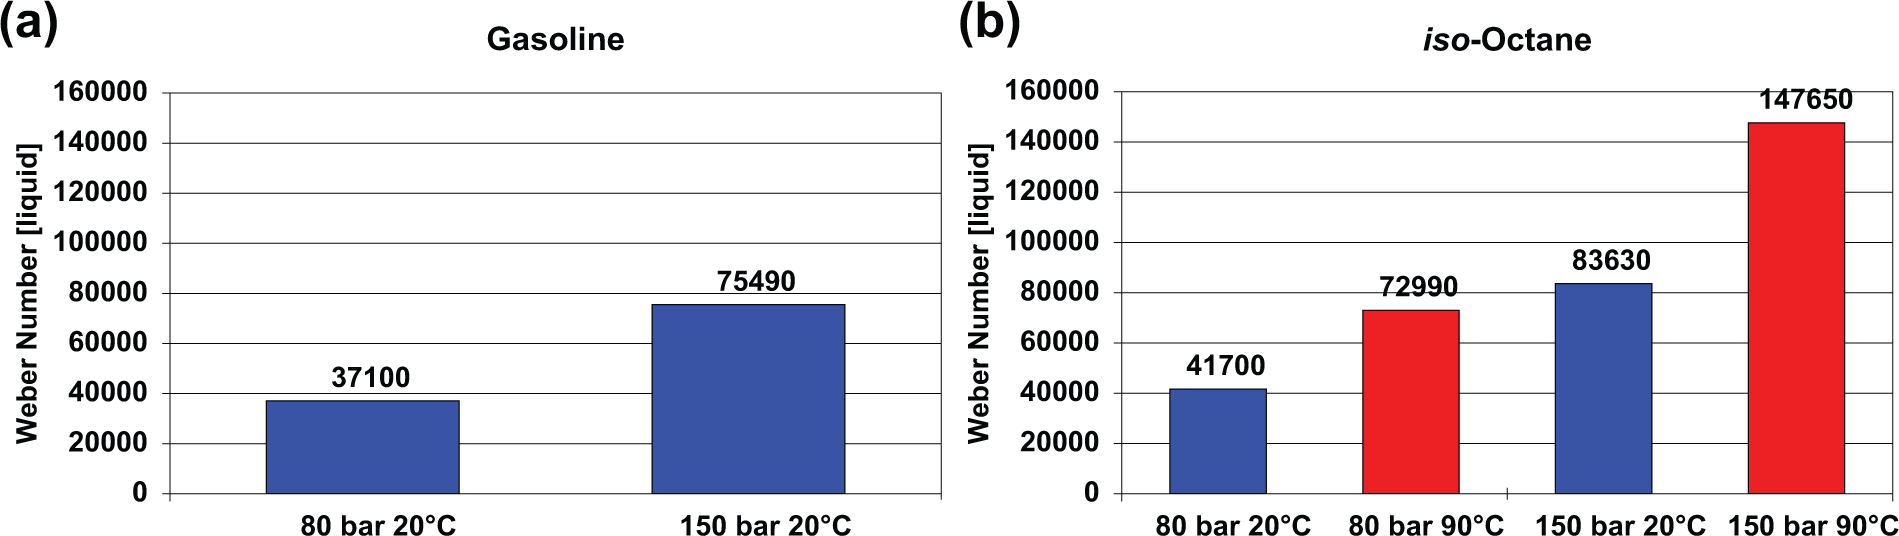
Liquid Weber number for gasoline and iso-octane at 80 bar and 150 bar injection pressure and 20 °C and 90 °C injector body temperature. a) Gasoline, b) iso-octane.
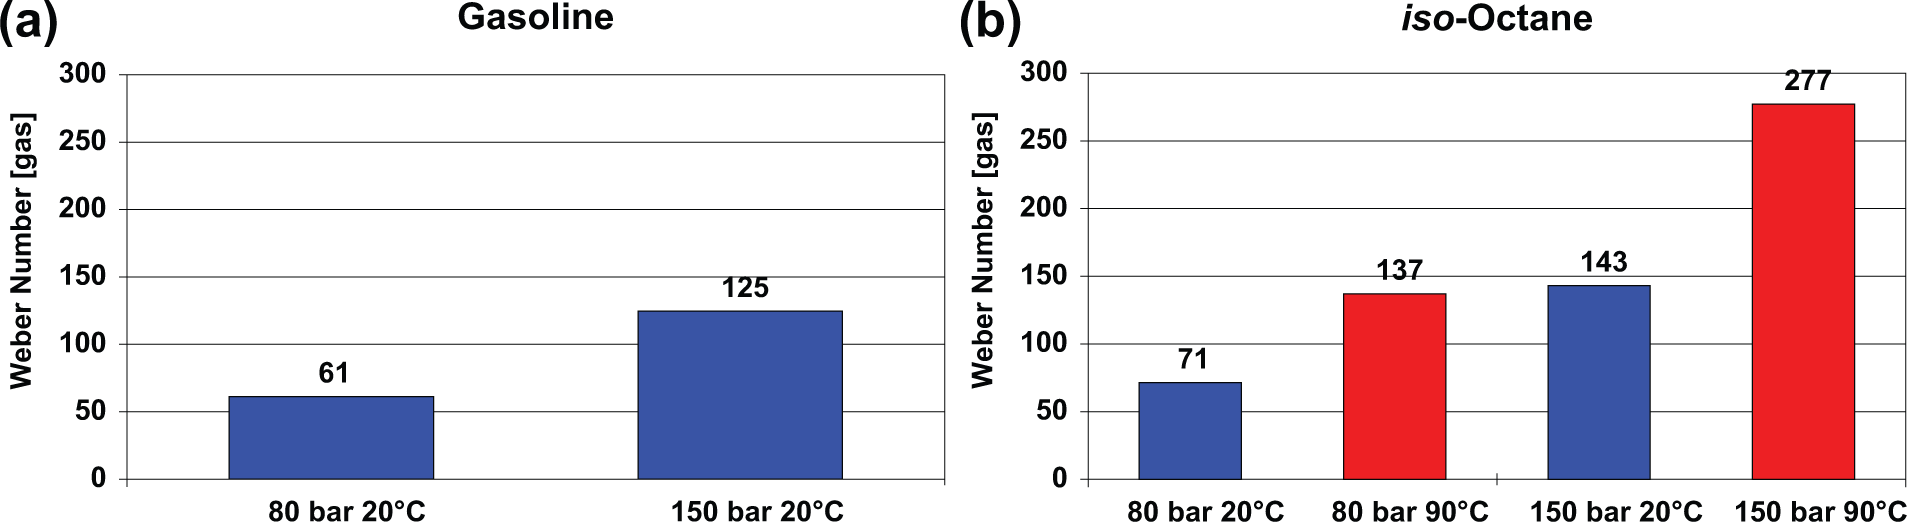
Gas Weber number for gasoline and iso-octane at 80 bar and 150 bar injection pressure and 20 °C and 90 °C injector body temperature. a) Gasoline, b) iso-octane
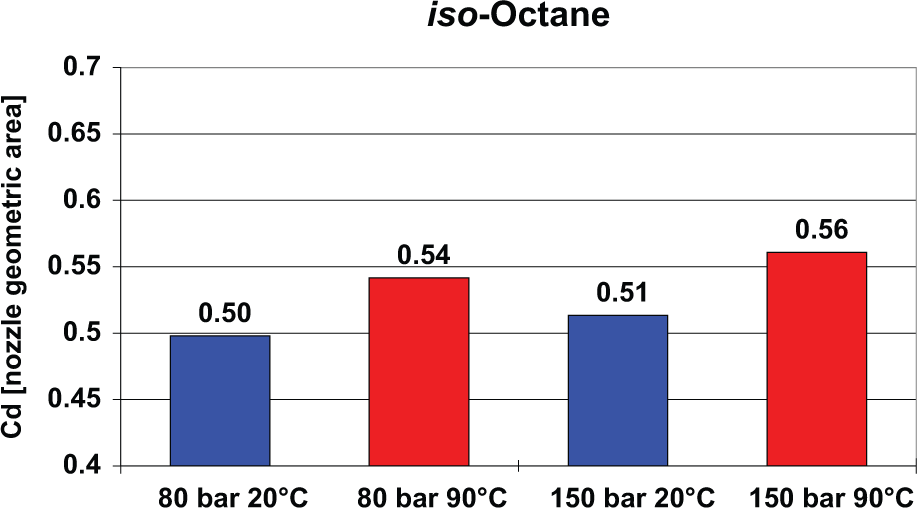
Discharge coefficient (based on volumetric flow rate) for iso-octane at 80 bar and 150 bar injection pressure and 20 °C and 90 °C injector body temperature.
It can be seen from Figure 7 that there is a near linear relationship of fuel mass per injection versus injector pulse width. Comparing the 150 and 80 bar injection pressure shows approximately 35% increase in fuel mass for approximately 90% increase of fuel pressure, as expected from theoretical considerations. At elevated fuel temperature, the measured fuel mass of gasoline is reduced due to changes in fuel properties (e.g. density and viscosity) and flow field changes (e.g. presence of two-phase flow), which are a function of temperature. As the temperature is increased vapour pressure and CN is also increased, making cavitation inception more likely, which can reduce the effective flow area and lower the discharge coefficient. However, the fuel density and viscosity also decrease at increased temperatures, which reduce fuel mass and also viscous losses, at the same time as increasing turbulence. Fuel pressure of 80 bar was also tested to see whether the trend was similar at lower injection pressures, also shown in Figure 7. It can be seen that the injected fuel mass was also reduced at elevated temperatures but to a lesser extent, proportionally, than that seen at 150 bar. The reduced influence of temperature on the injected fuel mass, seen at 80 bar injection pressure, points towards cavitation effects being the primary driver for the reduction of injected fuel mass at these conditions. It was therefore decided to test the same injector using iso-octane as it is expected that cavitation will not be so prominent, owing to the much reduced vapour pressure and higher boiling point compared to gasoline. The iso-octane results are also shown in Figure 7. Gasoline has a boiling range of approximately 30 °C–200 °C depending on the specific blend of components, and iso-octane has a distinct boiling point of approximately 100 °C at atmospheric pressure conditions. It can be seen from Figure 7 that for the equivalent temperature and pressure conditions of gasoline, iso-octane does not show a reduction in fuel mass at elevated temperatures – on the contrary; at the larger injector pulse widths, iso-octane injects more fuel, than at the lower temperature. This characteristic is seen at both 150 and 80 bar, and although it is a relatively small difference of fuel mass, the tests were found to be repeatable and nevertheless shows distinctly different behaviour to that of gasoline. The most significant difference between the physical properties of gasoline and iso-octane is the vapour pressure where the increase at elevated temperature is much more pronounced for gasoline, compared to other physical properties, for example, density and viscosity. Iso-octane has a much lower vapour pressure, with a boiling point of 10° higher than the 90 °C injector body temperature (at atmospheric pressure). The propensity for onset of cavitation of iso-octane is therefore likely to be significantly less than that of gasoline due to the latter’s relatively high vapour pressure and volatility and is also reflected in the distillation curve where a significant proportion of chemical components can undergo phase change at lower fuel temperatures than those seen with injector body temperatures of 90 °C, depending on the prevailing local pressure conditions. The higher vapour pressure will increase the propensity for cavitation onset, and so there is likely to be a greater volume fraction of vapour in the nozzle as it is more likely that the local flow field pressures are below the vapour pressure of the fuel.
It is important to match the flow field dimensionless parameters of the optical nozzle to those experienced by the multi-hole injector and so the injected fuel mass data were used to calculate the Reynolds, cavitation and Weber numbers as well as the discharge coefficient. The Reynolds number data are shown below in Figure 8. Fuel physical properties were obtained from the Yaws handbook 32 or from measured data. 29
It can be seen from Figure 8 that the gasoline Reynolds number is significantly increased at 150 bar compared to 80 bar due to increased flow velocity. It is currently not possible to show the Reynolds number of gasoline under elevated temperature conditions due to the lack of data concerning the fuel properties change with temperature for gasoline, that is, density and viscosity. The Reynolds numbers of iso-octane are increased at higher pressures and also at higher temperatures, with the later having a more prominent effect due to viscosity reduction being proportionally much greater than the reduction of density at the elevated temperature. At 20 °C injector body temperature, gasoline has a higher Reynolds number than iso-octane, indicating increased turbulence of the flow field caused by gasoline’s lower viscosity and higher density. Figure 9 shows the cavitation numbers (Ca), which are based on the more correct fluid dynamic version, which considers flow velocity. Lower Ca numbers indicate increased propensity for cavitation.
The cavitation number (Ca) for gasoline at elevated temperature is not shown because the gasoline density change is currently unknown for the increased temperature condition. It can be seen that gasoline is more likely to cavitate at the higher pressure condition due to the increased velocity of flow, which is greater (proportionally) than the increased difference of injection and vapour pressure. The cavitation numbers (Ca) of iso-octane are decreased at higher pressures and increased temperatures. It can be seen that the temperature increase has a more pronounced effect on the cavitation number (Ca) than the pressure increase because the higher flow velocity due to viscosity reduction at higher temperatures has a greater effect on Ca than the velocity increase brought about by increasing injection pressure alone. Although the density is also reduced at elevated temperatures (which serves to increase Ca), the cavitation number is also dependent on the square of velocity and so has greater influence on the Ca number. Figure 10 shows the CN cavitation numbers based on the ratio of pressures, which is not strictly correct from a fluid mechanics perspective but does however make comparisons between different experimental set-ups easier because flow velocity and density are not considered. It should be noted that this form of cavitation number (CN) was originally proposed for use with direct-injection CI diesel engines where injection pressures can be more than an order of magnitude higher (>2000 bar), also injecting into far higher downstream pressure conditions, and the diesel fuel is much less volatile (i.e. of much lower vapour pressure). These differences between SI and CI direct injection can lead to cavitation numbers, which become negative at some SI conditions, due to relatively low downstream gas pressure and relatively high vapour pressure for DISI conditions. Higher positive (and also lower negative) CN numbers indicate that increased cavitation is likely.
It is possible to show CN cavitation numbers for gasoline at hot conditions because the CN number does not feature density or velocity. The elevated temperature of gasoline shows negative CN numbers due to the vapour pressure being greater than the downstream pressure, which leads to a negative value for the denominator of the CN equation. The lower the negative value (for conditions where the vapour pressure is higher than downstream gas pressure), the more likely cavitation will exist. The CN data show the same trend of fuel pressure and temperature effects on cavitation, as those seen in Figure 9, although it can be seen there are greater differences between the CN values than between the Ca values.
Figure 11 shows the liquid Weber numbers, Wel , where higher values indicate increased likelihood of spray break-up. It can be seen from the gasoline data that increased fuel pressure leads to increased propensity for spray break-up, due to the increased flow velocity. Velocity changes have a far greater influence on Wel than the other properties as it is a function of the square of velocity. The Wel for gasoline at elevated temperature conditions is not shown as the surface tension reduction at this temperature condition is not known.
Iso-octane data show increased Wel at increased pressure and temperature conditions, which is a result of the increased flow velocity and reduced surface tension. The density decrease at elevated temperatures is not as significant. The iso-octane Wel at 20 °C for 80 and 150 bar is greater than that of gasoline due to its lower surface tension. The average flow velocity at 20 °C for iso-octane and gasoline is very similar, which indicates that the surface tension change has a greater effect on Wel than the density change (iso-octane has lower density than gasoline, which serves to decrease Wel ). Gas Weber number values, Weg , are shown in Figure 12 and are directly proportional to liquid Weber numbers for these tests, because the downstream gas pressure conditions are not modified.
Figure 13 shows the nozzle discharge coefficient (Cd ), which serves as a metric indicating the level of flow losses at each test condition for iso-octane. These can be due to a combination of fuel properties and hydrodynamic phenomena, for example, cavitation, which reduces the effective flow area, flow separation at the nozzle inlet leading to recirculation zones and so on. It can be seen that an increase in fuel temperature leads to an increase of Cd . This could be due to temperature effects on viscosity having a greater influence than any potential cavitation effects. However, relative contributions from various types of such underlying coupled phenomena are currently unclear, and analysis of the internal nozzle flow, as well as effects on spray formation, is expected to elucidate such contribution (especially by altering the liquid’s properties over a range of fuel types).
Matching dimensionless parameters
To ensure the fluid flow within the optical nozzle is representative of the real injector, it is necessary to simultaneously match the Reynolds, cavitation and Weber numbers to that of the multi-hole injector. For a perfect optical nozzle replica without any manufacturing geometric differences from the real injector, all the dimensionless numbers would be automatically matched at the same operating conditions of the real injector with the same fuel. However, in practice, at equivalent injection pressure, there may be differences in the flow field between the real and optical nozzle hole, for example, from differences in losses due to varying nozzle inlet radii (from the manufacturing process), length-to-diameter ratio, surface roughness and so on, and so one may need to consider ways to match, as closely as possible, all dimensionless numbers to those of the real injector. For example, in order to mitigate the differences of flow rate, the injection pressure applied to the optical nozzle may need to be modified to ensure equivalent Reynolds number of the internal nozzle flow. However, although the Reynolds number can be matched using modified injection pressure, this will result in the cavitation number no longer being matched. It is possible to simultaneously match the Reynolds with cavitation number by adjusting the downstream gas pressure. However, this, in turn, will influence the gas Weber number, and so to enable a close match between all three dimensionless flow parameters simultaneously, it may be needed to carefully adjust the surface tension using a suitable surfactant and so on. Obviously, the aim is for a replica optical nozzle, which is as faithful to the multi-hole injector as possible.
Optical nozzle
Material and manufacturing considerations
Prior to this work, acrylic nozzles were designed and tested for a variety of fuels and temperature and pressure conditions. 2,29 PMMA was used but its application was limited due to its maximum service temperature of 80 °C–90 °C and its chemical incompatibility with some hydrocarbons and alcohols. Within the objectives of the current work, alternative temperature-resistant optical materials have been investigated. In addition to thermal resistance, there are other optical, mechanical and chemical compliance criteria, which need to be considered when assessing potential materials. For example, optically one needs to look into the spectral pass band, refractive index, Abbe value, birefringence, light transmittance and so on, while mechanically, properties of interest are the maximum working temperature, chemical resistance, thermal expansion coefficient, thermal conductivity and so on. The ease of manufacture and cost also need to be considered. There are three main aspects to the manufacture of an optical nozzle: nozzle body machining, nozzle hole drilling and polishing of the nozzle hole surface and the sides of the nozzle body. No single company was able to complete all of these machining aspects. For this reason and also due to the precision required, it attracts a large manufacturing cost.
It is important to match the refractive index of the test fuels as closely as possible in order to minimise refraction and be able to see clearly into the nozzle. It will not be possible to perfectly match the refractive index due to material constraints and because the refractive index of the fuels to be tested varies. In addition, refractive index also changes with wavelength and temperature. Refractive indices of some fuels are shown in Table 1 (2,5-dimethylfuran (DMF) is also included because it has been suggested as a potential future biofuel owing to recent improvements to its manufacturing process).
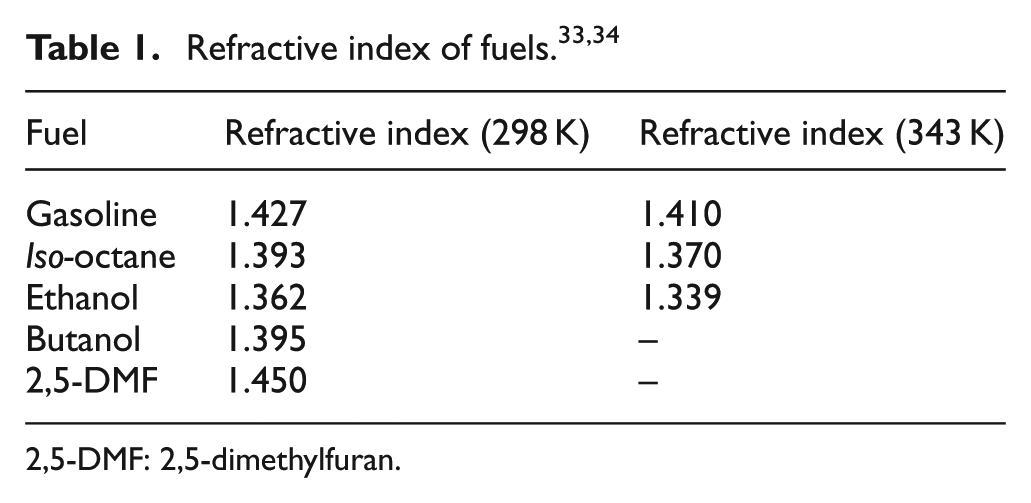
2,5-DMF: 2,5-dimethylfuran.
Other polymer materials were considered for the manufacture of the optical nozzle (Table 2, reproduced from http://www.plasticoptics.com/optical-plastic-materials.html 35 ), and it was decided that the only suitable optical polymer with a high enough maximum service temperature was Arton F. Arton polymers are amorphous resins (norbornene homopolymers and copolymers); they are functionalised with an ester side chain to control their heat resistance and come in different types, for example, Arton G extrusion grade is used for optical films, Arton homopolymer for liquid crystal display (LCD) screens and touchscreen displays. Arton F and FX grades are for injection moulding optical discs (CD and DVD) and lenses for cameras and laser printers. Injection grades have heat resistance values of about 140 °C–165 °C. Although potentially suitable, it is not readily available in Europe but nevertheless remains under consideration as a viable optical nozzle material.
Properties of optical plastic materials. 35
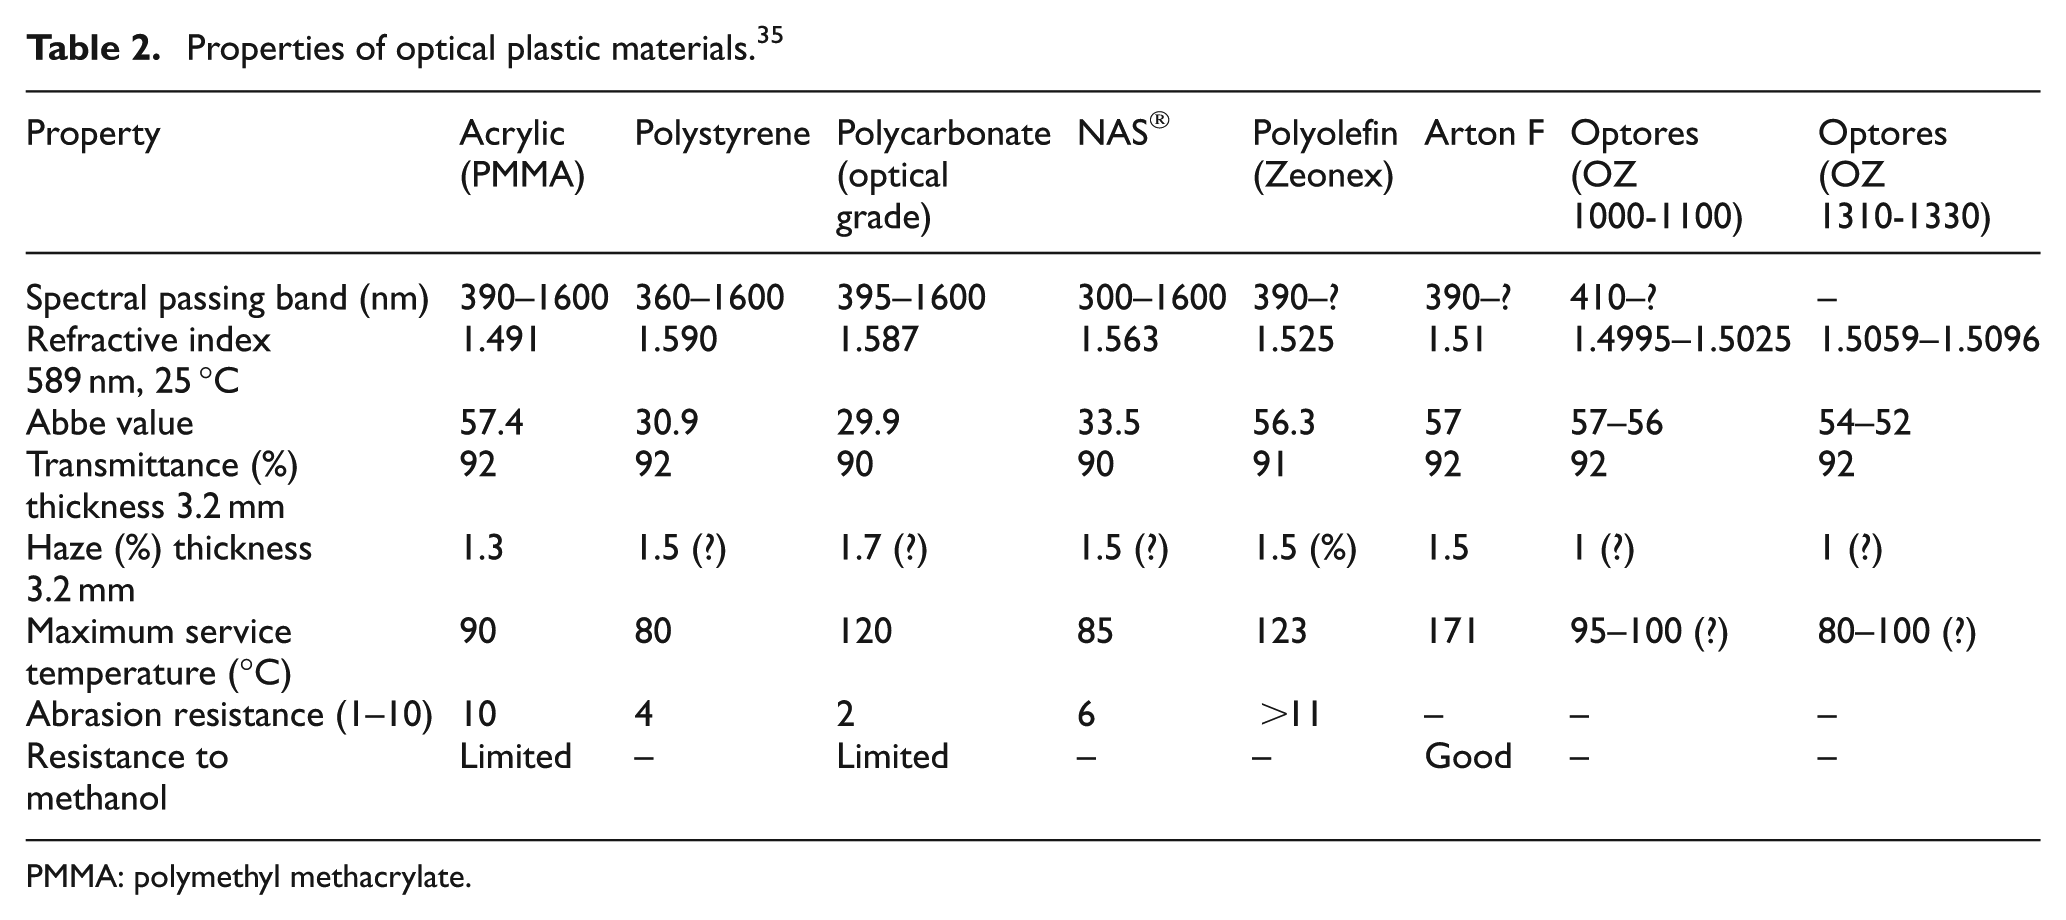
PMMA: polymethyl methacrylate.
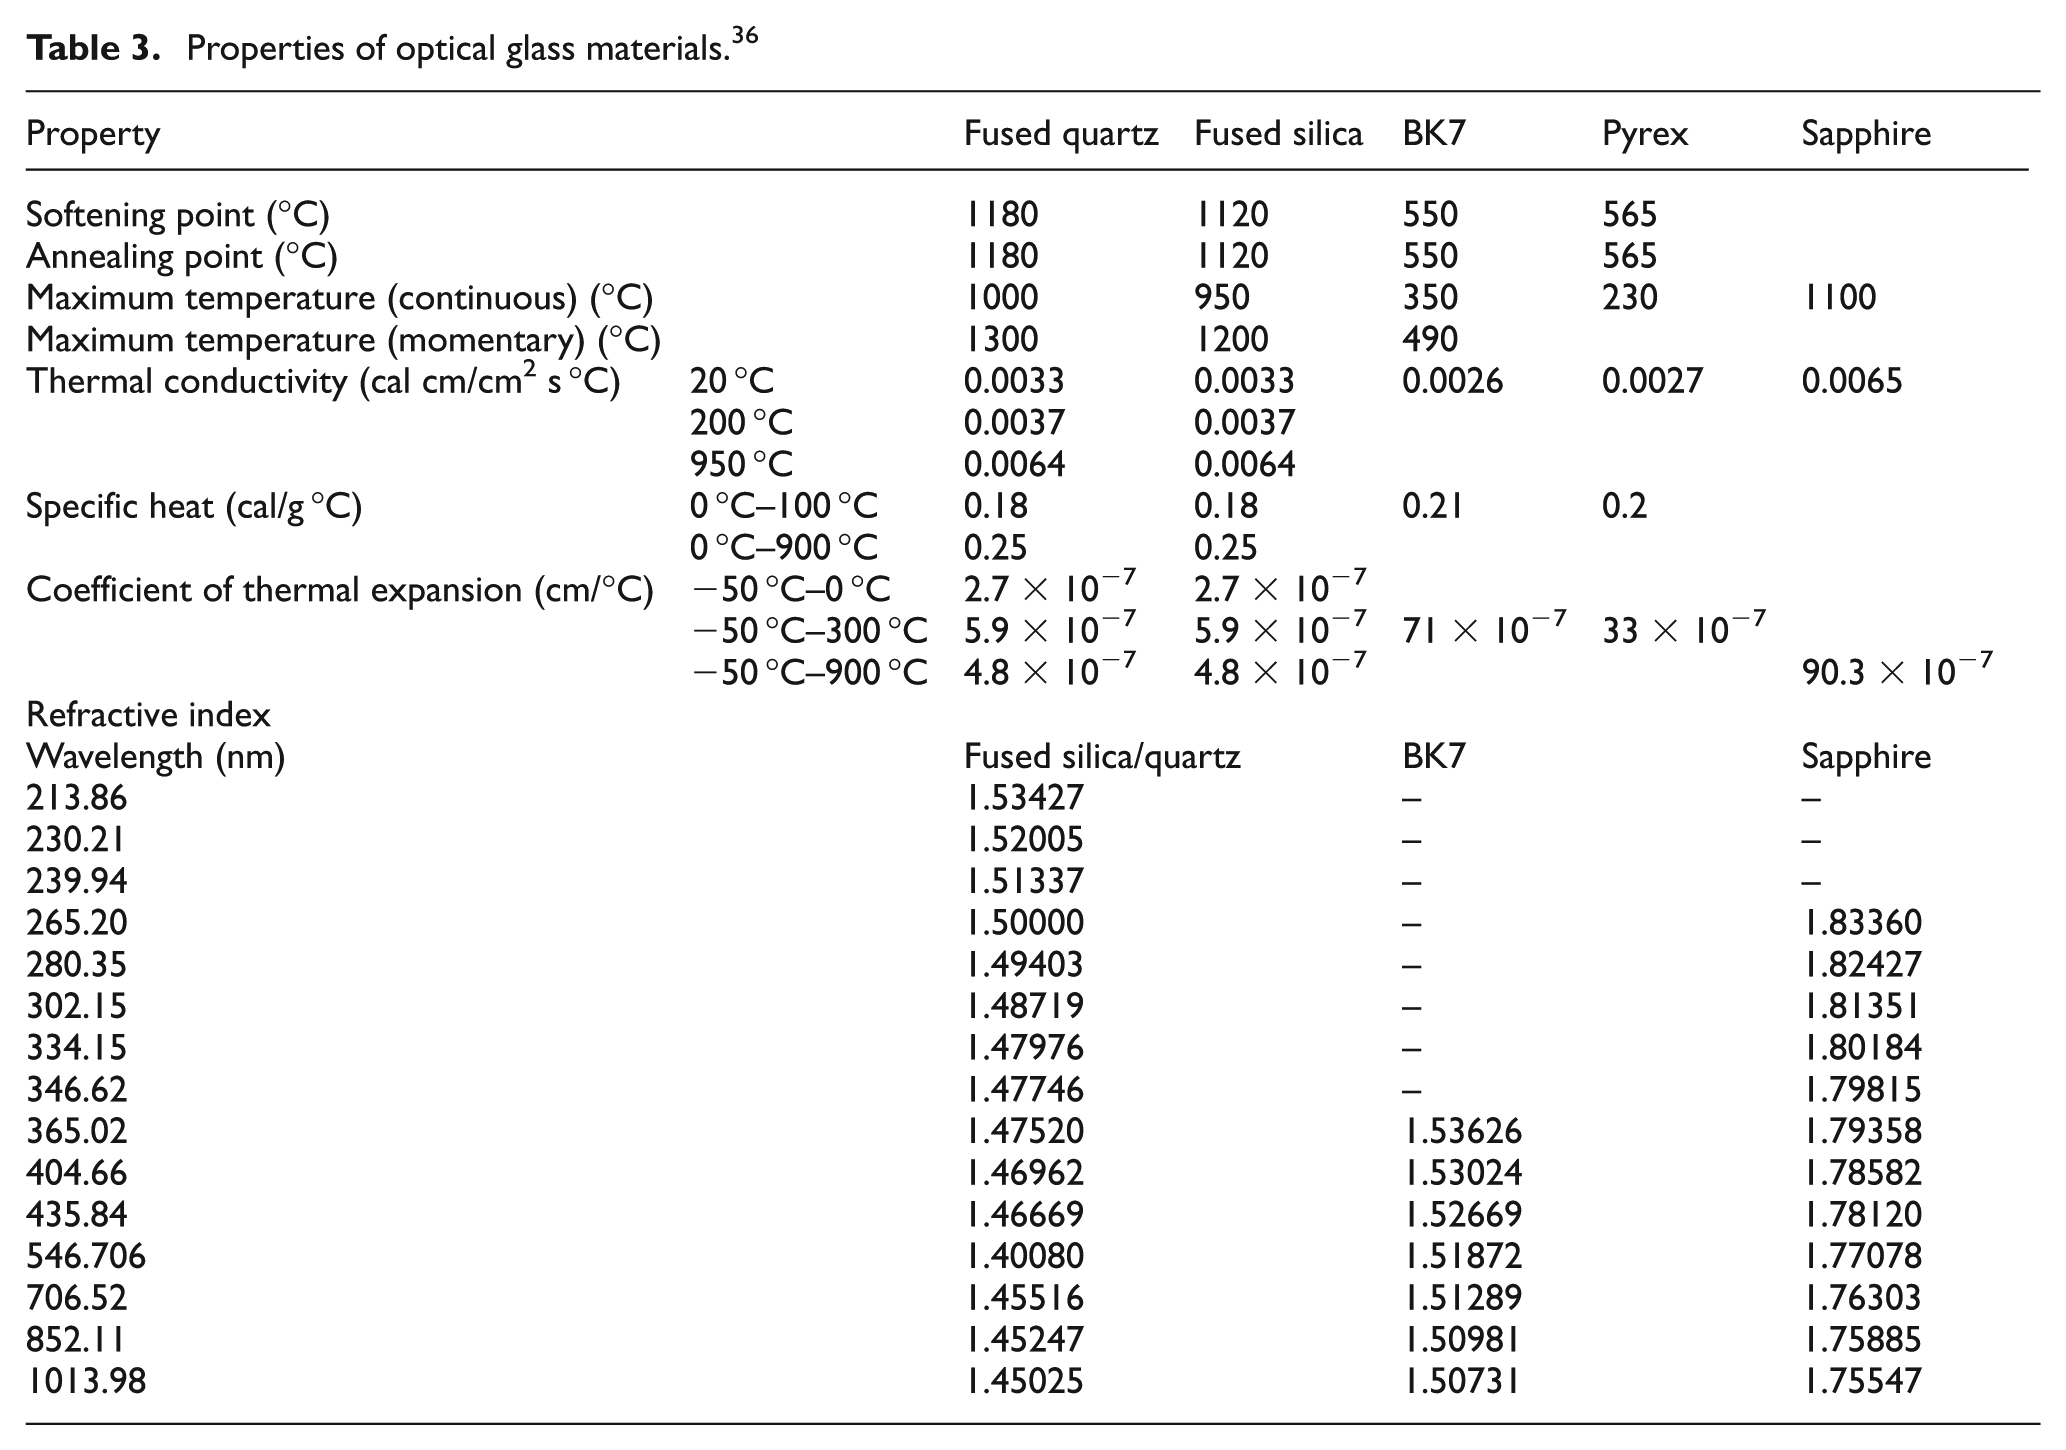
Therefore, optical glass materials were also investigated. Table 3 shows the mechanical properties of some common optical glass materials. Optical components are available mainly in fused/quartz silica, sapphire and BK7®– a borosilicate glass, similar to Pyrex®. Fused/quartz silica has the most favourable refractive index when comparing to the fuels in Table 1 and sapphire’s refractive index is too high. Amorphous (fused) silica is more desirable than crystalline quartz because the later is naturally birefringent due to the anisotropic nature of the crystal lattices. Birefringent materials have a refractive index, which is sensitive to the polarisation and directional propagation, and so can appear to have more than one refractive index. This can often lead to a double image because the light is divided into an ‘ordinary’ and ‘extraordinary’ ray. Fused silica does not have this problem and also costs less.
Properties of optical glass materials. 36
Nozzle design and manufacture
It was decided to base the optical nozzle design on a prism because they exist as an off-the-shelf component with a high optical and geometric specification, are relatively inexpensive and have a convenient geometry for the nozzle exit. Disadvantages include difficulty in drilling the brittle glass material, the mounting arrangement within the test chamber and the need to grind and polish the triangular faces. The drill entry and exit must be perpendicular to the glass plane to minimise glass chipping. A schematic representation of the prism-based optical nozzle design is shown in Figure 14. The dimensions shown are of the prototype design and can be altered to fit the required injector geometry (e.g. L/D). Two types of prism were considered: a right-angled and equilateral shape prism. The right-angle prism was chosen because it is a closer match to the refractive index of the fuels that will be tested. Right-angle prisms are used to reflect light 90° or 180°, dependent on the prism face that the light enters. Equilateral prisms are used for dispersing component wavelengths of the light and so often have a relatively high refractive index (e.g. sapphire shown in Table 3), making this type of prism unsuitable for this research.
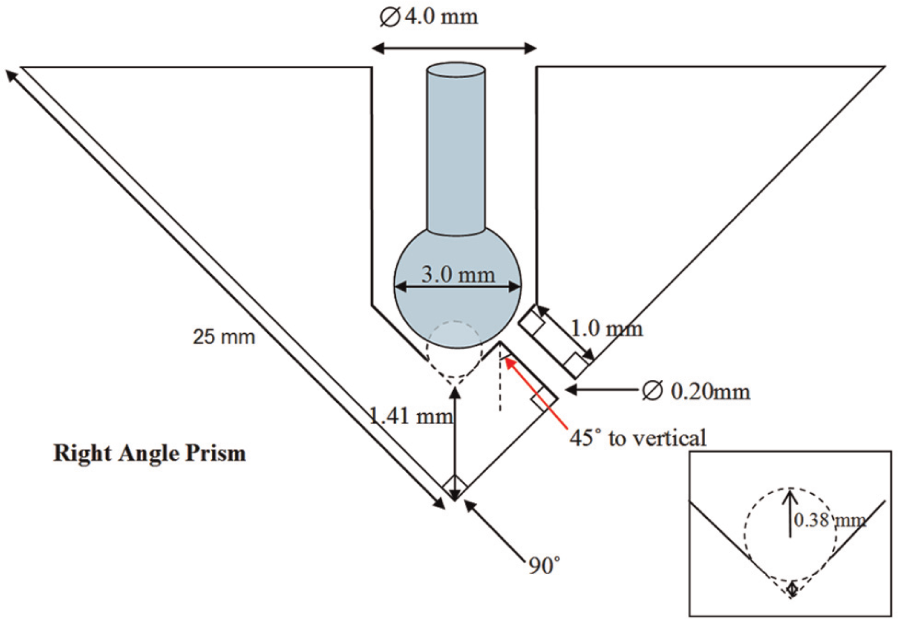
Schematic representation of prism design.
Optical nozzle-drilling techniques – mechanical and laser
Various methods of drilling the 4-mm-diameter fuel-feed and 0.2-mm-diameter nozzle hole were investigated and attempted, both mechanical and by ultraviolet (UV) laser. Initially, tungsten-carbide helical drills were used for both holes. This had limited success and many prisms failed due to their brittle nature and the high friction, and large thermal gradients created, particularly for the larger of the two holes. The larger hole needed to be drilled through almost the entire prism, removing a lot of glass material, causing the tungsten drill tips to become blunt very quickly due to the hardness of the glass. The drill tips were required to be turned in a lathe to a 90° angle to ensure the feed-hole chamfer at the bottom is parallel to outside prism face, and that the small nozzle hole could be drilled perpendicular to the glass surface. Glass materials have a relatively large heat capacity and so-called thermal mass, and thus are effective at storing the heat generated by the drilling friction, and the rejection of this heat was of primary concern in avoiding fracture.
Due to the very limited success of the tungsten-carbide helical drills for the larger 4 mm fuel feed-hole, a diamond-coated core drill was used instead to successfully grind the glass material. Less material needed to be removed with this technique because a glass core was created in the process, and also the drill tip did not wear as quickly as the tungsten-carbide drill. A small amount of the glass core was inevitably left at the bottom and was removed with a diamond-coated burr. The design was further modified to incorporate a seat with a hemispherical recess for the ball-end needle location to be more representative of the actual injector seat, as shown in Figure 15(b). A diamond-coated ball-end burr was used for this but unfortunately had a more coarse application of diamond particle, which led to increased ‘score’ marks on the needle seat. Diamond-coated drills were unavailable in 0.2-mm-diameter size; however, tungsten-carbide proved effective as there was far less material to be removed and lower torque and friction are generated. The problem of glass ‘chipping’ was ever present and seemed to be unavoidable; even when ensuring perpendicular entry to the glass face, slight chipping was observed. Glass chipping is a problem when the tool enters and exits the glass, and so an attempt was made to reduce this tendency to chipping at the location where the small hole meets the larger fuel-feed hole inside the prism. This was achieved by drilling the small nozzle hole first to ensure that the larger hole ‘breaks’ into the smaller hole, rather than the small hole ‘breaking’ into the larger fuel-feed hole. However, chipping could not be completely eliminated.
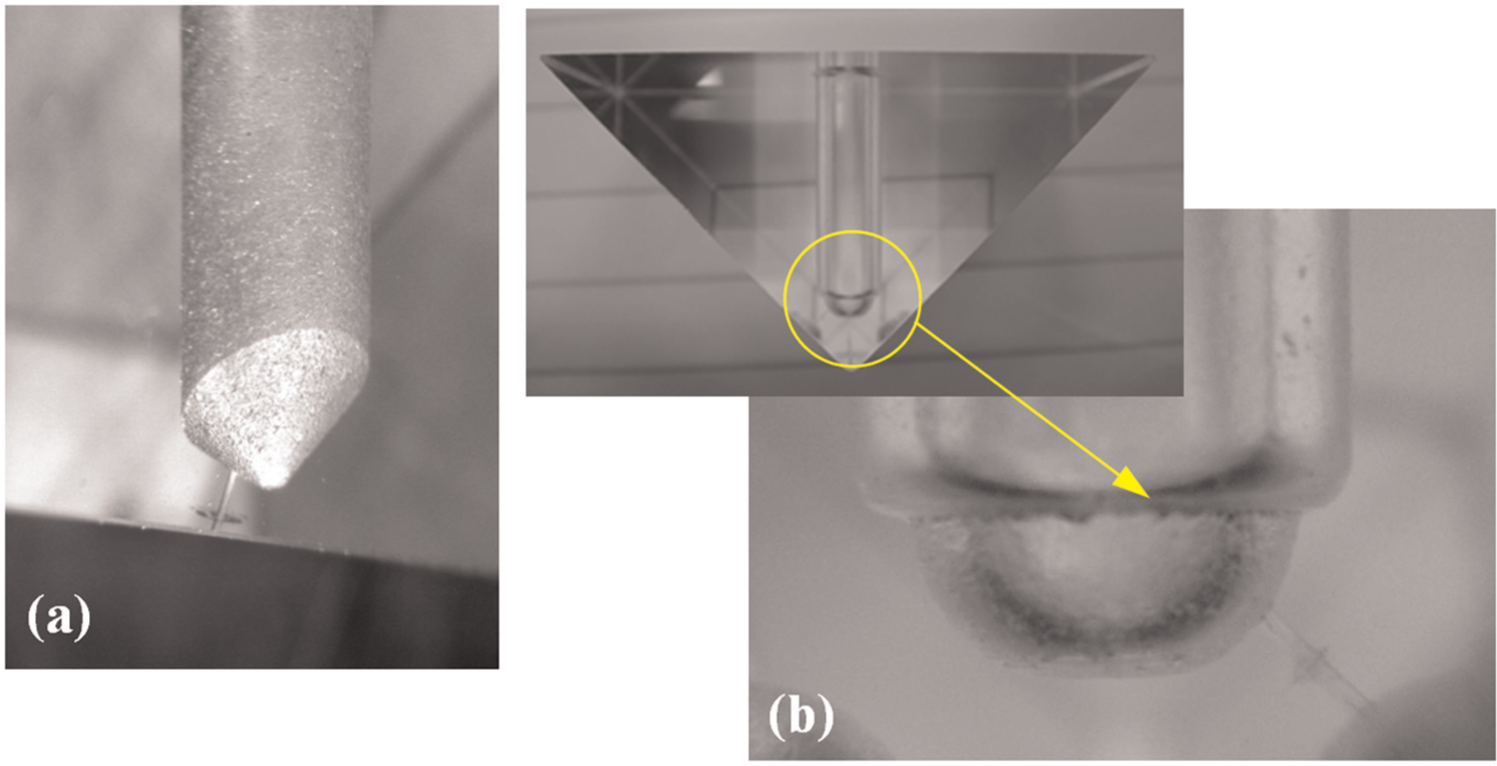
(a) Laser-drilled 0.2 mm nozzle hole with conical shaped needle seat and (b) mechanically drilled 0.2 mm nozzle hole with hemispherical needle seat.
Laser drilling the 0.2 mm hole was investigated in an attempt to circumvent chipping and to hopefully provide a better surface finish for the small hole. Many types of glass are transparent to the majority of available laser wavelengths, and a relatively high energy is needed to vaporise the glass. An UV pulsed excimer laser of 193 nm wavelength was used to drill borosilicate glass (BK7), and the hole was drilled gradually with a trepanning technique. Fused silica is unsuitable for laser drilling because the material will not adequately absorb the laser wavelength.
Optical nozzle internal assessment
The laser and mechanically drilled holes were assessed by making internal impressions of the optical nozzle using the VPS technique described and implemented earlier for the real injector nozzle assessment. The laser-drilled nozzle hole results in Figure 16 are compared to those of the mechanically drilled hole in Figure 17. The surface finish of the laser-drilled hole shown in Figure 16 is not as smooth as was envisaged, which could be a result of ineffective material removal. A lack of adequate purging of the vaporised glass may have caused the glass material to condense on the surface rather than exit the hole.
a) Laser-drilled nozzle hole, feed-hole and b) nozzle inlet magnified.
Mechanically drilled nozzle: (a) nozzle general view, (b) magnified inlet with some chipping and (c) nozzle hole surface.
Figure 17 shows the mechanically drilled nozzle hole, which looks much smoother than the laser-drilled hole. Figure 17(b) shows a more detailed view of the nozzle inlet, showing chipping at the inlet where the fuel-feed hole meets the smaller nozzle hole. The magnified nozzle surface (10 µm, scale) is shown in Figure 17(c).
Surface roughness and abrasive flow machining
There is a simultaneous need for the optical nozzle to have the surface characteristics of the injector it represents and also to be as smooth as possible to reduce scattered light so it may pass through relatively unhindered, in order to be able to analyse the internal flow properly. Optical clarity would not be dependent on surface roughness if the refractive indices of the fuel and nozzle material were matched exactly – indeed, rough nozzle hole boundaries would appear invisible as there would no refraction at their interface. It is not possible to exactly match the refractive index due to the variety of fuels planned in the testing with their differing refractive indices and the limitations of the optical material. Refractive indices are wavelength and temperature dependent. It is therefore important to investigate the methods of reducing the nozzle surface roughness. Internal nozzle flow is not only affected by the surface roughness of the nozzle hole wall but also by the characteristics at the inlet to the nozzle where a sharp inlet edge, from glass chipping, for example, can give rise to flow separation and therefore affect the downstream characteristics of internal nozzle flow and the subsequent spray formation. The nozzles exit that edge characteristics are also an important influence on downstream spray formation.
Techniques for shaping and polishing the internal surface and nozzle inlet edge were investigated. Abrasive flow machining (AFM) is a technique successfully used in industry for many years. Kennametal® (formerly: Extrude Hone®) are pioneers in this field and patented the AFM process in the 1960s, as a method to deburr, polish and radius difficult-to-reach surfaces, for example, cylinder head flow channels and high-pressure diesel injectors. Gilles-Birth et al. 9,10 used Kennametal to polish the internal surface of acrylic nozzles for their optical study of a gasoline injector, and so Kennametal were asked whether they could perform a similar process with glass nozzles. They agreed to try the AFM processing, although it had not been attempted with glass before. The AFM technique entails pumping abrasive slurry over a surface to remove material, thereby shaping and polishing the surface. For small diameter channels, a low-viscosity medium with smaller abrasive particles was used. AFM processing of glass materials had not been attempted before and so, initially, 0.5-mm-diameter drilled prototypes, manufactured from lower quality glass prisms, were used to validate the manufacturing and AFM process, and these initial results are shown in Figure 18.
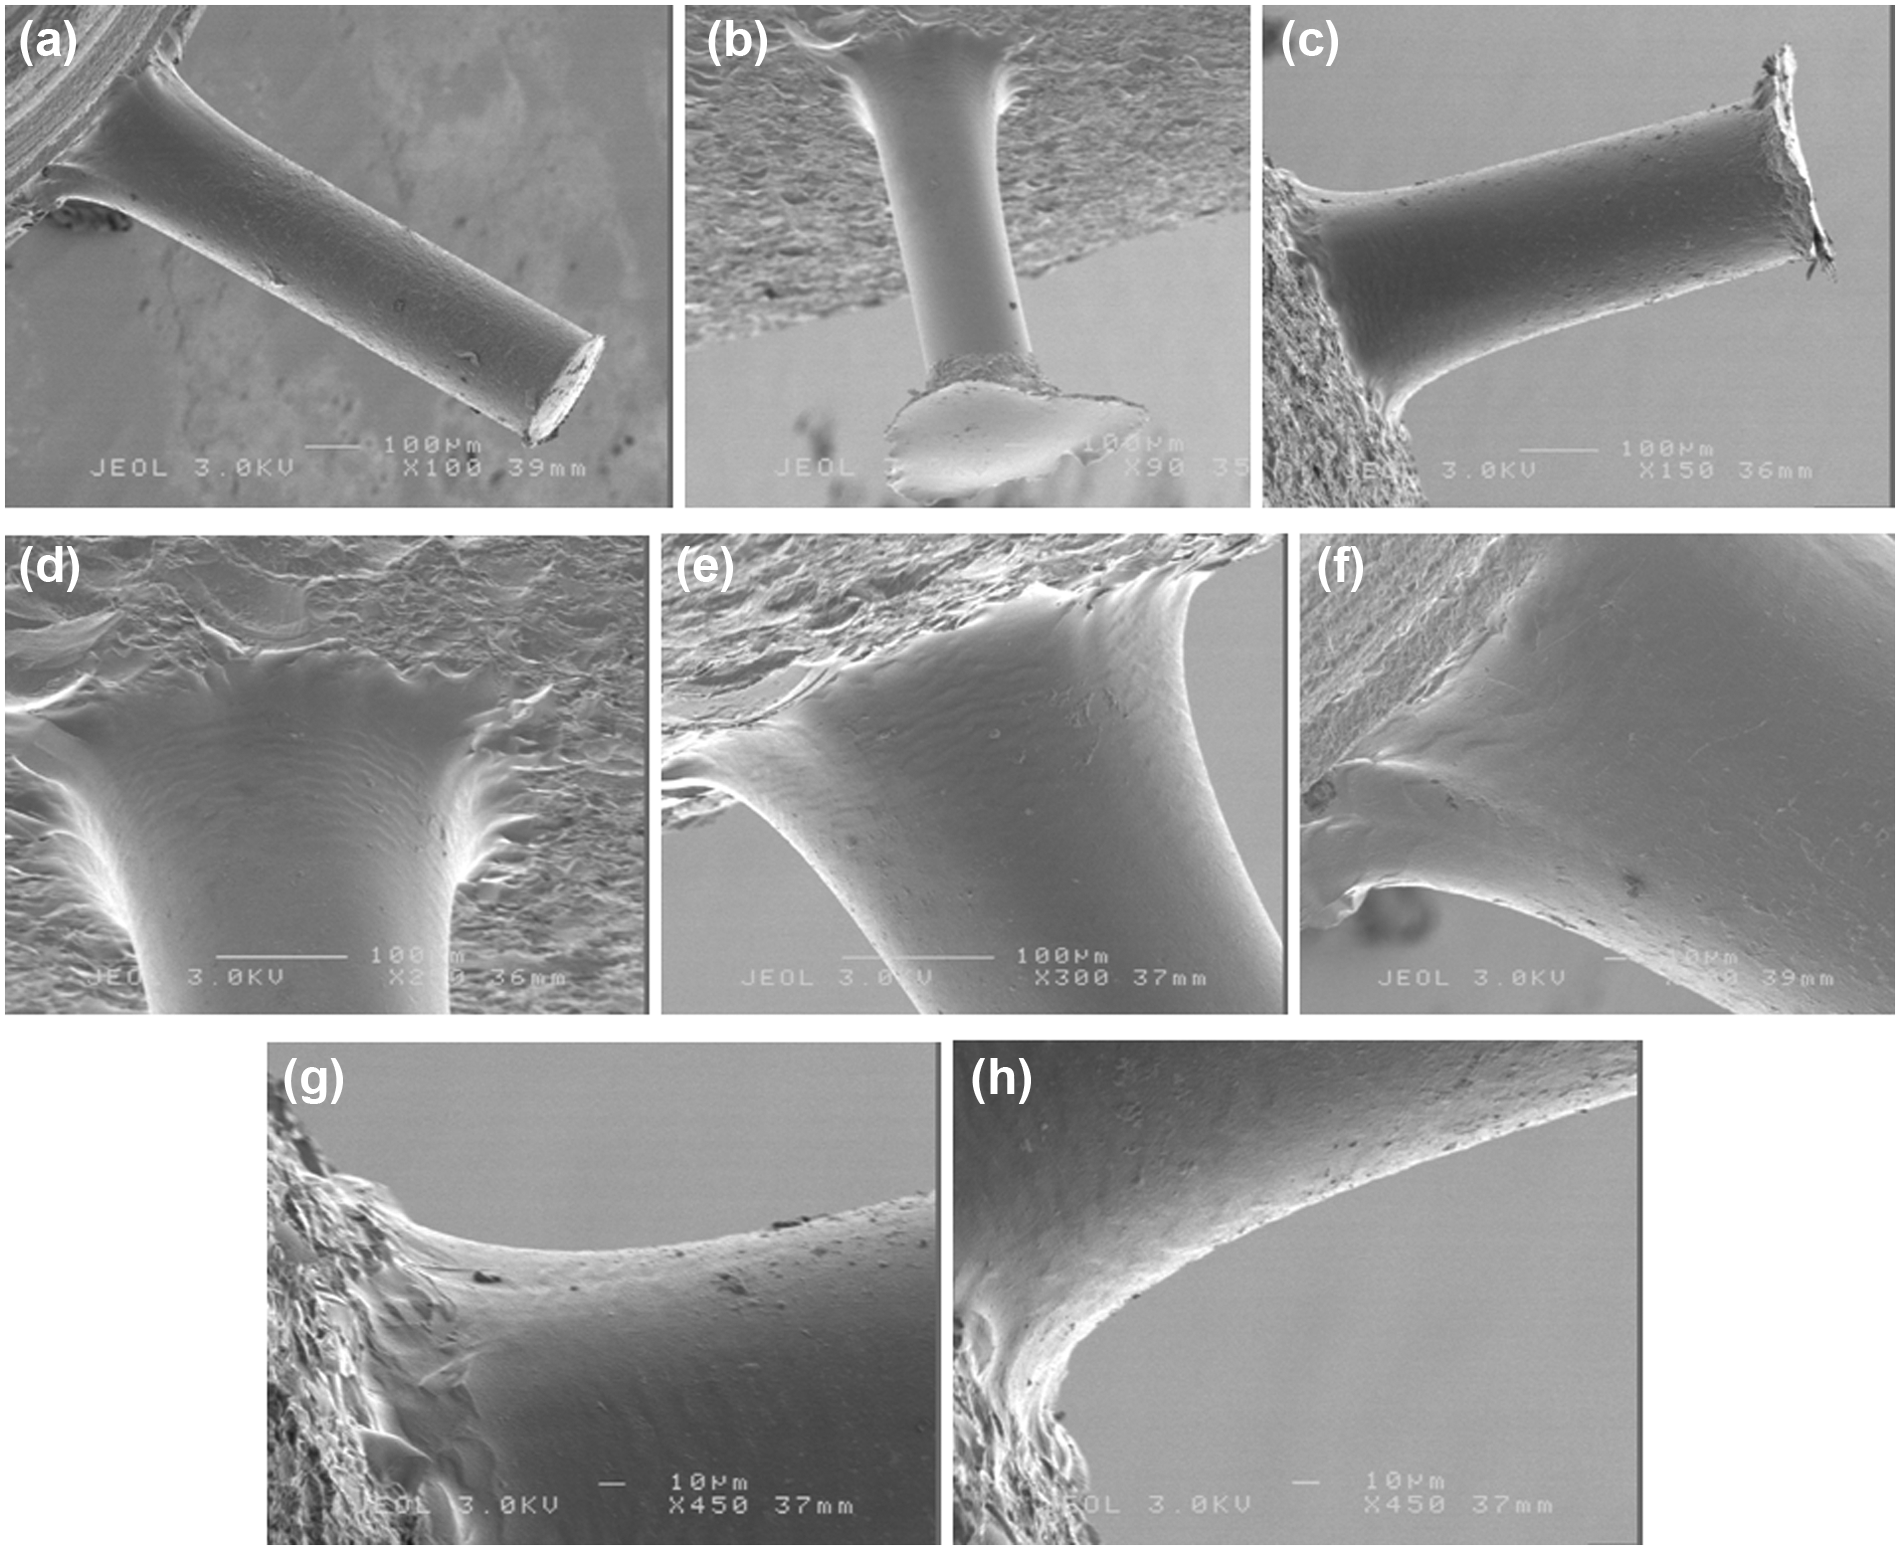
SEM images showing initial abrasive flow machining (prototype nozzle). a) global view of nozzle, b) magnified inlet region showing radii of curvature, c) d) e) further magnified views of nozzle inlet radii.
The striations in the images are likely to be a result of cracking of the thin gold layer while handling the test pieces into the SEM. After this prototype validation, 0.2-mm-diameter nozzle holes were drilled in high-quality precision prisms. Figure 19 shows glass chipping caused by entry and exit of the drill, and methods of eliminating the chipping of the nozzle exit are currently under investigation. Figures 20 –22 show optical and electron microscope images before the AFM process, and Figure 23 shows the results after the process and illustrates the effectiveness in shaping and smoothing using this technique, even for micro-size glass channels. The electron microscope images show a great improvement in the surface roughness of the nozzle, and the glass chipping on the inlet has been virtually eliminated and inlet shaped to a smooth radius. The prism faces were subsequently ground and polished, and the outer hole glass chipping was removed (including shortening of nozzle lengths) by IC Optical Systems Ltd and is shown in Figure 24. Figure 21(c) shows the power of the VPS technique to replicate surface detail; the glass fractures look very smooth even on a highly magnified scale and increases confidence of other surface details being a true representation.
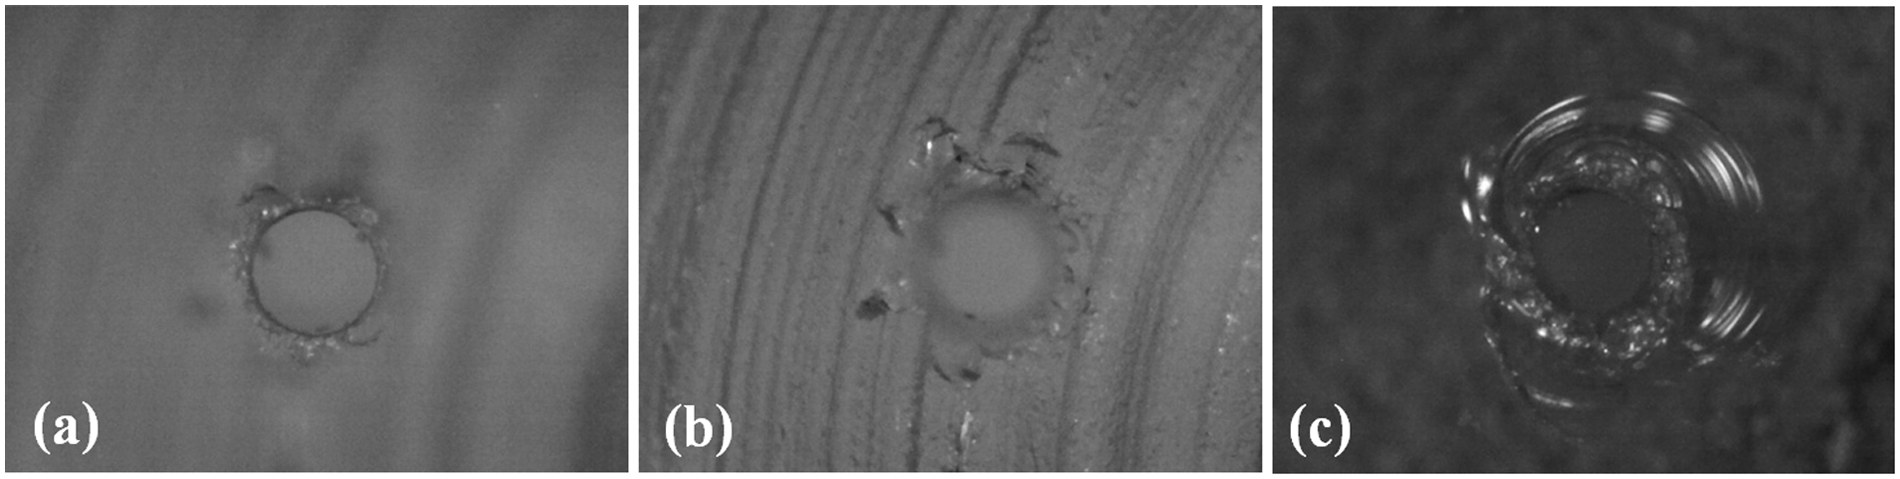
A 0.2-mm-diameter nozzle hole chipping caused by mechanical drilling: (a) outer hole, (b) inner hole and (c) extreme chipping.

Images of 0.2 mm nozzle hole channel prior to abrasive flow processing. a) global view, b) further magnified views of nozzle and inlet.
SEM images of mechanically drilled 0.2 mm nozzle hole prior to AFM process: (a) nozzle general view, (b) inlet region showing glass chipping and (c) close-up of glass chipping.
SEM image showing magnified view of mechanically drilled nozzle surface prior to AFM.
Collection of images showing results of the abrasive flow process on a 0.2 mm nozzle hole.
Nozzle length modification: a) ~1 mm in length (L/D ≈ 5), b) ~0.5 mm in length (L/D ≈ 2.5) and c) polishing of outer hole to eliminate glass chipping, respectively.
Sample spray and cavitation images
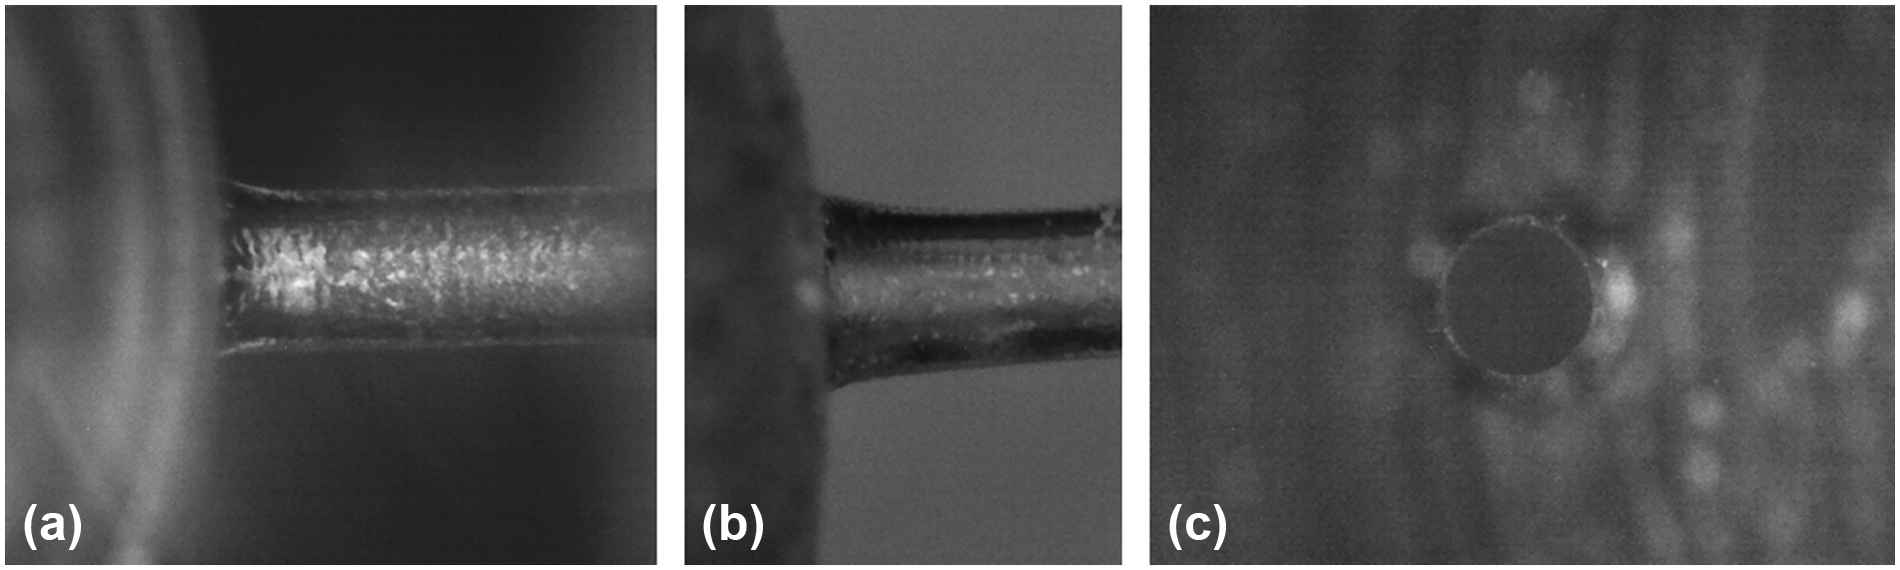
The capability to observe the various phenomena of different regimes of atomisation is demonstrated in the following, using gasoline. A backlighting (shadowgraph) technique is used where droplets and cavitating flow scatter light, forming dark areas in the images. Figure 25 shows initial spray images from the optical nozzle; global and macro images have been included. Images were taken with a Photron APX high-speed camera with a Nikon AF Micro, Nikkor 60 mm 1:2.8D lens, used for the global images, and an Infinity Optics K2 macro lens used for the near-nozzle imaging. Figure 26 shows near-nozzle imaging and also shows the ability to simultaneously see within the nozzle channel with the macro lens. A Questar LDM was used for high-magnification in-nozzle imaging, and Figure 27 shows some in-nozzle images of cavitating flow.
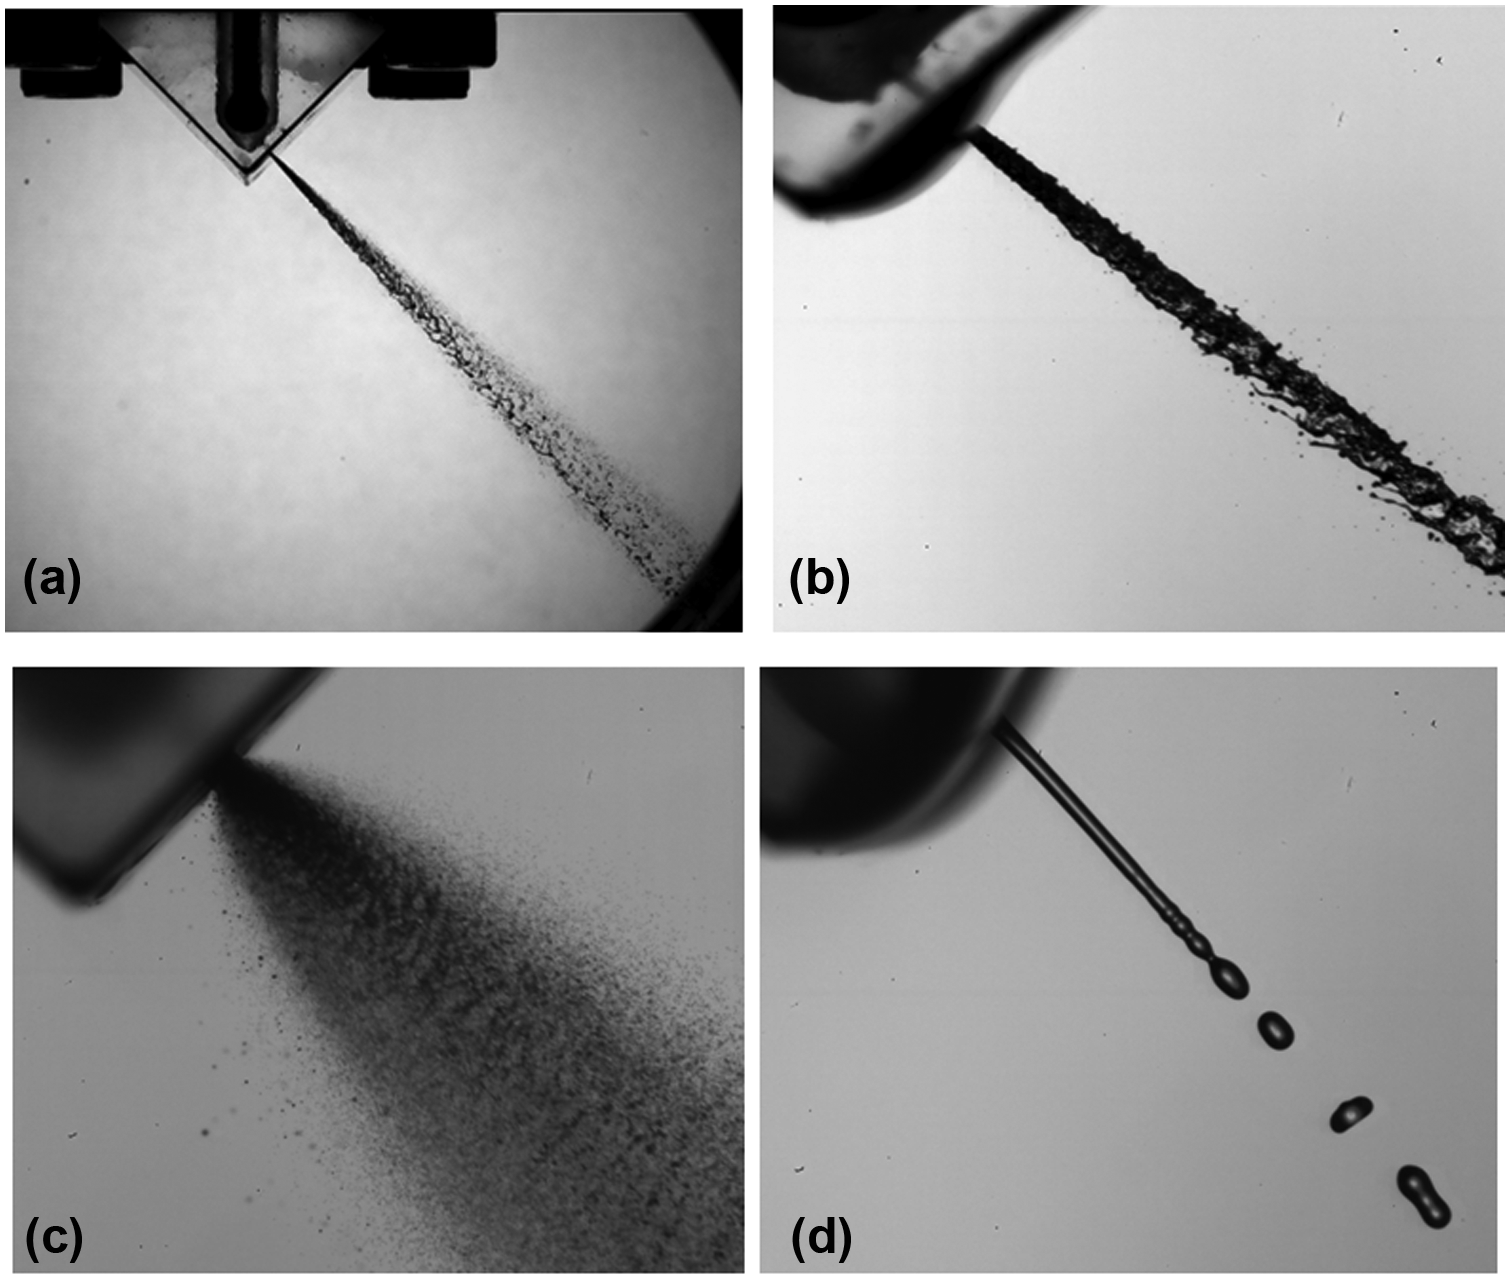
Spray imaging with new nozzle: (a) global imaging, 40 bar, 20 °C; (b) macro imaging wind-induced regime, 10 bar, 20 °C; (c) macro imaging atomisation regime, 40 bar, 120 °C and (d) macro imaging Rayleigh regime <1 bar, 20 °C.
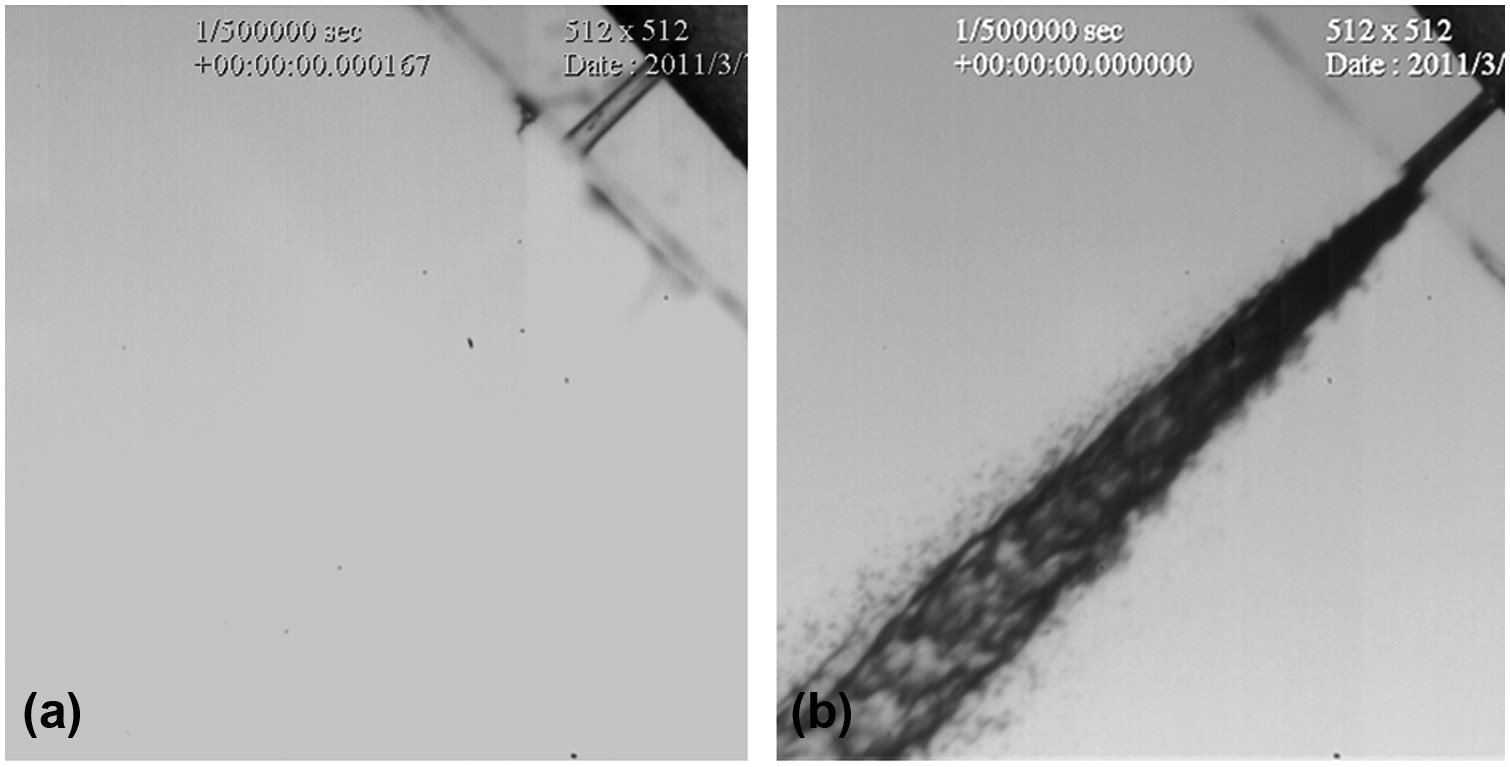
Macro imaging, simultaneous in-nozzle flow and spray formation: (a) no flow and (b) early spray development, 40 bar, 20 °C.
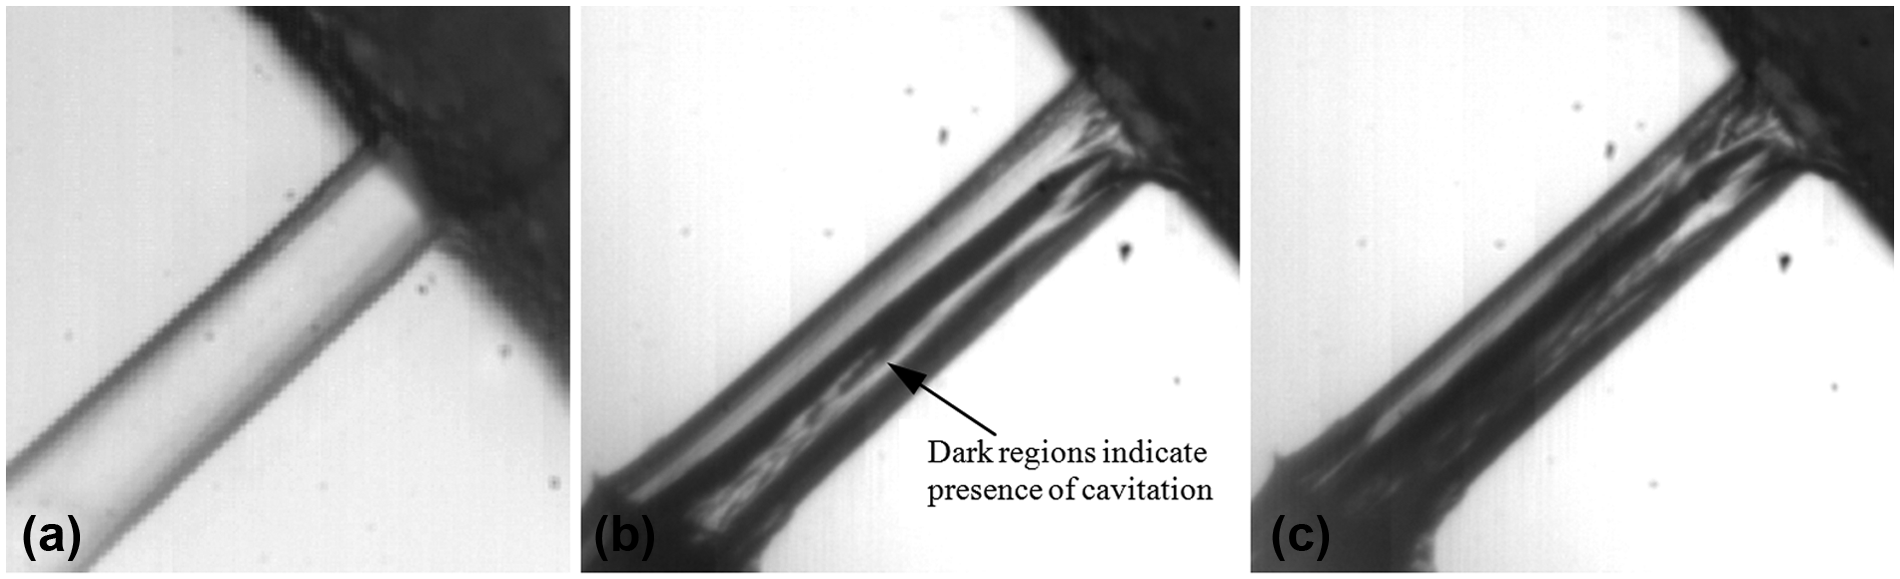
A 0.2 mm nozzle hole, validation tests: (a) no flow, (b) 10 bar, 20 °C and (c) 40 bar, 20 °C.
The Questar microscope is not able to observe the near-nozzle spray formation at the same time as the internal nozzle flow (due to different magnification requirements, depth of field and so on) and so consideration was given to an imaging configuration, which would be able to simultaneously observe the two, with twin camera and lens set-up; a beamsplitter (half-mirror) was considered but the large aperture of the Questar QM100 makes this configuration difficult, and also the light intensity is halved and it is already difficult to get sufficient levels of light into the camera, from the extremely small in-nozzle area. It is possible to use a second camera in an opposite configuration but this would require a side-lighting arrangement.
Summary and conclusion
The current article presented the process of developing a real-size optical injector for high-pressure, high-temperature in-nozzle flow and spray imaging studies. The main steps and conclusions of this work are summarised in the following:
A typical multi-hole DISI injectors internal nozzle geometry was first analysed with optical and SEM microscope techniques to identify the exact internal configuration and dimensions. This highlighted a ‘stepped’ nozzle hole geometry with an outer hole of ∼0.45 mm in diameter and an inner hole of ∼0.2 mm in diameter.
Injected fuel mass tests of the real injector were performed with gasoline and iso-octane at 150 and 80 bar injection pressure and at 20 °C and 90 °C injector body temperature, for increasing fuel demands.
The mass flow rates were used to calculate average reference in-nozzle flow velocities. Relevant dimensionless flow numbers (Reynolds, cavitation and Weber) were calculated in order to characterise the nozzle flow conditions.
Different materials for the optical nozzle were investigated and discussed, including polymer types and glasses.
A fused silica glass prism-based nozzle design methodology was finally adopted.
Mechanical and laser drilling of the nozzle holes were analysed and compared (down to 0.2 mm in diameter).
Mechanically drilled prisms showed better surface quality than laser-drilled prisms and cost considerably less.
Mechanical drilling allows selection of fused silica material, with closer refractive index to that of most fuels.
Abrasive flow polishing of the nozzle was performed to remove imperfections from the drilling process.
Initial tests of the completed optical nozzle demonstrated successful imaging of in-nozzle cavitation and spray formation using different degrees of magnification and different conditions.
A range of fuels is to be tested for a variety of fuel temperatures and downstream pressures, with primary focus on the coupling among cavitation, flash-boiling and spray formation. Various spray regimes will also be observed and described in terms of dimensionless parameters of break-up theory, with a view to improve understanding with reference to the effect of multi-phase in-nozzle flow conditions and fast disruptive spray break-up. Quantitative information will also be obtained by batch image processing images for different fuels, for example, in-nozzle vapour volume fraction and plume penetration. Ultimately, development and application of a PIV technique for two-phase flow quantitative measurements are planned.
Footnotes
Acknowledgements
The authors gratefully acknowledge the technical support by Shell Global Solutions UK. The authors also thank Kennametal in the United States and United Kingdom (formerly, Extrude Hone) for the abrasive flow machining and also IC Optical Systems Ltd (United Kingdom) for the grinding and polishing operations.
Declaration of conflicting interests
The authors declare that there is no conflict of interest.
Funding
This work was funded and supported by the Engineering and Physical Sciences Research Council (EPSRC) and Jaguar Land Rover.