
Abstract
In addition to reducing the effectiveness of welfare policies, a high level of corruption is argued to undermine the social legitimacy of the welfare state. In the current article, we subject this hypothesis to an empirical test by analyzing data from two rounds of the International Social Survey Program. We find that people have a greater preference for an extensive welfare state in countries where corruption is more widespread. Similarly, at the micro level, perceived corruption is associated with more support for welfare policies, though people who have experienced corruption show less support than others for welfare. The extent of corruption in a country also moderates the effects of two primary determinants of welfare preferences – self-interest and political affiliation.
Introduction
The detrimental effects of corruption on the functioning of the welfare state are well known. Misallocating welfare resources from their original target reduces income redistribution, and if taken to an extreme, can increase income inequalities (Petrova, 2021). It is also argued that high levels of corruption can undermine the social legitimacy of the welfare state. In democratic societies, this legitimacy is a critical precondition for developing and maintaining generous social protection systems. In turn, these systems consume a large proportion of national economic output to finance extensive sets of welfare entitlements, such as old-age pensions, healthcare, unemployment insurance, and family benefits (Rothstein, 2021; Svallfors, 2013). It is intuitive to suggest that citizens will not be willing to pay a significant portion of their income in taxes to finance welfare if they have legitimate concerns that some of these funds will be embezzled or misused, for example, for fostering clientelist arrangements.
Convincing as this argument is, empirical evidence to substantiate it is inconclusive – so far only one study provides unequivocal support for the thesis (Svallfors, 2013). In contrast, a number of studies find no correlation between the extent of corruption and public demand for redistribution (García-Sánchez et al., 2020; Witko and Moldogaziev, 2023), while at least two studies have found that support for the welfare state is actually greater in countries with higher levels of corruption (Hauk et al., 2022; Hedegaard, 2018). The latter indicates that in addition to the push mechanism theorized by Rothstein et al. (2012) and Rothstein (2021), there may also exist a pull mechanism between corruption and public demand for welfare, but validating this link requires both further theorizing and additional empirical evidence.
In the present article, we aim to uncover the complex relationships between different aspects of corruption and support for the welfare state in a comparative cross-national perspective. More specifically, we seek to answer two overarching questions: First, do national- and individual-level perceptions of corruption reduce or increase public support for the welfare state? Second, does the extent of corruption moderate the influence of two primary determinants of support for the welfare state – self-interest and political affiliation? To answer these questions, we apply complex multilevel models to data from the 2006 and 2016 rounds (the ‘Role of Government’) of the International Social Survey Program (ISSP).
Our work contributes to important debates within the fields of corruption studies and welfare opinion research. First, we engage with the ongoing discussion on the nature of corruption and measurement of experience versus perception of corruption (Chabova, 2017; Gutmann et al., 2020). We employ three distinct measurements of corruption in the analysis: perception of corruption at the individual level and the country level, and experience of corruption. By deploying different metrics, each of which captures different facets of corruption, we aim to reach a more comprehensive understanding of how corruption, whether experienced or perceived, influences preferences concerning the role of the state in welfare provision.
Second, we contribute to the broader debate on the impact of corruption on welfare state legitimacy (Hauk et al., 2022; Hedegaard, 2018; Peyton, 2020; Rothstein, 1998, 2021; Svallfors, 2013; Witko and Moldogaziev, 2023). Our results provide robust evidence that whether the push or the pull mechanism dominates depends on the facet of corruption, with corruption experience reducing and corruption perception increasing public demand for welfare. We also provide further potential theoretical explanations behind the pull mechanism, thus contributing to the development of a more comprehensive theoretical framework in this area.
In what follows, we first review the extant literature on general determinants of public support for the welfare state, as well as studies of the link between corruption and the social legitimacy of the welfare state. Based on these insights, we formulate four hypotheses to be tested empirically. Next, we describe the data and variables and explain our methodological approach. We then present the results of the analysis. We conclude by discussing the theoretical implications of our findings and suggesting avenues for further research.
Theoretical framework
General determinants of support for the welfare state
Given the pivotal role of the welfare state in modern democracies, there is a large and systematically increasing body of research examining its social legitimacy. Multiple studies have investigated public attitudes toward various aspects of the welfare state, such as the preferred role of government in welfare provision, redistribution, social spending, the perceived effectiveness of welfare policies, their social and economic outcomes, and the welfare deservingness of beneficiaries. Not surprisingly, the general levels of support for most of these aspects tend to be high, but individual welfare attitudes are also significantly influenced by individual-level and contextual factors.
At the individual level, self-interest plays an important role in structuring welfare attitudes. People in a weaker socio-economic position (e.g. in a lower social class, having low educational qualifications, a precarious employment situation, or a low income) usually depend more on the welfare state than others. Accordingly, people in these groups have stronger preferences than others for the state’s role in welfare provision (Basna, 2023; Gugushvili and Van Oorschot, 2021; Hasenfeld and Rafferty, 1989; Roosma et al., 2014; Svallfors, 2004) and income redistribution (Dallinger, 2010; Linos, 2003). By contrast, people from better-off groups tend to be more supportive of welfare retrenchment measures, such as mandatory activation for the unemployed (Fossati, 2018; Rossetti et al., 2021), are more critical of the social, economic, and moral effects of the welfare state (Van Oorschot, 2010), and are more opposed to public welfare spending (Rehm, 2011).
Political ideology is another important source of divisions in welfare attitudes. From a left-wing perspective, the welfare state is crucial for addressing the inequalities generated by the market and for empowering disadvantaged groups. From a right-wing perspective, the welfare state rewards idleness, weakens traditional social bonds, and causes economic waste (Murray, 1998). Accordingly, people who are egalitarian and who identify as left-wing are more in favor of extensive welfare programs and income redistribution (Blekesaune and Quadagno, 2003; Gelissen, 2000; Lipsmeyer and Nordstrom, 2003; Reeskens and Van Oorschot, 2015; Svallfors, 2012). By contrast, people with meritocratic views and those identifying with the political right hold more negative views about welfare recipients (Kallio and Niemelä, 2014), consider them less deserving of public support (Gugushvili et al., 2021), oppose social spending (Svallfors, 2013), and are more concerned with the negative side effects of public welfare provision (Van Oorschot et al., 2012).
In addition to these main antecedents of welfare attitudes, existing scholarship has also examined the potential effects of some other factors. For example, a number of studies show that pro-welfare attitudes are associated with higher levels of social and political trust (Goubin and Kumlin, 2022; Habibov et al., 2018) and post-materialistic values (Gelissen, 2000; Scheepers and Grotenhuis, 2005).
The effects of contextual factors on welfare attitudes are less clear. Against expectations, the link between welfare regime type and welfare attitudes is weak at best (Bean and Papadakis, 1998; Dallinger, 2010; Gelissen, 2000; Schmidt-Catran, 2016). Country affluence can in theory influence support for the welfare state in two opposing ways. On one hand, a solid economic base makes the financing of welfare more affordable. On the other hand, absolute poverty is much lower in more affluent countries, therefore the public may perceive less need for welfare provision there. Which of the two mechanisms is more dominant is not clear, as some studies find a positive correlation between country affluence and pro-welfare attitudes (Franetovic and Castillo, 2022), others a negative correlation (Dallinger, 2010), and still others no correlation (Roosma and Van Oorschot, 2020). Intuitively, higher levels of inequality should increase public support for redistribution (Finseraas, 2009; Rueda et al., 2018; Schmidt-Catran, 2016), but the evidence does not always support this hypothesis (Franetovic and Castillo, 2022). Likewise, the link between social expenditure and pro-welfare attitudes is found to be positive in some studies (Dallinger, 2010; Finseraas, 2009; Hedegaard, 2018) but non-existent in others (Gugushvili et al., 2021; Jordan, 2013; Rueda et al., 2018).
As this brief overview shows, public attitudes toward the welfare state are substantially influenced by multiple contextual- and individual-level factors, of which self-interest and political ideology are perhaps the most robust predictors. In the following section we zoom-in on the handful of studies that have examined the interplay between corruption and welfare attitudes.
Corruption and public support for the welfare state
A well-known theory about the link between corruption and the social legitimacy of the welfare state was proposed by the Swedish sociologist Bo Rothstein (Rothstein, 1998, 2021; Rothstein et al., 2012), in which he addresses the question of why developed countries differ significantly with regard to welfare efforts. In addition to working-class mobilization (Korpi, 1980), Rothstein argues that three critical issues determine the social contract between people and the state. First, people must believe that what the welfare state offers is morally just (substantive justice); second, they must be convinced that the state will deliver what it promises in a fair and impartial way, without discriminating against or favoring any groups (procedural justice); and third, people must trust that all the members of society will contribute to the costs of welfare provision in an equitable way. By violating the principle of procedural justice, bribery, nepotism, and clientelism undermine the social legitimacy of the welfare state, as individuals are naturally opposed to paying for welfare services that they are confident will be abused. Following this logic, public support for such services should be lower in countries where corruption is more widespread.
Intuitive as this theory is, empirical evidence is mixed regarding the link between corruption perception and support for the welfare state. In a cross-national study of 27 European countries, Svallfors (2013) found that people expressed greater support for taxes and social spending when they considered health and tax authorities efficient and impartial. In addition, the perceived quality of governance also conditioned the effect of egalitarianism, in the sense that egalitarian people were more supportive of taxes and social spending when they held more positive views about the health and tax authorities. In another study encompassing 29 post-communist countries, Witko and Moldogaziev (2023) found that people who perceived less corruption among politicians and public servants were more willing to pay extra taxes to help those in need. However, people who thought that the levels of corruption have improved in the country over the past several years were less willing to make financial sacrifices for the needy. Moreover, in this study perceived corruption was unrelated to support for narrowing the gap between the rich and the poor.
Other studies fail to find a link between corruption perceptions and support for the welfare state. Using a sample of 41 countries from different parts of the world, García-Sanchéz et al. (2020) found that the country-level corruption perception (measured by Transparency International’s Corruption Perception Index (CPI)) was not related to either preferences for reducing income differences or to progressive taxation. Furthermore, in a series of experiments, Peyton (2020) did not find evidence that priming of participants by providing them with different information about integrity or corruptness of government officials and politicians had any effect on their preferences for redistributive social policies.
Moreover, two studies report a positive correlation between corruption and demand for the welfare state. In a study of 31 countries, Hedegaard (2018) found that a higher level of corruption – measured by CPI – was associated with greater support for spending on pensions, though, corruption also weakened the overall positive link between perceived government underperformance and support for extra pension spending. In another cross-national study of 18 Latin American countries, Hauk and colleagues (2022) also found a positive correlation between perceived corruption impunity and support for redistribution. Hauk and colleagues’ explanation is that corruption influences support for redistribution in two conflicting ways. First, as hypothesized by Rothstein, it reduces trust in the government, and this in turn lessens enthusiasm for publicly provided welfare (push factor). Second, a higher level of corruption also reduces the relative wealth of poorer individuals and that triggers greater support for redistribution of incomes (pull factor). In the context of Latin America – which has very high levels of wealth and income inequality – the second mechanism seems to override the first, hence the overall positive association between perceived corruption and support for redistribution.
Divergent results of the discussed studies may at least be partially due to the use of different corruption measures. Hedegaard (2018) and García-Sánchez et al. (2020) used the country-level measure – CPI, whereas other studies used individual-level perceptions of corruption impunity (Hauk et al., 2022), how widespread graft is (Hauk et al., 2022; Witko and Moldogaziev, 2023), and how impartial tax and health authorities are (Svallfors, 2013). This difference in measurement could significantly influence outcomes, as individual perceptions may be shaped by personal experiences and social context, leading to different interpretations of the effects of corruption on welfare state support. Moreover, the current literature does not adequately address the ways in which perceived and experienced corruption may operate within different contexts. Perceived corruption, which can be influenced by media representation and public discourse, may affect citizens’ trust in government and their willingness to support welfare programs. In contrast, experienced corruption typically reflects immediate interactions with public services, which may erode trust at a more personal level and influence support differently. Understanding these distinctions is crucial for forming accurate hypotheses regarding their individual and combined effects on welfare state legitimacy.
To date, no study has comprehensively tested the relationship between support for the welfare state and corruption indicators that include a blend of expert opinions, citizen perceptions, and individual experiences. This gap suggests the need for a more integrated approach in future research. By simultaneously examining how different forms of corruption influence public attitudes toward welfare state provision, scholars can better understand the mechanisms at play and validate findings across diverse contexts.
In addition, these studies have typically focused on only one or two specific aspects of the welfare state. Hauk et al. (2022) examined support for redistribution, while Hedegaard (2018) focused on attitudes toward public spending for old-age pensions and healthcare. Witko and Moldogaziev (2023) investigated support for reducing gap between the rich and the poor and the individual willingness to pay more to help people in need. García-Sánchez et al. (2020) analyzed attitudes toward government’s responsibility for reducing income differences and support for progressive taxation. Svallfors’ (2013) analysis focused on a variable measuring the desired balance between taxes and social spending. While each of these items taps into an important aspect of public welfare provision, none of them are sufficient on their own to capture the overall attitude toward a complex phenomenon like the welfare state. A comprehensive table describing the main studies on this topic, their results and variables used can be found in Table 3 in Appendix 1. To overcome this limitation, in our analysis we employ a more robust measure that is derived through several items asking about the state’s role in different spheres of welfare provision.
Hypotheses
As the existing studies suggest, corruption can have both push and pull effects on public support for the welfare state. The push effect, as proposed by Rothstein, implies that corruption erodes trust in government institutions, thereby reducing public support for welfare provision. Conversely, the pull effect implies that higher levels of corruption, particularly in contexts of high inequality, can erode the relative wealth of poorer individuals, thereby intensifying their demand for income redistribution and access to social services as they seek increased welfare support to compensate for the disadvantages imposed by corruption. Given that the pull factor has only been confirmed in a European context (Svallfors, 2013) and our sample of countries includes a more global range of countries, we expect the push factor to dominate. More specifically, our expectations are as follows:
H1. At the macro level, support for the welfare state will be greater in countries with higher levels of perceived corruption.
H2. At the micro level, perceived and experienced corruption will be associated with greater support for the welfare state.
In addition, we hypothesize that perceptions of corruption will also influence the effects of the two primary determinants of support for the welfare state – self-interest and political affiliation. In line with Svallfors (2013), we anticipate as follows:
H3. The effects of political affiliation will be stronger in countries with lower levels of corruption (cross-level interaction).
Next, following the logic of Hauk et al.’s (2022) hypothesis about low-income people rationally being more interested in redistribution in more corrupt societies, we expect as follows:
H4. The effects of self-interest will be stronger in countries with higher levels of corruption (cross-level interaction).
Methodology
Data
The analysis presented in this article is based on the data from the 2006 and 2016 rounds of the ISSP, ‘The Role of Government’. The original sample of these two waves included 43 countries, but we were forced to drop Georgia, Serbia, Taiwan, Israel, and Great Britain, as they did not collect data on political affiliation and/or perceived social status. We also dropped Venezuela in the 2016 round for the same reason. In total, our analysis includes data for 38 countries and 59 country-years and encompasses 58,132 respondents (the effective sample included in the analyses). Sample sizes in each country are provided in Table 4 in Appendix 1. Macro-level data on corruption and economic affluence was obtained from the World Bank (WB) database.
Dependent variable –welfare state support
Although attitudes toward the welfare state can be measured in a number of ways (see e.g. Roosma et al., 2013), the concept of ‘role-of-government’ has been established as the most important dimension of welfare state legitimacy (Svallfors, 2012). In the ISSP, the role of government is measured with the following battery of questions: On the whole, do you think it should or should not be the government’s responsibility to . . . a) provide a job for everyone who wants one, b) keep prices under control, c) provide health care for the sick, d) provide a decent standard of living for the old, e) provide industry with the help it needs to grow, f) provide a decent standard of living for the unemployed, g) reduce income differences between the rich and poor, h) give financial help to university students from low-income families, and i) provide decent housing for those who can’t afford it.
Responses were given on a scale from 1 to 4. We reversed these, so that 1 = definitely should not be, 2 = probably should not be, 3 = probably should be, and 4 = definitely should be. We applied confirmatory factor analysis (CFA) to derive the latent variable reflecting support for the welfare state using these nine variables. After controlling for covariance between the error terms of several pairs of variables (old age and healthcare, controlling prices and jobs for everyone, and student support and housing) the standardized loadings of variables range from 0.48 to 0.69 and the model fit indices are satisfactory (RMSEA = 0.052; CFI = 0.971; TLI = 0.957). In the analysis we use the CFA score as the dependent variable, with higher values indicating greater support for the welfare state.
Independent variables
Corruption
Corruption is notoriously difficult to measure due to its covert nature, making it challenging to capture its full extent in any given country. Consequently, corruption is primarily measured through indirect methods, using proxies such as composite indicators or surveys. Each measurement technique carries its own set of strengths and limitations, as they capture different facets of corruption (Chabova, 2017; Charron, 2015; Charron et al., 2015; Donchev and Ujhelyi, 2014; Gutmann et al., 2020; Malito, 2014; Rohwer, 2009; Rose and Peiffer, 2012).
Composite indicators, such as the CPI and the Control of Corruption (CC) index, are the most widely recognized measures of corruption. The CC is part of the Worldwide Governance Indicators (WGI) published by the World Bank and CPI is an indicator developed by Transparency International. Both indicators rely primarily on expert assessments and maintain a high level of quality. They also allow for comparisons across time and countries, offering a broad overview of corruption levels. However, this reliance on expert opinion introduces potential bias and may not fully reflect the true level of corruption, especially in countries where corruption is deeply entrenched but less visible.
Public opinion surveys, on the contrary, capture the views of the general population, thus being more representative of the entire population. These surveys can focus on both corruption perception and experience. Perception surveys measure public opinion on the prevalence of corruption, but these perceptions can be influenced by external factors such as media coverage, which may skew public opinion. Experience surveys, in contrast, measure individuals’ direct encounters with corruption, for example, when dealing with street-level bureaucrats, providing insights into the actual experiences of the population. However, these surveys often capture only specific forms of corruption, predominantly petty corruption, as the general public is typically not exposed to other forms, such as grand or political corruption.
Each of these measurement techniques – composite indicators, perception surveys, and experience surveys – illuminates different aspects of corruption. By employing a combination of these methods, researchers can obtain a more comprehensive understanding of corruption’s impact on various societal outcomes, including public support for the welfare state.
For the purposes of this article, we utilize three distinct measurements of corruption: a composite indicator and two survey variables measuring perceived and experienced corruption. This approach allows us to capture both systemic and individual-level corruption. While our study leverages multiple measures of corruption to enhance the validity of our findings, we acknowledge the limitations posed by using an undifferentiated concept of corruption. Different forms of corruption, such as petty versus grand corruption, may have varying effects on welfare state support. Currently, no corruption indicator captures these different forms and levels of corruption in a way that is comparable across countries and over time. Future research should consider these distinctions to provide more precise insights, possibly by using more nuanced data and focusing on smaller regions.
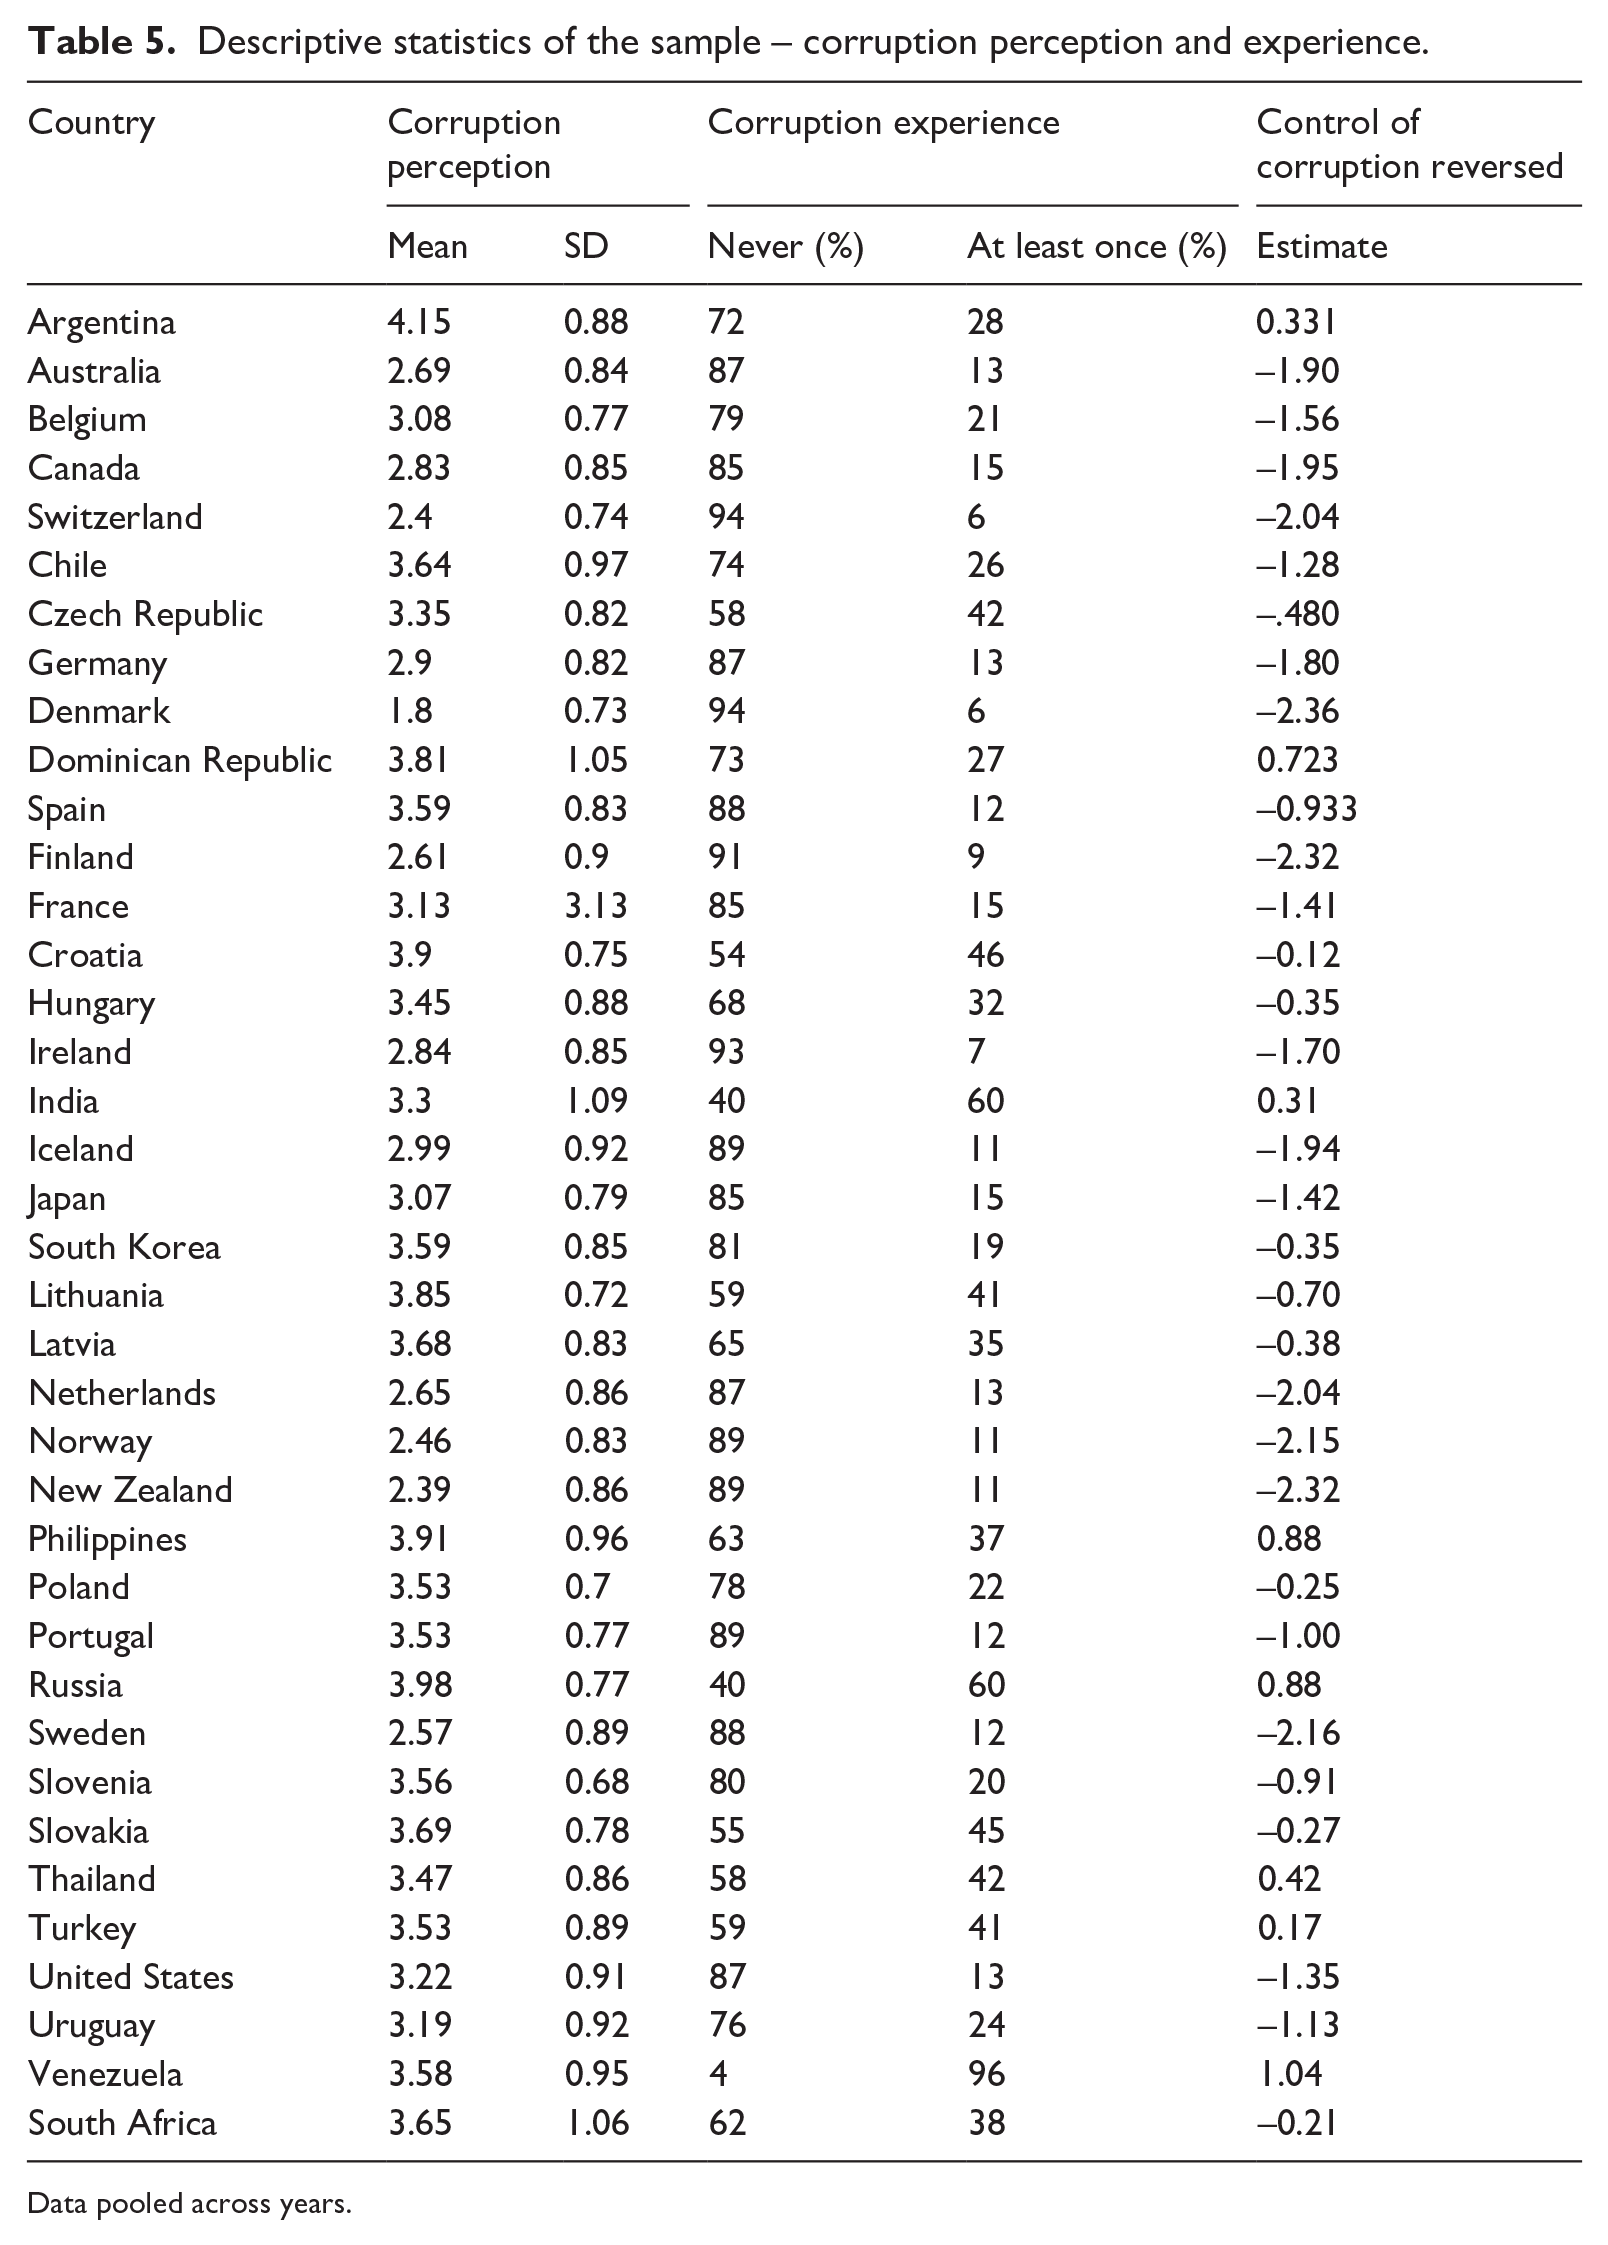
For the composite indicator, we utilize the CC, as it allows for temporal analysis better than CPI (Chabova, 2017). The CC measures countries’ success in controlling corruption, using a scale ranging from −3 to 3, with a score of 3 indicating successful control of corruption. For our analysis, we inverted the direction of the indicator to align with the ISSP corruption variable; therefore, a lower number signifies greater success in controlling corruption. Among the countries in our sample, Denmark emerges as the most successful in controlling corruption (−2.37), while Venezuela ranks as the least successful (1.04).
In addition to the CC, we also use corruption variables derived from the ISSP. The ISSP incorporates two measurements of corruption, making it a unique cross-national survey that is ideal for understanding the relationships between different measurements of corruption and support for the welfare state. Within the ISSP, three variables focus on corruption, two of which are related to perceptions and one to experience. The questions on perceptions of corruption gauge opinions about corruption among public officials and politicians, and were phrased as follows: ‘In your opinion, about how many politicians/public officials in [Country] are involved in corruption?’ The respondents provided answers on a scale from 1 to 5 (1 = almost none, 2 = a few, 3 = some, 4 = quite a lot, 5 = almost all). We used these two questions to construct a perceived corruption index (r = 0.73) at the micro and macro levels. As in the CC, Denmark has the lowest average perceived corruption rate of 1.8. At the other extreme, of all the countries in our sample, perceived corruption is the greatest in Argentina (4.15).
The question about the experience of corruption was formulated as follows: ‘In the last five years, how often have you or a member of your immediate family come across a public official who hinted they wanted, or asked for, a bribe or favor in return for a service?’ Responses were also recorded on a five-point scale (never, seldom, occasionally, quite often, very often). However, the variable for experience of corruption is heavily skewed, with the majority of respondents reporting no experience. To address this, we generated a dichotomous variable, which equals 1 if the respondent or their family had at least some experience of corruption in the 5 years prior to the survey, and 0 if not. Overall, nearly 24% of respondents had encountered requests for bribes. The lowest proportions are for Switzerland and Denmark, with 6% of respondents encountering requests for bribes, while the highest is for Venezuela, where 96% of respondents had experienced bribery.
Table 5 in Appendix 1 presents the basic descriptive statistics for the sample, including all three corruption variables.
Other independent and control variables
Political affiliation is defined based on the party the respondents voted for in the last elections. The ISSP categorizes political parties into six groups (1 = Far left; 2 = Left, center left; 3 = Center, Liberal; 4 = Right, Conservative; 5 = Far right; 6 = Other parties). In addition, we coded non-voters and respondents with no data as ‘apolitical’. As a proxy for self-interest, we use perceived social status, which is measured on a scale from 1 to 10. 1 Control variables are age, gender (1 = male, 2 = female), and educational attainment (0 = No formal qualification, 1 = Lowest formal qualification, 2 = Above lowest qualification, 3 = Upper-secondary completed, 4 = Above upper-secondary level, 5 = University degree completed). At the country level, we also use gross domestic product (GDP) per capita (adjusted in PPP terms in current international dollars from the World Bank database). For robustness checks we also utilized Gini coefficient and Human Development Index, but neither of them proved to have statistically significant effects (results available upon request).
Analytical strategy
In the analysis, we initially employ simple scatterplots and country-level correlations to provide an overview of the proposed relationships. Then we fit multilevel models. The latter is to account for the fact that the respondents are nested within countries and across time and an ordinary least squares (OLS) model is likely to provide biased estimates of standard errors (Hox et al., 2017). In addition to simple multilevel models, we also employ cross-level interactions between individual-level variables and the level of corruption in a country. For this purpose, we incorporate random slopes and intercepts (Heisig and Schaeffer, 2019; Schmidt-Catran and Fairbrother, 2016).
Results
Correlations between corruption measurements
We start the analysis by inspecting the correlations between our three measurements of corruption. Similar to Svallfors (2013), we find that the CC and the indicators derived from the ISSP correlate very strongly at the macro level (r = 0.84 for perception and r = 0.79 for experience, respectively), implying a close alignment of the views of experts and populations about the extent of corruption in a country (Figure 1). A notable outlier is Venezuela, where the general public perceives less corruption than the experts, although both perceived and experienced corruption are very high.
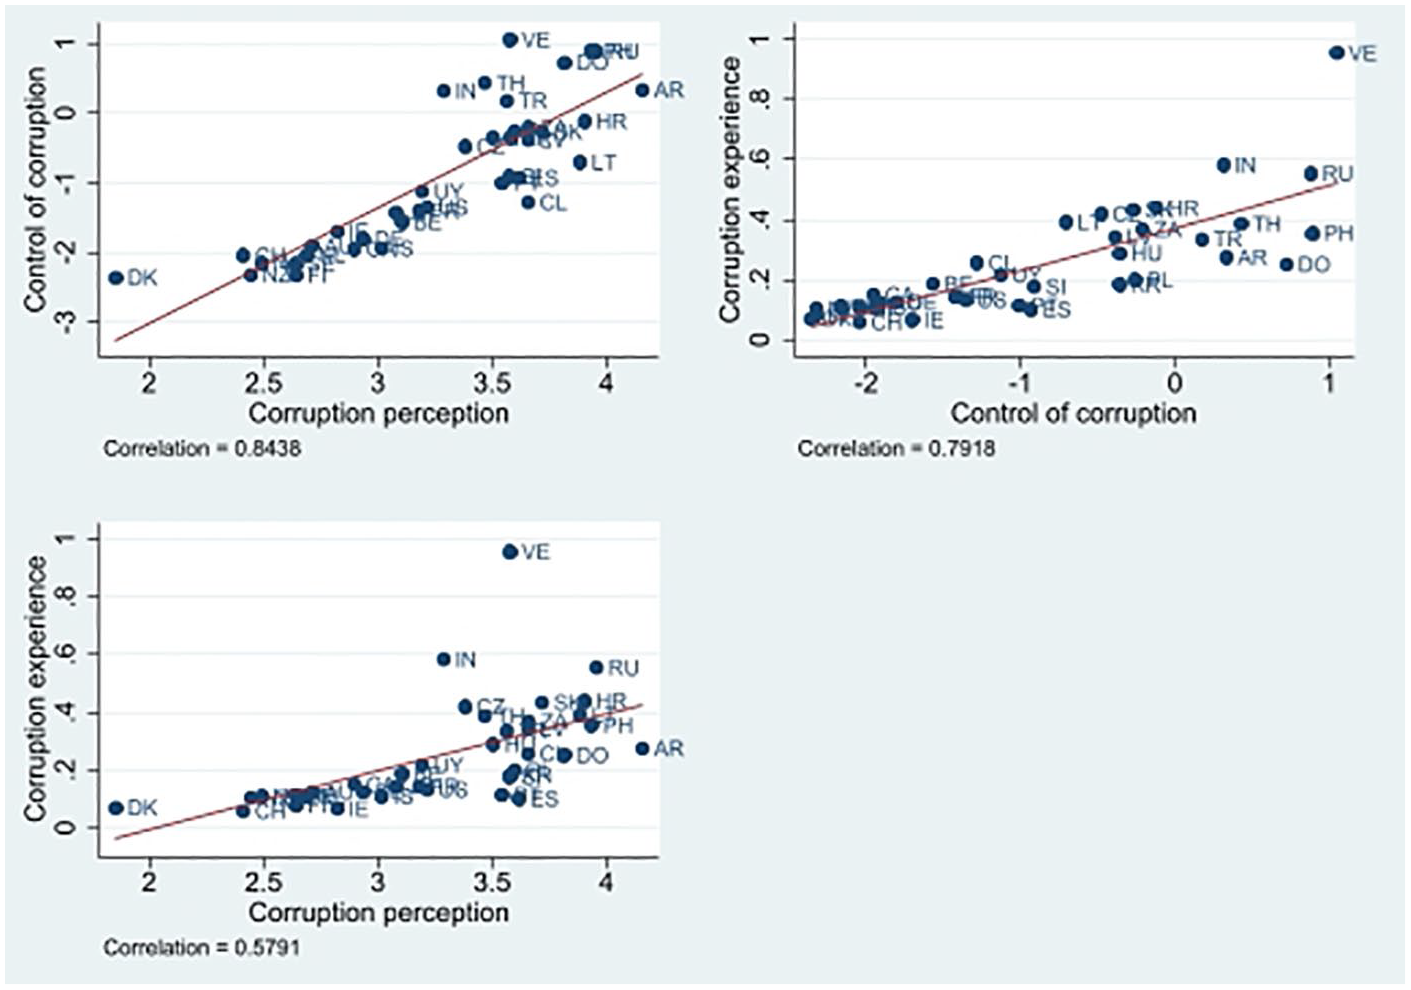
Correlations between corruption measurements.
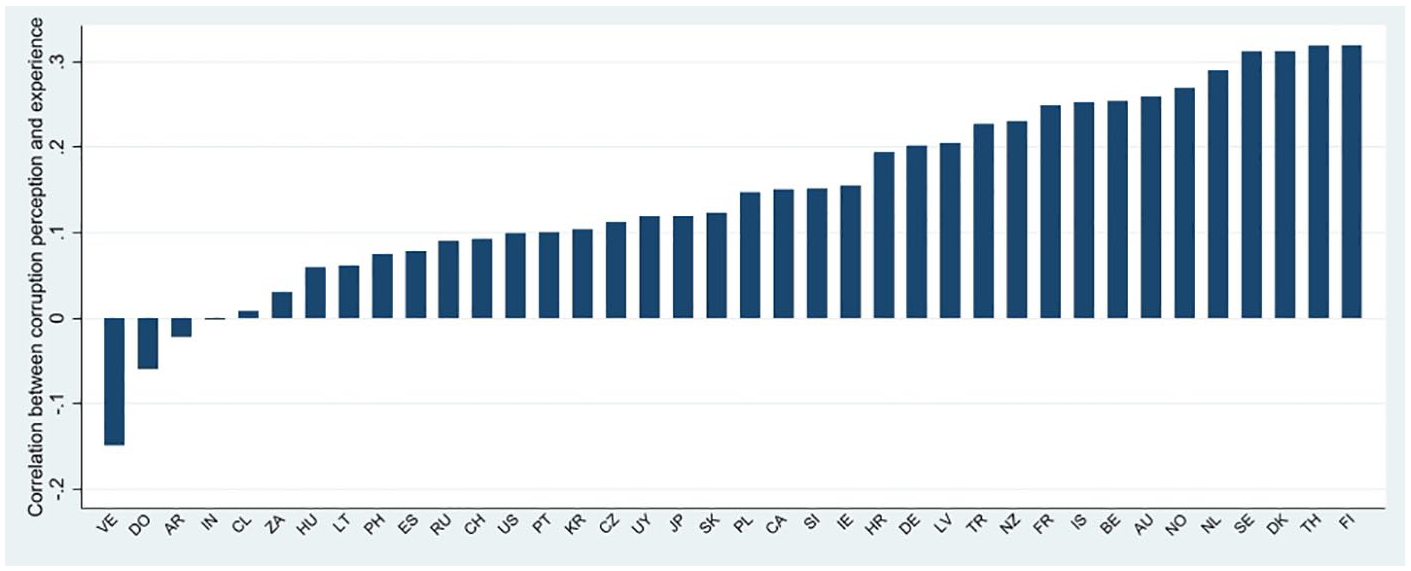
The country-level correlation between the ISSP-based measures of corruption perception and experience is not as strong as their correlation with the CC, but it is still quite high (r = 0.58). However, at the individual level, this correlation diminishes significantly (r = 0.25). Similarly, within countries, the correlation between the experience and perception of corruption is notably weak, ranging from 0.02 for the Dominican Republic to 0.32 for Sweden, Finland, and Denmark (Figure 2). Venezuela is again an outlier, displaying a negative correlation (r = −0.18), implying that counterintuitively, increased experiences of corruption correspond with decreased perceptions of its prevalence.
Strength of correlation in the ISSP between experience and perceptions of corruption.
Overall, countries with both lower perception and experience of corruption exhibit higher correlations between these two measures. This suggests that in countries where a large group of people have experienced corruption, there is also a large group of people who think that corruption is widespread, but these two groups do not necessarily overlap. This is in line with the findings from the literature on corruption, suggesting that experience of corruption does not necessary translate into the perception of a greater prevalence of corruption (Gutmann et al., 2020). There are a number of reasons for this. For example, disadvantaged individuals (such as the unemployed and those with low income) usually exhibit a greater perception of corruption. Conversely, higher income is associated with lower corruption perceptions, but only for those without direct corruption experiences. In addition, socio-demographic characteristics such as age, education, and gender influence corruption perceptions (Bauhr and Charron, 2020; Gutmann et al., 2020; Sim, 2024). Older people and those with higher education levels tend to react more strongly to corruption experiences. Women generally have higher corruption perceptions than men, although this difference diminishes with direct corruption experience. The availability of information on corruption, or the lack thereof in countries without a free press, can also influence individuals’ perception. In countries with restricted media, corruption cases may be underreported (Gutmann et al., 2020; Knack, 2007), affecting public perception. Gutmann et al. (2020) also investigated country-level differences between perception and experience indicators. They found that higher economic growth and income per capita are associated with lower perceptions of corruption, independent of actual experiences. This can be explained by increased optimism and a more favorable business environment during economic growth, leading to a downward bias in perceptions. In addition, economic inequality affects corruption perceptions; higher inequality correlates with higher perceptions of corruption, likely due to the greater prevalence of grand corruption in unequal societies and individuals’ dissatisfaction with their economic conditions. Finally, corruption perception surveys generally align with composite indices in ranking countries that are more successful in combating corruption; however, they reveal significant differences for countries facing higher corruption challenges (Cuervo-Cazurra, 2016).
The weak link between the experience and perceptions of corruption also suggests focusing only on the country level and ignoring individual-level perceptions could lead to an ecological fallacy (Fürstenberg et al., 2023) and it highlights the importance of considering both individual-level and country-level data to gain a comprehensive understanding of corruption dynamics.
Public support for the welfare state
Next, we examine the overall levels of support for the welfare state. As Figure 3 shows, there is substantial variance between countries in this respect, with the highest level reported in Venezuela (0.53) and the lowest in Japan (−0.46). Certain groupings of countries corresponding to welfare regimes can also be detected. Liberal, Anglo-Saxon welfare regime countries – New Zealand, the United States, Canada, and Australia – have low levels of support for an extensive welfare state. By contrast, support for public welfare is high in Latin American countries – Venezuela, Argentina, Chile, and Uruguay. However, the differences by levels of economic development are even more pronounced: all countries in which support for the welfare state is below the sample average (0) are affluent EU and/or OECD members, whereas above-average support is mainly observed in much poorer countries, although some of these are members of the European Union (EU), such as Croatia, Portugal, and Spain.
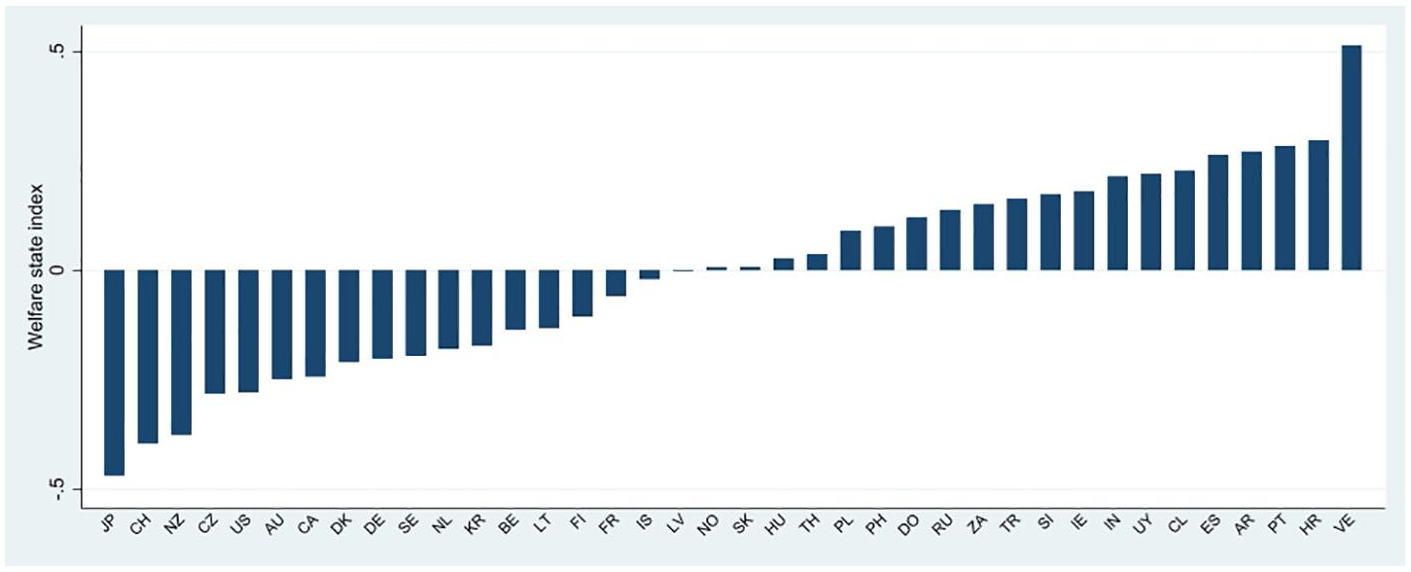
Welfare state support index.
Correlation between economic affluence and public support for welfare
To further explore the link between support for the welfare state and the level of economic development, we plot countries’ GDP per capita against the average support for the welfare state in 2006 and 2016. The correlation is negative, as expected, and strong (r = −0.57 for 2006; r = −0.67 for 2016) (Figure 4). This provides an indication that support for the welfare state may be strongly influenced by country affluence, and accordingly we need to control for this in the multilevel models.
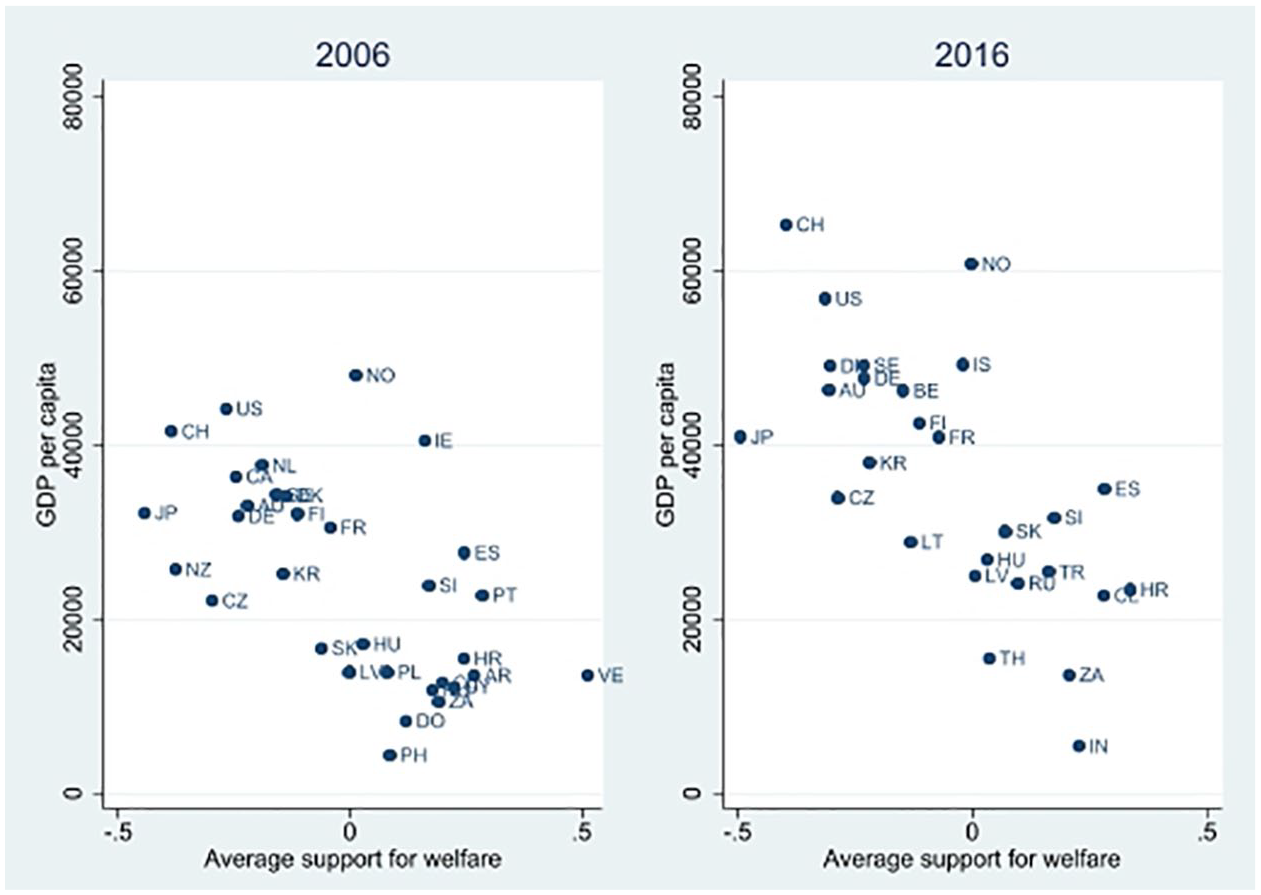
Correlation between support for welfare and country affluence.
Multilevel modeling
To test our hypotheses, we fitted several multilevel models. The empty model (model 0) yields intraclass correlations of 19.2% for the country level and 19.8% for the country-year level, justifying the use of multilevel modeling (Table 1). However, the increase of just 0.6 percentage points for the country-year level compared with just the country level shows that the variance for years is relatively low, meaning that there has not been any important development over time.
Determinants of support for the welfare state, models M0 – M3.
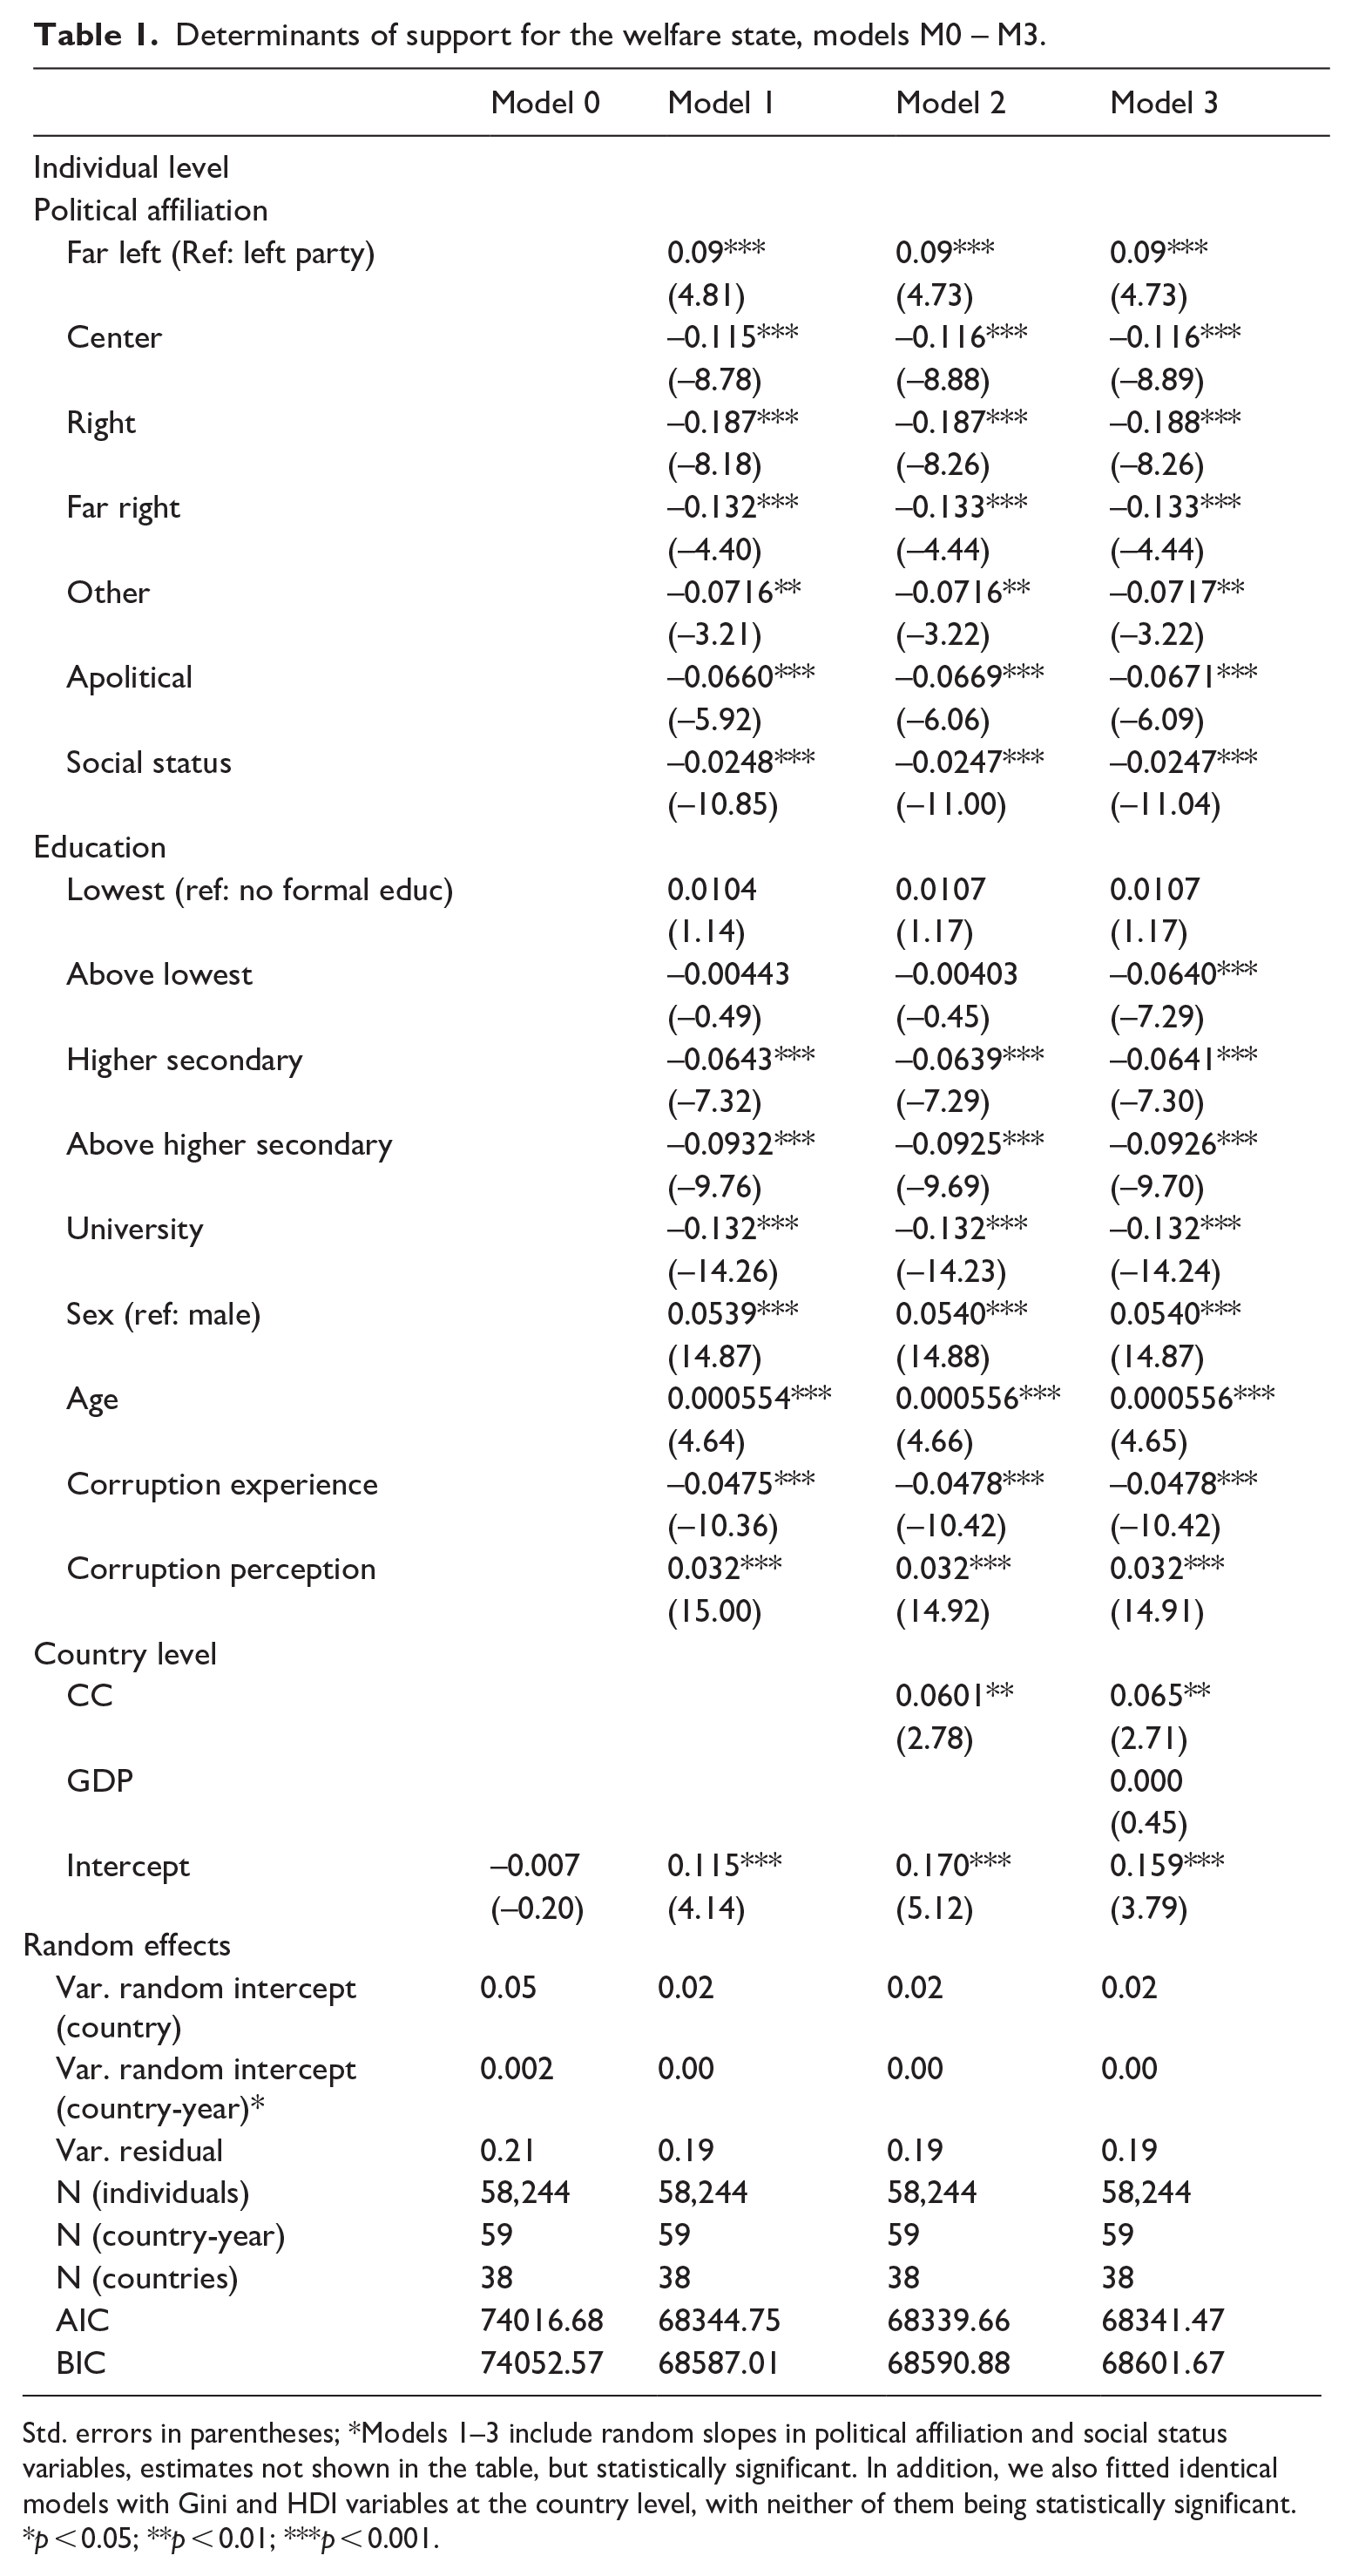
Std. errors in parentheses; *Models 1–3 include random slopes in political affiliation and social status variables, estimates not shown in the table, but statistically significant. In addition, we also fitted identical models with Gini and HDI variables at the country level, with neither of them being statistically significant.
p < 0.05; **p < 0.01; ***p < 0.001.
In Model 1 we use only individual-level predictors. Political affiliation and social status show the expected effects on the support for public welfare. Far left party voters express the greatest support for an extensive welfare state, while the strongest opposition is observed among the voters for right-wing parties. Interest in the state provision of welfare services and transfers also decreases as people move up the (perceived) social status ladder. Unexpectedly, the coefficients of the two corruption variables are in opposite directions – perceived corruption has a positive effect, while experience of corruption reduces support for welfare. Thus, H2 is only partially confirmed.
In Model 2, we introduce the CC to the model. In line with H1, higher values of CC are associated with greater support for public welfare. However, since we earlier observed a strong correlation between country affluence and the average levels of support for the welfare state, in Model 3 we simultaneously control for GDP per capita. In this case, the effect of CC remains intact, both in terms of statistical significance and magnitude, while the effect of GDP per capita appears as nonsignificant. In an alternative specification (not reported here), we used the natural log of GDP per capita, but the coefficient was again not statistically significant. This strengthens our confidence that macro-level corruption does enhance support for public welfare.
In Models 4–6 we add cross-level interaction terms to test whether the effects of political affiliation and self-interest differ at different levels of corruption in the country (Table 2). In all cases, the interaction terms are statistically significant, implying that corruption moderates the effects of political affiliation and social status. To get a better grasp of these effects, Figures 4 and 5 display the predicted levels of support for public welfare at low, medium, and high levels of corruption for people with different political affiliations and perceived social status.
Determinants of support for the welfare state, models M4–M6.
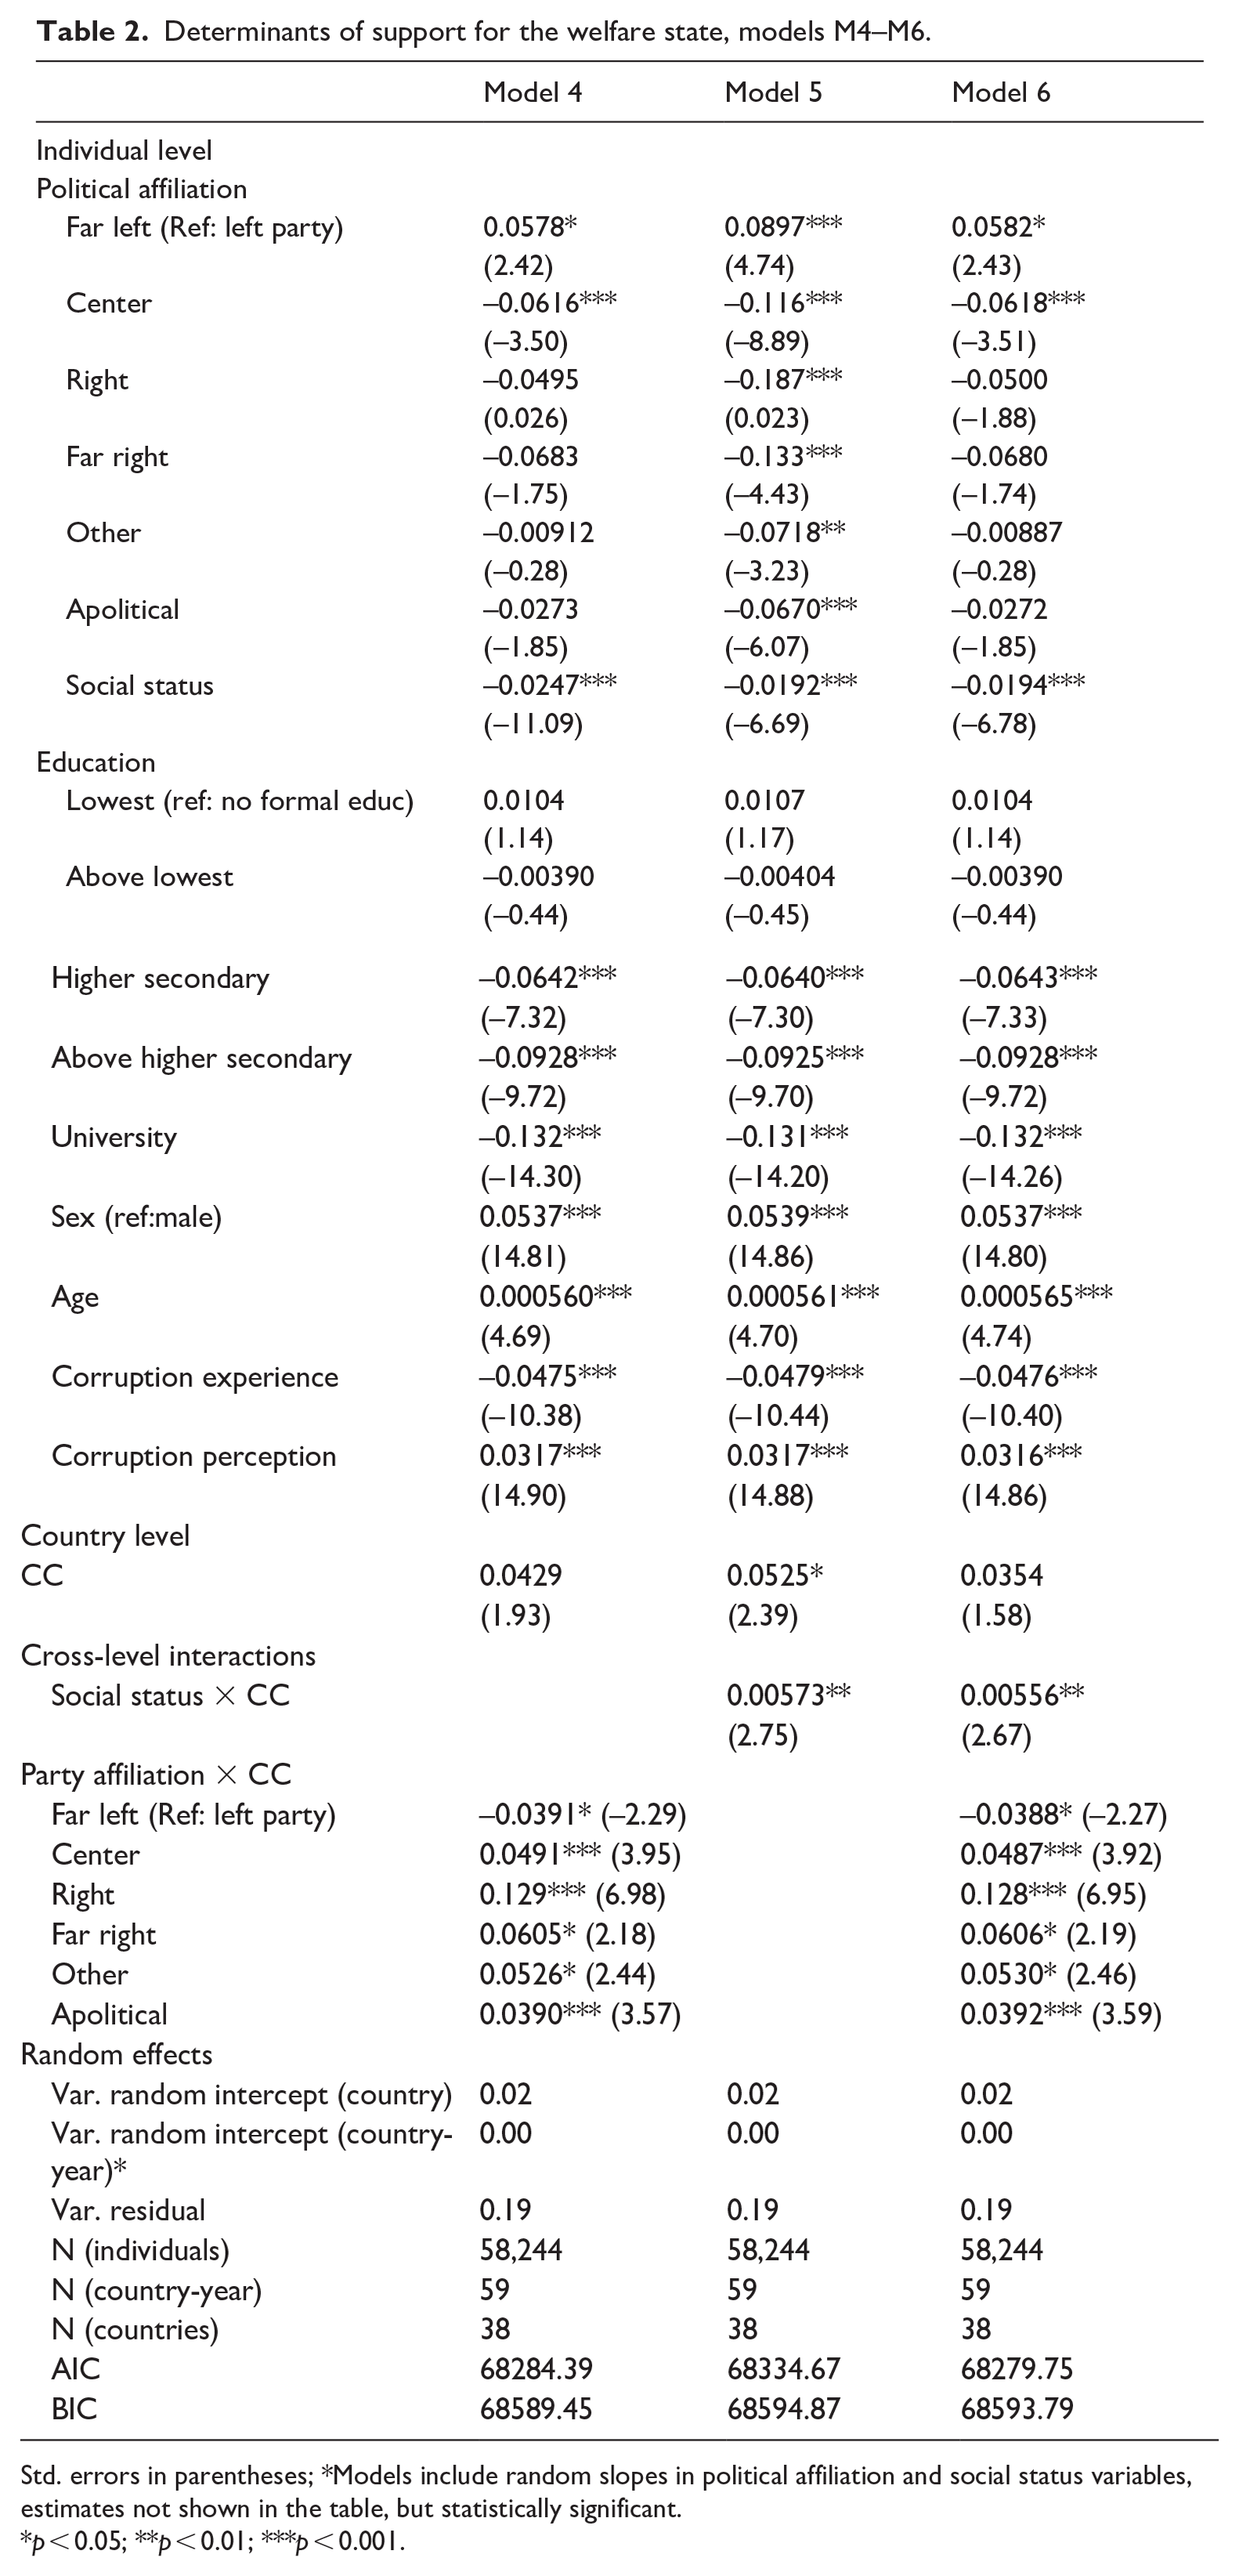
Std. errors in parentheses; *Models include random slopes in political affiliation and social status variables, estimates not shown in the table, but statistically significant.
p < 0.05; **p < 0.01; ***p < 0.001.
The results, further illustrated in Figure 5, indicate that when corruption is widespread in a country, political affiliation becomes irrelevant with regard to support for the welfare state, as there are no significant differences between various party voters in this respect. However, at the medium level of corruption, differences begin to emerge between far-left/left voters on one hand, and far-right/right voters on the other. These divisions increase further at the lowest level of corruption. Of all the groups, the far-left voters have the most stable preferences for welfare, and these preferences remain the same at any level of corruption. Notwithstanding this exception, the results provide overall support for H3, as the effects of political affiliation clearly matter in countries with medium and low levels of corruption.
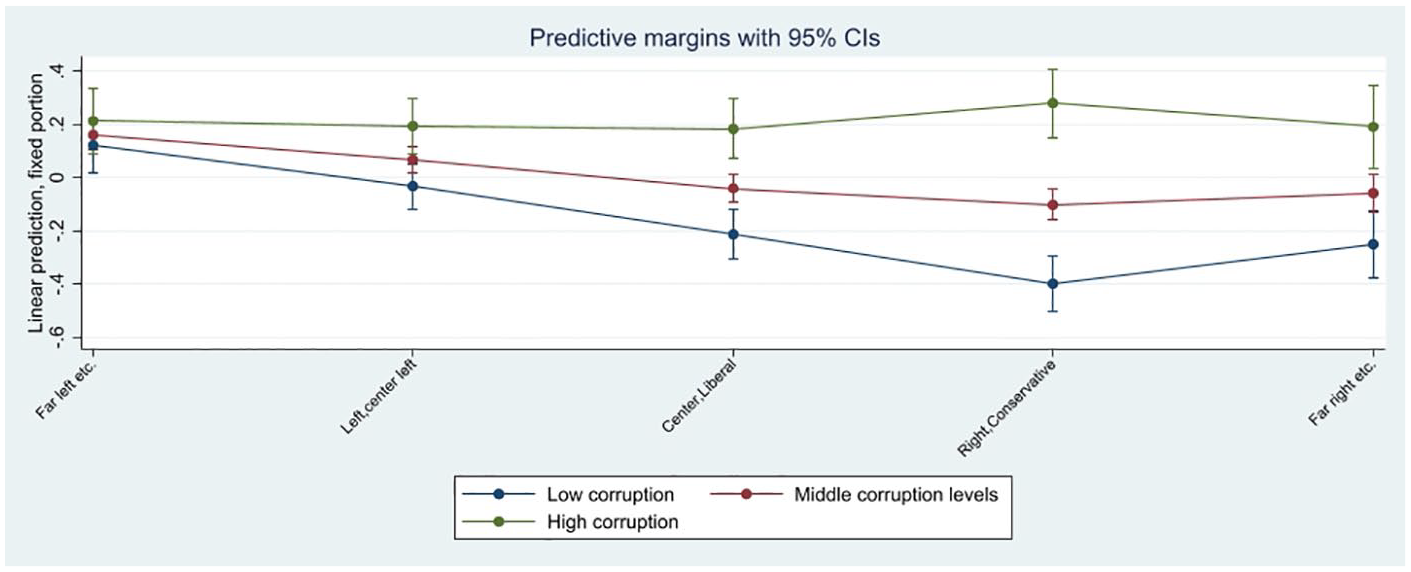
Predicted support for welfare by political affiliation at various levels of corruption.
The effects of social status also vary depending on the level of corruption in a country, as illustrated in Figure 6. When the level of corruption is high, support for public welfare is very similar among people identifying as being in different social status groups. However, as corruption control improves, differences in support start to appear between the more advantaged and the disadvantaged. Similar to the division linked to political affiliation, these gaps become more pronounced at the lowest levels of corruption. This finding contradicts our H4, as we expected the divisions in welfare support stemming from self-interest to be wider in more corrupt societies.
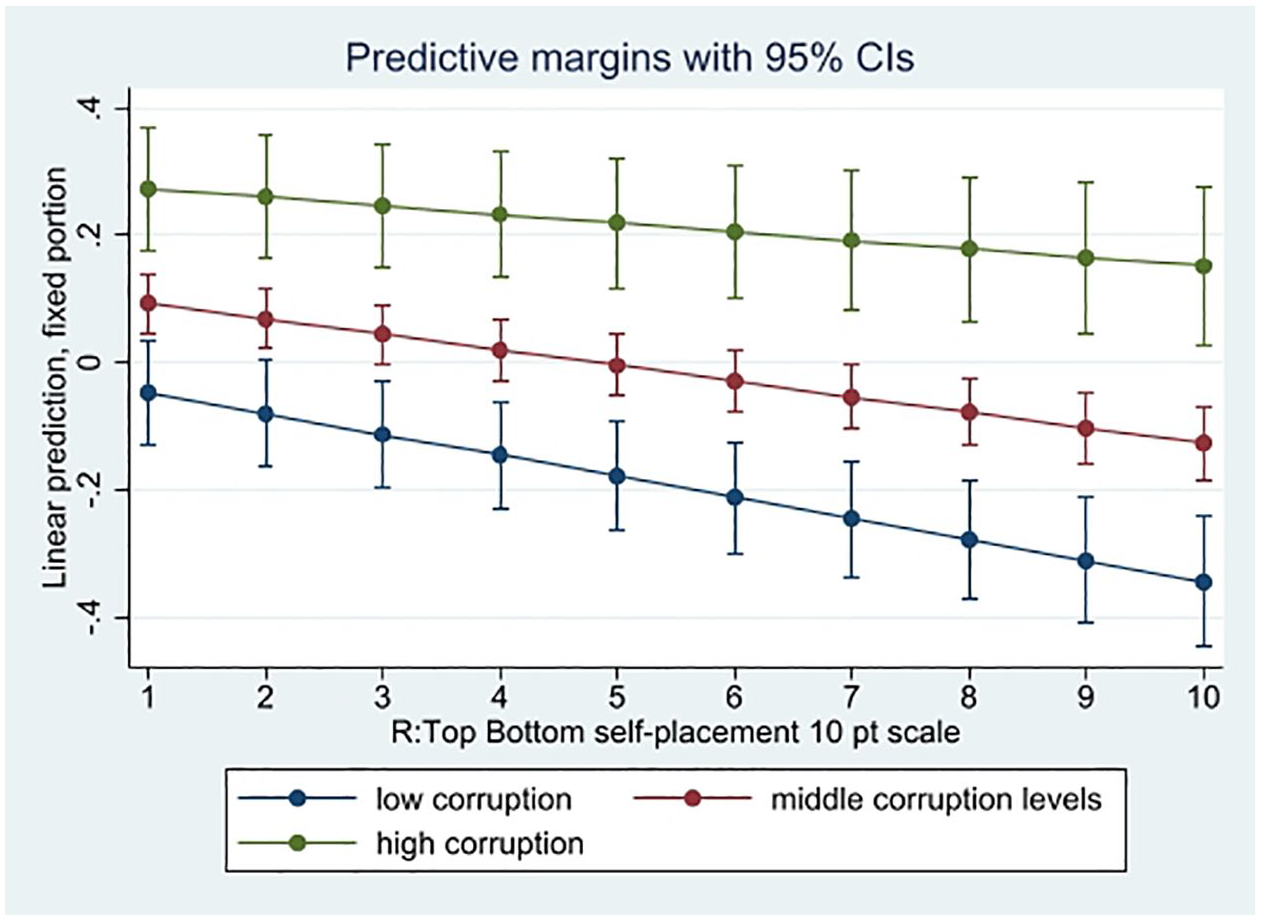
Predicted support for welfare by perceived social status at various levels of corruption.
To enhance the robustness of our analysis, we incorporated country-level averages for the ISSP corruption variables alongside the individual-level data. This dual-level approach allowed us to investigate the impact of both personal experiences and broader perceptions of corruption on public support for the welfare state, complementing the analysis based on the CC indicator. The inclusion of these group-mean variables necessitated the use of group mean-centered variables for corruption perception and experience at the individual level (Fairbrother, 2014). We then re-estimated the models using the ISSP corruption perception and experience variables at the country level. The results for the corruption perception variable mirrored those obtained with the CC indicator. The country-level corruption experience variable remained significant in models without cross-level interactions, but its significance diminished when cross-level interactions were introduced. All other variables maintained the same relationships with the dependent variable as observed in the models using the CC indicator.
Furthermore, for a robustness check, we split the sample between rich and poor countries using the WB country income group classification. However, our sample includes only eight non-high-income countries (AR, DO, IN, PH, TH, TR, VE, and ZA), which is too few for a robust multilevel analysis. Consequently, we conducted multilevel analyses for high-income countries only, and the results reported above held. For the non-high-income countries, we fitted a country fixed-effects regression model, which also supported our findings. Results of all robustness tests are available upon request.
Discussion and conclusion
Despite the potentially critical importance of clean governance for the social legitimacy of the welfare state, this link remains under-theorized and under-researched. The main theoretical framework offered by Rothstein is highly intuitive, asserting that corruption undermines the social contract by violating the procedural justice principle and thus reduces support for the welfare state. However, supporting empirical evidence for this thesis is very limited as the negative link between corruption perceptions and demand for public welfare has so far only been demonstrated in the most developed welfare states in Europe. Moreover, a recent study by Hauk et al. (2022) makes a strong case for the existence of an alternative, opposing mechanism in which widespread corruption increases the objective demand for public welfare provision, particularly among individuals with below-the-average wealth.
Our study makes a valuable contribution to the field as we confirm that the link between corruption and public support for the welfare state is much more complex than previously assumed. Our results show that whether the pull or the push mechanism dominates depends on the facet of corruption, with corruption perception increasing and bribery experience reducing demand for the state’s role in welfare provision. This highlights the need for employing multiple indicators when trying to measure the effects of a complex phenomenon such as corruption. Importantly, our results also suggest that the quality of governance is more important than the level of economic affluence in forming public demand for the welfare state and that political divisions in welfare state support are largely absent in societies with high levels of corruption.
Moreover, our study also highlights the need for further theorizing about the nature of the link between corruption and social legitimacy of the welfare state. While we do observe the pull factor, it is not immediately clear whether it is due to the mechanism proposed by Hauk et al. (2022), since we did not find people with lower social status expressing higher demand for public welfare in countries with higher perceptions of corruption. We are, however, cognizant of the limitations of using perceived social status as a proxy of objective wealth, which can deter us from detecting the proposed link. Nevertheless, we do propose two additional (or alternative) theoretical mechanisms behind the pull factor.
First, it may be that the perception of widespread corruption generates a feeling of insecurity for the majority of the population, leading to increased support for a robust welfare state as a safeguard against unreliable informal networks. Consequently, people may feel that a comprehensive welfare state can address these insecurities (even if some of the funds will be misappropriated along the way) and secure at least some access to critical welfare services, such as healthcare or unemployment support. To test this hypothesis, future studies should explore the links between access to welfare services, perceptions of corruption, feelings of insecurity, and the support for public welfare provision.
Second, it is also possible that for people who perceive that there is a widespread corruption, the welfare state addresses the double injustice of market and personal connections-based inequalities. This in turn results in a greater need for public provision compared with those who are only concerned about market-based inequalities. Qualitative studies, including in-depth interviews and focus groups, may be particularly effective for testing the validity of this mechanism.
In conclusion, our findings advance our understanding of the relationship between corruption and support for the welfare state. We also invite future research to test the robustness of our findings with alternative measures of corruption and the welfare state. Our study also stresses the need for further theoretical development and empirical investigation to fully grasp the dynamics at play and to inform policymaking aimed at enhancing the social legitimacy of welfare states in both developed and developing contexts.
Footnotes
Appendix 1
Descriptive statistics of the sample – corruption perception and experience.
| Country | Corruption perception | Corruption experience | Control of corruption reversed | ||
|---|---|---|---|---|---|
| Mean | SD | Never (%) | At least once (%) | Estimate | |
| Argentina | 4.15 | 0.88 | 72 | 28 | 0.331 |
| Australia | 2.69 | 0.84 | 87 | 13 | –1.90 |
| Belgium | 3.08 | 0.77 | 79 | 21 | –1.56 |
| Canada | 2.83 | 0.85 | 85 | 15 | –1.95 |
| Switzerland | 2.4 | 0.74 | 94 | 6 | –2.04 |
| Chile | 3.64 | 0.97 | 74 | 26 | –1.28 |
| Czech Republic | 3.35 | 0.82 | 58 | 42 | –.480 |
| Germany | 2.9 | 0.82 | 87 | 13 | –1.80 |
| Denmark | 1.8 | 0.73 | 94 | 6 | –2.36 |
| Dominican Republic | 3.81 | 1.05 | 73 | 27 | 0.723 |
| Spain | 3.59 | 0.83 | 88 | 12 | –0.933 |
| Finland | 2.61 | 0.9 | 91 | 9 | –2.32 |
| France | 3.13 | 3.13 | 85 | 15 | –1.41 |
| Croatia | 3.9 | 0.75 | 54 | 46 | –0.12 |
| Hungary | 3.45 | 0.88 | 68 | 32 | –0.35 |
| Ireland | 2.84 | 0.85 | 93 | 7 | –1.70 |
| India | 3.3 | 1.09 | 40 | 60 | 0.31 |
| Iceland | 2.99 | 0.92 | 89 | 11 | –1.94 |
| Japan | 3.07 | 0.79 | 85 | 15 | –1.42 |
| South Korea | 3.59 | 0.85 | 81 | 19 | –0.35 |
| Lithuania | 3.85 | 0.72 | 59 | 41 | –0.70 |
| Latvia | 3.68 | 0.83 | 65 | 35 | –0.38 |
| Netherlands | 2.65 | 0.86 | 87 | 13 | –2.04 |
| Norway | 2.46 | 0.83 | 89 | 11 | –2.15 |
| New Zealand | 2.39 | 0.86 | 89 | 11 | –2.32 |
| Philippines | 3.91 | 0.96 | 63 | 37 | 0.88 |
| Poland | 3.53 | 0.7 | 78 | 22 | –0.25 |
| Portugal | 3.53 | 0.77 | 89 | 12 | –1.00 |
| Russia | 3.98 | 0.77 | 40 | 60 | 0.88 |
| Sweden | 2.57 | 0.89 | 88 | 12 | –2.16 |
| Slovenia | 3.56 | 0.68 | 80 | 20 | –0.91 |
| Slovakia | 3.69 | 0.78 | 55 | 45 | –0.27 |
| Thailand | 3.47 | 0.86 | 58 | 42 | 0.42 |
| Turkey | 3.53 | 0.89 | 59 | 41 | 0.17 |
| United States | 3.22 | 0.91 | 87 | 13 | –1.35 |
| Uruguay | 3.19 | 0.92 | 76 | 24 | –1.13 |
| Venezuela | 3.58 | 0.95 | 4 | 96 | 1.04 |
| South Africa | 3.65 | 1.06 | 62 | 38 | –0.21 |
Data pooled across years.
Funding
The author(s) disclosed receipt of the following financial support for the research, authorship, and/or publication of this article: The article was published with institutional support RVO: 68378025 - Czech Academy of Sciences, Institute of Sociology, project number MSM300282001.